major ion chemistry of soil solution of mountainous soils, alvand, hamedan, western iran
TRANSCRIPT
This article was downloaded by: [RMIT University]On: 05 September 2013, At: 13:39Publisher: Taylor & FrancisInforma Ltd Registered in England and Wales Registered Number: 1072954 Registeredoffice: Mortimer House, 37-41 Mortimer Street, London W1T 3JH, UK
Soil and Sediment Contamination: AnInternational JournalPublication details, including instructions for authors andsubscription information:http://www.tandfonline.com/loi/bssc20
Major Ion Chemistry of Soil Solution ofMountainous Soils, Alvand, Hamedan,Western IranMohsen Jalali aa Department of Soil Science, College of Agriculture, Bu-Ali SinaUniversity, Hamedan, IranPublished online: 14 Jul 2011.
To cite this article: Mohsen Jalali (2011) Major Ion Chemistry of Soil Solution of Mountainous Soils,Alvand, Hamedan, Western Iran, Soil and Sediment Contamination: An International Journal, 20:5,493-508, DOI: 10.1080/15320383.2011.587040
To link to this article: http://dx.doi.org/10.1080/15320383.2011.587040
PLEASE SCROLL DOWN FOR ARTICLE
Taylor & Francis makes every effort to ensure the accuracy of all the information (the“Content”) contained in the publications on our platform. However, Taylor & Francis,our agents, and our licensors make no representations or warranties whatsoever as tothe accuracy, completeness, or suitability for any purpose of the Content. Any opinionsand views expressed in this publication are the opinions and views of the authors,and are not the views of or endorsed by Taylor & Francis. The accuracy of the Contentshould not be relied upon and should be independently verified with primary sourcesof information. Taylor and Francis shall not be liable for any losses, actions, claims,proceedings, demands, costs, expenses, damages, and other liabilities whatsoever orhowsoever caused arising directly or indirectly in connection with, in relation to or arisingout of the use of the Content.
This article may be used for research, teaching, and private study purposes. Anysubstantial or systematic reproduction, redistribution, reselling, loan, sub-licensing,systematic supply, or distribution in any form to anyone is expressly forbidden. Terms &Conditions of access and use can be found at http://www.tandfonline.com/page/terms-and-conditions
Soil and Sediment Contamination, 20:493–508, 2011Copyright © Taylor & Francis Group, LLCISSN: 1532-0383 print / 1549-7887 onlineDOI: 10.1080/15320383.2011.587040
Major Ion Chemistry of Soil Solution ofMountainous Soils, Alvand, Hamedan, Western Iran
MOHSEN JALALI
Department of Soil Science, College of Agriculture, Bu-Ali Sina University,Hamedan, Iran
Soil solution chemistry reflects the most dynamic processes occurring in soils and isresponsible for their current status. This study was undertaken to determine the soilsolution status in 25 mountainous soils. The major cations in the studied soil solutionsare in the decreasing order of Ca2+ > Mg2+ > Na+ > K+. The anions are also arrangedin decreasing order as HCO−
3 > Cl− > NO−3 > SO2−
4 . Concentrations of NO−3 , P, and
K+ in soil solutions were in the range of 12–364 mg l−1, 1.75–34.8 mg l−1, and 0.78–198 mg l−1, respectively. Results suggest that the concentration of P in the soil solutionscould be primarily controlled by of the solubility of octacalcium phosphate and ß-tricalcium phosphate. In general, the greater the dissolved P concentration in the soilsolution, the closer the solution was to equilibrium with respect to the more solubleCa2+ phosphate minerals. Surface soil accumulations of P, NO−
3 , and K+ have occurredin these soils to such an extent that loss of these nutrients in surface runoff and the highrisk for nutrient transfer into groundwater in concentrations exceeding the groundwaterquality standard has become a priority management concern.
Keywords Soil solution, nitrate, phosphorous, calcareous soil
1. Introduction
The chemical characterization of pore water solutes provides a better understanding ofwater-mineral and water-mineral surface interactions and documents the extent to whicha specific reaction may occur (Bottcher et al., 1997). These processes are important tosoil science, hydrogeology, mineralogy, and environmental engineering. The monitoringof the soil solution is one of the important tools for sustainable development and providesimportant information for pedogenic processes (Ugolini and Sletten, 1991; Kalbitz et al.,2000; Van Hees et al., 2001). It also influences groundwater and surface water (Lal andStewart, 1994; Boudot et al., 2000; Markenitz et al., 2001).
A soil solution is a dynamic and mobile system acting as a chemically reacting system(Wolt, 1994; Weng et al., 2001). The parameters of the liquid phase reflect the mostdynamic processes occurring in soils and are responsible for their current status (Malininaet al., 2007). Thus, the soil solution reflects the processes controlled by mineral equilibria,cation exchange, sorption/desorption reactions, and complexation with organic matter thatis associated with aqueous phase processes (McBride, 1994). Complex processes controlchemical composition of soil solution, which typically has a large range of chemical
Address correspondence to Mohsen Jalali, Department of Soil Science, College of Agriculture,Bu-Ali Sina University, Hamedan, Iran. E-mail: [email protected]
493
Dow
nloa
ded
by [
RM
IT U
nive
rsity
] at
13:
39 0
5 Se
ptem
ber
2013

494 M. Jalali
composition. The composition of soil solution depends not only on natural factors, suchas composition of precipitation, geological structure and mineralogy of the watersheds andaquifers, geological processes within the aquifer (Andre et al., 2005), but also on humanactivities, which can alter these fragile groundwater systems (Chen et al., 2007), eitherby polluting them or by changing the hydrological cycle (Helena et al., 2000). Althoughspecific processes controlling the chemical fate in the soil system are not always evident,the net effect of various interacting soil processes are reflected in the concentrations ofchemicals of interest in a soil solution at any point in time (Wolt, 1994).
Intense agricultural and husbandry have placed a high demand on soil and groundwaterresources in arid and semi-arid regions and also placed these resources at greater risk ofcontamination (Jalali, 2006). This study concerns the chemistry of soil solution acquiredfrom mountainous soils located in the Alvand mountain in the south of Hamedan, westernIran.
2. Material and Methods
2.1 Study Area, Soil Sampling, and Analysis
Iran is one of the world’s most mountainous countries. Its mountains have helped to shapeboth the political and economic history of the country for several centuries. Alvand is amountain chain in Hamedan, western Iran, and lies between longitudes 47◦14′28′′E andlatitudes 34◦12′58′′N. It belongs to the pro-Zagros mountain range with a summit of 3570 m.Basement rocks in the area consist mainly of intrusive rocks (granite-granodiorite, hoenfelsand hornfels schist, diorite, limestone, partly crystallized, and interbedded with slate).
Of special importance is the animal husbandry in the Alvand. The tribally organizedgroups practiced transhumance, moving with their herds of sheep and goats between tradi-tionally established summer and winter pastures. The land serves as stubble pasture, thusreceiving a natural manuring.
Pasture and rangeland, in terms of spatial distribution, represent the most commonform of land use; animal husbandry is carried out by the tribal population. Areas of animalhusbandry cover horizontally as well as vertically. Here grazing occurs not only on slopestoo steep for agriculture but even more in those parts which, due to long snow cover or ashort vegetation period, can not otherwise be used. The vegetation cover along the studysites is dominated by annual and perennial plants, where the most common are Astragalusspp., Stipa barbata Desf, Euphorbia Aellenii Rech. F., Acantholimon Festucaceum Boiss.,Phlomis orientalis Mill.
To evaluate soil solution composition, 25 surface soil samples were collected frommountainous pasture of Alvand. The samples were collected from different parts of thestudied area to represent the area. The soil samples were air-dried and passed througha 2-mm sieve for laboratory experiments. Soil pH and electrical conductivity (EC) weremeasured in H2O using a 1:5 soil to solution ratio, after the soil suspension had beenequilibrated at 25±◦C for 1 h on a shaker. Particle-size distribution was determined bythe hydrometer method. Organic matter (OM) was determined by dichromate oxidation(Rowell, 1994). Calcium carbonate equivalent (CCE) was determined by neutralizationwith HCl, cation exchange capacity (CEC) by replacing exchangeable catios by NaOAc,and exchanging Na+ with NH4OAc (Rowell, 1994).
Dow
nloa
ded
by [
RM
IT U
nive
rsity
] at
13:
39 0
5 Se
ptem
ber
2013

Soil Solution Chemistry in Mountainous Soils 495
2.2 Soil Solution
Numerous in situ and laboratory methods have been employed over the years (Wolt, 1994).Among them soil column has become increasingly important (Wolt, 1994; Sun et al., 2000;Silveira et al., 2006; Gonzalez et al., 2007; Peregrina et al., 2007). Thus, the soil solutionwas obtained by displacement with deionized water from columns packed with the selectedsoil samples (Wolt, 1994). The leaching columns consisted of Pyrex tubes of 30 cm lengthand an internal diameter of 4.8 cm. The soils (air-dried, sieved) were seated at a heightof 20 cm by uniform tapping with a wooden rod to achieve a uniform bulk density in therange of 1.1–1.70 g cm−3, which is within the range for the bulk density of the sampledsoil in the undisturbed soil. A Whatman No. 42 filter paper and a piece of nylon mesh wereplaced at the bottom of the leaching column. A filter paper was placed on the soil surfaceto minimize soil disturbance from the addition of leaching solution. Distilled water is usedto represent the relatively low-salinity water sourced from rainfall or snowmelt in arid andsemi-arid regions (Al-Wabel et al., 2002; Rowell, 1994).
Once field moisture capacity was attained, the samples were allowed to stand for 24 h.Equal amounts of (80 mm or 144 ml) deionized water were added at the upper end of thecolumn and the effluents from the columns displaced at atmospheric pressure were collectedand stored in polyethylene containers, adequately labeled and preserved in the refrigeratoruntil they were taken to the laboratory for measurement. The added water corresponds toa quarter year of precipitation (rain) in the study area (Hamedan, western Iran). The studywas conducted with two replicates at room temperature (22–24◦C). Two replicates wereselected for each soil due to the low variability between them.
Samples were analyzed in the laboratory for the major ions employing standard meth-ods. The pH and EC were measured using pH and electrical conductivity meters, re-spectively. Calcium (Ca2+) and magnesium (Mg2+) were determined titrimetrically usingstandard EDTA (Rowell, 1994). Chloride was determined by standard AgNO3 titration.Bicarbonate (HCO−
3 ) was determined by titration with HCl. Sodium (Na+) and potassium(K+) were measured by flame photometry, sulfate (SO2−
4 ) by spectrophotometric turbidime-try, and NO−
3 by colorimetry with an UV-visible spectrophotometer (Rowell, 1994). Soilsolution analysis for phosphorous (P) was carried out by the Murphy and Riley (1962)method.
Care was taken that the HCO−3 , Ca2+, and pH were analyzed within 12 h of sampling.
Total dissolved solids (TDS) were computed by multiplying the EC (dS m−1) by a factorof 640. The analytical precision for the measurements of ions was determined by the ionicbalances, calculated as 100× (cations − anions)/(cations + anions), which is generallywithin ±7%.
2.3 Data Processing
The statistical software package MINITAB (version 13.1, Minitab Inc.) was employedfor data analysis. Ion speciation and ionic strenght in soil solutions were calculated usingthe computer program MINTEQA2. Saturation indices (SI) for all the samples were alsocalculated with MINTEQA2, using calcite as an example:
SIcalcite = log
{Ca2+}{
CO2−3
}
Ksp,calcite
Dow
nloa
ded
by [
RM
IT U
nive
rsity
] at
13:
39 0
5 Se
ptem
ber
2013
496 M. Jalali
where {Ca2+} and {CO2−3 } are the activities in aqueous solution and Ksp,calcite is the
solubility product for calcite. The Pearson correlation matrix was computed and the criterionvalues of probabilities (P < 0.05 and P < 0.01) for correlation significance are used.
3. Results and Discussion
3.1 Soil Properties
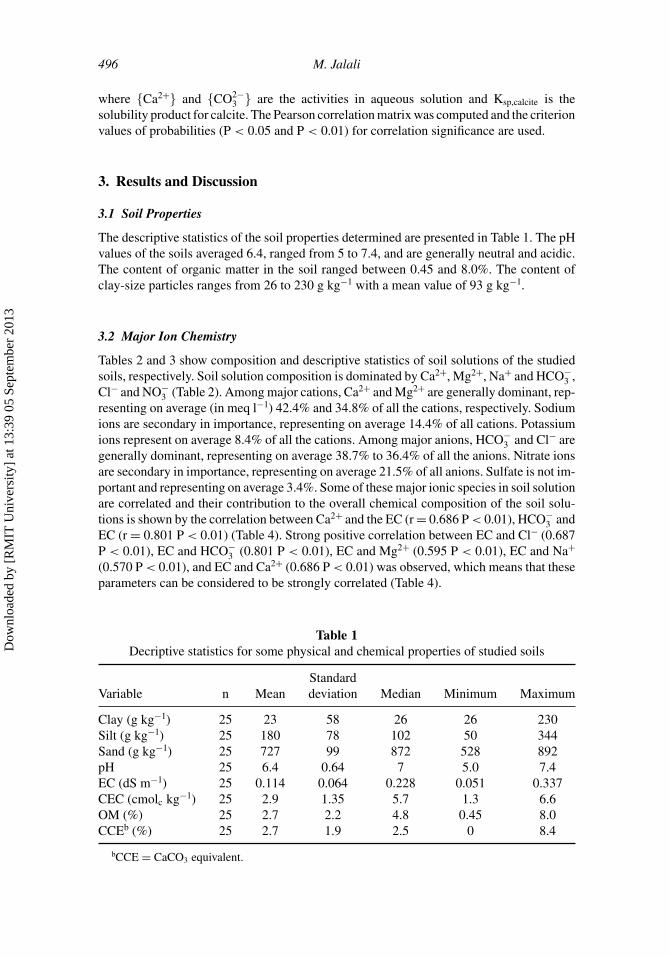
The descriptive statistics of the soil properties determined are presented in Table 1. The pHvalues of the soils averaged 6.4, ranged from 5 to 7.4, and are generally neutral and acidic.The content of organic matter in the soil ranged between 0.45 and 8.0%. The content ofclay-size particles ranges from 26 to 230 g kg−1 with a mean value of 93 g kg−1.
3.2 Major Ion Chemistry
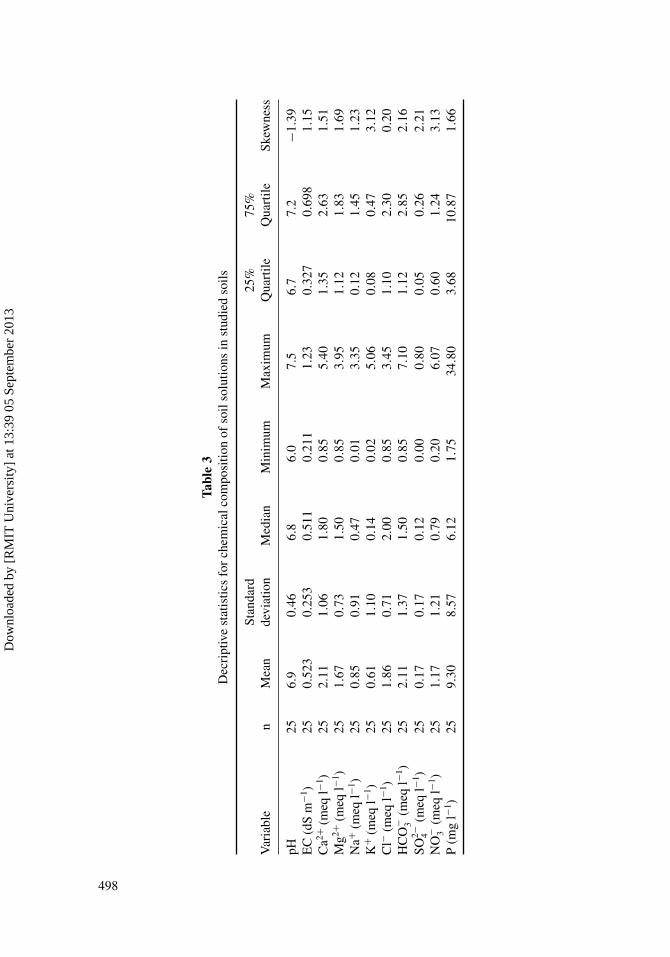
Tables 2 and 3 show composition and descriptive statistics of soil solutions of the studiedsoils, respectively. Soil solution composition is dominated by Ca2+, Mg2+, Na+ and HCO−
3 ,Cl− and NO−
3 (Table 2). Among major cations, Ca2+ and Mg2+ are generally dominant, rep-resenting on average (in meq l−1) 42.4% and 34.8% of all the cations, respectively. Sodiumions are secondary in importance, representing on average 14.4% of all cations. Potassiumions represent on average 8.4% of all the cations. Among major anions, HCO−
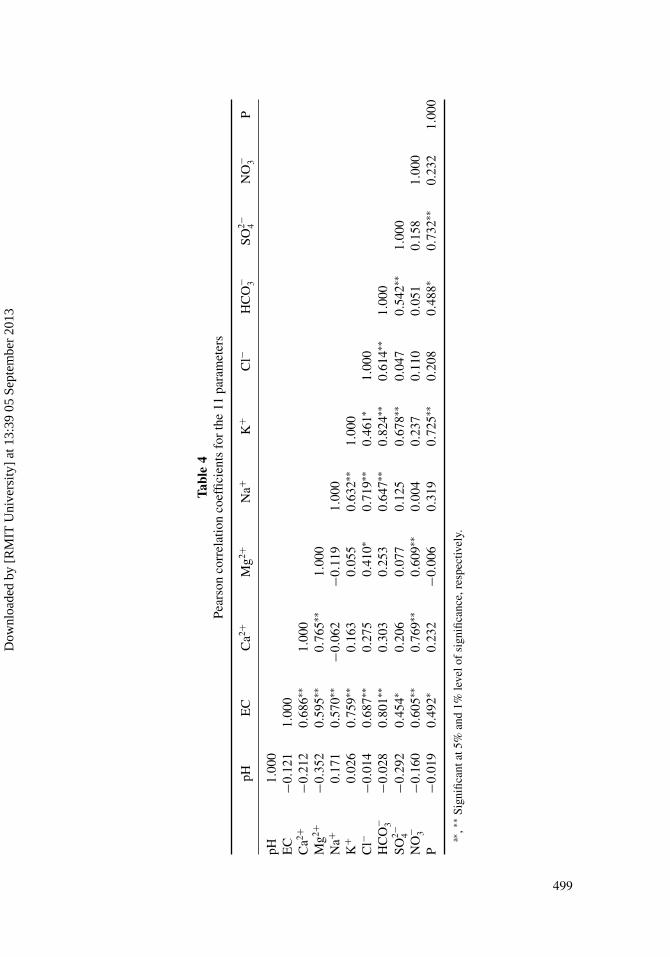
3 and Cl− aregenerally dominant, representing on average 38.7% to 36.4% of all the anions. Nitrate ionsare secondary in importance, representing on average 21.5% of all anions. Sulfate is not im-portant and representing on average 3.4%. Some of these major ionic species in soil solutionare correlated and their contribution to the overall chemical composition of the soil solu-tions is shown by the correlation between Ca2+ and the EC (r = 0.686 P < 0.01), HCO−
3 andEC (r = 0.801 P < 0.01) (Table 4). Strong positive correlation between EC and Cl− (0.687P < 0.01), EC and HCO−
3 (0.801 P < 0.01), EC and Mg2+ (0.595 P < 0.01), EC and Na+
(0.570 P < 0.01), and EC and Ca2+ (0.686 P < 0.01) was observed, which means that theseparameters can be considered to be strongly correlated (Table 4).
Table 1Decriptive statistics for some physical and chemical properties of studied soils
StandardVariable n Mean deviation Median Minimum Maximum
Clay (g kg−1) 25 23 58 26 26 230Silt (g kg−1) 25 180 78 102 50 344Sand (g kg−1) 25 727 99 872 528 892pH 25 6.4 0.64 7 5.0 7.4EC (dS m−1) 25 0.114 0.064 0.228 0.051 0.337CEC (cmolc kg−1) 25 2.9 1.35 5.7 1.3 6.6OM (%) 25 2.7 2.2 4.8 0.45 8.0CCEb (%) 25 2.7 1.9 2.5 0 8.4
bCCE = CaCO3 equivalent.
Dow
nloa
ded
by [
RM
IT U
nive
rsity
] at
13:
39 0
5 Se
ptem
ber
2013

Soil Solution Chemistry in Mountainous Soils 497
Table 2Chemical compositions (major elements) in the soil solution (concentrations are expressed
in mmolc l−1, TDS and P in mg l−1, EC in dS m−1)
Soil IonicNo. pH EC TDS Ca2+ Mg2+ Na+ K+ Cl− HCO−
3 SO2−4 NO−
3 P strength
1 6.7 0.541 346.5 2.65 1.50 1.32 0.04 1.60 2.20 0.38 1.47 8.97 0.00762 7.3 0.275 176.2 1.10 1.15 0.33 0.05 0.90 1.00 0.12 0.93 3.79 0.00393 7.2 0.337 215.6 1.85 1.00 0.27 0.21 1.05 1.30 0.11 1.12 5.99 0.00494 6.8 0.348 222.4 1.40 1.35 0.21 0.26 1.15 1.35 0.11 1.00 7.35 0.00485 7.2 0.211 135.2 0.85 1.00 0.12 0.12 0.85 0.85 0.10 0.59 9.93 0.00326 6.1 0.349 223.0 1.40 1.45 0.47 0.09 1.35 1.15 0.22 0.96 1.79 0.0057 7.1 0.292 186.7 2.05 0.85 0.02 0.02 1.00 1.05 0.03 0.79 1.76 0.00448 6.8 0.280 179.2 1.70 1.10 0.01 0.16 0.85 1.20 0.28 0.61 18.78 0.00459 6.9 0.318 203.2 1.80 1.45 0.02 0.11 1.45 0.95 0.34 0.60 5.37 0.0051
10 7.1 0.261 167.2 1.55 1.00 0.02 0.06 1.05 1.10 0.14 0.61 2.31 0.004111 6.0 0.730 467.2 4.10 2.85 0.13 0.27 2.80 3.00 0.25 1.27 9.97 0.011212 6.8 1.026 656.3 5.40 3.95 0.37 0.57 2.10 1.50 0.04 6.07 4.05 0.016113 6.1 0.575 368.0 2.40 3.10 0.14 0.06 2.00 3.10 0.19 0.63 4.74 0.00914 6.8 0.510 326.1 2.35 2.35 0.07 0.14 1.90 1.60 0.16 1.22 6.12 0.007515 7.5 0.543 347.2 2.70 1.75 0.82 0.11 2.00 3.15 0.01 0.35 3.82 0.007516 7.4 0.527 337.0 2.60 1.75 0.87 0.09 2.20 2.70 0.06 0.20 3.26 0.007317 7.3 0.590 377.6 1.80 1.90 2.03 0.14 2.75 2.65 0.00 0.68 1.75 0.007718 7.4 0.667 426.6 1.00 1.30 2.52 1.89 3.45 3.05 0.11 0.36 8.20 0.00819 6.8 0.755 483.2 1.60 1.00 3.35 1.71 2.70 4.10 0.02 0.58 6.41 0.008720 6.8 1.230 786.9 2.85 2.05 2.12 5.06 2.40 7.10 0.80 1.88 34.80 0.014621 6.6 0.420 268.8 1.05 1.65 1.02 0.38 2.10 1.40 0.04 0.82 3.58 0.005522 7.2 0.340 217.6 1.10 1.50 0.83 0.06 2.00 1.10 0.07 0.45 18.69 0.004923 6.7 0.785 502.4 3.35 1.60 1.57 1.37 2.05 2.30 0.28 3.14 23.38 0.010324 6.8 0.405 259.2 1.30 1.65 1.04 0.31 2.20 1.45 0.15 0.72 11.76 0.005925 6.8 0.760 486.4 2.50 1.60 1.57 1.86 2.55 2.50 0.32 2.25 26.03 0.0096
3.3 Hydrochemical Facies
The piper diagram (Figure 1) shows the relative concentrations of the different ions ofanalyzed soil solution samples. Five main soil solution groups have been identified basedon major ion concentrations.
Ca-Mg-HCO3 and Ca-HCO3 each represent 40% and 32% of the total number of soilsolution samples analyzed, while Ca-Cl represents 16% of the total number of soil solutionsamples analyzed. The other two water types (Na-Cl and Ca-Na-HCO3) represent only 2%.
To evaluate hydrochemistry of the soil solutions, saturation indices (SI) for all thesamples were calculated. The saturation indices describe quantitively the deviation of waterfrom equilibrium with respect to dissolved minerals. If the water is exactly saturated withthe dissolved mineral, SI equals zero. Positive values of SI indicate saturation, and negativeones indicate undersaturated (Appelo and Postma, 1993; Drever, 1997). All water sampleswere undersaturated with respect to gypsum, anhydrite, and halite. The graphs in Figure 2show the evolution experienced by the saturation indices of calcite, dolomite, gypsum, andhalite in relation to the increase in TDS content. The soil solutions evolve from a state ofunder-saturation in calcite and dolomite towards less saturation. The higher HCO−
3 , Ca2+,
Dow
nloa
ded
by [
RM
IT U
nive
rsity
] at
13:
39 0
5 Se
ptem
ber
2013
Tabl
e3
Dec
ript
ive
stat
istic
sfo
rch
emic
alco
mpo
sitio
nof
soil
solu
tions
inst
udie
dso
ils
Stan
dard
25%
75%
Var
iabl
en
Mea
nde
viat
ion
Med
ian
Min
imum
Max
imum
Qua
rtile
Qua
rtile
Skew
ness
pH25
6.9
0.46
6.8
6.0
7.5
6.7
7.2
−1.3
9E
C(d
Sm
−1)
250.
523
0.25
30.
511
0.21
11.
230.
327
0.69
81.
15C
a2+(m
eql−1
)25
2.11
1.06
1.80
0.85
5.40
1.35
2.63
1.51
Mg2+
(meq
l−1)
251.
670.
731.
500.
853.
951.
121.
831.
69N
a+(m
eql−1
)25
0.85
0.91
0.47
0.01
3.35
0.12
1.45
1.23
K+
(meq
l−1)
250.
611.
100.
140.
025.
060.
080.
473.
12C
l−(m
eql−1
)25
1.86
0.71
2.00
0.85
3.45
1.10
2.30
0.20
HC
O− 3
(meq
l−1)
252.
111.
371.
500.
857.
101.
122.
852.
16SO
2− 4(m
eql−1
)25
0.17
0.17
0.12
0.00
0.80
0.05
0.26
2.21
NO
− 3(m
eql−1
)25
1.17
1.21
0.79
0.20
6.07
0.60
1.24
3.13
P(m
gl−1
)25
9.30
8.57
6.12
1.75
34.8
03.
6810
.87
1.66
498
Dow
nloa
ded
by [
RM
IT U
nive
rsity
] at
13:
39 0
5 Se
ptem
ber
2013
Tabl
e4
Pear
son
corr
elat
ion
coef
ficie
nts
for
the
11pa
ram
eter
s
pHE
CC
a2+M
g2+N
a+K
+C
l−H
CO
− 3SO
2− 4N
O− 3
P
pH1.
000
EC
−0.1
211.
000
Ca2+
−0.2
120.
686∗∗
1.00
0M
g2+−0
.352
0.59
5∗∗0.
765∗∗
1.00
0N
a+0.
171
0.57
0∗∗−0
.062
−0.1
191.
000
K+
0.02
60.
759∗∗
0.16
30.
055
0.63
2∗∗1.
000
Cl−
−0.0
140.
687∗∗
0.27
50.
410∗
0.71
9∗∗0.
461∗
1.00
0H
CO
− 3−0
.028
0.80
1∗∗0.
303
0.25
30.
647∗∗
0.82
4∗∗0.
614∗∗
1.00
0SO
2− 4−0
.292
0.45
4∗0.
206
0.07
70.
125
0.67
8∗∗0.
047
0.54
2∗∗1.
000
NO
− 3−0
.160
0.60
5∗∗0.
769∗∗
0.60
9∗∗0.
004
0.23
70.
110
0.05
10.
158
1.00
0P
−0.0
190.
492∗
0.23
2−0
.006
0.31
90.
725∗∗
0.20
80.
488∗
0.73
2∗∗0.
232
1.00
0
a∗,∗∗
Sign
ifica
ntat
5%an
d1%
leve
lof
sign
ifica
nce,
resp
ectiv
ely.
499
Dow
nloa
ded
by [
RM
IT U
nive
rsity
] at
13:
39 0
5 Se
ptem
ber
2013

500 M. Jalali
Figure 1. Piper diagram for the soil solution of the studied area.
and Mg2+ concentrations will cause a greater calcite and dolomite over-saturation, whichcould eventually induce their precipitation.
3.4 Cation Chemistry
Compositional relations among dissolved species can reveal the origin of solutes and theprocess that generated the observed soil solution compositions. The correlation coefficientsamong the chemical components are shown in Table 4. Evaluation of the slops of Ca2+,Mg2+, and Na+ with HCO−
3 gives valuable information about the stochiometry of theprocess (Edmunds et al., 1987). There was not any relation between HCO−
3 , Ca2+, andMg2+ and correlation coefficients are not significant (Table 4), but there was strong positivecorrelation between HCO−
3 and Na+ (r = 0.647), indicating that NaHCO3 can be a source ofNa+. Bicarbonate, formed by neutralization of CO2, originated either by adsorption from theatmosphere or from the decomposition of organic matter in the soil. Weathering of silicatesin the soils of the study area also releases HCO−
3 into the soil solution. Another possiblemineral source of HCO−
3 is the dissolution of feldspars. A 1:1 relation between HCO−3 and
Na+ plus K+ results when HCO−3 is the result of K- and Na-feldspar dissolution (Tesoriero
et al., 2004). The relationship between Na+ plus K+ and HCO−3 is well described by the 1:1
Dow
nloa
ded
by [
RM
IT U
nive
rsity
] at
13:
39 0
5 Se
ptem
ber
2013

Soil Solution Chemistry in Mountainous Soils 501
-10
-8
-6
-4
-2
0
20 200 400 600 800 1000
TDS (mg l−1)
Sat
ura
tio
n in
dex
(ca
lcit
e)
-10
-9
-8
-7
-6
-5
-4
-3
-2
-1
00 200 400 600 800 1000
TDS (mg l−1)
Sat
ura
tio
n in
dex
(d
olo
mit
e)
-10
-9
-8
-7
-6
-5
-4
-3
-2
-1
00 200 400 600 800 1000
TDS (mg l−1)
Sat
ura
tio
n in
dex
(g
ypsu
m)
-10
-9
-8
-7
-6
-5
-4
-3
-2
-1
00 200 400 600 800 1000
TDS (mg l−1)
Sat
ura
tio
n in
dex
(h
alit
e)
Figure 2. Plots of TDS concentrations vs saturation indices of calcite, dolomite, gypsum, and halite.
relation (r = 0.823), indicating that dissolution of Na- and K-feldspars is a possible sourceof K+ and Na+.
The Na-Cl relationship has often been used to identify the mechanisms for acquiringsalinity and saline intrusions in semi-arid regions (Sami, 1992). A parallel enrichment inboth ions indicates dissolution of chloride salts or reconcentration processes by evaporation.There is a correlation (r = 0.401) between Mg2+ and Cl− and significant correlation (r =0.719) between Na+ and Cl−, indicating that Mg2+ and Na+ in these samples mostly resultfrom dissolution of magnesium and sodium chloride minerals.
The correlation between Ca2+ and SO2−4 was not significant, indicating that gypsum
can not be a source for Ca2+.There has been positive correlation between Ca2+ and NO−
3 (r = 0.769) and Mg2+ andNO−
3 (r = 0.609). Gimenez (1994) explained these relationships as a result of processesdeveloped after the application of nitrogen fertilizers. These processes add Ca2+ and Mg2+
to the water as a result of a likely cation exchange between NH+4 , Mg2+, and Ca2+.
Nitrification is microbial oxidation of ammonium-N to NO−3 in the unsaturated zone (Stumm
and Morgan, 1996):
NH+4 + 2O2 ↔ NO−
3 + 2H+ + H2O
Dow
nloa
ded
by [
RM
IT U
nive
rsity
] at
13:
39 0
5 Se
ptem
ber
2013

502 M. Jalali
Greater mineralization is generally associated with higher NO−3 concentrations in the soil
solution. Also, increased acidity during nitrification leads to carbonate dissolution withCa2+ enrichment.
3.5 Phosphorous Concentration in Soil Solution
The P concentration in soil solutions was between 1.75 to 34.8 mg l−1, with an averagevalue of 9.3 mg l−1, with all of the samples over 0.05 mg l−1 (USEPA, 1992). The frequencydistribution indicates that about 76% of the samples contain P in the range 1.75–10 mg l−1.The mean P concentration is higher than the mean value (0.19 mg l−1) reported by Jalaliand Kolahch (2008) for the groundwater in the north part of the Malayer, western Iran.Heredia and Cirelli (2007) studied P content of soil profiles, interstitial water, and shallowgroundwater in a semi-urban region of Buenos Aires. They found that contents of P ininterstitial water varied between 0.12 to 1.18 mg l−1 with an average value of 0.6 mg l−1.The P concentration in shallow groundwater was between 0.014 to 0.571 mg l−1, with anaverage value of 0.13 mg l−1, and with 53% of the samples over 0.05 mg l−1. In the studiedarea, P application as farmyard manure is a common practice. In general, manure containsboth inorganic and organic P and the characteristics of this material play a major role incontrolling P dynamics (Silveira et al., 2006). The P concentration in sheep and poultrymanure was 13.8 and 20 g kg−1, respectively (Jalali and Ranjbar, 2009). Phosphorousavailability in soils receiving manure is greater than fertilizer-amended soils. According toLaboski and Lamb (2003), the greater P availability in soils receiving manure (comparedwith fertilizer-amended soils) is due to the presence of organic acids in the manure, whichinhibits P sorption on the soils (Silveira et al., 2006). Scalenghe et al. (2002) indicated thatlong-term repeated applications of fertilizers and livestock wastes have resulted in a generalincrease in the P status of soil. The correlation of P concentration with the other dissolvedconstituent concentrations was carried out. There were significant correlations between theP, HCO−
3 , SO2−4 , and K+ (Table 4), indicating a possible common source. Most soils in the
studied area are sandy loam in texture and there is a possibility of downward movementof P.
Both adsorption of P on solids and equilibria with P-containing minerals can controlthe dissolved P concentration in soil solution. Dissolved phosphate in calcareous soilswould be expected to not only adsorb on minerals but interact with dissolved Ca2+ toform phosphate minerals. The speciation of total P in different forms is helpful for theunderstanding of P exchange mechanisms in soil solution, and its potential removal fromsoil (Aviles et al., 2006). The distribution of the P chemical species in the soil solutioncalculated by PHREEQC software showed that HPO2−
4 and H2PO−4 are dominated in the
soil solution. Similar to these results, Debieche et al. (2003) observed that in the shallowwaters in Algeria the dissolved P (PO3−
4 , HPO2−4 , and H2PO−
4 ) represented the highestportion of P.
Although it is likely that there are several phosphate minerals present in the soil inaddition to Ca-phosphate minerals, the high concentration of Ca2+ in the soil solutionand the low solubility of Ca-phosphate minerals suggest that Ca-phosphate minerals arelikely to control dissolved P concentration (Hansen and Strawn, 2003). Calcium-phosphateminerals play a significant role in the overall leaching of P and therefore it is important toinvestigate P concentration with respect to these minerals.
The phosphate released to solution in calcareous soils could form dicalcium phos-phate dehydrate (DCPC, brushite, CaHPO4. 2H2O), dicalcium phosphate (DCDP, monetite,CaHPO4), octacalcium phosphate [OCP, Ca8H2 (PO4)6.5H2O2], beta-tricalcium phosphate
Dow
nloa
ded
by [
RM
IT U
nive
rsity
] at
13:
39 0
5 Se
ptem
ber
2013

Soil Solution Chemistry in Mountainous Soils 503
-18
-16
-14
-12
-10
-89 10 11 12 13 14
log Ca2++ 2pH
log
HP
O42-
-pH
HA
B-TCP
OCP
DCP
DCPD
Figure 3. Calcium phosphate double function plot for soil solution samples (activity of ions wereused).
[ß-TCP, β-Ca3(PO4)], and hydroxyapatites [HA, Ca5(PO4)3(OH2)], in decreasing order ofsolubility, as well as Ca2+ and Mg2+ phosphates containing other ions (Lindsay et al.,1989). The calcium-phosphate double plot of Tunesi et al. (1999) is an example of an ac-tivity diagram approach (Figure 3). The y-axis represents the activity of the predominant Pspecies in solution along with pH. The lines on Figure 3 represent conditions of equilibriumwith respect to each of the mineral phases. The points on Figure 3 for the pH and calculatedactivities for H2PO2−
4 and Ca2+ for the soil solutions show that all soil solutions exceedthe solubility product of HA and many exceed those of ß-TCP. The data cluster along theß-TCP and the OCP stability lines, suggesting that these two minerals are the most likelyphosphate minerals controlling the P concentration in the soil solution. In general, thegreater the log Ca2+ + 2pH value of the points in the Figure 3, the closer the points are tothe lines representing the more soluble minerals DCP and OCP.
The graphs in Figure 4 show the trend in the points relative to the saturation indices ofHA, ß-TCP, OCP, DCP, and DCPC with increasing P content. A soil solution with higherdissolved P content tends to become more supersaturated with respect to HA and approachsaturation with respect to ß-TCP.
Jalali and Kolahchi (2009) studied effect of irrigation water quality on the leachingand desorption of phosphorous from soil. They found that leaching in presence of differentCaCl2 solutions was controlled by rate-limited dissolution of calcium HA and ß-TCP.Silveira et al. (2006) studied P release from a manure-impacted Spodosol. They found thatthe leachate samples were saturated with respect to HA and under-saturated with respect toDCPC, DCDP, Mg(PO4)2, and MgHPO4.3H2O. Jalali and Kolahchi (2008) found that about21% of groundwater samples were over-saturated with respect to HA in northern Malayer(SI ranges from −12.5 to 5.5), indicating that this mineral is most likely controlling Pconcentration in groundwater. Litator et al. (2004) studied the geochemistry of P in peatsoils of a semiarid altered wetland. They found that the water samples collected at 40 and110 cm below the surface were saturated with respect to DCP, TCP, and HA. Heredia andCirelli (2007) also showed that interstitial water was saturated in HA while groundwaterwas not.
Dow
nloa
ded
by [
RM
IT U
nive
rsity
] at
13:
39 0
5 Se
ptem
ber
2013

504 M. Jalali
-9
-8
-7
-6
-5
-4
-3
-2
-1
0
1
0 5 10 15 20 25 30 35 40
Sat
ura
tion
ind
ex (t
rica
lciu
m p
ho
sph
ate)
-14
-12
-10
-8
-6
-4
-2
0
0 5 10 15 20 25 30 35 40
satu
ratio
n in
dex
(oct
acal
ciu
m p
ho
sph
ate)
-3.5
-3
-2.5
-2
-1.5
-1
-0.5
0
0 5 10 15 20 25 30 35 40
Sat
ura
tio
n in
dex
(an
hyd
rus
dic
alci
um
ph
osph
ate)
-3.5
-3
-2.5
-2
-1.5
-1
-0.5
0
0 5 10 15 20 25 30 35 40
P ( mg l−1)
P ( mg l−1)P ( mg l−1)
P ( mg l−1)
P ( mg l−1)
Sat
ura
tion
ind
ex (d
ical
ciu
m p
ho
sph
ate
dih
ydra
te)
-8
-6
-4
-2
0
2
4
6
8
10
0 10 20 30 40
Sat
ura
tion
ind
ex (h
ydro
xyap
atite
)
Figure 4. Plots of P concentrations versus saturation indices of hydroxyapatite, tricalcium phosphate,octacalcium phosphate, anhydrus dicalcium phosphate, and dicalcium phosphate dihydrate, in orderof increasing solubility.
The wide distribution of the points relative to the mineral solubilitiy lines in Figure 3suggest that multiple processes control P concentration in soil solutions. The distribution ofthe points could also be controlled by the relative importance of precipitation and adsorptionreactions, not just mainly the precipitation reactions.
Dow
nloa
ded
by [
RM
IT U
nive
rsity
] at
13:
39 0
5 Se
ptem
ber
2013
Soil Solution Chemistry in Mountainous Soils 505
Calcium carbonate is an important parameter in retention of P within the groundwaterand its average amount in soils of studied area is about 2.67%. Calcium carbonate withinthe groundwater may be directly linked to CaCO3-P co-precipitation within the aquifermatrix (Jarvie et al., 2005).
3.6 Nitrate Concentration in Soil Solution
Nitrate concentrations in the soil solution samples varied from 12.5–376 with the averageof 72.6 mg l−1. The distribution of NO−
3 concentration is positively skewed (3.13), whichis more than P. The skewed frequency distribution of NO−
3 concentration of soil solutionsuggests both point and non-point sources of pollution.
In comparison with the WHO’s drinking water guideline (1993) of 50 mg l−1 for NO−3 ,
a total of 12 soils (48%) showed higher concentrations. In only one soil solution sampleNO−
3 concentration was low (<20 mg l−1) and NO−3 concentration in 48% of samples (12)
was in the range of 20–50 mg l−1. Groundwater with NO−3 concentration exceeding the
threshold of 13 mg l−1 NO−3 is considered contaminated due to human activities (the so-
called human affected value (Burkart and Kolpin, 1993; Eckhardt and Stackelberg, 1995)).Thirty-seven percent of the water samples showed NO−
3 concentrations above the humanaffected value. It is well known that P, NO−
3 , SO2−4 , Na+, and Cl− ions are mostly derived
from agricultural fertilizers, animal waste, and municipal and industrial sewage. There arepositive correlations between NO−
3 and Ca2+ (r = 0.769), Mg2+ (r = 0.609) and betweenNO−
3 and EC (r = 0.605) (Table 4). These relationships can be explained as a result ofprocesses developed after the application of manures or fertilizers. These processes addCa2+, Mg2+, and Na+ to the water as a result of a likely cation exchange between NH+
4and Na+, Mg2+ and Ca2+. Nitrification is amicrobial oxidation of ammonium-N to NO−
3in the unsaturated zone (Stumm and Morgan, 1996). Greater mineralization is generallyassociated with higher NO−
3 concentrations in the soil. Also, increased acidity duringnitrification leads to carbonate dissolution with Ca2+ enrichment.
3.7 Potassium Concentration in Soil Solution
The contribution of K+ in the soil solution in these samples is less than the other cations(see Table 2). The K+ concentrations in the soil solution varied from 0.80 to 198 mg l−1
with the mean concentration of 23.7 mg K+ l−1 and with 24% of the samples 12 mg l−1
over the recommended guideline of the WHO (1993). The low levels of K+ in some soilsolutions are a consequence of its tendency to be fixed by clay minerals and to participatein the formation of secondary minerals (Mathess, 1982). Potassium leaching in the soils isimportant from the perspective of plant nutrition, fertilizer use efficiency, and groundwatercontamination. When irrigation plus rainfall exceeds the crop water requirement, excess soilwater will drain downward, carrying with it soluble salts including K+ (Jalali and Rowell,2003). In arid and semi-arid regions, the leaching of K+ is enhanced by the presence ofcalcite and gypsum (Jalali and Rowell, 2003). Apart from the concentration of cations,especially Ca2+ in the soil solution (Jalali and Rowell, 2003; Kolahchi and Jalali, 2006),the leaching of K+ is also dependent on the clay type and content, organic matter content,and the amount of applied K+ (Johnston et al., 1993). In this area, manure spreading onsoil, ammonification and nitrification of manure N, and hydrolysis of urea all affect K+
leaching (Kolahchi and Jalali, 2006). Additionally, the weathering of K-feldespar, biotite,or muscovite is a source of K+ in soil solution.
Dow
nloa
ded
by [
RM
IT U
nive
rsity
] at
13:
39 0
5 Se
ptem
ber
2013

506 M. Jalali
Potassium showed good correlation (r = 0.461) with Cl− and SO2−4 (0.678), indicating
that weathering of sylvite (KCl) and K2SO4 partly controls the K+ chemistry. There wasalso strong correlation between K+ and HCO−
3 (0.824), K+ and Cl− (r = 0.461), Cl− andMg2+ (r = 0.410), and Cl− and Na+ (r = 0.719), indicating a common source.
Other possible sources of K+ in soil solution in the studied area are K-feldspars andK-bearing minerals.
4. Conclusion
The chemical characterization of soil solution plays a prominent role in all soil processes.The concentration of soil solutions can be altered by human activities. Intense agriculturalactivities and husbandry have placed a high demand on soil and groundwater resources inarid and semi-arid regions and also placed these resources at greater risk of contamination.The hydrochemical types of CaMg-HCO3 and Ca-HCO3 dominate the soil solutions ofmost studied soils. Hydroxyapatite is identified as a possible solubility-controlling solidphase for P. Most of the soils in the study area contain more P, NO−
3 , and K+, whichare mostly derived from animal waste. Surface soil accumulations of these nutrients haveoccurred in these soils to such an extent that loss of these nutrients in surface runoffand a high risk for nutrients transfer into groundwater in concentrations exceeding thegroundwater quality standard have become a priority management concern. Determinationof the soil solution status of the soils will improve soil management in the area, preventinggroundwater deterioration. Proper application of manures will likely decrease soil nutrientleaching, leading to lower potential release of nutrients to surface and groundwater.
References
Al-Wabel, M. A., Heil, D. M., Westfall, D. G., and Barbarick, K. A. 2002. Solution chemistryinfluence on metal mobility in biosolids-amended soils. J. Environ. Qual. 31, 1157–1165.
Andre, L., Franceschi, M., Pouchan, P., and Atteia, O. 2005. Using geochemical data and modellingto enhance the understanding of groundwater flow in a regional deep aquifer, Aquitaine Basin,south-west of France. J. Hydrol. 305, 40–62.
Appelo, C. A. J., and Postma, D. 1993. Geochemistry, Groundwater and Pollution. A. A. Balkema,Rotterdam.
Aviles, A., Rodero, J., Amores, V., de Vivente, I., Rodriguez, M. I., and Niell, F. X. 2006. Factorscontrolling phosphorus speciation in a Mediterranean basin (River Guadalfeo, Spain). J. Hydrol.331, 396–408.
Bottcher, G., Brumsack, H. J., Heinrichs, H., and Pohlmann, M. 1997. A new high-pressure squeezingtechnique for pore fluid extraction from terrestrial soils. Water Air Soil Pollut. 94, 289–296.
Boudot, J. P., Maitat, O., Merlet, D., and Rouiller, J. 2000. Soil solutions and surface water analysisin two contrasted watersheds impacted by acid deposition, Vosges mountains, N.E. France:Interpretation in terms of Al impact and nutrient imbalance. Chemosphere 41, 1419–1429.
Burkart, M. R., and Kolpin, D. W. 1993. Hydrologic and land use factors associated with herbicidesand nitrates in near-surface aquifers. J. Environ. Qual. 22, 646–656.
Chen, K, Jiao, J. J., Huang, J., and Huang, R. 2007. Multivariate statistical evaluation of trace elementsin groundwater in a coastal area in Shenzhen, China. Environ. Pollut. 147, 771–780.
Debieche, T. H., Mania, J., and Mudry, J. 2003. Species and mobility of phosphorous and nitrogenin a wadi-aquifer relationship. J. African Earth Sci. 37, 47–57.
Drever, J. I. 1997. The Geochemistry of Natural Waters, 3nd ed. Prentice Hall, Englewood Cliffs, NJ.Eckhardt, D. A.V., and Stackelberg, P. E. 1995. Relation of groundwater quality to land use on Long
Island, New York. Ground Water 33, 1019–1033.
Dow
nloa
ded
by [
RM
IT U
nive
rsity
] at
13:
39 0
5 Se
ptem
ber
2013
Soil Solution Chemistry in Mountainous Soils 507
Edmunds, W. M., Cook, J. M., Darling, W. G., Kinniburgh, D. G., Miles, D. L., Bath, A. H., Morgan-Jones, M., and Andrews, J. N. 1987. Baseline geochemical conditions in the Chalk aquifer,Berkshire, U. K.: A basis for groundwater quality management. Applied Geochem. 2, 251–274.
Gimenez, E. 1994. Caracterizacion Hidrogeoquimica de los Procesos de Salinizacion del AquiferoDetritico Cotero de la Plana de Castellon. Ph.D. Thesis, Universidad de Granada, Spain.
Gonzalez, C., Quintana, J. R., Moreno, L., Vazquez, A., Lafuente, A. L., and Romero, A. 2007.Applying multivariate methods to soil-solution interactions in carbonate media. Geoderma. 137,352–359.
Hansen, J. C., and Strawn, D. G. 2003. Kinetics of phosphorus release from manure-amended alkalinesoil. Soil Sci. 168, 869–879.
Helena, B., Pardo, B., Vega, M., Barrado, E., Fernandez, J. M., and Fernandez, L. 2000. Temporalevolution of groundwater composition in an alluvial aquifer (Pisuerga River, Spain) by principalcomponent analysis. Water Res. 34, 807–816.
Heredia, O. S., and Cirelli, A. F. 2007. Environmental risks of increasing phosphorus addition inrelation to soil sorption capacity. Geoderma. 137, 426–431.
Jalali, M., and Rowell, D. L. 2003. The role of calcite and gypsum in the leaching of potassium in asandy soil. Exp. Agric. 39, 379–394.
Jalali, M. 2006. Chemical characteristics of groundwater in parts of mountainous region, Alvand,Hamedan, Iran. Environ. Geol. 51, 433–446.
Jalali, M., and Kolahchi, Z. 2008. Groundwater quality in an irrigated, agricultural area of northernMalayer, western Iran. Nutr. Cycl Agroecosys. 18, 95–105.
Jalali, M., and Ranjbar, F. 2009. Rates of decomposition and phosphorus release from organic residuesrelated to residue composition. J. Plant Nutr. Soil Sci. 172, 353–359.
Jalali, M., and Kolahchi, Z. 2009. Effect of irrigation water quality on the leaching and desorption ofphosphorous from soil. Soil Sediment Contam. 18, 576–589.
Johnston, A. E., Goulding, K. W. T., and Mercer, E. 1993. Potassium Leaching from a Sandy Soil.International Potash Institute, Subject 12, No. 4.
Jarvie, H. P., Neal, C., and Acornley, M. 2005. Nutrient hydrochemistry for a groundwater-dominatedcatchment: The Hampshire Avon, UK. Sci. Total Environ. 344, 143–158.
Kalbitz, K., Solinger, S., Park, J. H., Michalzik, B., and Matzner, E. 2000. Controls on the dynamicsof dissolved organic matter in soils: A review. Soil Sci. 165, 277–304.
Kolahchi, Z., and Jalali, M. 2006. Simulating leaching of potassium in a sandy soil using simple andcomplex models. Agric. Water Manage. 85, 85–94.
Laboski, C. A. M., and Lamb, J. A. 2003. Changes in soil test phosphorus concentration afterapplication of manure or fertilizer. Soil Sci. Soc. Am. J. 67, 544–554.
Lal, R., and Stewart, B. A. 1994. Soil processes and water quality. In R. Lal and B. A. Stewart, SoilProcesses and Water Quality. CRC Press, Boca Raton, FL, pp. 1–6.
Lindsay, W. L., Vlek, P. L. G., and Chen, S. H. 1989. Phosphate minerals. In Dixon, J. B. and Weed,S. B., Minerals in Soil Environments, 2nd ed. Soil Science Society of America, Madison, WI,pp. 1089–1130.
Litator, M. I., Reichmann, O., Auerswald, K., Haim, A., and Shenker, M. 2004. The geochemistry ofphosphorus in peat soils of a semiarid altered wetland. Soil Sci. Soc. Am. J. 68, 2078–2085.
Malinina, M. S., Karavanova, E. I., Belyanina, L. A., and Ivanilova S. V. 2007. Comparative analysisof the composition of water extracts and soil solutions from peat gleyic podzolic soils of theCentral Forest State Biosphere Reserve. Eur. Soil Sci. 40, 390–398.
Markenitz, D., Davidson, E. A., Figueiredo, R. de O., Victoria, R. L., and Krusche, A. V. 2001.Control of cation concentrations in stream waters by surface soil processes in an Amazonianwatershed. Nature 410, 802–805.
Mathess, G. 1982. The Properties of Groundwater. Wiley, New York.McBride, M. B. 1994. Environmental Chemistry in Soils. Oxford University Press, Oxford, UK.Murphy, J., and Riley, J. P. 1962. A modified single solution method for determination of phosphate
in natural waters. Anal. Chim. Acta 27, 31–36.
Dow
nloa
ded
by [
RM
IT U
nive
rsity
] at
13:
39 0
5 Se
ptem
ber
2013
508 M. Jalali
Peregrina, F., Mariscal, I., Terefe, T., Ordonez, R., Espejo, R. 2007. Soil solution dynamics intopalexerult amended with gypsum and lime by-products: A laboratory test. Soil Sci. 172, 366–377.
Rowell, D. L. 1994. Soil Science: Methods and Applications. Longman Scientific and Technical,Harlow.
Sami, K. 1992. Recharge mechanisms and geochemical processes in a semi-arid sedimentary basin,Eastern cape, South Africa. J. Hydrol. 139, 27–48.
Scalenghe, R., Edwards, A. C., Ajmone Marsan, F., and Barberis, E. 2002. The effect of reducingconditions on the solubility of phosphorus in a diverse range of European agricultural soils. Eur.J. Soil Sci. 53, 439–447.
Silveira, M. L., Miyttah, M. K., and O’Connor, G. A. 2006. Phosphorous release from a manure-impacted Spodosol: Effects of a water treatment residual. J. Environ. Qual. 35, 529–541.
Stumm, W., and Morgan, J. J. 1996. Aquatic Chemistry. Wiley-Interscience, New York.Sun, B., Poss, R., Moreau, R., Aventurier, A., Fallavier, P. 2000. Effect of slaked lime and gypsum
on acidity alleviation and nutrient leaching in an acid soil from Southern China. Nutr. Cyc.Agroecosyst. 57, 215–223.
Tesoriero, A. J., Spruill, T. B., and Eimers, J. L. 2004. Geochemistry of shallow ground water in coastalplain environments in the southeastern United States: Implications for aquifer susceptibility.Applied Geochem. 19, 1471–1482.
Tunesi, S., Poggie, V., and Gessa, C. 1999. Phosphate adsorption and precipitation in calcareoussoils: The role of calcium ions in solution and carbonate minerals. Nutr. Cyc. Agroecosyst. 53,219–227.
Ugolini, F. C., and Sletten, R. S. 1991. The role of proton donors in pedogenesis as revealed by soilsolution studies. Soil Sci. 151, 59–75.
US Environmental Protection Agency, (USEPA). 1992. National Water Quality Inventory. Report toCongress, US Govt. Printing Office, Washington, DC.
Van Hees, P. A. W., Lundstrom, U. S., Danielsson, R., and Nyberg, L. 2001. Controlling mechanismsof aluminum in soil solution – An evaluation of 180 podzolic forest soils. Chemosphere 45,1091–1101.
Weng, L., Temminghoff, J. M., and Van Riemsdijk, W. H. 2001. Determination of the free ionconcentration of trace metals in soil solution using soil column Donnan membrane technique.Eur. J. Soil Sci. 52, 629–637.
WHO. 1993. Guidelines for Drinking Water Quality. 1. Recommendations, 2nd ed. World HealthOrganization, Geneva.
Wolt, J. D. 1994. Soil Solution Chemistry: Applications to Environmental Science and Agriculture.John Wiley and Sons, New York, p. 345.
Dow
nloa
ded
by [
RM
IT U
nive
rsity
] at
13:
39 0
5 Se
ptem
ber
2013