main features of domestic and external merchandise trade...
TRANSCRIPT

UNCTAD/ECDC/SEU/5
UNITED NATIONS CONFERENCE ON TRADE AND DEVELOPMENT
MAIN FEATURES OF DOMESTIC AND EXTERNAL MERCHANDISE TRADE
OF THE WEST BANK AND GAZA STRIP
UNITED NATIONS


Distr. GENERAL
UNCTAD/ECDC/SEU/S 21 October 1994
ENGLISH ONLY
MAIN FEATURES OF DOMESTIC AND EXTERNAL MERCHANDISE TRADE OF THE WEST BANK AND GAZA STRIP
Study prepared by Dr. Mahmoud El-Jafari, UNCTAD consultant*
* This study constitutes Part One of the contribution made by Dr. Mahmoud El-Jafari (Islamic University of Gaza, Gaza Strip) to the intersectoral project of the UNCTAD secretariat on "Prospects for sustained development of the Palestinian economy in the West Bank and Gaza Strip". The opinions expressed in this study are those of the author and do not necessarily reflect those of the Secretariat of the United Nations. The designations employed and the presentation of the material in this document do not imply the expression of any opinion whatsoever on the part of the Secretariat of the United Nations concerning the legal status of any country, territory, city or area, or of its authorities, or concerning the delimitation of its frontiers or boundaries.
GE.94-S4283 (E)

- 2 -
CONTENTS
List of tables List of abbreviations and symbols Preface Introduction
Chapter I.
A.
B.
C.
D.
E.
F.
Supply and demand trends in the domestic market, 1968-1990 .
Significance of agricultural imports to the West Bank and Gaza Strip
Sources of agricultural supply, including imports
Agricultural commodity imports to the West Bank from Israel and the Gaza Strip
l. Fresh vegetables
2. Fresh fruit
3. Livestock products
Agricultural commodity imports to the Gaza Strip from Israel and the West Bank
1. Fresh vegetables
2. Fresh fruit
3. Livestock products
Significance of industrial imports to the West Bank and Gaza Strip
l. Industrial imports to the West Bank
2. Industrial imports to the Gaza Strip
Commodity distribution of industrial imports to the West Bank and Gaza Strip
l. West Bank industrial imports from Jordan
2. West Bank and Gaza Strip industrial imports from abroad via Israeli ports
3. Industrial imports of the West Bank and Gaza Strip from Israel
6
8
9
11
13
13
13
14
14
14
15
15
15
16
16
16
16
17
17
17
18
18

Chapter II.
- 3 -
CONTENTS (continued)
Marketing of agricultural and industrial products, 1967-1990
A. Significance of merchandise exports from the West Bank and Gaza Strip
B. Destinations of agricultural and industrial exports from the Palestinian territory
1. Agricultural exports
2. Industrial exports
C. Composition and destination of West Bank agricultural exports .
D.
E.
1. Fresh vegetables
2. Fresh fruit
Composition and destination of agricultural exports from the Gaza Strip
1. Fresh vegetables
2. Fresh citrus fruit
3. Other fresh fruits
Compo,sition and destination of industrial exports
1. West Bank industrial exports to Jordan .
2. West Bank and Gaza Strip industrial exports to Israel
19
19
19
20
21
22
22
23
23
23
24
25
26
26
26
F. Merchandise trade balance 27
Chapter III. Policy and institutional framework affecting merchandise trade . 28
A. Laws and regulations affecting domestic trade 28
1. Business licensing 28
2. Product standards 28
3. Fiscal requirements 29
4. Marketing of goods . 29
B.
C.
D.
E.
F.
G.
H.
- 4 -
CONTENTS (continued)
Laws and regulations affecting external trade .
1. Israeli measures .
2. Jordanian regulations
Certificates of Palestinian origin
Labels and standards
1. Labels .
2. Standards
Fiscal measures affecting external trade
Measures to protect domestic producers
Major developments in the trade policy environment since 1987
1.
2.
3.
4.
Palestinian uprising in the West Bank and Gaza Strip
Severance of Jordanian legal and administrative ties with the West Bank
Devaluation of the Jordanian dinar
Gulf crisis of 1990/1991 .
Agricultural marketing facilities and institutions
1. Domestic wholesale and retail channels .
2. Cooperative societies
3. Quality/health control
4. Post-harvest treatment, grading and packing
5. Storage, including refrigeration
6. Promotion and market information
30
30
31
32
32
32
32
33
33
33
34
34
35
35
35
35
36
36
37
37
38

1.
J.
K.
Chapter IV.
- 5 -
CONTENTS (continued)
Marketing facilities for manufactured goods
1. Domestic wholesale and retail channels
2. Import agents
3. Quality control, labelling, packaging, and storage
4. Promotion
Transport and communication
Financial facilities
1. Private voluntary organizations revolving fund
2. International and regional sources of trade finance
3. Human resources and research .
Emergent trends, recent developments and some immediate needs of Palestinian merchandise trade
A. Emergent trends and recent developments in Palestinian external trade
B.
Tables
References
Major constraints affecting the Palestinian trade sector and immediate needs .
38
38
39
39
40
40
41
41
42
42
44
44
46
50
86

Table:
1-1:
1-2:
1-3:
1-4:
1-5:
1-6:
1-7:
1-8:
1-9:
1-10:
1-11:
1-12:
1-13:
1-14:
1-15:
2-1:
2-2:
2-3:
2-4:
- 6 -
LIST OF TABLES
West Bank: Agricultural and industrial imports and consumption expenditures, 1971-1990
Gaza Strip: Agricultural and industrial imports and consumption expenditures, 1971-1990
West Bank: Agricultural imports from Israel and the Gaza Strip, 1970-1990
Gaza Strip: Agricultural imports from the West Bank, Israel, and elsewhere, 1970-1990
West Bank: 1970-1990
West Bank:
West Bank:
Consumption and imports of fresh vegetables,
consumption and imports of fruit, 1970-1989
consumption and imports of citrus, 1970-1990
West Bank: Consumption and imports of livestock products from Israel, 1970-1989
Gaza Strip: Consumption and imports of vegetables, 1970-1990
Gaza Strip: Consumption and imports of fruit, 1970-1990
Gaza Strip: Consumption and imports of livestock products Israel, 1970-1987
West Bank: Consumption and imports of industrial products, 1971-1990
from
Gaza Strip: Consumption and imports of industrial products, 1970-1990
West Bank: Selected manufactured imports from Jordan, 1971-1990
West Bank and Gaza Strip: Selected manufactured imports from abroad via Israel, 1971-1987
West Bank: Agricultural and industrial exports, 1971-1990
Gaza Strip: Agricultural and industrial exports, 1971-1990
West Bank: Agricultural and industrial exports by market, 1971-1990
West Bank and Gaza Strip: Agricultural exports to Jordan and Israel as proportion of Jordanian and Israeli agricultural imports, 1968-1990
Table:
2-5:
2 - 6:
2-7:
2 - 8:
2-9:
2-10:
2-11:
2-12:
2-13:
2-14:
2-15:
2-16:
2-17:
2-18:
2-19:
2-20:
- 7 -
LIST OF TABLES (continued)
Gaza Strip: Agricultural and industrial exports by market, 1971-1990
West Bank: Industrial exports to Jordan as a proportion of Jordanian industrial ~mports, 1971-1990
West Bank: Production and marketing of vegetables, 1970-1990
West Bank: Estimated revenues from marketed fresh vegetables, 1970-1990
West Bank: Production and marketing of fresh fruits and citrus, 1970-1990
West Bank: Estimated revenues from marketed fresh fruits and citrus, 1970-1990
Gaza Strip: Production and marketing of fresh vegetables, 1970-1990
Gaza Strip: Estimated revenues from marketed fresh vegetables, 1970-1990
Gaza Strip: Production and marketing of citrus, 1970-1990
Gaza Strip: Estimated revenues from marketed citrus, 1970-1990
Gaza Strip: Production and marketing of fresh fruit, 1970-1990
Gaza Strip: Estimated revenues from marketed fresh fruit, 1970-1990
West Bank: Exports of industrial products to Jordan, 1971-1990
West Bank and Gaza Strip: Industrial exports to Israel, 1970-1990
West Bank: Merchandise trade balance, 1968-1990
Gaza Strip: Merchandise trade balance, 1969-1990

Agrexco
CBS
EC
FAO
GDP
GNP
NGO
NTB
OPT
UNCTAD
$
- 8 -
LIST OF ABBREVIATIONS AND SYMBOLS
Agricultural Export Corporation (Israel)
Central Bureau of Statistics (Israel)
European Community
Food and Agriculture Organization of the United Nations
gross domestic product
gross national product
non-governmental organization
non-tariff trade barrier
occupied Palestinian territory (the terms: "occupied territory" or "territory" refer to occupied Palestinian territory)
United Nations Conference on Trade and Development
United States dollars
data not available
zero or negligible

- 9 -
Preface
As part of the work programme of the UNCTAD secretariat pursuant to resolution 239 (XXIII) of the Trade and Development Board and resolution 44/174 of the General Assembly, the UNCTAD secretariat initiated, in 1990/91, the preparation of an in-depth intersectoral project on the economy of the West Bank and Gaza Strip. Part one of the project deals with a comprehensive assessment of the economic and social situation in the west Bank and Gaza Strip, the main impediments to sustained growth and development, pressing needs and corresponding measures for immediate action to promote recovery. Part two of the project constitutes an in-depth analysis of prospects under different scenarios for the future development of the Palestinian economy. Part three of the project is intended to provide a strategy framework and policy guidelines for the revival and sustained future development of the Palestinian economy in the West Bank and Gaza Strip.
For the implementation of the project, a total of 25 in-depth studies were initiated at the field level covering economic and social sectors and issues. Concurrently, and in order to facilitate the technical aspects of work on parts two and three, the UNCTAD secretariat has also prepared an in-depth study of a quantitative framework for examining future options and prospects under several scenarios. The summary findings of Part One of the field studies, in particular an identification of pressing needs and corresponding feasible measures for immediate action, were presented to an expert group meeting (held in May 1992) for further consideration. The report of that meeting is published separately (document UNCTAD/DSD/SEU/2). The secretariat's study of a quantitative framework for analysing future prospects (document UNCTAD/DSD/SEU/3) is in the process of finalization and will be published in due course.
In order to provide more detailed substantive background to the findings and recommendations of the expert group meeting, and to enable donors to further develop their programmes of assistance to the Palestinian people, the first parts of a selected number of the field studies, commissioned within the scope of this project, are being published in a special study series on Palestinian economic and social development. The second and third parts of the field studies will be subsequently consolidated by the UNCTAD secretariat.
The present study (prepared by UNCTAD consultant Dr. Mahmoud El-Jafari, Islamic University of Gaza, Gaza Strip) constitutes a background document reviewing developments in merchandise trade in the occupied Palestinian territory (the West Bank and Gaza Strip) during the period 1967-1990. The study focuses on the commodity and market orientation of Palestinian domestic and external merchandise trade Slnce Israeli occupation, and provides a comprehensive account of major trends, key developments and salient features of this important sector. As such, it complements and updates, as appropriate, the study prepared by the UNCTAD secretariat (UNCTAD; 1989) on "Palestinian external trade under Israeli occupation" and examines from a different angle the immediate problems and prospects of this sector.

- 10 -
It should be noted that, in view of the early completion of this and the other in-depth sectoral studies undertaken within the context of the intersectoral project, the implications of the bilateral accords concluded between Israel and Palestine in 1993 and 1994 and between Jordan and Palestine in 1994 could not be reflected. However, to the extent possible the data coverage and substantive findings have been updated to 1993, bearing in mind that developments since should lead the Palestinian economy and its trade sector in particular onto a substantially different course than that which prevailed for over 25 years.

- 11 -
Introduction
An examination of the balance of trade of the occupied Palestinian territory facilitates the assessment of the performance and potentials of its economy. Since 1967, the economy of the occupied territory in general and its trade sector in particular became tightly linked with Israel on the one hand and Jordan on the other, the two main counterparts in Palestinian economic and trade relations. Non-tariff trade barriers were evident in both Israeli and Arab markets (owing to political, economic and technical constraints), thus restricting the flow of Palestinian produce in those directions. Due to such practices and other factors, economic and trade relations between the occupied territory and neighbouring countries were uneven. In addition, economic and trade interaction within and between the West Bank and Gaza Strip was very limited.
This study surveys the performance of the domestic merchandise trade sector in the occupied territory, and external merchandise trade between the West Bank and Gaza Strip and the rest of the world. It consists of four chapters. Chapter I discusses the demand and supply conditions affecting industrial and agricultural goods in the West Bank and Gaza Strip domestic markets. Chapter II examines the export performance of agricultural and industrial goods from the West Bank and Gaza Strip in each other's and in external markets during the period 1967-1990.
Chapter III examines domestic commercial policies, laws and regulations which have influenced domestic and external trade in the occupied territory. In addition, this chapter reviews marketing facilities, structures and institutions. This includes distribution through wholesalers and retailers, promotion and standardization. Other trade-related services are also discussed, such as financial institutions and transportation facilities. Chapter IV presents some major conclusions and policy recommendations.
Quantitative data used in the analysis were obtained from several sources. The first source was the Economic Time Series compiled by the United Nations Conference on Trade and Development, based on the statistical series published by the Israel Central Bureau of Statistics (CBS). Further data were compiled from CBS publications.
Estimates for the period 1988-1990 were obtained directly from the CBS in Jerusalem, Gaza Department of Agriculture, Jericho Department of Agriculture and Palestinian Chamber of Commerce and Industry. Actual data on the West Bank and Gaza Strip for that period were unavailable, as difficulties were encountered in data collection from 1988 onwards by the Central Bureau of Statistics and by other sources. Therefore, data presented in the tables accompanying this study for the period 1988-1990 do not always correspond, owing to reli.ance on several sources for the constructi.on of the different series and tables.
Additional Palestinian sources were publications issued by An-Najah National Uni versi ty and the .ll.rab Studies Society. For the Jordanian economy, the Annual Report of the Central Bank of Jordan was the main source. The metric system (t:ons) was used for quantities, and the United States dollar was used as the measure of value, converted from data originally published in Israeli currency (shekels or new shekels) .

- 12 -
For the purposes of this study, east Jerusalem is considered as part of the West Bank, notwithstanding the lack of official data on east Jerusalem, including its trade. Per capita consumption of agricultural and manufactured goods in the West Bank may be used as proxy for consumption in east Jerusalem, and total consumption of merchandise goods calculated accordingly. There are no significant differences in the consumption patterns between Palestinians in the West Bank urban centres and east Jerusalem. Data available on the standard of living indicate that per capita disposable income and per capita private consumption in both east Jerusalem and the West Bank are relatively close (Israel CBS (a) and Israel CBS (b)).
Two further qualifications are relevant regarding the methodology adopted in this study. First, the trade sectors of the West Bank and Gaza Strip are each dealt with separately for several reasons. The level of economic development in the Gaza Strip is generally lower than that in the West Bank: per capita consumption expenditures and disposable income of the West Bank are 30 per cent higher than in the Gaza Strip. Furthermore, the structures of the West Bank agricultural and industrial sectors are different from those of the Gaza Strip. In fact, commodity distribution of manufactured and agricultural goods produced and exported from both regions are not similar (see Kahan, 1987; Bahiri, 1987). In addition, trade between the West Bank and Gaza Strip has been subject to different factors and constraints that affect trade with Israel, Jordan and other markets.
Secondly, in order to facilitate analysis of the merchandise trade sector in both its domestic and external aspects, each of the component regions of the occupied territory (i.e. the West Bank and Gaza Strip) are included, as appropriate, in discussions of the other's sources of supply and destinations of marketed goods. Accordingly, and unless otherwise indicated, for the purposes of this study, the Gaza Strip's four merchandise trade markets are Israel, Jordan and other Arab countries, the West Bank and the rest of the world. Similarly, the West Bank's four merchandise trade markets are Israel, Jordan and other Arab countries, the Gaza Strip and the rest of the world. When data are not applicable to all four markets, this is indicated accordingly in the text and the tables.

- 13 -
Chapter I
SUPPLY AND DEMAND TRENDS IN THE DOMESTIC MARKET, 1968-1990
This chapter analyses the supply and demand conditions for agricultural and industrial products in the domestic markets of the West Bank and Gaza Strip during the period 1968-1990, including domestic and import demand for agricultural goods, and the sources and composition of Palestinian agricultural and ind~strial imports in the local markets.
A. Significance of agricultural imports to the West Bank and Gaza Strip
During the period 1971-1987, West Bank agricultural imports from abroad increased almost sevenfold, from under $14 million to $96 million, as indicated in table 1-1. This increase may be attributed to several factors, including popUlation growth (around 3.5 per cent per annum), the increase in disposable income, and the inelastic nature of domestic demand for agricultural products. Of equal significance was the inability of domestic produ.ction (in the West Bank and Gaza Strip) to satisfy the growing demand. Despite the increase in value, the share of agricultural imports in total imports was relatively constant, averaging 16 per cent during 1971-1990. The significance of agricultural and industrial imports is reflec~ed in their shares of total consumption expenditures. These shares were relatively stable duri~g 1971-1990, averaging 18 per cent and 55 per cent, respectively.
The Gaza Strip's agricultural imports increased during the period 1971-1987, but started to decline afterwards. Agricultural imports averaged $25 million in 1971-1982, $47 million in 1983-1987 and $40 million in 1588-1990, as calculated from table 1-2. In the last-mentioned period, the share of agricultural imports in total imports was virtually constant at 13 per cent. Prior to 1988, agricultural imports accounted for over 25 per cent of total consumption of agricultural goods.
B. Sources of agricultural supply, including imports
Since 1967, the Israeli authorities have controlled the direction of Palestinian trade, allowing agricultural imports from Israel and effectively limiting agricultural imports from other sources (Kahan; El-Jafari, 1990). While limited economic relations developed between the West Bank and the Gaza Strip, trade between the two regions was subjected to security and other restrictions. The flow of Palestinian agricultural and manufactured goods into Israel and east Jerusalem was restricted by several non-tariff trade barriers (NTBs) (El-Jafari, 1991). By contrast, Israeli agricultural and manufactured products entered the occupied territory without any limitation.
During the period 1970-1987, the proportion of the West Bank's agricultural imports coming from Israel averaged 88 per cent and from the Gaza Strip 12 per cent of total, as illustrated in table 1-3. During the intifada, the West Bank became more dependent on the Gaza Strip as its source of agricultural supply, with the latter's share more than doubling to reach an average of 27 per cent in 1988-1990.
Between 1970 and 1990, Israel was the major supplier of agricultural goods to the Gaza Strip, with an average share of 86 per cent in 1970-1987, as

- 14 -
shown in table 1-4. At the same time, imports from the West Bank accounted for an average of 5 per cent of total agricultural imports, while 9 per cent originated abroad. The Israeli share of agricultural imports into the Gaza Strip declined to 75 per cent by 1990. During 1988-1990, the West Bank's share of such imports increased, averaging 13 per cent of the total, as shown in table 1-4.
c. Agricultural commodity imports to the West Bank from Israel and the Gaza Strip
1. Fresh vegetables
Vegetable consumption in the West Bank increased during 1970-1987 as shown in table 1.5, though trends in consumption fluctuated over the period. Meanwhile the trend in vegetable imports was also gradually increasing: from 15,800 tons in 1970 to 45,300 tons in 1987. However, in 1990 total vegetable imports rose sharply to 57,200 tons. Imports constituted around 20 per cent of total consumption of vegetables in 1970; this share peaked at 42 per cent in 1981 and started declining to reach as Iowa level as 22 per cent by 1989. This indicates that since the 1970s the West Bank has improved its comparative advantage in producing vegetables, thus reducing its reliance on imports. The proportion of imports in total domestic consumption may be used as proxy for assessing the performance of import substitution strategies (Todaro).
Imports from Israel were erratic between 1970 and 1982, and they ceased by 1988. In contrast, the trend in imports from the Gaza Strip increased during 1988-1990, reaching a high of 57,200 tons in 1990. The data indicate that Palestinian traders substituted their imports of vegetables from Israel with those from the Gaza Strip, changing the relative importance of their respective market shares. During 1968-1982, the shares of Israel and the Gaza Strip in the West Bank imports averaged 77 per cent and 23 per cent, respectively, but during 1983-1987, these shares changed to 58 per cent and 42 per cent, respectively. By 1988-1990, the Gaza Strip supplied all of the West Bank's agricultural imports.
2. Fresh fruit
West Bank imports of fresh fruit (excluding citrus) expanded from 8,600 tons in 1970 to 25,500 tons in 1980. After 1980, imports of fresh fruit started falling, as indicated in table 1-6. The share of fruit imports in total domestic consumption of fruit fluctuated around 25 per cent between 1970 and 1989. This implies that West Bank imports of fresh fruit were not substituted by other fruits produced locally. Fresh fruit imports from Israel and the Gaza Strip consisted mainly of grapes, peaches and bananas. Israel's share in these imports increased from an average of 75 per cent during 1970-1982 to 89 per cent during 1983-1987.
During 1970-1987, the supply of citrus fruits from Israel and the Gaza Strip was erratic, averaging around 20 per cent of the total West Bank domestic consumption of citrus fruits, as seen in table 1-7. While this consumption increased during 1970-1979, it declined and remained relatively stable during 1980-1987.
- 15 -
3. Livestock products
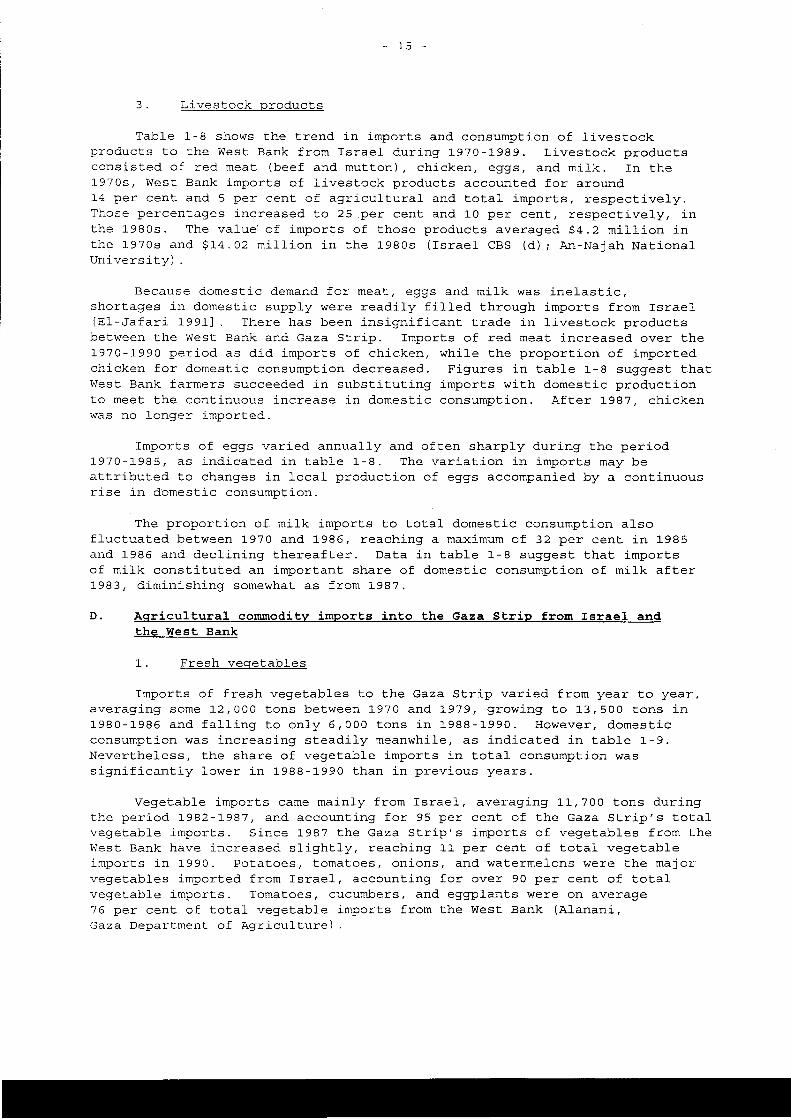
Table 1-8 shows the trend in imports and consumption of livestock products to the West Bank from Israel during 1970-1989. Livestock products consisted of red meat (beef and mutton), chicken, eggs, and milk. In the 1970s, West Bank imports of livestock products accounted for around 14 per cent and 5 per cent of agricultural and total imports, respectively. Those percentages increased to 25 per cent and 10 per cent, respectively, in the 1980s. The value' of imports of those products averaged $4.2 million in the 1970s and $14.02 million in the 1980s (Israel CBS (d) i An-Najah National University) .
Because domestic demand for meat, eggs and milk was inelastic, shortages in domestic supply were readily filled through imports from Israel [EI-Jafari 1991J. There has been insignificant trade in livestock products between the West Bank and Gaza Strip. Imports of red meat increased over the 1970-1990 period as did imports of chicken, while the proportion of imported chicken for domestic consumption decreased. Figures in table 1-8 suggest that West Bank farmers succeeded in substituting imports with domestic production to meet the continuous increase in domestic consumption. After 1987, chicken was no longer imported.
Imports of eggs varied annually and often sharply during the period 1970-1985, as indicated in table 1-8. The variation in imports may be attributed to changes in local production of eggs accompanied by a continuous rise in domestic consumption.
The proportion of milk imports to total domestic consumption also fluctuated between 1970 and 1986, reaching a maximum of 32 per cent in 1985 and 1986 and declining thereafter. Data in table 1-8 suggest that imports of milk constituted an important share of domestic consumption of milk after 1983, diminishing somewhat as from 1987.
D. Agricultural commodity imports into the Gaza Strip from Israel and the West Bank
1. Fresh vegetables
Imports of fresh vegetables to the Gaza Strip varied from year to year, averaging some 12,000 tons between 1970 and 1979, growing to 13,500 tons in 1980-1986 and falling to only 6,000 tons in 1988-1990. However, domestic consumption was increasing steadily meanwhile, as indicated in table 1-9. Nevertheless, the share of vegetable imports in total consumption was significantly lower in 1988-1990 than in previous years.
Vegetable imports came mainly from Israel, averaging 11,700 tons during the period 1982-1987, and accounting for 95 per cent of the Gaza Strip's total vegetable imports. Since 1987 the Gaza Strip's imports of vegetables from the West Bank have increased slightly, reaching 11 per cent of total vegetable imports in 1990. Potatoes, tomatoes, onions, and watermelons were the major vegetables imported from Israel, accounting for over 90 per cent of total vegetable imports. Tomatoes, cucumbers, and eggplants were on average 76 per cent of total vegetable imports from the West Bank (Alanani, Gaza Department of Agriculture) .

- 16 -
2. Fresh fruit
Total fruit imports to the Gaza Strip increased from an average of 13,600 tons in 1970-1987 to 16,600 tons in 1988-1990. The percentage of fruit imports in total domestic consumption was 67 per cent during 1988-1990, as calculated from table 1-10. During 1970-1987, Israel's average share was 70 per cent, rising to an average of 80 per cent thereafter, at the expense of declining supply from the West Bank. The Gaza Strip imported apples and bananas from Israel, and primarily grapes and cherries from the West Bank (Alanani; Gaza Department of Agriculture)
3. Livestock products
The Gaza Strip imports substantial quantities of livestock. It may be estimated that imports of red meat, chicken, eggs and milk, originating almost entirely from Israel, accounted for half of total agricultural imports by the mid-1980s (calculated from data in Israel CBS (d)). The expansion in domestic consumption was accompanied by a high dependency on imports of most items, as indicated in table 1-11. The proportion of red meat imports to total domestic consumption reached its highest levels during 1984-1987. These figures suggest that no effort was made to increase domestic production, possibly owing to the increase in input prices (EI-Jafari, 1991). Similarly, no effort was made to increase the production of milk. During the period 1983-1987, the proportion of milk imports to total domestic consumption was 60 per cent, or twice that of the period 1970-1982.
As far as poultry was concerned, consumption and imports of chicken both grew, after which the former continued to increase and the latter faltered. The proportion of chicken imports to total consumption showed a constant trend during 1979-1987, as compared to greater fluctuations in preceding years. This proportion averaged 70 per cent during 1970-1978, and 53 per cent in 1979-1987. That implies that the growth in imports of chicken was less than that of its total domestic consumption, i.e. that domestic consumption of chicken became less dependent on imports.
As of 1986, domestic consumption of eggs was met through local production. Imports of eggs showed a continuous decrease over time and ceased by 1986. On the other hand, domestic consumption of eggs was increasing, to reach a peak of 60.5 million eggs in 1987.
E. Significance of industrial imports to the West Bank and Gaza Strip
In the West Bank and Gaza Strip, industrial imports (excluding trade in industrial goods between the West Bank and Gaza Strip) have accounted for more than 85 per cent of total merchandise imports from abroad (see tables 1-1 and 1-2). Israel was the major supplier of industrial products to the occupied territory, accounting for 90 per cent of its imports.
1. Industrial imports to the West Bank
Industrial imports into the West Bank increased over eightfold between 1971 and 1987, as calculated from table 1-12. Starting in 1988, this trend reversed as industrial imports from Israel started to decline (Elawna, 1989; Shunnar) .

- 17 -
The share of industrial imports in the total consumption of these goods grew from 49 per cent in 1970 to 62 per cent in 1981. Afterwards, this percentage started to decrease and by 1990 had reached 50 per cent. The decrease in consumption expenditures, particularly after the devaluation of the Jordanian dinar in 1988, may be attributed to the reduction in real incomes.
Figures in table 1-12, indicate that Israel has increased its share in the West Bank market. Since 1967, its trade and economic policies have included several restrictions on West Bank imports from Jordan and abroad, including high (Israeli) tariffs, as compared to no limitations on imports from Israel. Israeli industrial exports to the occupied territory were significant; some 6 per cent of total Israeli industrial exports went to the West Bank market. Industrial imports from abroad (via Israel) accounted for an average of 10 per cent of total industrial imports, increasing from $9.3 million in 1970 to $43.3 million in 1987, and declining to $29.4 million by 1990. Although imports from Jordan increased during the period 1968-1987, the contribution of industrial imports from Jordan to total industrial imports has remained around 2 per cent annually.
2. Industrial imports to the Gaza Strip
Imports of intermediate and finished manufactured products to the Gaza Strip increased between 1970 and 1987, from $35.5 million to $350 million, respectively, falling to $242 million by 1989. The share of industrial imports in total consumption of industrial goods in the Gaza Strip was greater than that of the West Bank, increasing steadily during 1971-1981. It rose from 54 per cent in 1971 to a high of 69 per cent in 1981. Data in table 1-13 indicate that the Gaza Strip is highly dependent on industrial imports. However, data on industrial imports do not distinguish between those destined for final consumption and intermediate goods for use in local industry.
From 1967, Israel became a major supplier of industrial products to the Gaza Strip. Since then, more than 90 per cent of the Gaza Strip's industrial imports have originated in Israel. Only 10 per cent of Gazan imports of manufactured goods originated in foreign countries. Jordan and other Arab countries were not granted access to the Gazan markets.
F. Commodity distribution of industrial imports to the West Bank and Gaza Strip
This section surveys the aggregate flow of manufactured products from Jordan into the West Bank and from Israel into the West Bank and Gazan markets, as data on the composition of industrial imports from Israel and other regions are unavailable.
1. West Bank industrial imports from Jordan
West Bank industrial imports from Jordan were mostly intermediate goods and raw materials. Such products were imported from or through Jordan for use in the production of exportable manufactured products. In compliance with boycott regulations of the League of Arab States, Jordan did not allow West Bank manufactured products to flow into its local markets if they

- 18 -
contained inputs supplied by Israel (Alanani). Principal intermediate goods imported from Jordan for further processing were vegetable oils, dairy products, paper and printing products and plastic materials. The value of imports from Jordan was small, averaging $3.9 million during the 1970s and rising to $7.9 million during 1980-1987 with edible oil making up the biggest share, as seen in table 1-14.
2. West Bank and Gaza Strip industrial imports from abroad via Israeli ports
The West Bank and Gaza Strip's imports of manufactured goods from abroad via Israel may be classified into three broad categories: foodstuffs, intermediate and raw materials and capital goods, as detailed in table 1-15.
Imports of foodstuffs including cereals, livestock products, powdered milk, coffee, tea, spices, sugar, flour, oil and processed meat, averaged $18.5 million during the period 1968-1987. Their share in total imports from abroad fell from 46 per cent in the 1970s to 28 per cent in the 1980s. Imports of flour and edible oil averaged $11 million, accounting for 60 per cent of foodstuff imports and 20 per cent of total imports.
Imports of capital goods consisted chiefly of electrical equipment and machinery, which accounted for more than 18 per cent of total imports via Israel in 1986. Imports of intermediate goods and raw materials reached as high as $15 million in the 1980s, three times greater than in the 1970s. That was reflected also in an increase in their share in total industrial imports, rising from an average of some 12 per cent in the 1970s to 19 per cent in the 1980s. That increase in the import demand for intermediate and raw materials could be considered as a derived demand for final goods. This was reflected as an increase in the share of industrial production in gross domestic product, which rose from 7.6 per cent in 1980 to 9.2 per cent in 1987 (Israel CBS (d)).
3. Industrial imports of the West Bank and Gaza Strip from Israel
As noted, the West Bank and Gaza Strip's industrial imports from Israel accounted for more than 90 per cent of the industrial imports of these areas. However, the composition of these imports is not known. Several restrictions were imposed on the flow of industrial imports from Jordan and other countries into the occupied territory, leading Palestinian traders to import most industrial goods directly from Israel. Even though data are unavailable on the commodity composition of this flow, it is obvious that this has led to an opening up of substantial trade markets between the occupied territory and Israel covering a wide range of products, especially in industrial subcontracting (see Kahani Elawna 1988) .

- 19 -
Chapter II
MARKETING OF AGRICULTURAL AND INDUSTRIAL PRODUCTS, 1967-1990
This chapter reviews the performance and trends since 1967 in the marketing of West Bank and Gaza Strip goods, including exports. The first section examines the significance of the export of agricultural and industrial products for the economy of the occupied territory. The direction of Palestinian exports is examined in the second section. This is followed by an examination of the composition of agricultural and industrial exports. The final section evaluates the balance of international merchandise trade (with abroad) and import dependency.
A. Significance of merchandise exports from the West Bank and Gaza Strip
During the period 1971-1987, the West Bank's total exports increased considerably, falling again to some $120 million by 1990, as shown in table 2-1. The ratio of exports to GDP fell from 31 per cent in 1981 to 10 per cent in 1990. The ratio of exports to GNP fluctuated annually, peaking at 23 per cent in 1981 and declining thereafter to reach 7 per cent by 1990.
The share of agricultural exports in total exports varied between 20 and 30 per cent during 1971-1985, but declined to under 20 per cent in 1986, as indicated in table 2-1. After 1987, this trend reversed and by 1990, agricultural exports accounted for 23 per cent of total exports. The proportion of industrial exports to total exports fluctuated as well, averaging 77 per cent during 1980-1987 and decreasing slightly during 1988-1990.
The Gaza Strip's exports increased steadily from $27.56 million in 1971 to $190 million in 1982. However, a decline started after 1982, reaching a low of $92 million in 1990 (see table 2-2). The ratios of total exports to GNP and GDP were greater than those in the West Bank, averaging 32 per cent, and 48 per cent, respectively, during 1971-1990. Those figures suggest that the Gaza Strip's economy was more dependent on export markets than the West Bank's.
The share of the Gaza Strip's agricultural exports in total exports varied during 1971-1990, averaging 52 per cent during 1971-1981 and declining to 27 per cent during 1981-1988. However, in 1989 and 1990, the share of agricultural exports in total exports surged to 44 per cent and 49 per cent, respectively.
B. Destinations of agricultural and industrial exports from the Palestinian territory
This section examines the direction of agricultural and industrial exports from the West Bank and Gaza Strip (i.e. excluding trade between the two regions). The market share approach is used to examine the allocation of agricultural and industrial exports between markets. Information on the share of exports to different markets reflects the differential growth in demand and t.he degree of competition faced by Palestinian agricultural and industrial products in these markets. In general. merchandise exports may grow rapidly

- 20 -
if the following conditions are fulfilled (Leamer and Stern): (1) exports are concentrated in commodities for which there is a growing demand; (2) exports are destined primarily for growing markets; and (3) the products compete effectively with those from other sources. These criteria are used to explain the trends in the exports of West Bank and Gaza Strip.
1. Agricultural exports
From 1967, West Bank agricultural exports went to Israel, Jordan and other Arab states, and other regions such as eastern and western Europe. Strict controls were imposed on West Bank trade, resulting in limited access to foreign markets, including those with which Israel could not trade (Roy). Also, as indicated earlier, agricultural trade policies pursued by Israel, Jordan and Arab States restricted the flow of agricultural produce into their markets.
The pattern of West Bank agricultural exports reflects the impact of the alternating cycle of the olive crop. Table 2-3 shows the destination of West Bank agricultural exports, with Israel becoming the main outlet in 1990. During the period 1973-1979, the shares of agricultural exports to the Israeli and Jordanian/Arab markets averaged about 50 per cent each. In the following period 1980-1987, agricultural exports to the Jordanian/Arab and Israeli markets averaged 60 per cent and 40 per cent, respectively. These figures indicate that Jordan and other Arab States became more attractive markets for Palestinian exporters in the early 1980s, owing to growth in demand there. Meanwhile, Israeli trade policies and regulations effectively limited the import of agricultural produce from the occupied territory into Israel. By contrast, Jordan's trade policies were less restrictive, and Palestinian agricultural produce was granted preferential access into the Jordanian markets and through Jordan to the Arab States of the Gulf.
According to Israeli regulations, only products that were needed on a seasonal basis were allowed to be imported from the occupied territory. Therefore, it was not surprising that agricultural exports to Israel exhibited such fluctuations and downward pressure, particularly during 1988-1990 as indicated in table 2-4.
During 1970-1990, West Bank agricultural exports were subjected to growing competition as evidenced by the variation in the West Bank share of total Jordanian and Israeli agricultural imports (see table 2-4). starting in 1984, the Jordanian economy entered a period of slower growth with a compression in food imports that became more difficult to finance. These difficulties led to a decrease in agricultural imports from the West Bank (FAO; Kahan). As far as Israel is concerned, agricultural imports from the West Bank made up an annual average of between 1.1 per cent and 2.6 per cent of total Israeli agricultural imports during 1968-1990.
After 1967, a dramatic change in the direction of the Gaza Strip's trade took place. Within one year of Israeli occupation, trade with Egypt and western Europe ceased, while trade with Israel, Jordan and the West Bank commenced. Trade with eastern European countries resumed as these markets granted preferential access to agricultural produce from the Gaza Strip (Kahan; Roy).

- 21 -
During 1971-1973, exports to eastern European markets accounted for an average of 65 per cent of the Gaza Strip's total agricultural exports, while exports to Jordan and Israel averaged 17 per cent and 18 per cent, respectively (see table 2-5). The high percentage of exports overseas was in fulfilment of contracts in the citrus trade arranged before 1967 with eastern Europe. However, those exports fell to only 18 per cent of the total by 1990. A close look at the Gaza Strip's export patterns during 1974-1987 reveals an increase in exports to and through Jordan. During 1976-1990, around 50 per cent of total ~gricultural exports was channelled to the Jordanian market.
As of 1974, Israel became the Gaza Strip's largest trading partner, followed by Jordan. During 1974-1985, 32 per cent of total agricultural exports went to Israel. However, between 1988 and 1990, Gazans tended to prefer trade with Jordan as prices in Amman central market were higher than those in the Israeli and domestic markets (El-Jafari, 1991a).
Early in the 1980s, the Gaza Strip's agricultural exports to Jordan showed a downward trend, even though Jordan's total agricultural imports increased significantly (FAO). This indicates that it was increasingly difficult for Gaza Strip agricultural exports to compete in Jordanian markets. Marketing costs, such as transportation and sales commissions, were prohibitive (Kahan).
As with the West Bank, the Gaza Strip's share of exports to the Israeli market was small during the past two decades. This is due to the fact that Israel, which produces mainly similar commodities, considers agricultural imports from the occupied territory as a residual. This 11as rendered it difficult for Gazans to improve their competitive edge in the Israeli market.
2. Industrial exports
The markets of Jordan and Israel accounted for 98 per cent of the total industrial exports of the West Bank in 1990. Table 2-3 details the direction of West Bank industrial exports, and clearly shows the importance of the Israeli market. This high level of industrial exports to Israel may be attributed to several factors. Israel encouraged Palestinian firms to produce labour-intensive commodities which were complementary to the Israeli economy. In addition, the restrictions that were imposed on the flow of agricultural produce into Israeli markets prompted Palestinians to market industrial products which generated more revenue (Elawna, 1986a).
Figures in table 2-6 show that Jordanian imports of West Bank manufactures often constituted less than 5 per cent of Jordan's total industrial imports. Since the 1980s, imports of Palestinian manufactured products have been of increasingly marginal significance. Data on the composition of Palestinian manufactured exports to Israel are not available, but these exports constitute an even smaller proportion of total Israeli manufactured imports. However, Israeli imports of certain Palestinian consumer non-durables accounted for over 20 per cent of total Israeli imports of the same categories of goods. This suggests that Palestinian industry was geared to producing certain commodities specifically for the Israeli market through labour-intensive subcontracting.

- 22 -
Since 1967, Israel has been the only importer of the Gaza Strip's manufactured products. Figures in table 2-5 show that the Gaza Strip's industrial exports to Israel increased from 1971 onwards, reaching $134 million by 1983. In the following years, the trend reversed. During 1988-1990 1 with the sharp reduction in subcontracting activities, the Gaza Strip's industrial exports to Israel continued to decrease, reaching $47 million by 1990.
C. Composition and destination of West Bank agricultural exports
Agricultural exports from the West Bank to different markets comprise three major commodity groups: fresh vegetables, fresh fruit and fresh citrus. Owing to the processing of olive oil and pickled olives, these commodities are considered as manufactured exports and accordingly are discussed in section E below. Data on the destination of agricultural goods cover both domestic and external markets. Accordingly, in this and the following section, the use of the term export refers to both external markets and "intraregional" markets (i.e. exports between the Gaza Strip and the West Bank).
1. Fresh vegetables
The trend in exports of fresh vegetables increased during 1970-1982, followed by a decline in the 1983-1990 period. The proportion of fresh vegetable exports out of total domestic production is shown in table 2-7. Despite the steady expansion in domestic production, the West Bank could not sustain a corresponding growth in exports of vegetables due to political and marketing constraints, except for a limited period in the 1980s.
Jordan was an important and growing market for West Bank vegetable exports, accounting for over 75 per cent by the end of the period 1970-1987. However, during 1988-1990, the Jordanian market became much less important to the West Bank: an average of only 16 per cent of total vegetable exports was shipped to this market. The reduction in vegetable exports could be attributed to the effects of restrictive conditions during the uprising. Fresh vegetable exports to the Israeli market increased during 1970-1981 1
after which they started to decline both in value and volume. However, in 1988-1990, there was a marked rise in the volume and proportion of produce exported to Israel (see table 2-7), owing primarily to the collapse of markets in Jordan and beyond.
Since 1976, there has been a decrease in citrus production in the Gaza Strip due to acute problems of salinity, increased input costs and decreased export prices for citrus. This encouraged farmers there to plant vegetables instead of citrus and limited the scope for the marketing of West Bank vegetables there. Meanwhile, the export of Palestinian vegetables to the European Community (EC) markets had to go through the Israeli Agricultural Export Corporation (Agrexco). At the beginning, it was not profitable for growers to export to these markets. But in time, Agrexco offered more competitive prices, and exports increased. Exports of vegetables to EC countries accounted for 10 per cent of total vegetable exports during 1985-1987. Agrexco marketed those vegetables that Israelis could not produce at a certain time. Direct marketing of fresh vegetables to the EC since 1987 has yet to show any significant trend, for a variety of reasons.

- 23 -
2. Fresh fruit
Table 2-9 shows the trend of West Bank exports of fresh fruit. The proportion of fresh fruit exports out of total domestic production was relatively constant during 1970-l990, averaging 45 per cent. The period of slow but steady increase in the value of fruit and citrus exports which occurred during 1970-l982 was followed by a steady decline during 1983·-l990. The decline was attributed to the significant drop in citrus production (Israel, CBS (a)). During 1970-l987, Jordan imported 80 per cent of total
West Bank fresh fruit exports (see table 2-9). Both value and volume of fruit and citrus exports increased steadily until 1982, followed by a stagnation in export volume and a deterioration in export revenues (see table 2-l0) . Meanwhile, exports of citrus and other fruits to Israel varied from year to year, owing to the fact that the flow of agricultural produce into the Israeli market depended on shortages in that market.
West Bank exports of fruit to the Gaza Strip increased over the past two decades. Average export revenue rose from $0.8 million in 1970-l982 to $l.5 million in 1983-l987, or by 82 per cent. Grape exports made up more than 58 per cent of total fruit exports. However, grape exports from the territory showed a slow decline after 1983, as these were replaced by more compet~itive Israeli grapes.
D. Composition and destination of agricultural exports from the Gaza Strip
Fresh vegetables and citrus are the two major agricultural exports of the Gaza Strip, reaching markets in Israel, Jordan, the West Bank, eastern Europe and most recently EC countries.
l. Fresh vegetables
Gaza Strip vegetable exports increased during 1970-l987, constituting an average of 26 per cent of production in the period, and increasing to an average of 30 per cent during 1977-l987 (see table 2-ll). Increased vegetable production in the Gaza Strip slowly replaced citrus production as of 1977.
Vegetables were marketed mainly in Israel and the West Bank. The latter market absorbed more than 50 per cent of exports during 1970-l987. Exports to Israel fluctuated in the 1970s, and started to show a steadily increasing trend during 1983-l987. Exports of the Gaza Strip's vegetables to Israel can be studied in tables 2-ll and 2-l2. These exports increased dramatically in the 1980s, reaching 19,800 tons in 1987 and accounted for 35 per cent of the Gaza Strip's total agricultural exports in that year.
Vegetable exports to the EC accounted for under 4 per cent of total vegetable exports during 1981-l987. Price and quantity conditions for exports via Agrexco constrained exports to the EC.
Table 2-ll shows that the Gaza Strip developed an important market for its vegetable produce in the West Bank. As noted in chapter I, the West Bank imports fresh vegetables from the Gaza Strip and Israel. Some 60 per cent of total West Bank vegetable imports originated in the Gaza Strip during 1981-1987, while the balance originated in Israel.
- 24 -
2. Fresh citrus fruit
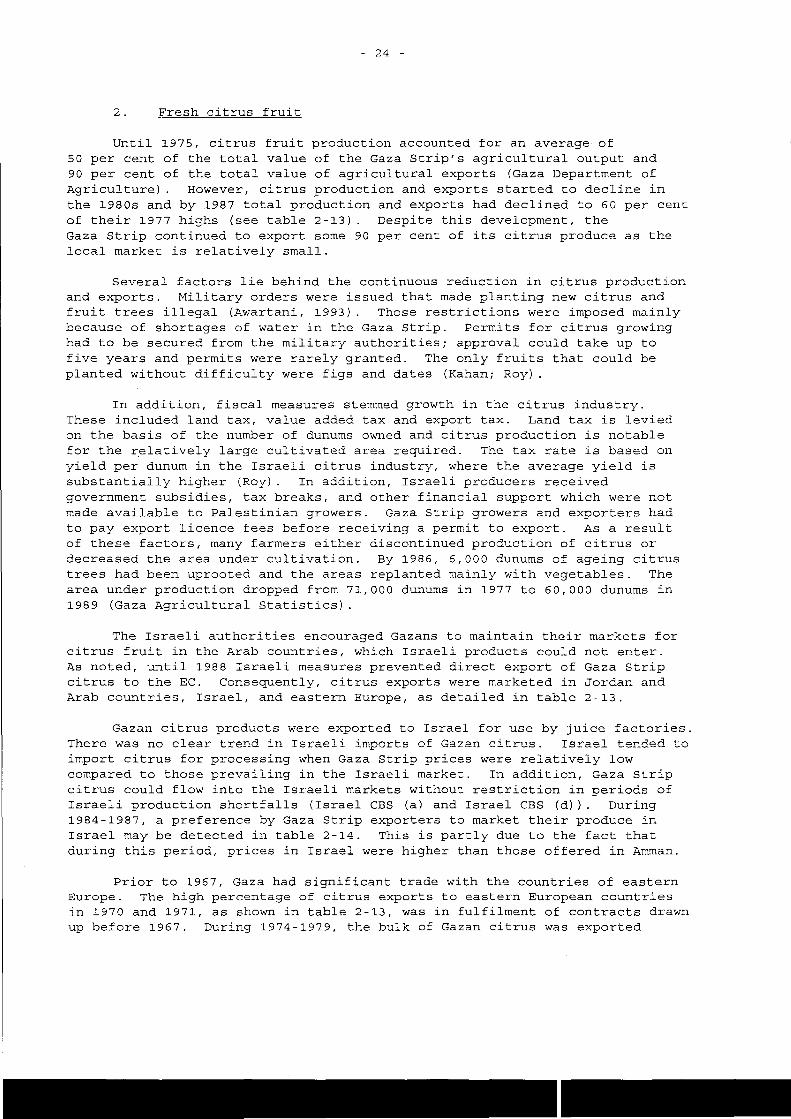
Until 1975, citrus fruit production accounted for an average of 50 per cent of the total value of the Gaza Strip's agricultural output and 90 per cent of the total value of agricultural exports (Gaza Department of Agriculture). However, citrus production and exports started to decline in the 1980s and by 1987 total production and exports had declined to 60 per cent of their 1977 highs (see table 2-13). Despite this development, the Gaza Strip continued to export some 90 per cent of its citrus produce as the local market is relatively small.
Several factors lie behind the continuous reduction in citrus production and exports. Military orders were issued that made planting new citrus and fruit trees illegal (Awartani, 1993). Those restrictions were imposed mainly because of shortages of water in the Gaza Strip. Permits for citrus growing had to be secured from the military authorities; approval could take up to five years and permits were rarely granted. The only fruits that could be planted without difficulty were figs and dates (Kahan; Roy).
In addition, fiscal measures stemmed growth in the citrus industry. These included land tax, value added tax and export tax. Land tax is levied on the basis of the number of dunums owned and citrus production is notable for the relatively large cultivated area required. The tax rate is based on yield per dunum in the Israeli citrus industry, where the average yield is substantially higher (Roy). In addition, Israeli producers received government subsidies, tax breaks, and other financial support which were not made available to Palestinian growers. Gaza Strip growers and exporters had to pay export licence fees before receiving a permit to export. As a result of these factors, many farmers either discontinued production of citrus or decreased the area under cultivation. By 1986, 6,000 dunums of ageing citrus trees had been uprooted and the areas replanted mainly with vegetables. The area under production dropped from 71,000 dunums in 1977 to 60,000 dunums in 1989 (Gaza Agricultural Statistics) .
The Israeli authorities encouraged Gazans to maintain their markets for citrus fruit in the Arab countries, which Israeli products could not enter. As noted, until 1988 Israeli measures prevented direct export of Gaza Strip citrus to the EC. Consequently, citrus exports were marketed in Jordan and Arab countries, Israel, and eastern Europe, as detailed in table 2-13.
Gazan citrus products were exported to Israel for use by juice factories. There was no clear trend in Israeli imports of Gazan citrus. Israel tended to import citrus for processing when Gaza Strip prices were relatively low compared to those prevailing in the Israeli market. In addition, Gaza Strip citrus could flow into the Israeli markets without restriction in periods of Israeli production shortfalls (Israel CBS (a) and Israel CBS (d)). During 1984-1987, a preference by Gaza Strip exporters to market their produce in Israel may be detected in table 2-14. This is partly due to the fact that during this period, prices in Israel were higher than those offered in Amman.
Prior to 1967, Gaza had significant trade with the countries of eastern Europe. The high percentage of citrus exports to eastern European countries in 1970 and 1971, as shown in table 2-13, was in fulfilment of contracts drawn up before 1967. During 1974-1979, the bulk of Gazan citrus was exported

- 25 -
through Jordan to Iran and Arab countries in the Gulf, where better prices were available (Gaza Strip Agricultural Statistics). This trend continued through the 1980s. Gazans entered into barter arrangements with some eastern European countries, exchanging citrus for commodities such as sheep, wood, and crystal, for which they were charged duties. The declining benefits of such arrangements, coupled with marketing problems and changing market demand, rendered these markets increasingly marginal.
The West Bank, which itself specialized in the production and export of varieties of citrus similar to those produced in the Gaza Strip, was not an important market for Gazan citrus. Gazan produce often had to compete with that of the West Bank as the latter had easier access to Israeli and Jordanian markets (The West Bank Agricultural Statistics; Kahan).
3. Other fresh fruits
Other major fruit crops in the Gaza Strip are rain-fed guava and dates. The cultivated area of these fruit trees had reached 54,000 dunums in 1975 though by 1986 it had declined to 45,500 dunums (Gaza Strip Department of Agriculture). The plantation of guava increased as exports to Jordan rose. Also, military authorities issued permits to plant dates, usually without difficulty (Roy).
However, owing to constraints on water use and cultivable area in the Gaza Strip, fruit orchards have declined in favour of vegetable production. The overall level of fruit production declined over the years, from a peak of 26,000 tons in 1972 to 13,700 tons in 1987. Fruit production averaged 20,500 tons in the 1970s, but by 1987 it had dropped to around 14,000 tons, a decrease of 32 per cent, as shown in table 2-15.
Dates and guava exports were shipped to three major markets: Jordan, Israel, and the West Bank. Fruit exports decreased from an annual average of 9,400 tons in the 1970s to 8,100 tons in the 1980s, a decrease of 14 per cent. Despite the declining level of fruit production, the proportion of exports to total domestic production grew from an average of 46 per cent in the 1970s to 52 per cent in the 1980s (see table 2-15) .
Revenues from fresh fruit exports to the Jordanian and Arab markets increased significantly during 1985-1987 to reach an annual average of $2.3 million as compared to an average of $0.5 million during 1970-1984. This increase could be attributed to a rapid increase in demand for guava accompanied by its relatively higher price (see table 2-16). Exports of guava and dates to Israel increased over the period 1970-1982, but declined afterwards (see table 2-16), owing mainly to increased Israeli domestic production to meet the demand for these fruits (Israel CBS (a)).
After increasing until the mid-1970s, West Bank demand for Gaza Strip fruit showed a steady decline until 1987 (see table 2-15). The value of fruit marketed in the West Bank accounted for 40 per cent of total fruit export revenues during the 1970s, but declined to 28 per cent in the 1980s. For fresh fruit exports, the West Bank was a smaller market than either Israel or Jordan.

- 26 -
E. Composition and destination of industrial exports
Palestinian manufactured products are exported to Israel and Jordan. Israel accounted for 70 per cent of the West Bank's industrial exports and all of the Gaza Strip's industrial exports. This section surveys the limited available data on West Bank industrial exports to Jordan, in addition to the broad trends of West Bank and Gaza Strip exports to Israel (for which disaggregated data are not available) .
1. West Bank industrial exports to Jordan
Manufactured exports from the West Bank to Jordan increased over fourfold during 1971-1981 (see table 2-17). The fluctuation in annual olive oil production gave rise to annual oscillation in export earnings. Olive oil and pickled olives contributed between 20 per cent and 56 per cent to total industrial exports almost every year. Exports of Samna (margarine), dairy products, soaps and stone showed a steady increase over the past two decades, averaging 50 per cent of total industrial exports.
Since 1967, in accordance with the League of Arab States boycott, Jordan imposed several restrictions on the entry into and passage through Jordan of manufactured products from the West Bank. All raw materials used in production had to originate in the West Bank or be imported from or through Jordan. Almost 50 per cent of manufactured goods in the West Bank and Gaza Strip are agriculturally based: olive oil, pickled olives, Samna and dairy products. Other products manufactured are labour-intensive goods such as leather goods and plastics, though all utilizing raw materials/inputs procured from or via Israel.
With the start of the construction boom in 1984 in Jordan, exports of stone to Jordan increased dramatically. While accounting for under 5 per cent of total industrial exports during most of the 1970s and early 1980s, exports of stone products surged during 1984-1987, reaching 20 per cent of total industrial exports. However, in 1988, the West Bank's manufactured exports to the Jordanian markets receded, and by 1990 the level of such exports had fallen to a third of its 1986 level. The devaluation of the Jordanian dinar, declining construction activity in Jordan and the severance of the legal and administrative ties between Jordan and the West Bank are the main reasons for this fall.
2. West Bank and Gaza Strip industrial exports to Israel
The value of industrial exports from the occupied territory to Israel increased dramatically during the 1970s and early 1980s. Between 1970 and 1987, total industrial exports increased from $15.6 million to $239 million (see table 2-18). Data on the composition of industrial exports are not available, though each region specialized in traditional products or those in which it had a particular labour-cost advantage. The West Bank specialized in exporting perfume, furniture and household equipment, clothing and footwear, alcoholic beverages, and food products. On the other hand, the Gaza Strip's industrial exports consisted of semi-finished construction materials, clothing and bamboo products. As noted, a common characteristic of exports from the West Bank and Gaza Strip to Israel, is labour-intensive production. As labour was cheaper in the occupied territory, Israel viewed those products as

- 27 -
complementary to its own industrial output. Only in the past few years have Palestinian industrial producers been able to combine labour cost advantages and production technique enhancements to produce more sophisticated goods that could compete successfully in Israel.
F. Merchandise trade balance
The balance of payments on current account is an important indicator of the robustness of an economy. The merchandise trade balance is a major component of the current account and is reviewed in this section.
During most of the period after 1967, the balance of international merchandise trade of the West Bank (i.e. excluding trade with the Gaza Strip) was characterized by a persistent deficit, which increased from $34 million in 1968 to a high of $411 million in 1987. This gap narrowed in 1988 and 1989 only to widen again to reach $366 million in 1990. The deterioration in 1990 can be attributed to the adverse turn in economic conditions resulting from the Gulf crisis, compounded by the cumulative effects of restrictions during the intifada on production and exports, notwithstanding significant import compression (see table 2-19) .
The trade balance in goods with Jordan has been positive since 1967. The persistent surplus was due to the continuous increase until the mid-1980s in the West Bank's industrial and agricultural exports to and through Jordan. On the other hand, Jordan's exports to the West Bank were constrained in favour of Israeli agricultural and industrial exports.
The trade deficit with Israel increased continuously over the years. With the outbreak of the intifada in 1987, imports from Israel tended to decline, owing especially to the fall in external income from Israel and abroad. At the same time, Palestinians t.ried to formulate new economic and trade relations with Israel, intensifying their efforts to expand their productive base and limit their dependence on Israel.
From 1968 onwards, the merchandise trade deficit between the West Bank and the rest of the world (i.e. via Israel) rose at an increasing rate until 1980 and continued at about the same level thereafter. Data indicate that the deficit in the trade of industrial goods was on average around ten times that of the deficit in agricultural trade during 1968-1990 (see table 2-19). More than 80 per cent of imports of manufactured goods were for final consumption, which grew as Palestinian industry was not able to manufacture such goods at competitive prices.
As in the West Bank, the merchandise trade balance of the Gaza Strip also showed an increasing deficit during 1968-1990. In 1968-1981, the trade deficit increased erratically, while during 1983-1987 it doubled to $245 million in 1987. Starting in 1987, this trend was reversed (Central Bank of Israel). Figures in table 2-20 indicate that the trade balance with Jordan was in surplus as the Gaza Strip only exported to Jordan. On the other hand, the trade balance with Israel was consistently unfavourable to the Gaza Strip. The magnitude of the Gaza Strip trade balance deficit with the rest of the world was not so great and tended to decrease between 1988 and 1990.

- 28 -
Chapter III
POLICY AND INSTITUTIONAL FRAMEWORK AFFECTING MERCHANDISE TRADE
The principal laws and regulations, including Israeli, Arab and other policies, affecting domestic and external trade are reviewed in this chapter. The institutional framework of the trade sector, as well as procedures that influence the marketing of Palestinian agricultural and industrial products are also discussed. While references are made to the situation that prevailed under Israeli occupation as from 1967, most aspects were still pertinent on the eve of the Israel-Palestine accords of 1993.
A. Laws and regulations affecting domestic trade
The legal framework regulating Palestinian economic activity in general, and trade in particular, is outdated, complex and yet inadequate, and characterized more by disincentives than by elements that would promote economic growth and development. Only since 1992 has it been possible to discern serious efforts by the authorities to streamline and improve the policy and procedural framework affecting Palestinian merchandise trade.
1. Business licensing
At the onset of occupation, business licensing in the West Bank and Gaza Strip was restricted on grounds of economic security (Arab Chamber of Commerce). Licences were generally granted to those industries producing commodities that either complemented Israeli output or utilized raw and intermediate materials imported from Israel (often through subcontracting relations). In compliance with these regUlations, the establishment and expansion of foodstuff, dairy product and textile industries was encouraged in the West Bank and Gaza Strip. Permission was not granted to produce basic goods such as cement and primary chemicals, despite the fact that the raw and intermediate materials for their production were abundantly available in the West Bank. It has been estimated that domestic production of such goods could save the West Bank and Gaza Strip imports valued at $10 million annually (Elawna 1986a). In the eighties, many licences were granted to establish foodstuff factories, thus absorbing some of the unemployed labour in the occupied territory and increasing the Israeli exports of raw materials. In 1992, some elements of previous policies regarding licensing were reversed, leading to an upsurge in licensing of new factories and businesses in 1992 and 1993. The impact of new businesses on domestic and external trade remains to be seen.
2. Product standards
Industries can be successful in the long run only if they are competitive internationally in terms of price and quantity, reflecting economies of scale. It is hard to measure the impact of standardization, metrology and quality control on the economy in exact figures, but it is apparent that standardization and quality control are important factors in the competitiveness of products both in domestic and international markets.

- 29 -
There is no standards bureau as such in the occupied Palestinian territory. However, several large industries in the foodstuffs, soft drinks, plastic products and pharmaceuticals branches became aware of the advantages of standardization and quality control, and established their own laboratories in the 1970s and 1980s. Standardization paid off; domestic demand for their products rose, as did their market share in Israel. However, to restrict the flow of Palestinian products into the Israeli market and protect Israeli manufacturers and consumers, in the mid-1980s the Israeli Ministry of Industry and Trade tightened labelling regulations on beverages and foodstuff imported from the occupied territory, as Israeli producers had complained that Palestinian goods were competing with their products (Bahiri).
3. Fiscal requirements
Although taxation generates revenues for central and local authorities, if not properly conceived it can under certain circumstances constrain the growth of industries and price their products out of the market. In the occupied territory, income tax, product tax, value added tax, and property tax are levied. Starting in 1967, Israeli occupation authorities introduced several changes in the Jordanian and Egyptian tax legislations prevailing in the West Bank and Gaza Strip, respectively, designed mainly to increase tax revenue (Elawna 1986a) .
The tax system that has emerged suffers from numerous anomalies and shortcomings, and appropriate tax exemptions or fiscal incentives to stimulate the private sector do not exist. Since 1967, tax revenue has regularly surpassed government expenditure in the occupied territory (Elawna 1986a) Furthermore, many factories, particularly small ones, suffer from poor accounting systems and unfamiliarity with taxation procedures. With no knowledge of the Hebrew language, manufacturers have not been able to deal with these regulations bearing their business interest in mind. Aggravated by a rise in domestic prices, high tax rates had forced many factories to close down by the mid-1980s (Kattan). Israeli producers meanwhile received direct and indirect subsidies, which Palestinian growers and producers could not take advantage of. These included insurance schemes that cover risks faced by individual farmers and manufacturers. This unfavourable situation affecting Palestinian producers provided an additional disincentive to expand and diversify both domestic and external merchandise trade.
4. Marketing of goods
Until 1987, the distribution and marketing of domestically produced agricultural and industrial goods in the local markets (excluding east Jerusalem) did not require licensing. Interregional trade between the West Bank and Gaza Strip developed in agricultural products and, as noted in the previous chapters, the Gaza Strip succeeded in gaining access to West Bank markets. The flow of agricultural products from the Gaza Strip to the West Bank was not subject to restrictions, although permits from the Department of Agriculture had to accompany the shipment. However, marketing of Palestinian products in east Jerusalem and Israel required licences from the Israeli civil administration in the occupied territory as well as from the 1-1inistries of Agriculture, Industry and Commerce in Israel. Since the Palestinian uprising, further restrictions were imposed on trade between the

- 30 -
West Bank and Gaza Strip such as lengthy and cumbersome licensing procedures and security and tax clearances (EI-Jafari 1991b).
B. Laws and regulations affecting external trade
1. Israeli measures
Prior to 1967, the Gaza Strip merchandise exports were shipped to Europe, and no trade existed with Israel, Jordan or the West Bank. Only West Bank agricultural and industrial exports found their way into markets in Jordan and the Arab countries of the Gulf. From 1967, the trade patterns in the West Bank and Gaza Strip changed dramatically. Within one year of occupation, trade with western Europe came to a halt. The "open bridges" policy adopted after 1967 was in one direction only, generating exports from the occupied territory to the Arab countries, with strict restrictions on imports from that direction. Palestinian growers and producers were increasingly subjected to Israeli trade policies and imperatives, primarily designed to protect its agriculture and industry, minimize competition from Palestinian products in common markets and secure a Palestinian market for a range of Israeli exports.
Until 1987, Palestinian agricultural exports to western Europe had to be channelled through Agrexco, a cooperative owned by Israeli farmers which specializes in exporting fruit, vegetables and flowers. In many respects, Agrexco is empowered with sweeping authority as regards Israeli agricultural exports to the EC. While Palestinian growers could contract with Agrexco for exports to the EC, priority was generally given to Israeli agricultural produce and Agrexco imposed quotas on the type and volume of produce that could be exported from the West Bank and Gaza Strip. Accordingly, only 5 per cent of total Palestinian agricultural production was channelled to the EC through Agrexco. Products permitted under the quota included cucumbers, eggplants and strawberries. Those limitations are based on the need to maintain standards and the value of produce which may be in direct competition with Israeli exports (report of a Netherlands Government mission) .
Palestinian exporters perceived the disadvantages of being compelled to market through Agrexco and preferred to export their produce to the EC directly. Negotiations took place in 1986 and 1987, leading to an agreement between the Commission of the European Communities, the Israeli Government, the Agricultural Cooperative Union in the West Bank and the Benevolent Society of Gaza in 1988. Beginning in 1989, the first exports were shipped directly to the EC from the occupied Palestinian territory.
A range of measures were taken to prevent the marketing of Palestinian agricultural and manufactured products in Israel. Quotas imposed on the West Bank and Gaza Strip agricultural and industrial exports were lifted when Israeli suppliers could not meet local demand. Israeli agricultural and industrial products entered the occupied territory with no restrictions. To observe restrictions on the flow of Palestinian products, security controls were regularly imposed on routes leading into Israel. These controls took place after the fruit, vegetables and other products had been packed and labelled, causing undue delays that often damaged the contents of shipments. All unauthorized products were confiscated or destroyed and the exporter was fined. Only in the post-1993 situation will such measures be phased out, while still allowing for the necessary quality and health controls.

- 31 -
Exports from the West Bank and Gaza Strip to Israel, Jordan and the EC markets required licences from the Departments of Trade and Industry, which were run by Israeli officers. Before getting the export licence, Palestinian exporters had to submit a document proving that they had paid taxes in full. The issuing of export licences to market Palestinian produce in Jordan was rather lenient, and marketing firms were often offered a blanket export permit for several shipments. In contrast, permits for exports to Israel were more rare, granted only after approval by the Ministry of Commerce and Industry, the Agricultural Marketing and Production Board, and the civil administration. These regulations restrained the flow of goods into Israel, unless there were shortages for the local or export market. As mentioned earlier, until 1987 export permits to market Palestinian agricultural produce abroad via Israel were issued only through Agrexco (Jericho Department of Agriculture; Chamber of Commerce - East Jerusalem) .
On the other hand, import permits were not restrictive as long as the goods were not produced in Israel, or imported by Israeli agents. Therefore, import permits were granted to Palestinian merchants within the context of Israeli trade policies and procedures (UNCTAD, 1989).
2. Jordanian regulations
A quota is a powerful non-tariff trade barrier. It is a direct quantitative restriction on the amount of a commodity that can be imported in a given time period. As soon as the specified amount has been imported, further imports are prohibited for the rest of the period. Quotas were imposed by Jordan on the entry of Palestinian products, with a ceiling of some 50 per cent of total West Bank agricultural produce authorized to flow into the Jordanian markets for domestic consumption or in transit to neighbouring markets. The 1981 trade regulations issued by Jordan in compliance with the provisions of the Arab League boycott of Israel stipulated the following for Palestinian exporters (Alanani): (a) 60 per cent of total West Bank citrus was allowed in the Jordanian market; (b) up to 750 tons of cheese could enter Jordan; (c) any shortfall in production of olive products (oil and pickled) in Jordan was secured from the West Bank; (d) 70 per cent of total nursery production was allowed to be marketed in Jordan; and, (e) 50 per cent of all other agricultural produce was allowed into Jordan. Palestinian growers continued to enjoy this preferential access until August 1988, when Jordan severed its legal and administrative ties with the West Bank.
On the other hand, permits for the entry of goods from the West Bank depended on specific shortfalls in the Jordanian market. As far as the Gaza Strip was concerned, Jordan permitted 160,000 tons of citrus to be imported annually (equivalent to some 85 per cent of the Gaza Strip citrus production). While up to half of the domestic output of grapes, dates, guavas and strawberries could enter Jordan, fresh vegetables from the Gaza Strip could not enter or transit through Jordan (Alanani; Kahan).
Transportation into Jordan was regulated by the Jordanian authorities. Only a limited number (450) of open trucks were permitted to cross the bridges. These were all licensed before 1967 in the West Bank and Gaza Strip, and were not capable of loading agricultural exports efficiently and regularly. The complex transport arrangements were further exacerbated by Israeli security measures regarding technical specifications of vehicles

- 32 -
permitted to cross into Jordan, the method of loading and strict time limits on the delivery of loads and return to the occupied territory.
C. Certificates of Palestinian origin
During the 1970s and 1980s, the flow of Palestinian agricultural and industrial goods into Jordan required a certificate of origin issued by local chambers of commerce and officials of the Jordanian agricultural authority. The purpose of the certificate was to prove that the goods were produced domestically and that the raw materials used in their production were not supplied by Israel. In effect, Palestinian industrialists had to import raw materials from or through Jordan to be able to re-export to Jordan and other Arab countries. Compliance with conditions of the certificate allowed goods manufactured in the occupied territory to be re-exported to any Arab State, carrying a Jordanian certificate of origin.
However, it became difficult for Palestinian exporters to meet the conditions for certification due to many reasons, including the continuous increase in transportation costs and the delay in the provision of raw materials resulting from security checks at the border. Tariffs imposed by the Israeli authorities also limited imports through Jordan of raw materials. The Palestinian chambers of commerce, businessmen and municipalities negotiated with the Jordanian authorities to lift restrictions on the import of raw materials through Israeli ports, and succeeded by the mid-1980s. It then became possible to receive certification of domestic origin even if some raw materials imported through (but not from) Israel were included [Elawna, 1986a].
D. Labels and standards
1. Labels
Goods from the occupied territory must have labels in English, Arabic and Hebrew if they are to be marketed in Israel. Improperly labelled goods are confiscated. Bilingual Arabic and English labelling is required when manufactured products are exported to Jordan and other Arab countries. Labels indicate name of producer, origin, weight, and ingredients, particularly in the case of foodstuffs and soft drinks. Israeli authorities did not allow exporters from the occupied territory to label their product as originating in the West Bank or Gaza Strip. Instead, the name of the city of origin was allowed to appear on the label.
2. Standards
Standards protect consumers and upgrade the quality of products, making them competitive in international markets. Standardization is closely linked to legal as well as industrial and scientific metrology. As indicated above, many Palestinian factories have established their own laboratories to perform the required tests. Foodstuff, beverage and pharmaceutical industries have developed standards for their products to meet the needs of local consumers, thus increasing demand. In the past several years, many industries participated in exhibitions demonstrating developments in their products. In one study on manufacturing in the Bethlehem area, it was found that quality and adherence to standards had improved significantly over time (Kattan).

- 33 -
E. Fiscal measures affecting external trade
Several tariff and non-tariff trade barriers were imposed under occupation which limited the flow of products from abroad into the occupied territory. Such trade policies were geared to decreasing Palestinian import demand from abroad, thus increasing their dependence on Israel. The imposition of Israeli tariff rates on goods imported to the occupied territory from Jordan or via Israel led directly to an increase in the prices of imported commodities relative to identical goods produced in Israel. As of 1976, an ad valorem tariff of 15 per cent was levied on imports from abroad to Israel and to the territory. Duty on imported merchandise averaged 3 per cent of total import value. Further, another tax, "purchase tax" was collected on the value of goods imported to or through Israel, amounting to an average of 16 per cent of total import value (UNCTAD, 1989).
There are no taxes on Palestinian exports and, as such, export taxation per se has not been an obstacle to the flow of Palestinian products to external markets (Elawna, 1986a). Nevertheless, Palestinian agricultural and industrial exports to and through Jordan are subjected by the Israeli authorities to a range of permit and transport-related fees. Coupled with other costs and administrative constraints, these have rendered Palestinian agricultural and industrial exports more expensive in Jordanian and other markets, where they have gradually lost their competitive edge.
F. Measures to protect domestic producers
The close links that developed between the economies of the West Bank and Gaza St.rip and that of Israel and, to a lesser degree, of Jordan, prompted the latter countries to devise policies to protect their producers. Furthermore, the occupied territory lacked a central authority that could enact fiscal measures, resulting in forgone revenues for the occupied territory and a competitive market for Israeli products (Kahan). No direct or indirect fiscal or other incentives were available to support Palestinian agricultural or industrial establishments.
Palestinian producers were willing to accept smaller profits, lower wages, and lower rents to compete with Israeli and foreign goods. At the outbreak of the uprising in December 1987, Palestinians initiated concerted efforts to reduce the dependency of the occupied territory on the Israeli economy. They intensified domestic development by expanding cultivation, rearing poultry, raising cattle and establishing small factories (the so-called "local economy"). Data on external trade of the occupied territory (see chapter I) indicate that merchandise imports from Israel increased during 1968-1987, decreasing afterwards as part of an import compression spurred by falling incomes and import-substitution measures aimed at enhancing Palestinian self-reliance.
G. Major developments in the trade policy environment since 1987
From December 1987 onwards, the export of Palestinian agricultural and manufactured products faced new difficulties. As of 1988, Jordanian imports from the West Bank and Gaza Strip decreased sharply while Israeli imports of Palestinian products also declined, as did Palestinian imports from Israel. This contraction in Palestinian external trade could be attributed to several

- 34 -
political and economic developments: (i) the outbreak of the uprising in the West Bank and Gaza Strip and the subsequent deterioration of security; (ii) the severance of Jordanian legal and administrative ties with the West Bank; (iii) the rapid devaluation of the Jordanian dinar, starting in September 1988; and, (iv) the Gulf crisis of 1990/1991 and the ensuing impact on the occupied territory.
1. Palestinian uprising in the West Bank and Gaza Strip
Even though the Palestinian uprising in the West Bank and Gaza Strip was in essence a political development, a range of economic measures were imposed to maintain control or quell disturbances. On the other hand, the Palestinian policies espoused after 1988 laid special emphasis on disengagement from the Israeli economy, including trade relations (especially imports from Israel and export of labour). The close ties between the Palestinian economy and Israel rendered such economic measures (both Israeli and Palestinian) especially effective. Several studies have dealt with the impact of the uprising on the economy of the occupied territory, but none has quantified the burden of Israeli measures and the costs and benefits of Palestinian self-reliance initiatives, owing to the non-availability of accurate and comprehensive data on economic activities after 1987 (Shunnar; Rigby; Elawna 1989). The economic measures imposed by Israel from 1988 with a direct impact on Palestinian merchandise trade included: (i) curfews on rural areas, thus preventing growers from harvesting agricultural produce at the proper time and supplying it to domestic and/or external markets; (ii) uprooting fruit and olive trees; (iii) new restrictions on the flow of domestic products into the Israeli and Jordanian markets, causing domestic supply surpluses and reduced prices; (iv) increasing security controls to restrict the flow of unlicensed agricultural and manufactured products into Israel; and, (v) restrictions on the transfer or repatriation of funds from abroad. These exchange restrictions discouraged many growers from promoting their products abroad. Waivers on the amounts of transfers permitted could be obtained but the process was cumbersome and often fruitless. These measures began to be gradually reduced, and some were cancelled, as from 1991.
2. Severance of Jordanian legal and administrative ties with the West Bank
In July 1988, the Jordanian Government announced the severance of legal and administrative ties which had been in effect since 1950 with the West Bank and introduced new regulations on the flow of Palestinian products into its markets, as follows: (i) entry of goods from the West Bank and Gaza Strip was dependent on specific shortages in the Jordanian market; (ii) the Jordanian authorities would determine the type and quantities of products that could enter and the periods when produce could be transported; (iii) West Bank agricultural produce could be exported directly through Jordan to other Arab countries, but needed a permit to be sold in the local market; and, (iv) Gaza Strip citrus exports were also allowed to transit through Jordan but not to enter domestic markets. These new restrictions had an impact on grape, banana, water-melon and olive growers in the West Bank and led to the saturation of domestic markets, which depressed the prices of these crops. Industrial exports to Jordan were not affected by the new situation.
- 35 -
3. Devaluation of the Jordanian dinar
After maintaining its value vis-~-vis international currencies for many years, the LTordanian dinar commenced a sharp decline in April 1988 (International Monetary Fund). In an attempt to correct the structural imbalance which emerged in the current account, the Jordanian Government resorted to devaluation to promote exports and make ilnports less attractive (Chacholoiades) .
As a result of these developments, domestic prices of agricultural and manufactured products tended to be lower in the Jordanian market than in the Palestinian market. In addition, exporters were paid in Jordanian currency. Due to the continuous devaluation of the Jordanian dinar at that time, Palestinian producers preferred to market their goods locally, or in Israel if possible, to avoid great losses. In the 1989 season, agricultural exports to Jordan were especially depressed, as prices were relatively higher in the local market.
4. Gulf crisis of 1990/1991
The Gulf crisis that erupted in August 1990, with its ramifications rapidly felt in the occupied territory, had an immediate and severe impact on Palestinian domestic and external economic activities. This included disruption of all Palestinian trade and financial links with countries of the region, a highly unstable security situation affecting all marketing activities, continued declines in income from external services (especially transfers from abroad and factor income from work in Israel and the region) , and the almost total cessation of economic activity for the first quarter of 1991. While considerable immediate losses were made until the middle of 1991, other effects of the crisis lingered much longer, especially the closure of regional markets for Palestinian goods and the loss of private and public transfers to the territory from the region. Only with the post-1993 developments have new prospects emerged with regard to re-establishing healthy economic relations between the Palestinian economy and its traditional Arab partners.
H. Agricultural marketing facilities and institutions
1. Domestic wholesale and retail channels
Fresh output from farms is channelled to the central municipal markets in the West Bank and Gaza Strip. Many producers also function as wholesalers. They transport produce to the central markets to sell to retailers or commission agents. In the West Bank and Gaza Strip, more than 70 per cent of total agricultural domestic consumption is exchanged through central markets. However, there has been a significant increase in farm produce being sold at roadside stands, where growers act as retailers. In short, farm-gate, wholesale and retail functions of agricultural marketing are intertwined. This is due to the enormous expense of transporting, processing, grading, storing and selling goods (Kahan; Awartani; l!1'l"CTAD 1989) .
In the Gaza Strip, commission agents perform a variety of functions, including providing credit to farmers, determining farm-gate prices and transporting produce to packers. 1~ese middlemen possess monopolistic power

- 36 -
in the marketing of citrus (Citrus Producers Union for the Gaza Strip) . Cooperative societies in the occupied Palestinian territory have played a growing role in marketing agricultural produce in both the local and export markets. In the Gaza Strip, four agricultural cooperatives concentrate their efforts only on marketing functions (UNCTAD, 1989). The cooperative society of Deir al-Balah in the Gaza Strip arranges direct shipments of vegetables to EC markets. In the West Bank, the Agricultural Cooperative Union issues certificates of origin for farm products channelled to the J-ordanian markets. The Amman Central Market has played an important role in linking Palestinian exporters with Jordanian wholesalers for a lO per cent commission on the total value of each shipment, thus stimulating the flow of Palestinian products to Jordan or through Jordan to Arab countries.
In the West Bank and Gaza Strip, membership in growers' associations is voluntary. Associations have no control over production, their main function being to obtain a consensus among growers with respect to prices. For agricultural commodities such as citrus, contracts are signed between the growers and marketing companies which guarantee an agreed price, while the association ensures that agreed quantities of citrus are delivered. For other crops such as vegetables, growers allocate their production between the domestic retail market and export markets through agricultural cooperative societies.
2. Cooperative societies
By 1989, there were 200 cooperative societies in the West Bank (organized in district level associations) and four in the Gaza Strip. In 1988, eight district cooperative societies in the West Bank merged to form the Agricultural Cooperative Union. This step was aimed at improving the efficiency of those societies in the marketing of agricultural products, primarily in Jordan and other Arab countries. In 1988, the Union faced many problems in marketing West Bank produce in the EC as it lacked the necessary technical and managerial skills, contacts, and financial facilities. As a liesult, fruit and vegetable exports to the EC were handled later solely by one member society, the Jericho Cooperative Society, which was best equipped and organized and received technical assistance from the EC in the context of its initiative to support direct marketing of Palestinian products.
In the Gaza Strip, cooperative societies succeeded in improving their performance in marketing agricultural products, as they received financial and technical assistance from international non-governmental organizations. By 1986, three cooperatives in the Gaza Strip had signed contracts with importers from western Europe to ship vegetables and citrus directly. However, obtaining export licences from the civil administration remained the main obstacle to export to the EC. For example, in 1989, it took one exporter two weeks to get a permit for a 25,000 tons shipment of Gazan tomatoes to the EC (UNCTJI.D, 1990).
3. Quality/health control
Health and quality regulations can be so strict as to virtually stop transnational exchanges of foodstuffs and farm products (Chacholoiades). Labelling regulations pertaining to fruit and vegetables vary from country to country. Although these regulations are designed to ensure the quality of the

- 37 -
products and protect the consumer, they can hamper international trade. Health regulations may be viewed as non-tariff barriers to agricultural trade.
Aside from veterinary inspection and some standard health controls enforced in agricultural production by the civil administration, Palestinian products have been subject to inadequate quality and health control. This has applied to domestically marketed goods as well as exports to Israel and Jordan. While produ~ers are generally aware of the benefits that such controls may bestow, such services were lacking at the government level. As of 1989, Palestinian farm products channelled to the EC were subject to EC health regulations, including certification to guarantee the sanitary conditions of imported plants and fruit (Gaza Department of Agriculture; Agricultural Cooperative Union). Such insistence on application of international health and quality standards is an important incentive to their more rigorous and widespread application in the Palestinian territory. Much remains to be done in this domain.
4. Post-harvest treatment, grading and packing
In the West Bank and Gaza Strip, there is no complete system for the selection, grading and packing of fresh fruit and vegetables. At the farm, growers select produce which is not defective before packing. Packing, at present, is done mainly in wooden boxes which are not of adequate quality and often damage the produce in transport. As far as packing material for exports is concerned, the West Bank and Gaza Strip have been faced with a dilemma since 1967. In compliance with the boycott regulations of the League of Arab States, Jordan did not allow the produce to be packed in cartons supplied by Israel. The West Bank had only one cardboard plant, which was not sufficient. In addition, the raw materials which are imported through Israeli ports, must be accompanied with certificates of origin stating that they have originated outside Israel. In 1989, Jordan allowed Palestinian agricultural exports to be packed in cartons, which are preferred internationally and cost less than wooden boxes. The Citrus Producers Union in the Gaza Strip arranged with carton factories in Cyprus to supply boxes (Citrus Producers Union for the Gaza Strip) .
The grading and packing of citrus products in the Gaza Strip was carried out in a different manner, owing in part to the specific needs of citrus exports (waxing, refrigerated storage, etc.) and the different scale of operations in the citrus industry. Within the Gaza Strip, there were seven citrus packing houses registered in 1990. These firms vary in size, and are not very effective. Established in the 1960s, these packing houses still face a range of technical problems (An-Najah University; Alanani; Citrus Producers Union for the Gaza Strip) .
5. Storage, including refriqeration
Investment in storage facilities, including cold storage, is an absolute necessity for modern marketing requirements. These facilities contribute to: adjusting the annual agricultural supply of fresh fruit and vegetables, extending the marketing period for these perishable products so that they are available to consumers during most of the year, and reducing export price fluctuations.
- 38 -
In the West Bank and Gaza Strip, cold storage facilities are not up to the required level of performance and capacity. Most facilities are obsolete and capacity is still limited. In 1990, there were eight cold storage facilities, with a capacity of 6,000 cubic metres. More such facilities are needed to stabilize prices of agricultural products. In addition, many wholesalers rent cold storage space in Israel to adjust their sales in local markets. The setting up of modern cold storage facilities requires a huge capital outlay. This is aggravated by the high cost of borrowing capital and the lack of credit facilities to farmers. In addition, the measures and regulations which were adopted by Israel and Jordan regarding the type and quantity of produce that can enter their countries and the time when produce can be transported during each season, made major investments in storage facilities unattractive (Alanani).
6. Promotion and market information
Palestinian agricultural market promotion activities have been minimal. Domestically, no information is made available regarding demand. Processors and exporters appear to be quite unenthusiastic about market promotion programmes. Recently, the Agricultural Cooperative Union of the West Bank established a service to collect information about prices and shipments to wholesale and export markets. Such information is necessary for growers, exporters and local markets on a daily basis so that markets can clear efficiently. In 1992, a Palestinian Trade Promotion Organization began limited operations in the West Bank and abroad, though its capacity and scope of activities cannot accommodate all the complex needs of Palestinian export trade.
In the West Bank and Gaza Strip, efforts have intensified since 1988 to promote sales of citrus, fruit and vegetables abroad, following the granting by the EC of preferential access for agricultural produce from the territory. Promotion and advertising is increasingly a major marketing tool in agri-business and structural reorganization has taken place in some industries such as milk, poultry, and citrus, to facilitate marketing. Agricultural commodity advertising in the occupied territory is limited to pamphlets and no information is available on promotion expenditure.
I. Marketing facilities for manufactured goods
1. Domestic wholesale and retail channels
Wholesale functions are performed in the West Bank and Gaza Strip with varying degrees of efficiency. That could be attributed to the regional economic disparities within the occupied territory, the level of development and the marketing infrastructure.
Generally, wholesale firms in the occupied territory are fragmented, with a few employees and relatively weak resources in terms of both quantities and varieties of goods available for marketing. There are around 1,500 wholesalers in the West Bank and 1,000 in the Gaza Strip, accounting for 1 per cent of the total labour force of both regions (Statistical Bulletin of the West Bank and Gaza Strip, various issues). During the Gulf crisis of 1990/1991, many wholesalers in the West Bank and Gaza Strip applied for import permits to make up for shortages of foodstuffs.

- 39 -
Data on retailing are not available for the West Bank and Gaza Strip. Some estimates on employment from the Chamber of Commerce in east Jerusalem, indicate that a retail outlet employed on average only one person in 1987. Furthermore, the average number of customers per retail outlet was estimated to be very small, at 100. Due to the unsettled conditions after 1987, statistics on new retail outlets are not available (Elawna, 1986a).
Retailing in the West Bank and Gaza Strip, as in other developing countries, is either large-scale or small-scale. Large-scale retailers usually act as wholesalers and distributors, indicating that the range of retail activities can vary. Minimal modernization in the retail sector has taken place, as reflected in the existence of some supermarkets and larger-scale outlets in major cities.
2. Import agents
Since 1967, Israeli policies have succeeded in controlling the external trade of the occupied territory. More than 65 per cent of West Bank and Gaza Strip imports from abroad (via Israel) came through Israeli import agents. As mentioned earlier, Palestinians were not allowed to trade directly overseas. Before 1967, there were a few commercial agents in the West Bank and Gaza Strip who were permitted by the Jordanian or Egyptian authorities to import. More than 65 per cent of importing firms were owned by members of one family. Most of the importers- in the occupied territory lacked technical and marketing skills to import directly from abroad. Many of the Palestinian importers found that it was more convenient to import through Israeli agents who enjoyed some government support, ensured that the importer received shipments in time and avoided lengthy security checks.
Import agents and foreign goods. importing, both for
in the occupied territory act as distributors of Israeli However, large wholesalers are engaged in direct their own outlets and for redistribution to smaller
wholesalers and retailers in the West Bank and Gaza Strip.
3. Quality control, labelling, packaging and storage
Before a quality control mechanism can work effectively, a set of objectives must be adopted in order to measure progress. Quality control parameters are expressed clearly and are usually not limited to financial and cost matters. Marketing standards can be set regarding profits, sales volume, and distribution networks. To encourage consumers to substitute domestically produced goods for imports and to market those goods internationally, many industries in the West Bank and Gaza Strip made efforts to improve product quality. For example, foodstuff industries succeeded in increasing their sales in the domestic and Israeli markets (Kokali). Palestinian plastic products and shoes increased their shares in the Israeli markets. The Ministry of Industry and Commerce in Israel often warned of the implications of increased manufactured exports from the West Bank to Israel. At the same time, many Israeli industrialists and businessmen called on their government to stop issuing permits for establishing factories in the West Bank and Gaza Strip, often on grounds of quality, safety or health standards.

- 40 -
Usually, labelling and packaging for the domestic market is the same as for export markets. In the West Bank and Gaza Strip, firms are equipped to handle most types of packaging of light goods, which are shipped directly to wholesalers in both export and local markets.
4. Promotion
Several shortcomings characterize Palestinian advertising and product promotion. Except for newspapers and magazines, the occupied Palestinian territory has lacked other forms of media. No specialized advertising agency exists in the occupied territory, and newspapers are used directly by manufacturers to reach customers in the local markets. However, advertising usually is only used to introduce new products. Promotion of West Bank and Gaza Strip products has been increasingly organized through industrial exhibitions. This approach was used extensively during 1988-l99l to stimulate domestic demand for Palestinian products as substitutes for imports from Israel or abroad.
In the same period, some contacts were established between Palestinian institutions in east Jerusalem and foreign agencies to exchange information on access to foreign markets. Cooperation was developed between the Palestinian Chamber of Commerce in east Jerusalem and its counterparts in Poland, the Netherlands, the United Kingdom and elsewhere and it is expected that such activities will help to stimulate foreign demand for Palestinian products. Yet local producers still have much to learn and substantial improvements to make in their modes of promotion before they can hope to penetrate external markets and compete therein successfully.
J. Transport and communication
As mentioned earlier, transportation arrangements and security checks constitute major obstacles to the movement of goods over the bridges to Jordan. The 450 trucks still allowed to cross were licensed before 1967, and are not sufficient to load agricultural and manufactured exports efficiently and regularly. Further, these trucks do not provide sufficient protection for agricultural exports as the risk of delay is high and the produce is rapidly perishable. In addition, for security reasons, the Israeli authorities require that trucks be stripped down to the bare essentials to facilitate security checks on their return, which has to be done within 24 hours. Trucks have to return empty and are held up for a considerable time to allow the required security checks to take place (Kahan; Alanani).
Transportation and commission payments are substantial costs that inhibit the competitiveness of Palestinian exports. Such costs constituted on average 35 per cent of the price of exports during 1984-l987 (Awad and Abu Omar). The transportation cost for a truck load of l2,000 tons of fruit and vegetables averaged over $370. Furthermore, Israeli authorities charged $l60 for permits and checking services to allow a truck to cross bridges into Jordan, which accounts for more than 30 per cent of total transportation and commission costs (Alanani). As a result, in order to export, the difference between domestic and export prices has to exceed marketing costs, otherwise growers prefer to market agricultural produce domestically. To illustrate, the West Bank grape growers and exporters found that it was more profitable to sell all domestic production on the domestic market in 1987, as local prices

- 41 -
for fresh grapes were higher than in the Amman Central Market. Likewise, in 1988, olive oil prices on the local market were almost 10 per cent higher than those in the Amman Central Market (EI-Jafari,1991b).
Since 1967, Gaza port has been closed. Exports from the West Bank and Gaza Strip can only be shipped efficiently to Europe and beyond through Israeli ports and airports. Unfortunately, the export authority vested in the Citrus Marketing Board and Agrexco has hampered Palestinian exports. On the other hand, shipping through Egypt (Port Said) or through Jordan (Aqaba) would be prohibitively expensive (report by a Netherlands Government mission, 1986). Several attempts were made to reopen Gaza port, but these were not approved by the Israeli authorities (UNCTAD, 1989). Consequently, many Palestinian traders prefer to export and import through Israeli ports and agents to avoid the tough security checking and delays and the commission of 15 per cent of the total value of the transaction.
The use of communication facilities, such as telex, fax and telephone, is limited due to their high cost. This is particularly true in the case of contacting Jordan as it has to be done indirectly through Europe. Information on the Amman Central Market cannot be updated in a timely and cost-efficient manner. Direct export to the EC requires an efficient system of communication and information.
K. Financial facilities
As is the case for many developing economies, the financial system in the West Bank and Gaza Strip is unsophisticated, inefficient and inadequate. Financial institutions in the occupied territory have been reluctant to offer credit facilities to Palestinian businesses. Since 1967, financial and monetary policies have been tightly controlled by Israel. Israeli banks operating in the occupied territory until 1988 charged high rates of interest, hence curtailing demand. The reopening of the Cairo-Amman Bank in the mid-1980s did not significantly improve matters as it was not authorized to engage in trade transactions and offered only limited corporate or industrial credit facilities.
Only a few institutions extended credit to agricultural exporters in the West Bank and Gaza Strip. As noted, wholesalers in Jordan and the occupied territory playa vital role in marketing agricultural commodities. Before harvesting, Palestinian growers receive loans from wholesalers to finance their purchase of inputs in the production process. Small growers and exporters receive interest-free loans, but have to pay commissions for creditors. In addition, they must guarantee wholesalers, growers associations and cooperative unions that they will deliver the agricultural produce agreed upon. With no organized and accessible system of trade finance and strict limitations (especially between 1988 and 1991) on repatriation of export earnings, Palestinian exporters had to shoulder almost completely through their own resources the burden of financing their trade operations.
1. Private voluntary organizations revolving fund
Prior to the outbreak of the uprising, there were more than 20 international private voluntary organizations (PVOs) in the West Bank and Gaza Strip, involved mainly in economic and social development (Elawna 1986a

- 42 -
and Kahan 1987) . Total funding during 1973-1989 reached $66 million. Increasingly, these agencies have placed their resources in which help to maximize the benefits of available resources. 40 per cent of PVO funds were allocated to the agricultural
revolving funds More than
sector in the occupied territory, especially for capital investments or vertical expansion in farming. No projects were undertaken in land development, marketing facilities, infrastructure or water management. Modest PVO funding for a proposed project has usually been subject to the approval of the Israeli authorities. Less than 40 per cent of all proposed projects submitted to the military authorities during 1978-1987 were approved, mainly those projects that maintain reliance on the Israeli economy or do not conflict with its economic interests in the territory. Figures available on PVO projects (until 1987) indicate that more than 60 per cent of their expenditures are allocated to educational, social and public utilities (water and electricity), sectors whose needs fall squarely within the scope of government responsibilities which were not upheld by the civil administration.
2. International and regional sources of trade finance
In the past, funding for Palestinian economic development and trade came mainly from unrequited transfers. Remittances from Palestinians abroad were the major source of finance for the economic activities in the occupied territory, averaging $200 million per annum in 1976-1984 (Israel CBS (a)). Jordan was a vital funding source for local authorities, health and social services, contributing a total of $525 million between 1967 and 1988. Also, the Jordanian-Palestinian Joint Committee, established in 1979, channelled around $100 million annually to the occupied territory between ~979 and 1985 (Elawna 1986b). Most of these transfers were not directed to the different components of the Palestinian trading community, except the cooperative associations to support their operations and, occasionally, exporters or growers' associations to compensate for exceptional losses in agricultural output caused by climatic problems or the impact of Israeli policies.
Overall, such external income had a positive effect on the standard of living. By increasing the level of investment, especially in the construction and housing sector, external resources helped to boost domestic employment. Also, the inflow of income from abroad (including factor income from work in Israel and elsewhere) was necessary to finance the territory's imports from Israel.
3. Human resources and research
Technology transfer, sophisticated marketing systems and vocational training programmes can improve the skills of the labour force and in turn increase the competitiveness of goods produced in the West Bank and Gaza Strip. However, the impact of those factors may differ from one economic activity to another. Even though technology transfer is one of the most important factors for improving production, it is often expensive particularly for small economies such as that of the occupied territory.
In both the West Bank and Gaza Strip, land and water have been the major constraints on production. There have been tight controls imposed by the Israeli authorities on the utilization of water resources. For example, the drilling of new wells or installation of new equipment requires authorization

- 43 -
from the civil adminlstration. Such constraints have had a direct effect on the quality of crops. Israeli agricultural policies in the occupied territory especially in the 1970s assured the adoption by Palestinian farmers of more advanced technology. The emergence of structural unemployment, particularly in the educational sector, directed unemployed professionals into agriculture. They were able to grasp and employ capital-intensive methods through technology transfer directly from Israel. As a result, the quality of certain crops and levels of livestock production increased substantially. For example, egg production in the West Bank rose from 50 million eggs in 1986 to 98 million eggs in 1990, as Palestinian breeders successfully absorbed more modern and cost-effective techniques (Judea, Samaria and Gaza Area Statistics). Similarly, chicken production increased from 23,500 tons in 1986 to 30,600 tons in 1989.
The industrial sector employs skilled labour, engineers and technicians. The professions are estimated to account for more than 15 per cent of the total industrial labour force (Maraya). Structural changes took place, especially in the late 1980s, to reduce costs of production by replacing Israeli experts with local ones, thus spurring growth in some industrial branches. The increase in the number of graduates in applied sciences has encouraged the establishment of several specialized research centres in the occupied territory. Many seminars and workshops are organized by universities and community colleges. However, skills for undertaking feasibility studies, multidisciplinary research and problem-solving research are still limited. Lack of funds is a major obstacle. At present, this kind of research is funded mainly by Palestinian or international agencies.

- 44 -
Chapter IV
EMERGENT TRENDS, RECENT DEVELOPMENTS AND SOME IMMEDIATE NEEDS OF PALESTINIAN MERCHANDISE TRADE ~/
A. Emergent trends and recent developments in Palestinian external trade
Since the 1970s, external trade has come to make up a substantial part of total trade, causing a growing deficit in the balance of payments with Israel. This deficit had been increasingly covered by the export of Palestinian labour services, the merchandise trade surplus with Jordan and transfer payments from abroad. Consequently, Israel became the territory's major trading partner. Most Palestinian exports to Israel have been products manufactured under subcontracting arrangements with Israeli firms, whereby the real gains have been passed on to the Israeli firms, which sell these goods in both the Israeli and export markets.
Recent trends in Palestinian exports (1991-1993) highlight the constraints that still characterize the export sector. Overall trends in Palestinian merchandise export trade depict a steady decline in exports from a peak in 1981 to an annual average of $200 million in the period 1988-1991 (UNCTAD secretariat calculations based on Israel CBS data). The beginning of a slow recovery was noted in 1992, when exports rose to $291 million. Export earnings in 1993 were estimated at between $270 and $305 million (World Bank) . This reflects the long-term trend of deterioration in the ratio of merchandise exports to GDP, declining from a high of 41 per cent in 1981 to around 13 per cent by 1993.
The market structure and direction of Palestinian external trade in both goods and services continued to reflect the predominant share of Palestinian merchandise trade with Israel and a declining share in traditional markets (Jordan, other Arab countries and eastern Europe). The share of merchandise trade with new markets, including those which offer preferential treatment to Palestinian products, remained insignificant. Consequently, the share of merchandise exports to Israel, which constituted 65 per cent of the value of Palestinian merchandise exports in 1980, had increased to 85 per cent by 1992. Merchandise exports to Jordan and other Arab markets consequently fell from 31 per cent of total exports in 1970 to 13 per cent by 1992, while exports to other countries accounted for under 2 per cent of total Palestinian merchandise exports.
The commodity composition of Palestinian exports reflects a gradual marginalization of agricultural exports, which accounted for only $58 million, or under 30 per cent of the total value of exports, in 1990 (the last year for which commodity data are available). This compares with around 40 per cent in the years before 1980, when the value of agricultural exports was highest (i.e. over $100 million). This transformation in the structure of merchandise exports, coupled with the overall decline in export value, is attributed to a variety of factors relating to: restructuring of domestic production patterns
~/ Section A and some passages in section B are adapted from "Developments in the economy of the occupied Palestinian territory - with special reference to external trade" (TD/B/41(l)/3).

- 45 -
both within and between sectors; a range of policy, institutional and physical constraints to marketing which have over time reduced agricultural export competitiveness; and major shifts in demand for Palestinian agricultural exports in different markets amidst changing domestic economic or political conditions, especially in Israel, Jordan and other Arab countries.
In 1990, 45 per cent of agricultural exports went to Jordan, as compared to close to 60 per cent in the first half of the 19808, with much of the balance going t.o Isra"el. Since then f the trend in agricultural exports has shifted further in favour of the Israeli market. Data on the volume of agricultural exports to and through Jordan confirm a declining trend in recent years, from 79,400 tons in 1988 (34,800 from the West Bank mainly for the Jordanian market and 44,600 from the Gaza Strip, mainly in transit to other Arab markets) to 59,800 tons in 1993 (12,900 tons from the West Bank and 46,900 tons from the Gaza Strip) (Jordan, Agricultural Marketing Institute, 1994). The increasing overall share of industrial goods in the export mix reflects two trends: a rapid decline in industrial exports to Jordan since 1981, reaching a low of $27 million by 1990, a level not witnessed since 1971; and the steady growth of industrial exports to Israel, reaching a peak of $265 million in 1987, followed by a sharp fall to $141 million in 1990 (Israel, CBS data) .
The increasing weakness of Palestinian merchandise exports is rendered all the more critical in light of the mounting import bill of the occupied territory and, again, the concentration of imports from one dominant market. In line with growth in income from domestic and external sources, the Palestinian import bill grew steadily, reaching just over $1,000 million by 1987. It declined to under $700 million by 1990, reflecting austerity conditions and import substitution measures practised by Palestinians in the context of the intifada. Since then, imports have again grown, reaching an estimated level of $1,050 million by 1993 (UNCTAD secretariat estimates). The ratio of imports to GDP has continued to remain high, though declining from over 60 per cent in 1987 to 55 per cent since, a decline that reflects what appears to be a continuing impact of the import compression as well as a steady decline in income, especially from external sources during the period 1988-1990. Israel remains the largest supplier of much of Palestinian imports (around 90 per cent)" Understandably, its share also declined during the period 1988-1990 (as against the share of imports from international sources through Israel) only to regain previous levels by 1992.
The commodity composition of imports reflects the predominance of industrial products. In 1990, industrial goods constituted 86 per cent of all Palestinian imports, coming mainly from and through Israel. Agricultural imports, however, were almost entirely from Israel. The lower levels and share of agricultural imports (as compared to industrial goods) reflect two major factors: the smaller share of food in the consumption basket, and the greater share of domestic agricultural products in the overall consumption of agricultural output. Thus, out of the total domestic consumption expenditure of over $2,000 million in 1990 on agricultural and industrial goods, 35 per cent constituted expenditure on agricultural goods. In that year, imported agr.icultural and industrial goods constituted, respectively, 16 per cent and 51 per cent of total consumption of agricultural and industrial goods. Available information on industrial imports indicates that the flow of imported raw materials, intermediate inputs and capital goods has

- 46 -
constituted the major component of industrial imports at the expense of imported consumer or final goods, especially since 1988. Growth in the entry of agricultural goods from the Gaza Strip to the West Bank, and of consumer goods moving in the opposite direction, have helped to substitute for imports from Israel, and signify increased economic relationships between the two areas since 1988.
The above trends have maintained the substantial level of merchandise trade deficit of the territory, amounting to $940 million in 1992 and estimated at around $800 million in 1993 (World Bank, 1994). In terms of market share, the deficit continues to be mainly with Israel at $850 million in 1992, approximately double its level in 1985, as well as with non-Arab markets (over $lOO million since 1990). Only with Jordan has Palestinian merchandise trade been able to maintain a surplus, albeit a shrinking one at under $30 million since 1990 (as compared to $lOO million in 1980). The merchandise trade deficit, which has become a permanent feature of the Palestinian external sector, has been sustained through a regular and significant surplus in the services account with Israel, mainly reflecting remittances of factor income from work in Israel.
B. Major constraints affecting the Palestinian trade sector and immediate needs
It has been noted in this study that, after the occupation of the West Bank and Gaza Strip, measures were taken by the Israeli authorities to integrate the territory's economy gradually into that of Israel. Accordingly, borders were opened between the occupied territory and Israel, which should have allowed the free flow of goods and services in both directions. However, subsequent measures allowed unrestricted entry of Israeli exports into the territory and prevented the flow of Palestinian goods into Israel, except on a selective and limited basis, usually in order to limit the flow of goods that could compete with Israeli products. Coupled with measures controlling production, these policies and practices were the major factors which brought about a gradual, but significant distortion in the structure of Palestinian agriculture and industry. with the transformation of the trade policy and regulatory environment following the Israel-Palestine accords of 1993, some of these factors should no longer be operative and the impact of others is expected to be significantly reduced. Nevertheless, their relevance to the current problems and future prospects of the merchandise trade sector will persist.
In view of the tariff and non-tariff barriers imposed on the exports of the occupied territory, Palestinian exporters have attempted, within the context of initiatives aimed at promoting self-reliance since 1988, to identify new markets and to benefit from the preferential treatment extended to them. While these efforts have given Palestinian producers and exporters some access to new markets, the inadequacy of marketing facilities, both in the occupied territory and abroad, has hampered significant direct exports to the EC and elsewhere.
Equally bold measures have been taken since 1988 to reduce reliance on imports from Israel and elsewhere. This move was manifested in import substitution measures involving mainly food products. While the results have been promising, the prospects for continuing and promoting such a policy

- 47 -
called for serious efforts on the part of producers to meet its numerous technical and financial requirements, including the imports of needed raw materials and other inputs, and to rationalize the import of consumption goods. The immediate results were that imports retained their relatively high level in relation to gross national product while exports depicted a declining trend. More radical structural changes were called for, both in agriculture and industry, in order to better benefit from international trade.
A number of other factors such as the absence of an efficient transport and communication system also inhibited the development of Palestinian merchandise trade, both domestically and internationally. Coupled with cumbersome regulations and procedures, the dynamic role of trade in the process of economic growth and development was reduced to nil. Lack of financing was another important obstacle to the development of the trade sector. Despite the opening of a few branches of Arab banks in the occupied territory, domestic and external trade suffered from shortages of trade finance, including export credits and guarantees, import and other trade related-financing. Israeli measures until 1992 drastically curbed the flow of funds from abroad and further intensified the negative impact of an already inadequate monetary and financial system on the merchandise trade of the occupied territory.
Trade with the Arab countries that provided traditional markets for the Palestinian agricultural and industrial products was also constrained by mounting restrictions. In addition to numerous Israeli obstacles, Palestinian exports from the occupied territory to Arab countries were effectively limited by regulations reflecting domestic economic considerations as well as application of the Arab League boycott regulations pertaining to trade with Israel. Obviously, while the pursuit of such policies may have served a purpose, it has had increasingly adverse effects on the Palestinian economy in the occupied territory.
Meanwhile, following Jordan's relinquishing legal and administrative ties with the West Bank, the entry of Palestinian farm produce was linked to that country's actual needs. In addition, the measures specified the types of products and tIle time or season that they could enter Jordan. Owing to inadequate and inefficient marketing and transport facilities in the occupied territory (for grading, selecting, packing, cold storage, etc.), such requirements were difficult to meet for Palestinian producers and exporters.
The current situation of Palestinian merchandise trade reflects similar problems and constraints to those that affect other areas of the Palestinian economy. As noted, the Palestinian economy continues to feature a weak, fragmented and poorly articulated productive base, composed mainly of small-scale production and marketing units. Where attempts have been made recently to revive the production, the absence of indigenous policy-making, regulatory bodies, and financial and manpower capacities has prevented coordination in the formulation and implementation of the required policies and measures. While small-scale Palestinian industries have exhibited a good potential for competitive entry into export markets, their overall role in strengthening Palestinian trade and contributing to the growth of the economy has been negligible.
- 48 -
One of the indirect consequences of the Palestinian external trade reliance on a single market has been a growing commodity concentration in productive sectors (agricultural and industrial goods), corresponding to the structure of trade with that major partner. Shifts in Israeli production trends (generally upwards in terms of science and technology content) have increasingly entailed corresponding moves by Palestinian producers. These have been either to complement Israeli production (e.g. subcontracting of textiles and other branches) or to fill gaps in the range of production for domestic (Israeli and Palestinian) markets caused by Israeli production shifts. While this could have some beneficial aspects if adequately and jointly planned and coordinated, much of Palestinian manufacturing and mining industry, as well as some agricultural branches and a number of services (e.g. tourism and transport), continue to operate well below capacity. In addition to the general disincentives which have characterized the situation since 1967, it appears that considerations of market size as well as technical, financial and material requirements (e.g. obsolete or unrepaired machinery, inadequate or inappropriate skills, insufficient financial and material resources) have all contributed to the underutilization of capacity. These developments have led to an increasingly distorted cost/price structure affecting Palestinian production and exports, as compared to regional and world norms. While Palestinian unit labour costs are relatively low and internationally competitive, other aspects of the cost structure continue to disadvantage Palestinian exports in most markets.
In this respect, a range of constraints continue to hamper Palestinian efforts to regain lost ground in traditional markets, exploit free trade arrangements at the regional and international levels, and benefit from preferential treatment accorded to Palestinian exports, especially by the European Community, the Global System of Trade Preferences among developing countries and other schemes. At the regional level, these constraints have particularly prevented Palestinians from exploiting complementarities with neighbouring countries and developing the potentials of their economy in areas where it enjoys comparative advantages.
The constraints at work include: the virtual absence of marketing facilities, relevant institutions and expertise, in both the private and public domains; insufficient exposure to modern trade promotion techniques; lack of rules and regulations to adhere to int.ernational standards in marketing (concerning grading, quality/health control, packaging, labelling, cold storage, etc.); inadequate transport and communications infrastructures and facilities; cumbersome export regulations and procedures; lack of export financing arrangements; and unfamiliarity with international market price mechanisms and tariff systems. Palestinian facilities for the compilation, processing, analysis and dissemination of data on various aspects of the economy, in particular external trade, and for coordinating work on strategies and methodologies to be adopted at different levels are weak, both technically and managerially.
A number of measures for the development and improved performance of the Palestinian external trade sector may be envisaged. First, Palestinian policy-makers and enterprises involved in merchandise trade need to enhance their capacity to formulate policy/strategy options to enable the Palestinian manufacturing, commodity-producing and services sectors to exploit emerging market opportunities not only at the local level but also at the subregional,

- 49 -
regional and international levels, including free trade zones with present and future trade partners. Institutional facilities are needed to elaborate trade policies and procedures aimed at promoting the exports of goods and services and rationalizing import patterns.
Post-1993 developments will also require the establishment of a Palestinian tariff regime and customs administration, aimed at enhancing production and liberalizing trade. Another important task will be the reform of the overall legal and regulatory framework that deals with different aspects of the Palestinian trade sector, as well as related vital issues such as the promotion of domestic and foreign private investment, facilitation of domestic and international banking operations and creation of a frame of reference to promote business environment, support private sector initiative and enhance the efficiency of public utilities.
An equally pressing need is to strengthen the technical, managerial and trade information capacities and performance of Palestinian public and private-sector institutions responsible for the formulation and implementation of international trade policies, and of those components of the trading community involved in the day-to-day operations of international trade and related services sectors. Major efforts are called for in order to establish the necessary legal, institutional, technical and human resource framework for the creation of an adequate and efficient transport system for trade, especially the establishment of a Palestinian shipping service, the development of a Gaza Strip commercial sea port and an efficient multimodal transport system, including the handling of transit traffic.
Vigorous policy measures and active international assistance are called for to effectively deal with the range of constraints still operative and to establish the required regulatory framework along with suitable mechanisms and relevant manpower and other resources to help diversify trade linkages and exploit complementarities. This is a task which is of equal concern to the Palestinian authorities and the capable and dynamic Palestinian private sector, as well as to their established and potential trading partners in the region and beyond. Comprehensive reform and modernization of the Palestinian merchandise trade sector is the key to enabling the Palestinian economy to survive and compete in the complex and rapidly changing context of regional and international trade in the 1990s.

- 50 -
TABLES
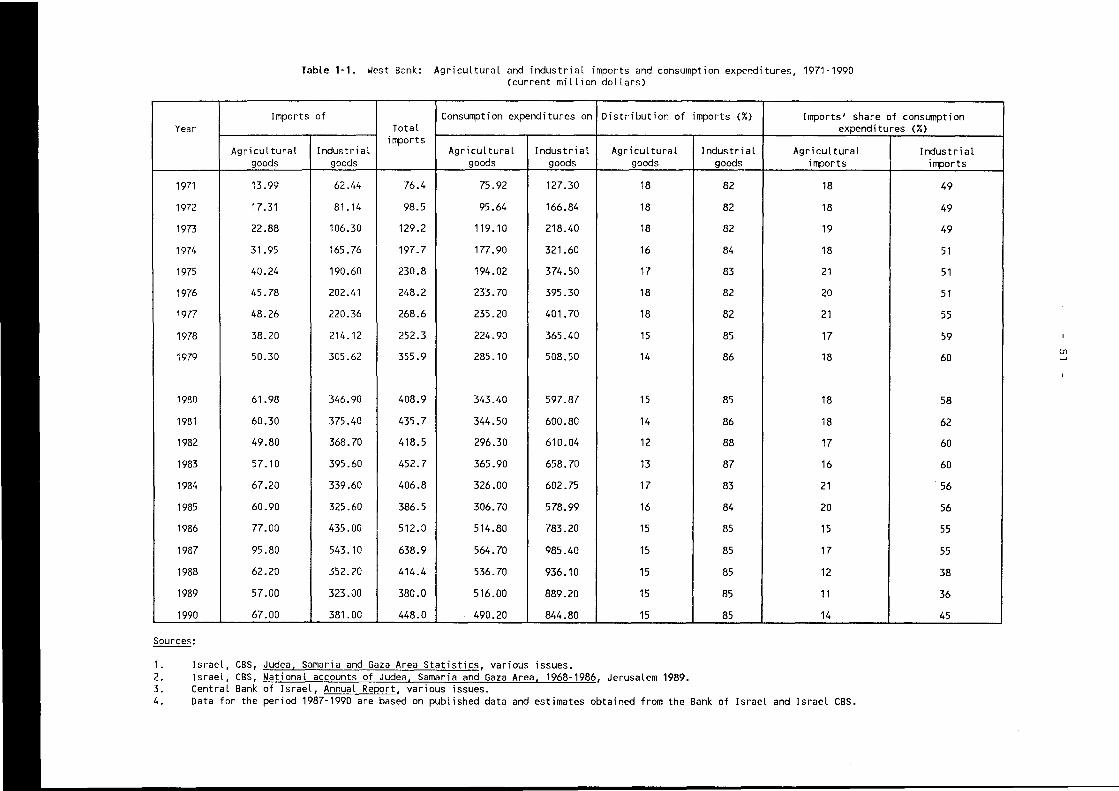
Table 1-1. West Bank: Agricultural and industrial imports and consumption expenditures, 1971·1990 (current million dollars)
Imports of Consumption expenditures on Distribution of imports (%) Imports' share of consumption Year Total expenditures (%)
imports Agricultural Industrial Agricultural Industrial Agricultural Industrial Agricultural Industrial
goods goods goods goods goods goods imports imports
1971 13.99 62.44 76.4 75.92 127.30 18 82 18 49
1972 17.31 81.14 98.5 95.64 166.84 18 82 18 49
1973 22.88 106.30 129.2 119.10 218.40 18 82 19 49
1974 31.95 165.76 197.7 177.90 321.60 16 84 18 51
1975 40.24 190.60 230.8 194.02 374.50 17 83 21 51
1976 45.78 202.41 248.2 233.70 395.30 18 82 20 51
1977 48.26 220.36 268.6 235.20 401.70 18 82 21 55
1978 38.20 214.12 252.3 224.90 365.40 15 85 17 59
1979 50.30 305.62 355.9 285.10 508.50 14 86 18 60
1980 61.98 346.90 408.9 343.40 597.87 15 85 18 58
1981 60.30 375.40 435.7 344.50 600.80 14 86 18 62
1982 49.80 368.70 418.5 296.30 610.04 12 88 17 60
1983 57.10 395.60 452.7 365.90 658.70 13 87 16 60
1984 67.20 339.60 406.8 326.00 602.75 17 83 21 56
1985 60.90 325.60 386.5 306.70 578.99 16 84 20 56
1986 77.00 435.00 512.0 514.80 783.20 15 85 15 55
1987 95.80 543.10 638.9 564.70 985.40 15 85 17 55
1988 62.20 352.20 414.4 536.70 936.10 15 85 12 38
1989 57.00 323.00 380.0 516.00 889.20 15 85 11 36
1990 67.00 381.00 448.0 490.20 844.80 ~--.-'----_85.~ 14 45 ---- ------ --- -
Sources:
1. Israel, CBS, Judea, Samaria and Gaza Area Statistics, various issues. 2. Israel, CBS, National accounts of Judea, Samaria and Gaza Area, 1968-1986, Jerusalem 1989. 3. Central Bank of Israel, Annual Report, various issues. 4. Data for the period 1987-1990 are based on published data and estimates obtained from the Bank of Israel and Israel CBS.
I
lJ1 I-'

TabLe 1-2. Gaza Strip: Agricultural and industrial imports and consumption expenditures, 1971·1990 (current million dollars)
Imports of Consumption Distribution of Imports' share of consumption Year Total expenditures on imports (%) expenditures (%)
imports Agricultural Industrial Agricultural Industrial Agricultural Industrial Agricultural IndustriaL
goods goods goods goods goods goods imports imports
1971 7.32 42.12 49.44 26.40 78.31 15 85 28 54
1972 9.00 55.31 64.31 34.70 96.10 14 . 86 26 58
1973 14.40 69.10 83.50 50.11 120.00 17 83 29 58
1974 18.10 119.20 137.30 64.94 205.00 13 87 28 58
1975 26.29 150.10 176.30 81.02 246.10 15 85 32 61
1976 29.70 157.60 187.30 87.50 250.10 16 84 34 63
1977 40.90 195.90 236.80 106.10 317.70 17 83 38 62
1978 27.70 170.64 198.34 85.30 263.82 14 86 32 65
1979 29.70 190.90 220.60 92.99 304.70 13 87 32 63
1980 34.50 234.60 269.10 107.90 372.00 13 87 32 63
1981 36.10 276.80 312.90 116.95 398.80 11 89 31 69
1982 36.80 273.60 310.40 114.72 396.93 12 88 32 69
1983 44.90 287.20 332.10 135.60 422.80 13 87 33 68
1984 41.80 237.60 279.40 138.70 358.00 15 85 30 66
1985 41.20 240.20 281.40 149.40 368.00 15 85 28 65
1986 53.20 324.30 377.50 207.10 509.00 14 86 26 64
1987 61.80 350.20 412.00 247.00 572.00 15 85 25 61
1988 40.00 268.00 308.00 216.00 478.00 13 87 18 56
1989 37.20 250.00 287.20 204.00 479.00 13 87 18 52
1990 43.30 294.00 339.00 202.00 484.00 13 87 21 61 ~-
Sources: 1. Israel, CBS, Judea, Samaria and Gaza Area Statistics, various issues. 2. Israel, CBS, National accounts of Judea, Samaria and Gaza Area, 1968·1986, Jerusalem 1989. 3. Central Bank of Israel, AnnuaL Report, various issues. 4. Data for the period 1987·1990 are based on published data and estimates obtained from the Bank of Israel, Israel CBS, Gaza Department of
Agriculture and Gaza Chamber of Commerce.
I I
I
I
!
U1 tv

Year
1970
1971
1972
1973
1974
1975
1976
1977
1978
1979
1980
1981
1982
1983
1984
1985
1986
1987
1988
1989
1990
Sources:
- 53 -
Table 1-3. West Bank: Agricultural imports from Israel and the Gaza Strip, 1970-1990
Source Distribution (current million dollars) (percentages)
Gaza Strip Israel Gaza Strip Israel
2.80 8.00 26 74
4.40 10.64 29 71
7.40 13 .40 36 64
1.88 26.00 7 93
1. 80 28.30 6 94
2.30 32.40 7 93
2.60 36.60 7 93
2.20 41.20 5 95
2.70 36.60 7 93
2.11 46.30 4 96
2.90 58.30 5 95
4.23 57.40 7 93
2.53 44.00 5 95
2.10 51.70 4 96
3.10 62.70 5 95
4.12 54.10 7 93
7.11 69.70 9 91
9.80 87.10 10 90
18.50 56.00 25 75
18.84 51.00 27 73
24.73 60.10 29 71
1. Israel, CBS, Judea, Samaria and Gaza Area Statistics, various issues. 2. Israel, CBS, National accounts of Judea, Samaria and Gaza Area,
1968-1986, Jerusalem 1989. 3. Central Bank of Israel, Annual Report, various issues. 4. Data for the period 1987-1990 are based on published data and estimates
obtained from the Bank of Israel, Israel CBS, Gaza Department of Agriculture and Gaza Chamber of Commerce.

- 54 -
Table 1-4. Gaza Strip: Agricultural imports from the west Bank, Israel and elsewhere, 1970-1990
Source Distribution
Year (current million dollars) (percentages)
West Bank Israel Elsewhere West Bank Israel Elsewhere
1970 0.62 5.00 0.29 10 85 5
1971 0.29 9.97 0.29 3 94 3
1972 0.29 8.70 0.29 3 94 3
1973 0.65 14.20 0.14 4 95 1
1974 0.68 16.60 1. 50 4 88 8
1975 1. 61 23.60 2.90 6 84 10
1976 2.54 23.00 6.56 8 72 20
1977 0.84 32.80 8.12 2 79 19
1978 0.45 25.60 2.60 2 89 9
1979 0.92 26.70 2.83 3 88 9
1980 1.10 31.70 2.70 3 89 8
1981 1. 53 33.80 2.30 4 90 6
1982 1.66 31.30 5.50 4 81 14
1983 0.54 37.90 7.00 1 83 15
1984 1.04 35.50 6.30 2 83 15
1985 1. 83 33.70 7.50 4 78 17
1986 2.66 44.70 8.50 5 80 15
1987 2.89 53.50 7.30 4 84 11
1988 4.50 36.00 4.50 10 80 10
1989 5.58 33.50 4.02 13 78 9
1990 8.80 39.00 4.20 17 75 8
Sources:
1. Israel, CBS, Judea, Samaria and Gaza Area Statistics, various issues. 2. Israel, CBS, National accounts of Judea, Samaria and Gaza Area,
1968-1986, Jerusalem 1989. 3. Central Bank of Israel, Annual Report, various issues. 4. Data for the period 1987-1990 are based on published data and estimates
obtained directly from the Bank of Israel, Israel CBS, Gaza Department of Agriculture and Gaza Chamber of Commerce.

- 55 -
TabLe 1-5. West Bank: Consumption and imports of fresh vegetables, 1970-1990
Year Consumption and imports Sources of imports Market shares (thousand tons) (thousand tons) (percentages)
C I (I/C) x 100 Israel Gaza Strip Israel Gaza Strip
1970 77.1 15.82 21 11.87 3.96 75 25
1971 88.3 23.17 26 20.00 3.16 86 14
1972 94.3 17.06 18 11.64 5.42 68 32
1973 84.9 16.72 20 12.88 3.84 77 23
1974 113.5 19.32 17 15.93 3.39 82 18
1975 126.6 24.30 19 19.78 4.52 81 19
1976 134.7 24.86 18 19.78 5.09 80 20
1977 142.6 40.00 28 30.17 9.83 75 25
1978 141. 7 39.89 28 27.91 11.98 70 30
1979 125.8 32.21 26 23.73 8.48 74 26
1980 125.9 42.15 33 28.36 13.79 67 33
1981 '14.4 48.14 42 26.67 21.47 55 45
1982 123.4 47.57 39 30.62 16.95 64 36
1983 131.1 38.53 29 25.20 13.33 65 35
1984 134.2 46.56 35 28.48 18.06 61 39
1985 141.7 47.91 34 24.86 23.05 52 48
1986 161.0 44.75 28 25.20 19.55 56 44
1987 179.4 45.31 25 21.58 23.73 48 42
1988 168.8 42.20 25 - 42.20 - 100
1989 164.5 36.20 22 - 36.20 - 100
1990 160.5 57.22 36 - 57.22 - 100
Sources:
1. Israel, CBS, Judea. Samaria and Gaza Area Statistics, various issues. 2. Israel, CBS, National accounts of Judea, Samaria and Gaza Area, 1968-1986, Jerusalem 1989. 3. Central Bank of Israel, Annual Report, various issues. 4. Preliminary data for 1990 are from Gaza Strip Department of Agriculture, agricultural statistics.
C = Consumption
I = Imports

· 56 -
Table 1-6. Yest Bank: Consumption and imports of fruit, 1970-1989
Year Consumption and imports Sources of imports Market shares (thousand tons) (thousand tons) (percentages)
C I (ljC) x 100 Israel Gaza Strip Israel Gaza Strip
1970 39.4 8.6 22 4.3 4.3 50 50
1971 31.6 11.1 35 4.9 6.2 44 56
1972 43.7 8.6 20 5.2 3.4 60 40
1973 50.7 8.2 16 6.8 1.4 83 17
1974 59.5 14.9 25 10.9 4.0 73 27
1975 60.2 12.2 20 8.6 3.6 70 30
1976 74.5 14.2 19 10.6 3.6 75 25
1977 66.7 13.8 21 10.6 3.2 77 23
1978 76.0 16.5 22 13.3 3.2 81 19
1979 74.1 18.5 25 17.1 1.4 92 8
1980 84.0 25.5 30 22.9 2.6 90 10
1981 79.6 23.9 30 20.5 3.4 86 14
1982 76.3 20.8 27 18.9 1.9 91 9
1983 70.0 18.0 26 15.0 3.0 83 17
1984 78.3 19.8 25 18.2 1.6 92 8
1985 66.0 16.4 25 15.2 1.2 93 7
1986 74.7 16.7 22 14.8 1.9 89 11
1987 64.9 16.5 25 14.8 1.7 90 10
1988 70.0 16.1 23 12.9 3.2 80 20
1989 61.8 12.4 20 7.0 5.3 57 43
Sources:
1. Israel, CBS, Judea. Samaria and Gaza Area Statistics, various issues. 2. Israel, CBS, National accounts of Judea, Samaria and Gaza Area, 1968-1986, Jerusalem 1989. 3. Central Bank of Israel, Annual Report, various issues. 4. Data for the period 1987-1990 are based on published data and estimates obtained from the Bank of Israel,
Israel CBS, Gaza Department of Agriculture and Gaza Chamber of Commerce.
Notes:
C = Consumption
I = Imports

Table 1-7. ~est Bank: Consumption and imports of citrus, 1970-1990
Year Consumption and imports Sources of imports Market shares (thousand tons) (thousand tons) (percentages)
C I (1/C) x 100 Israel Gaza Strip Israel Gaza Strip
1970 31.6 9.50 30 0.10 9.39 1 99
1971 36.2 10.80 30 0.90 9.90 8 92
1972 39.3 13.70 35 - 13.70 0 100
1973 34.0 11.41 34 0.23 11.19 2 98
1974 35.6 7.12 20 0.11 7.01 1 99
1975 37.9 6.89 18 1.36 5.54 20 80
1976 44.2 4.07 9 0.45 3.62 11 89
1977 41.4 10.85 26 8.70 2.15 80 20
1978 41.4 4.44 11 2.15 2.26 In 5i 'n
1979 43.8 3.50 8 1.24 2.26 35 65
1980 37.6 3.84 10 2.26 1.58 59 41
1981 35.4 6.55 18 1.92 4.63 29 71
1982 36.4 6.89 19 4.63 2.26 67 33
1983 38.9 6.67 17 3.28 3.39 49 51
1984 34.0 5.20 15 1.58 3.62 30 70
1985 35.2 6.10 17 2.83 3.28 46 54
1986 37.2 5.20 14 0.90 4.29 17 83
1987 54.6 14.01 26 0.74 13.22 5 95
1988 33.0 3.30 10 - 3.30 - 100
1989 48.0 7.20 15 - 7.20 - 100
1990 41.3 6.20 15 - 6.20 - 100 Sources: -1-. ---israel, CBS, Judea, Samaria and Gaza Area Statistics, various issues. 2. Israel, CBS, National accounts of Judea. Samaria and Gaza Area. 1968-1986, Jerusalem 1989. 3. Central Bank of Israel, Annual Report, various issues. 4. Data for the period 1987-1990 are based on published data and estimates obtained from the Bank of Israel, Israel CBS, Gaza Department of
Agriculture and Gaza Chamber of Commerce. Notes: C Consumption I = Imports
I
I
IJl -..J

Table 1-8. ~est Bank: Consumption and imports of livestock products from Israel, 1970·1989
Year Red meat Chicken meat Eggs (thousand tons) (thousand tons) (millions)
C I (I/C) x 100 C I (I/C) x 100 C I (I/C) x 100
1970 3.06 1.26 41 6.00 0.40 7 43.00 16.00 37
1971 3.80 2.00 53 6.72 1.72 26 44.00 14.00 32
1972 3.40 0.30 9 8.33 0.33 4 45.00 15.00 33
1973 3.55 1.21 34 10.10 1.70 17 46.00 8.00 17
1974 3.35 0.85 25 9.51 0.50 5 47.50 9.50 20
1975 3.68 0.48 13 8.37 1.77 21 47.60 9.60 20
1976 4.81 0.60 12 10.90 3.30 30 47.70 9.60 20
1977 6.45 2.00 31 11.80 5.70 48 47.50 7.50 16
1978 5.91 1.61 27 9.23 3.40 37 47.50 3.00 6
1979 4.92 0.92 19 12.20 2.80 23 47.40 2.90 6
1980 5.01 . . 12.60 3.20 25 47.80 3.30 7
1981 4.62 0.83 18 9.25 2.65 29 48.00 2.00 4
1982 4.72 0.82 17 16.30 4.30 26 49.00 1.50 3
1983 4.94 1.14 23 18.52 3.72 20 51.70 11.70 23
1984 6.13 2.23 36 15.22 3.00 20 53.90 16.40 30
1985 5.91 2.51 42 17.81 5.01 28 56.12 19.72 35
1986 5.95 1.40 23 18.33 1.83 10 60.00 10.00 17
1987 5.34 2.03 38 25.50 · · 62.70 10.00 16
1988 6.42 2.46 38 30.50 · · 65.50 2.70 4
1989 6.35 2.45 39 39.20 · · 67.00 3.80 6 ~ _ ... -
Sources:
1. Israel, CBS, Judea, Samaria and Gaza Area Statistics, various issues. 2. ~est Bank Veterinary Oepartment, Agricultural statistics, Nablus, various issues.
Notes:
C = Consumption I = Imports
Milk (thousand litres)
C I (I/C) x 100
29.80 7.30 24
33.60 4.60 14
37.40 6.40 17
42.20 2.10 5
42.80 1.80 4
42.50 3.50 8
44.20 2.70 6
43.70 4.10 9
44.90 5.10 11
44.70 5.30 12
42.90 6.10 14
42.60 3.81 9
48.70 3.70 8
54.70 12.90 24
55.70 13.40 24
58.60 18.70 32
60.82 19.43 32
71.50 20.30 28
77.60 19.80 25
84.32 19.80 23
I
I
Ul OJ

TabLe 1-9. Gaza Strip: Consumption and imports of vegetables, 1970·1990
Year Consumption and imports Sources (thousand tons) (thousand tons)
C I (I/C) x 100 Israel Iiest Bank Israel
1970 42.6 10.9 26 9.9 1.0 91
1971 46.4 12.6 27 12.3 0.3 98
1972 41.7 8.9 21 8.7 0.2 98
1973 45.2 11.5 25 11.0 0.5 96
1974 45.1 13.6 30 12.1 1.5 89
1975 50.6 12.9 25 12.5 0.4 97
1976 50.6 13.5 27 12.9 0.6 96
1977 48.0 12.5 26 11.6 0.9 93
1978 48.2 12.7 26 12.2 0.5 96
1979 47.9 12.1 25 11.9 0.2 98
1980 57.8 17.4 30 17.2 0.2 99
1981 63.4 17.9 28 17.7 0.2 99
1982 66.0 12.4 19 12.3 0.1 99
1983 70.3 14.5 21 14.2 0.3 98
1984 78.3 17.0 22 16.0 1.0 94
1985 81.7 10.8 13 10.1 0.7 93
1986 80.6 9.6 12 9.4 0.2 98
1987 86.1 8.4 10 8.0 0.4 95
1988 84.4 6.3 7 5.8 0.5 92
1989 80.2 5.4 7 4.8 0.5 91
1990 76.2 6.2 8 5.5 0.7 89 --
Sources. -1-.----Gaza Strip Department of Agriculture, AgriculturaL statistics, various issues. 2. Israel, CBS, Judea, Samaria, and Gaza Area Statistics, various issues.
Notes: C Consumption I" Imports
Market shares (percentages)
Iiest Bank
9
2
2
4
11
3
4
7
4
2
1
1
1
2
6
7
2
5
8
9
11
I
In
'"

TabLe 1-10. Gaza Strip: Consumption and imports of fruit, 1970·1990
Consumption and imports Sources (thousand tons) (thousand tons)
Year C I (l/C) x 100 Israel lIest Bank
1970 20.9 5.6 27 2.4 3.2
1971 18.3 5.1 28 3.6 1.5
1972 24.7 5.2 21 4.2 1.0
1973 18.7 5.5 29 3.3 2.2
1974 17.0 7.2 42 4.8 2.4
1975 19.6 9.5 48 4.9 2.9
1976 20.4 12.0 59 4.9 7.1
1977 20.7 12.1 58 9.6 2.5
1978 22.4 14.0 62 10.8 3.2
1979 23.1 13.6 59 11.0 2.6
1980 24.1 15.8 66 12.9 2.9
1981 27.5 19.6 71 14.5 5.1
1982 27.9 22.5 81 16.6 5.9
1983 20.3 13.6 67 10.6 3.0
1984 26.6 19.2 72 17.2 2.0
1985 29.4 25.4 86 23.3 5.8
1986 31.9 20.7 65 17.5 3.2
1987 32.9 23.6 72 22.1 1.5
1988 23.4 16.4 70 14.1 1.6
1989 23.8 15.5 65 13.2 2.3
1990 27.7 18.0 65 14.4 3.6 - - -- -- -- - - -- --- -- ----Sources: -1-.----Gaza Strip Department of Agriculture, Agricultural statistics, various issues. 2. Israel, CBS, Judea, Samaria, and Gaza Area Statistics, various issues.
Notes: C = Consumption I = Imports
Market shares (percentages)
Israel lIest Bank
43 57
71 29
81 19
60 40
67 33
63 37
41 59
79 21
77 23
81 19
82 18
74 26
74 26
78 22
90 10
80 20
84 16
94 6
90 10
85 15
80 20 --------
en o

Table 1-11. Gaza Strip: Consumption and imports of livestock products from Israel, 1970·1987
Year Red meat Chicken meat Eggs Mi lk (thousand tons) (thousand tons) (millions) (million litres)
C I (I/c) x 100 C I (I/C) x 100 C I (llc) x 100 C I (1/C)x100
1970 1.75 0.45 26 1.80 1.20 67 32.50 17.50 54 13.10 5.70 43
1971 2.04 0.49 24 1.93 1.23 64 33.70 13.70 41 13.60 5.60 41
1972 2.26 0.46 20 1.97 1.08 55 34.90 10.90 31 14.10 4.88 35
1973 3.30 1.30 39 2.12 1.12 53 36.20 6.20 17 14.60 4.40 30
1974 3.63 1.33 37 2.23 1.63 73 37.50 7.50 20 15.10 3.40 22
1975 4.18 1.68 40 2.56 2.06 80 38.90 6.90 18 15.60 2.70 17
1976 6.33 3.43 54 2.90 2.20 76 40.31 7.91 20 16.20 3.42 21
1977 7.99 5.02 63 3.29 2.45 74 41.78 6.78 16 16.80 4.84 29
1978 6.60 3.40 51 4.62 3.82 83 43.30 3.30 8 17.40 2.60 15
1979 4.81 1.57 33 4.72 3.42 72 44.78 2.31 5 17.94 1. 74 10
1980 4.56 1.16 25 5.00 3.10 62 46.50 3.70 8 18.65 3.95 21
1981 3.49 0.69 20 6.32 3.52 56 48.10 2.30 5 19.30 5.40 28
1982 3.17 0.37 12 6.48 3.18 49 46.50 0.60 1 19.97 7.97 40
1983 5.75 3.25 56 6.60 3.2 48 46.50 0.50 1 20.60 9.20 45
1984 6.50 4.00 61 7.70 4.40 57 53.25 0.25 1 21.32 16.12 75
1985 6.58 4.38 67 7.30 3.70 51 50.62 1.12 2 22.10 12.10 55
1986 5.88 3.73 63 8.15 3.15 39 55.60 . . 22.90 14.50 63
1987 5.52 3.32 60 10.25 4.15 40 60.50 . - 26.70 16.10 60 -~
Sources:
1. Gaza Strip Department of Agriculture, Agricultural statistics, various issues. 2. Israel, CBS, Judea, Samaria, and Gaza Area Statistics, various issues.
Notes:
C Consumption Imports
I
0'\ I-'

Industrial goods Year
Domestic Imports production (I)
1971 64.88 62.44
1972 85.71 81.14
1973 112.14 106.29
1974 155.83 165.76
1975 183.90 190.58
1976 192.95 202.41
1977 181.36 220.37
1978 142.27 214.12
1979 202.87 305.62
1980 250.94 346.96
1981 225.44 375.47
1982 241.34 368.70
1983 263.17 395.50
1984 263.50 339.60
1985 253.40 325.60
1986 348.18 435.00
1987 442.32 546.70
1988 360.00 366.70
1989 355.00 340.00
1990 410.00 403.40
Sources:
TabLe 1-12. Yest Bank: Consumption and imports of industriaL products, 1971-1990 (current million dollars)
Sources of Imports TotaL industrial (1/C)x100
Jordan Israel Other consumption
Jordan (C)
2.44 50.32 9.68 127.32 49 4
3.57 67.83 9.74 166.85 49 4
3.00 95.12 8.17 218.43 49 3
4.01 148.90 12.85 321.59 51 2
4.81 172.27 13.50 374.48 51 2
3.58 185.91 12.92 395.36 51 2
4.38 200.28 15.71 401.73 55 2
4.70 181.85 27.57 356.39 60 2
4.60 259.12 41.90 508.49 60 1
4.94 296.80 45.22 597.90 58 1
7.27 328.40 39.80 600.91 62 2
8.50 322.40 37.80 610.04 60 2
6.50 355.20 33.80 658.67 60 2
8.10 300.40 31.10 603.10 56 2
8.40 285.40 31.80 579.00 56 2
10.70 381.30 43.00 783.18 55 2
9.40 494.00 43.30 989.02 55 2
9.00 330.00 27.70 726.70 50 2
10.00 306.00 24.00 695.00 49 3
11.00 36~0~ __ 29.40 813.40 50 3 - ._-
1. Central Bank of IsraeL, Annual Report, various issues. 2. IsraeL, CBS, Judea, Samaria and Gaza Area Statistics, various issues.
Market shares (percentages)
Israel Others
81 15
84 12
89 8
90 8
90 8
92 6
91 7
85 13
85 14
86 13
87 11
87 11
90 8
88 10
88 10
88 10
90 8
90 7
90 7
90 7
3. Data for the period 1987-1990 are based on published data and estimates obtained from Israel CBS and from the Civil Administration Department of Statistics in Ramallah, Yest BanI<. Owing to use of different sources, data for this period do not necessarily correspond to those in other tables.
0'1 tv

Table 1-13. Gaza Strip: Consumption and imports of industrial products, 1970·1990 (current million dollars)
Industrial goods Sources of Imports Total Year industrial (I/C) x 100
Domestic Imports Jordan Israel Other consumption
(C) production (1)
1970 27.71 35.50 - .. .. 63.21 56
1971 36.19 42.07 - 34.94 7.13 78.21 54
1972 40.71 55.31 - 48.43 6.88 96.02 58
1973 50.95 69.05 - 61.88 7.17 120.00 57
1974 85.43 119.02 - 105.81 13.21 204.45 58
1975 96.06 149.86 - 143.19 6.67 245.92 61
1976 92.64 157.53 - 147.77 9.76 250.17 63
1977 121.79 195.96 - 187.21 8.75 317.75 62
1978 93.18 170.64 - 154.34 16.30 263.82 65
1979 113.84 190.96 - 170.28 20.68 304.80 63
1980 137.78 234.64 - 207.63 27.01 372.42 63
1981 122.42 276.79 - 251.35 25.44 399.21 69
1982 123.93 273.60 - 250.70 22.90 397.53 69
1983 135.41 287.20 - 267.80 19.40 422.61 68
1984 121.47 237.60 - 221.30 16.30 359.07 66
1985 128.44 239.70 - 224.30 15.40 368.14 65
1986 185.35 324.80 - 302.10 22.70 510.15 64
1987 220.25 347.40 - 323.10 24.30 567.65 61
1988 158.00 259.00 - 241.00 18.00 417.00 62
1989 148.00 242.00 - 225.00 17.00 390.00 62
1990 154.80 288.50 - 265.40 23.10 443.30 65
Sources:
1. Central Bank of Israel, Annual Report, various issues. 2. Israel, CBS, Judea, Samaria and Gaza Area Statistics, various issues.
Market shares (percentages)
Israel Other countries
.. .. 83 17
88 12
90 10
89 11
95 5
94 6
95 5
90 10
89 11
88 12
91 9
92 8
93 7
93 7
94 6
93 7
93 7
93 7
93 7
92 8 --
3. Data for the period 1987-1990 are based on published data and estimates obtained from Israel CBS and from the Civil Administration Department of Statistics in Ramallah, West Bank. Owing to use of different sources, data for this period do not necessarily correspond to those in other tables.
0\ W

Table 1-14. West Bank: Selected manufactured imports from Jordan, 1971-1990 (current million dollars)
Year Oil Dairy Paper and printing Textile and cotton Iron and steel Plastic materials products products products
1971 0.65 0.07 0.07 0.13 0.11 -1972 1.33 0.11 0.70 0.02 0.17 -1973 0.94 0.08 0.08 0.27 0.13 0.12
1974 1.05 0.25 0.04 0.40 0.21 0.05
1975 2.27 0.21 0.08 0.68 0.23 0.06
1976 2.18 0.21 0.08 0.49 0.17 0.16
1977 2.16 0.15 0.18 0.95 0.42 0.08
1978 3.44 0.18 0.26 0.54 0.12 0.04
1979 3.20 0.25 0.30 0.45 0.19 0.02
1980 3.92 0.38 0.21 0.15 0.18 0.01
1981 5.46 0.49 0.35 0.29 0.33 0.03
1982 7.41 0.41 0.20 0.12 0.26 0.04
1983 4.74 0.76 0.24 0.17 0.35 0.08
1984 6.99 0.39 0.19 0.13 0.31 0.09
1985 6.62 0.72 0.29 0.12 0.45 0.05
1986 8.53 0.63 0.52 0.32 0.61 0.08
1987 7.40 0.49 0.58 0.29 0.39 0.08
1988 4.20 .. .. .. . . .. 1989 4.50 .. .. . . .. ..
1990 4.50 .. .. .. . . .. ~ - ---
Sources:
1. Central Bank of Israel, Annual Report, various issues. 2. Israel, CBS, Judea, Samaria and Gaza Area Statistics, various issues.
Total manufactured imports a/
2.44
3.58
3.01
4.06
4.93
3.63
4.28
4.65
4.61
4.98
7.04
8.47
6.55
8.12
8.31
10.77
9.43
9.00
10.00
11.00
3. Data for the period 1987-1990 are based on published data and estimates obtained from Israel CBS and from the Civil Administration Department of Statistics in Ramallah, West Bank. Owing to use of different sources, data for this period do not necessarily correspond to those in other tables.
Note:
!i/ Including other manufactured imports not cited in the table.
!
0"\
"'"

Table '-15. West Bank and Gaza Strip: Selected manufactured imports from abroad via Israel, 1971-1987 (current million dollars)
Intermediate and raw materials Coffee, Electrical
Mi lk tea and Total equipment Year powder spi ces Flour Oi l foodstuff Wood Text i le Iron and steel Plastic and
products products machinery
1971 0.73 0.25 5.85 3.25 13.03 0.23 1.00 0.18 0.03 0.65
1972 0.36 0.25 4.29 3.22 12.42 0.41 0.91 0.24 0.07 1.31
1973 0.13 0.33 3.28 2.30 9.53 0.38 1.86 0.26 0.11 1.34
1974 0.48 0.54 10.37 2.34 20.44 0.80 1.56 1.00 0.35 1.93
1975 1.73 0.38 3.96 5.61 9.52 0.85 1.41 1.32 0.25 2.84
1976 2.69 0.79 7.28 6.08 22.07 0.85 1.54 1.31 0.26 3.60
1977 2.32 1.55 6.51 7.19 22.06 0.74 2.05 1.26 0.52 4.47
1978 2.67 1. 70 5.50 1.39 21.95 0.99 2.21 1.86 0.57 7.69
1979 2.70 3.47 3.74 11.58 25.31 1.96 3.13 2.72 1.41 13.84
1980 3.16 3.54 2.98 12.92 31.65 2.00 4.97 4.27 1.45 12.10
1981 3.01 2.10 3.04 8.80 20.18 2.52 5.82 2.78 1.72 8.03
1982 3.36 2.62 5.22 8.52 23.13 4.48 4.61 2.46 1.77 10.71
1983 2.42 3.49 2.07 5.38 14.34 4.80 4.55 2.29 2.23 9.76
1984 2.32 5.32 1.50 6.04 17.95 2.84 3.35 1.83 2.11 8.03
1985 3.67 4.24 2.02 10.06 20.70 3.63 3.69 2.13 1.43 7.71
1986 4.86 2.27 4.14 7.07 19.70 3.29 4.51 3.16 2.94 15.58
1987 3.62 1.30 3.53 4.72 15.42 6.20 5.95 3.55 3.98 13.10 ~-
Sources:
1. Central Bank of Israel, Annual Report, various issues. 2. Israel, CBS, Judea, Samaria and Gaza Area Statistics, various issues.
Note:
p./ Including other manufactured imports not cited in the table.
Total manufactured
imports p./
19.16
19.91
17.41
30.52
30.14
38.22
39.33
46.70
81. 71
76.70
65.50
71.60
65.40
58.10
61.22
81.04
80.65
<1'1 U1

Table 2-1. West Bank: Agricultural and industrial exports, 1971·1990
Exports Exports as a share of: Shares of total exports (current million dollars) (percentages) (percentages)
Year Total Agricultural Industrial GNP GOP Agricultural Industrial
products products exports exports
1971 39.68 7.86 31.82 19 24 20 80
1972 51.52 14.31 37.21 18 25 28 72
1973 57.76 14.52 43.24 i7 23 25 75
1974 91.83 20.04 71.79 17 22 22 78
1975 109.33 24.54 84.79 20 21 22 78
1976 124.23 28.30 95.93 20 26 23 77
1977 119.59 37.35 82.24 19 25 31 69
1978 139.51 42.10 97.41 21 27 30 70
1979 149.17 38.99 110.18 19 26 26 74
1980 191.53 48.11 143.42 19 24 25 75
1981 209.53 47.13 162.40 23 31 22 78
1982 201.10 47.80 153.30 19 27 24 76
1983 201.00 46.80 154.20 18 25 23 77
1984 184.50 49.00 135.50 18 23 27 73
1985 166.40 47.40 119.00 17 22 28 72
1986 238.40 40.40 198.00 16 19 17 83
1987 228.00 41.50 186.50 13 17 18 82
1988 183.00 36.60 146.40 10 16 20 80
1989 142.00 29.80 112.20 8 11 21 79
1990 121.80 27.80 94.00 7 10 ____ ~3_ 77 -- -
Sources:
1. Israel, CBS, Statistical Abstract of Israel, various issues. 2. Israel, CBS, Judea, Samaria and Gaza Area Statistics, various issues. 3. Data for the period 1987-1990 are based on published data and estimates obtained from Israel CBS.
I
I
0'1 0'1

Table 2-2. Gaza Strip: Agricultural and industrial exports, 1971·1990 (current million dollars)
Thereof: Exports as a share of Shares of total exports (percentages) (percentages)
Year Total Agricultural Industrial GNP GOP Agricultural Industrial
products products exports exports
1971 27.56 20.35 7.21 35 41 74 26
1972 32.07 19.76 12.31 29 40 62 38
1973 43.15 25.10 18.05 27 38 58 42
1974 61.39 30.09 31.30 28 34 49 51
1975 83.01 37.57 45.44 35 50 45 55
1976 103.68 46.74 56.94 37 52 45 55
1977 132.66 70.11 62.55 44 61 53 47
1978 121.74 58.75 62.99 42 60 48 52
1979 120.96 57.63 63.33 31 47 48 52
1980 152.64 59.84 92.80 34 52 39 61
1981 189.19 55.15 134.04 40 64 29 71
1982 190.00 57.20 132.80 39 64 30 70
1983 180.10 46.70 133.40 33 59 26 74
1984 114.90 27.50 87.40 25 43 24 76
1985 106.00 30.90 75.10 26 41 29 71
1986 139.70 34.80 104.90 23 38 25 75
1987 130.20 32.40 97.80 21 35 25 75
1988 100.80 28.70 72.10 13 21 28 72
1989 94.00 41.10 52.90 13 19 44 56
1990 92.40 45.10 47.30 14 18 49 51
Sources:
1. Israel, CBS, Statistical Abstract of Israel, various issues. 2. Israel, CBS, Judea, Samaria and Gaza Area Statistics, various issues. 3. Data for the period 1987-1990 are based on published data and estimates obtained from Israel CBS.
I
I
I
I
0'\ -.J

Table 2-3. West Bank: Agricultural and industrial exports by market, 1971-1990
Agricultural exports by market Industrial exports by market Year million dollars million dollars percentages percentages
Jordan Israel Others Jordan Israel Others Jordan Israel Others Jordan Israel
1971 4.66 3.19 - 59 41 - 13.67 17.61 0.54 43 55
1972 10.88 3.43 - 76 24 - 14.67 22.12 0.43 39 59
1973 6.05 8.48 - 42 58 - 9.71 33.12 0.40 22 77
1974 7.74 12.31 - 39 61 - 19.06 52.11 0.63 26 73
1975 11.15 10.46 2.93 45 43 12 23.64 59.30 1.44 28 70
1976 12.38 13.55 2.37 44 48 8 30.79 64.11 1.03 32 67
1977 21.41 15.94 57 43 - 22.82 58.38 1.03 28 71
1978 25.35 16.75 - 60 40 - 36.79 59.28 1.34 38 61
1979 20.60 18.40 - 53 47 - 37.54 71.66 0.98 34 65
1980 21.06 27.10 - 44 56 - 58.12 83.68 1.62 40 58
1981 24.60 22.53 - 52 48 - 52.44 108.42 1.50 32 67
1982 30.30 17.00 - 64 36 - 60.20 92.10 1.00 39 60
1983 23.80 23.00 - 51 49 - 42.10 111.00 1.10 27 72
1984 33.50 15.50 68 32 - 50.00 84.40 1.10 37 62
1985 32.50 14.90 - 69 31 - 36.80 81.20 1.00 31 68
1986 23.80 16.60 - 60 40 - 58.00 140.00 0.90 29 70
1987 22.00 19.50 - 57 43 - 44.40 141.00 1.30 22 77
1988 17.10 19.50 - 47 53 - 29.20 117.20 1.30 20 79
1989 17.60 12.20 - 59 41 - 30.70 81.50 1. 50 27 72
1990 10.20 17.60 - 37 63 - 21.70 70.30 2.00 23 75 ~-
Sources:
1. Israel, CBS, Statistical Abstract of Israel, various issues.
2. Israel, CBS, Judea, Samaria and Gaza Area Statistics, various issues.
3. Data for the period 1987-1990 are based on published data and estimates obtained from Israel CBS.
Others
2
2
1
1
2
1
1
1
1
2
1
1
1
1
1
1
1
1
1
2
0\ co

Year
1968
1969
1970
1971
1972
1973
1974
1975
1976
1977
1978
1979
1980
1981
1982
1983
1984
1985
1986
1987
1988
1989
1990
Sources:
- 69 -
Table 2-4. West Bank and Gaza Strip: Agricultural exports to Jordan and Israel as proportion of Jordanian and Israeli agricultural imports, 1968-1990
(percentages)
Shares of West Bank Shares of Gaza Strip agricultural exports in agricultural exports in total
total Jordanian and Israeli agricultural Jordanian and Israeli imports agricul tural imports
Jordan Israel Jordan Israel
20.0 1. 17 5.70 1.23
16.0 1.30 5.10 0.70
17.0 1.20 5.40 2.50
6.0 1. 10 4.23 0.80
12.3 1.30 3.74 1.10
4.3 2.00 4.31 1.70
3.8 1.55 5.70 0.70
5.7 1.40 8.60 1.00
4.5 1.97 8.80 1.41
4.2 1.30 8.10 1.42
5.6 1.82 7.30 1.87
2.9 1.20 4.40 1.18
2.7 2.10 3.50 1.80
2.9 1.60 3.02 1.59
3.4 1.40 3.10 1.29
3.8 2.60 3.70 1.97
5.3 1. 70 2.40 0.90
5.6 1.80 2.80 1.24
3.9 2.01 3.10 1.67
3.2 2.00 3.00 1.50
3.1 1.50 3.10 1.40
3.0 1.30 2.90 1.30
2.8 1.20 2.90 1. 20
1. Data on Jordanian and Israeli agricultural imports are from FAD Trade Yearbook, various issues.
2. Data on West Bank and Gaza Strip agricultural exports are from tables 2-3 and 2·S.

TabLe 2-5. Gaza Strip: Agricultural and industrial exports by market, 1971·1990
Agricultural exports by market
Year (million dollars) (percentages)
Jordan Israel Others Jordan Israel Other
1971 3.27 2.47 14.61 16 12 72
1972 3.29 2.68 13.62 17 14 69
1973 4.55 7.07 13.48 18 28 54
1974 11.28 6.05 12.67 38 20 42
1975 16.62 7.54 13.41 44 20 36
1976 24.28 9.69 12.77 52 21 27
1977 40.30 17.30 12.45 57 25 18
1978 32.90 17.22 8.63 56 29 15
1979 30.46 18.28 8.88 53 32 15
1980 26.95 23.46 9.43 45 39 16
1981 25.49 22.69 6.96 46 41 13
1982 34.50 16.60 6.10 60 29 11
1983 22.50 17.20 7.00 48 37 15
1984 14.90 8.40 4.20 54 31 15
1985 16.10 10.10 4.70 52 33 15
1986 18.80 13.80 2.20 54 40 6
1987 11.80 18.50 2.10 37 57 6
1988 16.40 6.00 6.30 57 21 22
1989 22.20 13.10 5.30 54 32 13
1990 20.30 16.70 8.10 45 37 18
Sources:
1. Israel, CBS, Statistical Abstract of Israel, various issues.
2. Israel, CBS, Judea, Samaria and Gaza Area Statistics, various issues.
3. Data for the period 1987-1990 are based on published data and estimates obtained from Israel, CBS.
Industrial exports to Israel
(million dollars)
7.21
12.31
18.05
31.30
45.41
56.94
62.50
62.94
63.33
92.76
133.93
132.90
133.90
87.40
75.10
104.90
97.80
72.10
52.90
47.30
-J o

Year
1971
1972
1973
1974
1975
1976
1977
1978
1979
1980
1981
1982
1983
1984
1985
1986
1987
1988
1989
1990
Sources:
- 71 -
Table 2-6. West Bank: Industrial exports to Jordan as a proportion of Jordanian industrial imports, 1971-1990
(percentages)
Total industrial exports Industrial exports to Jordan Share of West Bank industrial exports in total Jordanian
industrial imports
31.82 13.67 12 37.21 14.67 9 43.24 9.71 5 71.79 19.06 7 84.79 23.64 6 95.93 30.79 6 82.24 22.82 3 97.41 36.79 5
110.18 37.54 3
143.42 58.12 5 162.40 52.44 4 153.30 60.20 4 154.20 42.10 3 135.50 50.00 4 119.00 36.80 3 198.00 58.00 5 186.50 44.40 3 146.40 29.20 2 112.20 30.70 2
94.00 21.70 2
1. Data on Jordanian industrial imports are from Central Bank of Jordan, Annual Report, various issues.
2. Data on West Bank industrial exports are from tables 2-1 and 2-3.

Table 2-7_ ~est Bank: Production and marketing of vegetables, 1970-1990
Oomestic Exports Exports share of Market shares Market shares Year production production (thousand tons) (percentages)
(thousand tons) (percentages) Jordan Israel Gaza Strip Jordan Israel
1970 99.9 31.7 32 25.8 4.9 1.0 81 16
1971 99.4 24.1 24 14.3 9.4 0.4 59 39
1972 111.1 24.5 22 11.6 12.1 0.8 47 49
1973 96.7 23.3 24 5.3 17.5 0.5 23 75
1974 141.4 40.8 29 2.8 36.5 1.5 7 89
1975 143.4 34."7 24 4.2 30.1 0.4 12 87
1976 151.8 34.6 23 12.4 21.6 0.6 36 62
1977 158.4 35.1 22 12.2 21.9 1.0 35 62
1978 167.7 57.:3 34 16.1 40.7 0.5 28 71
1979 149.2 47.5 32 10.8 36.5 0.2 23 76
1980 165.1 66.9 40 16.8 49.9 0.2 25 75
1981 202.2 113.8 56 37.8 75.8 0.2 33 67
1982 208.2 121.5 58 60.6 60.8 0.1 50 50
1983 247.8 128.1 52 61.4 55.4 11.3 48 43
1984 246.8 128.0 52 79.9 47.1 1.0 62 37
1985 259.3 133.2 51 103.0 29.5 0.7 77 22
1986 255.0 111.1 44 85.9 25.0 0.2 77 22
1987 254.8 70.3 28 47.6 22.4 0.3 68 31
1988 243.7 75.5 31 19.5 55.0 1.0 26 73
1989 213.5 61.5 29 4.0 56.0 1.5 6 91
1990 224.5 58.4 26 9.4 47.0 2.0 16 81 -- ---- -- ----- --- -- -- --- -----
Sources:
1. Israel, Central Bureau of Statistics, Statistical Abstract of Israel, various issues.
2. Israel, Central Bureau of Statistics, Agricultural Branch Statistics of Judea, Samaria and Gaza, various issues.
Gaza Strip
3
2
4
2
4
1
2
3
1
1
-
--
9
1
1
1
1
1
3
3
I
I
!
-.J tv
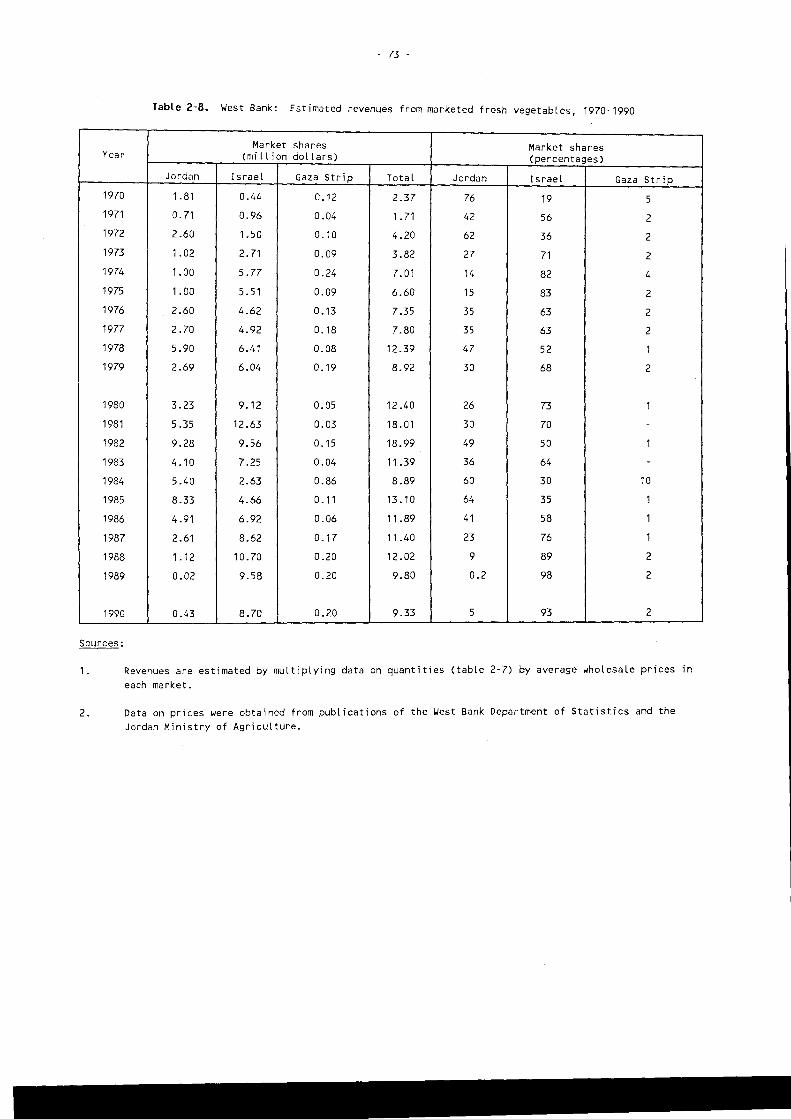
- 73 -
Table 2-8_ West Bank: Estimated revenues from marketed fresh vegetables, 1970-1990
Market shares Market shares Year (million dollars) (percentages)
Jordan Israel Gaza Strip Total Jordan Israel Gaza Strip 1970 1.81 0.44 0.12 2.37 76 19 5 1971 0.71 0.96 0.04 1. 71 42 56 2 1972 2.60 1.50 0.10 4.20 62 36 2 1973 1.02 2.71 0.09 3.82 27 71 2 1974 1.00 5.77 0.24 7.01 14 82 4
1975 1.00 5.51 0.09 6.60 15 83 2
1976 2.60 4.62 0.13 7.35 35 63 2
1977 2.70 4.92 0.18 7.80 35 63 2
1978 5.90 6.41 0.08 12.39 47 52 1
1979 2.69 6.04 0.19 8.92 30 68 2
1980 3.23 9.12 0.05 12.40 26 73 1
1981 5.35 12.63 0.03 18.01 30 70 -
1982 9.28 9.56 0.15 18.99 49 50 1
1983 4.10 7.25 0.04 11.39 36 64 -1984 5.40 2.63 0.86 8.89 60 30 10
1985 8.33 4.66 0.11 13 .10 64 35 1
1986 4.91 6.92 0.06 11.89 41 58 1
1987 2.61 8.62 0.17 11.40 23 76 1
1988 1.12 10.70 0.20 12.02 9 89 2
1989 0.02 9.58 0.20 9.80 0.2 98 2
1990 0.43 8.70 0.20 9.33 5 93 2
Sources:
1. Revenues are estimated by multiplying data on quantities (table 2-7) by average ~holesale prices in each market.
2. Data on prices ~ere obtained from publications of the West Bank Department of Statistics and the Jordan Ministry of Agriculture.

TabLe 2-9. West Bank: Production and marketing of fresh fruits and citrus, 1970·1990
Domestic Exports Exports share of Market shares Market shares Year production production (thousand tons) (percentages)
(thousand tons) (percentages) Jordan Israel Gaza Strip Jordan Israel Gaza Strip
1970 96.0 41.4 43 35.8 2.4 3.2 86 6 8
1971 117.6 60.8 52 54.6 4.7 1.5 90 8 2
1972 103.3 52.9 51 43.4 8.5 1.0 82 16 2
1973 117.4 51.0 43 40.8 8.0 2.2 80 16 4
1974 132.5 58.6 44 39.1 17.1 2.4 67 29 4
1975 140.1 60.9 43 42.9 12.0 6.0 70 20 10
1976 150.7 49.8 33 40.9 1.8 7.1 82 4 14
1977 154.9 70.2 45 54.8 12.9 2.5 78 18 4
1978 176.1 79.4 45 60.1 16.1 3.2 76 20 4
1979 166.1 69.8 42 48.5 18.6 2.7 69 27 4
1980 165.1 72.4 44 51.5 18.0 2.9 71 25 4
1981 179.4 94.1 52 65.5 23.5 5.1 70 25 5
1982 179.4 93.2 52 75.2 12.1 5.9 81 13 6
1983 167.5 82.5 49 69.0 10.5 3.0 84 13 3
1984 168.0 82.6 49 67.1 13.5 2.0 81 16 3
1985 161.9 82.5 51 67.4 8.3 6.8 82 10 8
1986 173.6 83.8 48 70.2 9.3 4.3 84 11 5
1987 162.7 72.0 44 64.5 3.0 4.5 90 4 6
1988 178.2 83.3 47 74.1 2.5 6.7 89 3 8
1989 101. 7 77.6 76 69.8 2.0 5.8 90 3 7
1990 172.2 81.0 47 72.9 1.5 6.6 90 2 8
Sources:
1. Israel, Central Bureau of Statistics, Statistical Abstract of Israel, various issues.
2. Israel, Central Bureau of Statistics, Agricultural Branch Statistics of Judea, Samaria and Gaza, various issues.
!
--l
"'"

Table 2-10. West Bank: Estimated revenues from marketed fresh fruits and citrus, 1970-1990
Market shares Market shares (mill ion dollars) (percentages)
Year Jordan Israel Gaza Strip Total Jordan Israel Gaza Strip
1970 7.10 0.36 0.50 7.96 89 5 6
1971 5.94 0.77 0.25 6.96 85 11 4
1972 10.40 1.81 0.19 12.40 84 15 1
1973 9.23 2.04 0.65 11.92 77 17 6
1974 12.77 3.13 0.44 16.34 78 19 3
1975 23.04 8.04 1.52 32.60 71 25 4 1976 30.70 0.61 2.40 33.71 91 2 7 1977 38.90 3.44 0.66 43.00 90 8 2 1978 47.30 4.40 0.87 52.57 90 8 2 1979 34.20 5.05 0.73 39.98 85 13 2
1980 45.30 5.99 0.96 52.25 87 11 2 1981 45.58 6.78 1.47 53.83 85 13 2 1982 58.55 2.98 1.45 62.98 93 5 2 1983 39.23 1.64 0.47 41.34 95 4 1 1984 30.43 1.18 0.18 31. 79 96 3 1 1985 39.91 2.10 1.72 43.73 91 5 4 1986 36.56 5.52 2.55 44.63 82 12 6 1987 30.31 1.81 2.72 34.84 87 5 8 1988 15.80 0.72 1.44 17.96 88 4 8 1989 8.60 0.38 0.57 9.55 90 4 6
1990 9.10 0.30 0.60 10.00 91 3 6 -
Sources:
1. Revenues are estimated by multiplying data on quantities (table 2-9) by average wholesale prices in each market.
2. Data on prices were obtained from publications of the West Bank Department of Statistics and the Jordan Ministry of Agriculture.
-J Ln

TabLe 2-11_ Gaza Strip: Production and marketing of fresh vegetables, 1970-1990
Domestic Exports Exports share of Market shares Production production (thousand tons)
Year (thousand tons) (percentages) Israel II. Bank EC !!./ Israel
1970 36.0 4.30 12 0.50 3.7 0.1 12
1971 38.7 4.80 12 0.60 4.2 - 12
1972 38.9 6.10 16 1.30 4.8 · 21
1973 42.5 8.80 21 4.90 3.9 · 56
1974 38.1 6.60 17 3.20 3.4 · 48
1975 46.2 8.50 18 4.50 4.0 · 53
1976 48.0 10.90 23 6.40 4.5 · 59
1977 50.5 15.00 30 6.30 8.7 · 42
1978 54.0 18.50 34 7.90 10.6 - 43
1979 51.3 15.50 30 8.00 7.5 - 52
1980 61.3 20.90 34 8.70 12.2 - 42
1981 72.3 26.76 37 6.86 19.0 0.9 26
1982 76.6 23.01 30 7.61 15.0 0.4 33
1983 74.8 19.00 25 6.50 11.8 0.7 34
1984 86.7 25.40 29 9.00 16.0 0.4 35
1985 104.5 34.10 33 13.20 20.4 0.5 39
1986 104.3 33.30 32 15.50 17.3 0.5 46
1987 119.0 41.30 35 19.80 21.0 0.5 48
1988 129.9 45.44 35 2.74 42.2 0.5 6
1989 160.6 38.02 24 1.42 36.4 0.20 4
1990 138.3 57.56 42 0.04 57.2 0.32 -
Sources:
1. Israel, Central Bureau of Statistics, Statistical Abstract of Israel, various issues.
2. Gaza Department of Agriculture, Agricultural Statistics, various issues.
~ote:
~/ Prior to 1988, data refer to exports via Agrexco; in 1988-1990, direct export arrangements were operative.
Market shares (percentages)
II. Bank
86
88
79
44
52
47
41
58
57
48
58
71
65
62
63
60
52
51
93
95
99
EC
2
-
-.
-
-
--.
-
-
3
2
4
2
1
2
1
1
1
1
I
I
--.l m

Table 2-12. Gaza Strip: Estimated revenues from marketed fresh vegetables, 1970·1990
Market shares Market shares Year (million dollars) (percentages)
\.lest Bank Israel EC~I Total \.lest Bank Israel EC~!
1970 0.32 0.04 .. 0.36 89 11 .,
1971 0.30 0.04 .. 0.34 88 12 .,
1972 0.49 0.13 .. 0.62 79 21 .,
1973 0.45 0.56 ., 1.01 45 55 .. 1974 0.41 0.39 ., 0.80 51 49 .. 1975 0.54 0.61 ., 1.05 51 49 .. 1976 0.75 1.07 ., 1.82 41 59 .. 1977 1.06 0.76 ., 1.82 58 42
"
1978 1.27 0.95 ., 2.22 57 43 .. 1979 0.90 0.96 ., 1.86 48 52
"
1980 1.64 1.17 .. 2.81 58 42 .. 1981 2.39 0.85 .. 3.24 74 26 .. 1982 1.77 0.90 .. 2.67 66 34 .. 1983 1.30 0.72 ., 2.02 64 36 .. 1984 2.22 1.10 .. 3.32 67 33 .. 1985 3.19 1.86 ., 5.05 63 37
"
1986 5.03 4.17 .. 9.20 55 45 .. 1987 7.30 6.61 .. 13.91 52 48 .. 1988 16.40 1.10 1.01 18.51 89 6 5
1989 15.30 0.55 0.50 16.35 94 3 3
1990 20.90 0.39 0.43 21. 72 96 2 2 -
Sources: -1-.-----lsrael, Central Bureau of Statistics, Statistical Abstract of Israel, various issues. 2. Gaza Department of Agriculture, Agricultural Statistics, various issues. 3. Revenues are estimated by multiplying data on quantities (table 2-11) by data on average wholesale prices in each market for the respective year. Note: ---- ~I Separate data on exports to EC were not available for the period 1970·1987.
--J
I --J

Table 2-13. Gaza Strip: Production and marketing of citrus, 1970·1990
Domestic EXports Exports share Market shares Year production of production (thousand tons)
(thousand tons) (percentages) Jordan Israel liest Eastern Jordan ( including Bank European Agrexco) countries
1970 142.0 130.0 92 32.1 22.9 75.0 25 -1971 175.0 162.0 93 4.7 11.3 40.6 105.4 3
1972 178.0 166.5 93 36.3 110.7 19.5 - 22
1973 205.1 192.2 94 37.0 103.3 9.9 42.0 19
1974 211.9 197.0 93 73.0 74.7 6.2 43.1 37
1975 201.4 193.1 96 110.0 26.0 4.6 52.5 57
1976 242.2 230.3 95 144.2 27.6 3.2 55.3 63
1977 232.3 227.3 98 158.2 21.5 1.9 45.7 70
1978 180.6 176.3 97 120.4 17.2 2.0 36.7 68
1979 189.3 183.2 97 127.4 10.4 2.3 43.1 69
1980 168.1 158.5 94 107.4 8.1 1.4 41.6 68
1981 179.3 167.1 93 121.3 19.5 4.1 22.2 73
1982 199.9 184.3 92 116.7 36.8 2.0 28.8 63
1983 166.5 148.9 90 84.9 21.1 3.0 39.9 57
1984 159.5 136.4 88 101.2 24.9 3.2 7.1 75
1985 175.5 163.5 93 91.2 52.7 2.9 16.7 56
1986 146.0 136.3 93 81.6 30.9 3.8 20.0 60
1987 148.1 143.9 90 82.3 40.1 11.7 9.8 57
1988 118.0 107.5 83 51.1 32.1 5.5 18.8 47
1989 129.4 109.8 85 39.2 55.1 7.2 8.3 36
1990 196.8 163.6 83 48.3 96.5 6.6 12.2 29
Sources:
1. Israel, Central Bureau of Statistics, Statistical Abstract of Israel, various issues. 2. Gaza Department of Agriculture, Agricultural Statistics, various issues.
Market shares (percentages)
Israel liest ( including Bank Agrexco)
- 17
7 25
66 12
54 5
38 3
14 2
12 1
9 1
10 1
6 1
5 1
12 2
20 1
14 2
18 2
32 2
23 3
28 8
30 5
50 6
59 4
Eastern European countries
58
65
-
22
22
27
24
20
21
24
26
13
16
27
5
10
14
7
18
8
8
I I
-..J 00
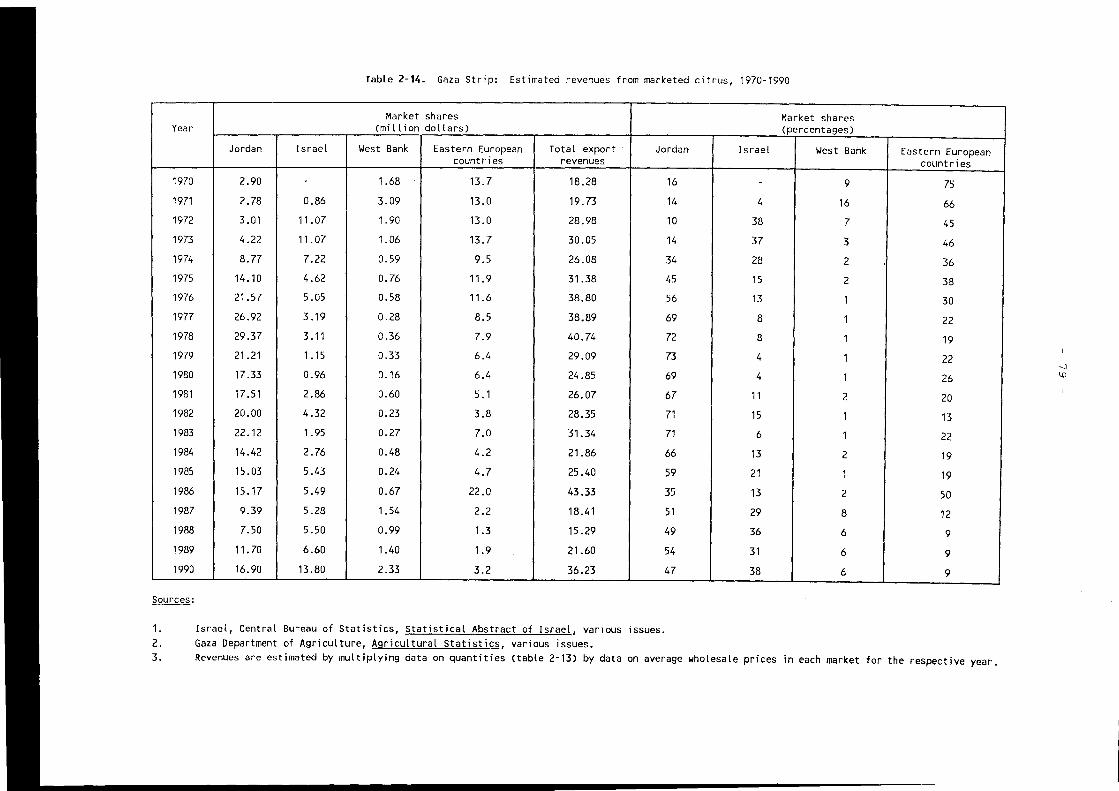
Table 2-14. Gaza Strip: Estimated revenues from marketed citrus, 1970-1990
Market shares Market shares Year (million dollars) (percentages)
Jordan Israel liest Bank Eastern European Total export Jordan Israel liest Bank Eastern European countries revenues countries
1970 2.90 - 1.68 13.7 18.28 16 - 9 75
1971 2.78 0.86 3.09 13.0 19.73 14 4 16 66 1972 3.01 11.07 1.90 13.0 28.98 10 38 7 45
1973 4.22 11.07 1.06 13.7 30.05 14 37 3 46
1974 8.77 7.22 0.59 9.5 26.08 34 28 2 36 1975 14.10 4.62 0.76 11.9 31.38 45 15 2 38 1976 21.57 5.05 0.58 11.6 38.80 56 13 1 30 1977 26.92 3.19 0.28 8.5 38.89 69 8 1 22 1978 29.37 3.11 0.36 7.9 40.74 72 8 1 19 1979 21.21 1.15 0.33 6.4 29.09 73 4 1 22 1980 17.33 0.96 0.16 6.4 24.85 69 4 1 26 1981 17.51 2.86 0.60 5.1 26.07 67 11 2 20 1982 20.00 4.32 0.23 3.8 28.35 71 15 1 13 1983 22.12 1.95 0.27 7.0 31.34 71 6 1 22 1984 14.42 2.76 0.48 4.2 21.86 66 13 2 19 1985 15.03 5.43 0.24 4.7 25.40 59 21 1 19 1986 15.17 5.49 0.67 22.0 43.33 35 13 2 50 1987 9.39 5.28 1.54 2.2 18.41 51 29 8 12 1988 7.50 5.50 0.99 1.3 15.29 49 36 6 9 1989 11.70 6.60 1.40 1.9 21.60 54 31 6 9 1990 16.90 13.80 2.33 3.2 36.23 47 38 6 9
--
Sources:
1. Israel, Central Bureau of Statistics, Statistical Abstract of Israel, various issues. 2. Gaza Department of Agriculture, Agricultural Statistics, various issues. 3. Revenues are estimated by multiplying data on quantities (table 2-13) by data on average wholesale prices in each market for the respective year.
--J \D

Table 2-15. Gaza Strip: Production and marketing of fresh fruit, 1970-1990
Year Domestic Exports Exports share of Guava exports production production (thousand tons)
(thousand tons) (percentages) Jordan \Jest Bank Israel Total Jordan
1970 18.40 6.02 33 0.90 2.60 0.12 3.62 0.60
1971 22.90 7.82 34 0.48 4.10 0.12 4.70 0.32
1972 26.40 6.90 26 1.14 2.04 0.96 4.14 0.76
1973 21.10 7.70 36 0.66 0.78 3.18 4.62 0.44
1974 21.70 11.94 55 0.90 2.40 3.84 7.14 0.60
1975 21.80 11.23 51 1.78 2.16 3.24 7.18 0.41
1976 17.30 8.84 51 0.78 2.10 2.40 5.28 0.52
1977 18.60 10.00 54 1.14 1.92 2.94 6.00 0.76
1978 21.10 11.72 55 1.62 1.92 3.50 7.04 1.08
1979 20.50 11.00 54 1.82 1. 74 3.18 6.74 0.98
1980 17.80 9.52 53 1.56 1.56 2.60 5.72 1.04
1981 18.30 8.00 44 2.00 2.04 1.08 5.12 0.80
1982 13.40 8.47 63 2.10 1.14 2.30 5.54 0.65
1983 15.20 8.20 54 2.10 1.80 1.40 5.30 0.40
1984 13.30 5.60 42 1.70 0.96 1.20 3.86 0.30
1985 13.70 6.26 46 2.50 1.14 0.84 4.48 0.46
1986 16.57 7.32 44 3.80 1.14 0.12 5.06 0.67
1987 13.70 10.58 77 3.80 2.90 1.62 8.32 0.50
1988 19.30 7.77 40 3.50 3.00 0.55 7.05 0.50
1989 16.00 6.65 42 1.07 4.30 0.28 5.65 -
1990 16.00 4.55 28 1.00 3.00 - 4.00 0.25 ~- _ .. _----
Source: Gaza Department of Agriculture, Agricultural Statistics, various issues.
Date exports (thousand tons)
\Jest Bank Israel
1.72 0.08
2.72 0.08
1.36 0.64
0.52 2.12
1.60 2.60
1.44 2.20
1.44 1.60
1.28 1.96
1.28 2.32
1.16 2.12
1.04 1.72
1.36 0.72
0.76 1.52
1.26 1.24
0.64 0.80
0.76 0.56
0.08 1.51
0.68 1.08
0.22 -1.00 -
0.30 -
Total
2.40
3.12
2.76
3.08
4.80
4.05
3.56
4.00
4.68
4.26
3.80
2.88
2.93
2.90
1.74
1.78
2.26
2.26
0.72
1.00
0.55
I
00 o

TabLe 2-16. Gaza Strip: Estimated revenues from marketed fresh fruit, 1970-1990
Year Market shares Market shares (million dollars) (percentages)
Jordan Israel West Bank Total Jordan Israel West Bank 1970 0.20 0.02 0.57 0.79 25 3 72 1971 0.12 0.03 1.02 1.17 10 3 87 1972 0.29 0.25 0.53 1.07 27 23 50 1973 0.28 1.36 0.33 1.97 14 69 17 1974 0.29 1.26 0.79 2.34 12 54 34 1975 0.73 1.46 0.97 3.16 23 46 31 1976 0.45 1.41 1.23 3.09 15 46 39 1977 0.47 1.21 0.81 2.49 19 49 32 1978 0.83 1.79 0.99 3.61 23 50 27 1979 0.88 1.68 0.91 3.47 26 48 26 1980 1.07 1.77 1.07 3.91 28 45 27 1981 1.19 0.65 1.23 3.07 39 21 40 1982 0.59 6.98 0.49 8.06 7 87 6 1983 0.37 0.48 0.47 1.32 28 36 36 1984 0.48 0.42 0.33 1.23 39 34 27 1985 1.07 0.50 0.68 2.25 48 22 30 1986 3.33 0.14 1.41 4.88 68 3 29 1987 2.41 1.51 0.95 4.87 50 31 19 1988 1.40 0.18 1.10 2.68 53 6 41 1989 0.48 0.24 0.55 1.27 38 19 43 1990 0.43 - 0.39 0.82 52 - 48 Sources:
1. Israel, CentraL Bureau of Statistics, Statistical Abstract of Israel, various issues. 2. Gaza Department of Agriculture, Agricultural Statistics, various issues.
3. Revenues are estimated by multiplying data on quantities (table 2-15) by data on average wholesale prices in each market for the respective year.
(Xl
t-'

Year Olive Pickled oi l ol ives
1971 4.01 -1972 5.12 -
1973 0.68 -1974 7.63 -
1975 4.55 -
1976 7.30 -1977 2.21 0.72
1978 12.02 1.82
1979 8.43 -
1980 28.54 2.62
1981 24.05 2.03
1982 20.31 2.30
1983 13.75 2.47
1984 26.95 1.49
1985 0.69 0.03
1986 22.31 2.38
1987 8.64 0.22
1988 2.45 0.31
1989 9.88 0.73
1990 0.84 0.02
Sources:
TabLe 2-17. West Bank: Exports of industrial products to Jordan, 1971-1990 (current milLion dollars)
Margarine and dairy Sweets and Soaps Plastic Stone Marble products chocolates products
4.16 0.44 1.78 0.38 0.13 -
4.26 0.55 2.13 0.26 0.14 -4.62 0.62 2.14 0.33 0.19 -
5.11 0.73 2.78 0.32 0.17 -
9.13 0.86 4.01 0.44 1.22 -
9.29 1.32 4.07 0.64 2.62 -
9.82 1.18 4.12 0.73 2.06 0.93
11.95 0.87 3.89 0.93 2.58 1.77
16.30 0.81 4.26 0.44 2.62 .
15.24 0.57 4.43 0.38 3.48 1.37
14.23 0.61 4.23 0.24 3.26 3.21
19.02 0.21 4.28 0.29 1.86 6.43
13.93 - 3.71 0.77 4.49 3.55
17.67 - 3.55 0.44 5.66 4.46
18.40 - 3.43 0.32 11.87 0.16
17.29 - 3.65 0.52 11.66 0.15
18.08 - 4.15 0.33 10.92 0.13
15.10 - 2.37 0.23 6.66 -10.20 - 2.35 0.17 5.33 -
13.17 - 1.95 0.14 2.96 -
1. Israel, CBS, Judea, Samaria and Gaza Area Statistics, various issues. 2. Data for the period 1987-1990 are based on published data and estimates obtained from Israel CBS.
Others Total industrial exports a/
2.74 13.64
2.25 14.71
1.14 9.72
2.30 19.04
3.38 23.59
5.52 30.76
1.11 22.88
1.01 36.84
4.62 37.48
2.77 59.40
2.69 54.55
2.24 56.94
1.45 44.12
1.34 61.56
1.74 36.64
1.65 59.61
1.98 44.45
2.40 29.52
2.61 31.27
2.30 21.38
~/ The totals shown here are the sum of the components in the table, as reported in the original sources. These may diverge from the figures for total industrial exports shown in table 2-3 owing to discrepancies in the original data.
I
00 tv

Table 2-18. Uest Bank and Gaza Strip: Industrial exports to Israel, 1970-1990
Source Total industrial exports Year (million dollars) (million dollars) Uest Bank Gaza Strip Uest Bank
1970 12.20 3.40 15.60 78 1971 17.61 7.21 24.82 71 1972 22.12 12.31 34.43 64 1973 33.12 18.05 51. 17 65 1974 52.11 31.30 83.41 62 1975 59.29 45.41 104.70 57 1976 64.11 56.94 121.05 55 1977 58.38 62.50 120.88 48 1978 59.28 62.44 121. 72 49 1979 71.66 63.33 134.99 53
1980 83.68 92.76 176.44 47 1981 108.42 133.93 242.35 45 1982 92.10 132.80 224.90 41 1983 111.00 133.90 244.90 45 1984 84.40 87.40 171.80 49 1985 81.20 75.10 156.30 52 1986 140.00 104.90 244.90 57 1987 141.00 97.80 238.80 59 1988 117.20 72.10 189.30 62 1989 81.50 52.90 134.40 61
1990 70.30 47.30 143.00 60
Sources:
1. Israel, CBS, Judea, Samaria and Gaza Area Statistics, various issues. 2. Bank of Israel, Annual Report, various issues.
3. Data for the period 1987-1990 are based on published data and estimates obtained from Israel CBS.
Source (percentages)
Gaza Strip
22
29
36
35
38
43
47
52
51
47
53
55
59
55
51
48
43
41
38
39
40
00 w

Table 2-19_ West Bank: Merchandise trade balance, 1968-1990 (current million dollars)
Total Trade with Trade with Trade with Agricultural Industrial
Year balance Jordan Israel other count r i es trade balance trade balance
1968 -34_50 9.00 -39.00 -4.50 -5.00 -25.00
1969 -32.80 11.30 -39.00 -5.10 -5.10 -26.00
1970 -34.40 10.20 -38.40 -6.20 -8.40 -26.00
1971 -36.80 14.60 -40.20 -11.20 -6.10 -30.60
1972 -46.90 21.10 -55.70 -12.30 -3.00 -43.90
1973 -71.40 11.80 -73.50 -9.70 -8.40 -63.10
1974 -105.80 22.10 -112.70 -15.20 -11.90 -93.90
1975 -121.90 29.80 -134.80 -16.90 -15.70 -106.20
1976 -123.90 39.40 -144.80 -18.50 -17.50 -106.50
1977 -148.90 39.60 -167.10 -21.40 -10.90 -138.10
1978 -112.40 57.10 -142.40 -27.10 +3.80 -116.80
1979 -206.80 53.10 -215.40 -44.50 -11.32 -195.40
1980 -217.40 73.70 -244.30 -46.80 -13.90 -203.60
1981 -226.20 69.60 -254.80 -41.00 -13.10 -213.10
1982 -217.90 81.60 -257.30 -42.20 -2.50 -215.40
1983 -251.70 59.10 -272.90 -37.90 -10.30 -241.40
1984 -222.30 75.30 -263.20 -34.40 -18.20 -204.10
1985 -220.10 60.60 -243.40 -34.40 -13.50 -206.60
1986 -273.40 70.90 -295.10 -49.20 -36.90 -236.80
1987 -410.90 57.00 -420.20 -47.70 -58.30 -352.60
1988 -256.30 37.20 -249.30 -44.20 -25.60 -205.80
1989 -266.30 38.30 -263.30 -41.30 -27.20 -210.20
1990 -366.13 20.90 -334.90 -52.13 -39.20 -287.00
Sources: -1-.---- Israel, CBS, Judea, Samaria and Gaza Area Statistics, various issues. 2. Data for the period 1987-1990 are based on published data and estimates obtained from Israel CBS, as indicated in tables 1-1 and 2-1. Data
irregularities give rise to disparities between the total balance calculated according to markets and the total balance according to composition.
ro .,.

Total Year balance
1969 -17_00
1970 -19.90
1971 -21.10
1972 -32.16
1973 -40.20
1974 -75.80
1975 -93.33
1976 -83.60
1977 -104.30
1978 -76.60
1979 -99.70
1980 -116.60
1981 -124.20
1982 -120.40
1983 -151.40
1984 -164.50
1985 -175.40
1986 -238.30
1987 -245.00
1988 -221.70
1989 -210.00
1990 -256.72
Sources:
Table 2-20_ Gaza Strip: Merchandise trade balance, 1969-1990 (current million dollars)
Trade with Trade with Trade with Agricultural Jordan Israel other countries trade balance 1.20 -18_80 0_60 15.00
3.30 -23.90 0.70 14.00 3.40 -32.00 7.50 13.03 3.24 -41.90 6.50 10.70 4.50 -50.90 6.20 10.70
11.12 -85.02 -1.90 12.04 16.47 -113.60 3.80 11.30 24.20 -104.20 -3.60 17.20 40.30 -140.20 -4.40 19.20 32.90 -99.80 -9.70 31.10 30.40 -115.50 -14.60 27.90
26.90 -123.20 -20.30 25.40 25_10 -128.50 -20.80 19.10 34.50 -132.60 -22.30 20.40 22.60 -154.60 -19.40 1.80 14.90 -161.00 -18.40 -14.30 16.10 -173 .30 -18.20 -10.30 18_80 -228.10 -29.00 -18.40 11.80 -237.30 -19.50 -38.30 5.80 -220.70 -6.80 -19.55
12.20 -215.40 -6.80 3.90
17.33 -265.80 -8.25 1.80
Industrial trade balance
-32.00
-33.90
-34.90
-43.00
-51.00
-87.80
-104.60
-100.00
-133.40
-107.70
-127.30
-141.80
-142.80
-140.80
-153.30
-150.20
-165.10
-219.90
-217.00
-195.90
-191.20
-246.70
1. Israel, CBS, Judea. Samaria and Gaza Area Statistics, various issues. 2. Data for the period 1987-1990 are based on published data and estimates obtained from Israel CBS, as indicated in tables 1-2 and 2-2. Data
irregularities give rise to disparities between the total balance calculated according to markets and the total balance according to composition.
ro Ul

- 86 -
REFERENCES
Agricultural cooperative Union: Agricultural statistics, Nablus, west Bank,
various issues.
Alanani, Jawad: The development of Palestine agricultural exports, united Nations Economic and Social Commission for western Asia, December 1987.
Alberda, Th., et al: Food from drylands an integrated approach to planning of agricultural development, Kluwer Academic Publishers, The Netherlands,
1992.
An-Najah National University: Statistical bulletin of the west Bank and Gaza
Strip, Nablus, west Bank, various issues.
Appelbaum, Elie and Ulrich, Kohli: "Canada-United States trade: small-open economy hypothesis,": Canadian Journal of Economics,
Vol. II, No. I, pp. 1-14.
test for 1979,
Arab Chamber of Commerce: Monthly Report, Jerusalem, various issues.
Awad, Munir and J. Abu Omar: Agricultural input/output index in the West Bank and Gaza Strip, Rural Research Center, An-Najah National University, Nablus,
West Bank, various issues.
Awartani, Hisham: "The problem of marketing industrial products in the occupied territories," Samed al Igtisadi, No. 72, April-June, 1988, pp. 109-24
(in Arabic) .
Awartani, Hisham: "The agricultural sector in the West Bank and Gaza Strip", Geneva, 1993, UNCTAD/DSD/SEU/Misc.3.
Bahiri, Simcha: Industrialization in the West Bank and Gaza Strip, Jerusalem, West Bank Data Base Project, 1987.
Central Bank of Israel, Annual Report, various issues.
central Bank of Jordan, Annual Report, various issues.
Chacholoiades, Miltiades: International monetary theory and policy,
McGraw-Hill Co., 1978.
Citrus Producers Union for Gaza Strip: Annual Report, Gaza Strip, 1990.
Elawna, Atif: External trade of the West Bank and Gaza Strip, An-Najah National University, 1986a (in Arabic)
Financing in the West Bank and Gaza Strip, An-Najah National University, 1986b (in Arabic) .
The Israeli Direct and Indirect Revenues from the West Bank and Gaza Strip, AI-Bayader al-siyasi, October 1988, (in Arabic) .

- 87 -
"The impact of intifada on Palestinian and Israeli economies", Al-Siassa al-Dawlya, Vol. 98, October 1989 (in Arabic) .
El-Jafari, Mahmoud: The agricultural trade of Palestine, International Development Research Center, Canada, 1990.
"Non-tariff trade barriers: the case of the West Bank and Gaza Strip agriCUltural exports," Journal of World Trade, June (1991a)
"Demand for and supply of higher education in the West Bank and Gaza Strip," paper submitted to the Conference of Higher Education in the Arab World, Qatar, October (1992).
FAO, Trade Yearbook, various issues.
Gaza Strip Department of Agriculture, Agricultural Statistics, various issues.
International Monetary Fund: issues.
International Financial Statistics, various
Israel, Central Bureau of Statistics: Statistical abstract of Israel, Jerusalem, Israel, various issues, (a)
Monthly statistics of the administered territories, various issues, (b).
Quarterly statistics of the administered territories, various issues, (c).
Judea, Samaria, and Gaza Area Statistics, various issues, (d)
National accounts of Judea, Samaria and Gaza Area, 1968-1986, (e).
Foreign trade statistics, various issues, (f).
Jericho Department of Agriculture: Agricultural Statistics, Jericho, West Bank, various issues.
Jordan, Central Bank: Annual Report, various issues.
Jordan, Ministry of Agriculture: Agricultural Statistics, Amman, Jordan, various issues.
Kahan, David: Aqricultural and Water Resources in the West Bank and Gaza (1967-87), Jerusalem Post Press, Jerusalem, 1987.
Kattan, Hind: Manufacturing in the Bethlehem area, Arab Thought Forum, Jerusalem, 1990.
Kleiman, Ephrim: "Some basic problems of the economic relationships between Israel and the West Bank and Gaza Strip," unpublished manuscript, Hebrew University of Jerusalem, 1992.

- 88 -
Kokali, Nabeel: "The administration of industrial exhibitions", Maray
al-igtisadi, october 1989 (in Arabic) .
Maraya, monthly economic review, Jerusalem, 1990 (in Arabic) .
Report of Netherlands Government Mission: Export of aqricultural produce from the west Bank and Gaza Strip: difficulties and opportunities, 1987.
Rigby, Andrew: Economic aspects of the intifada, Palestinian Academic society for the Study of International Affairs (PASSIA), Jerusalem (september 1988),
in Arabic.
Roy, Sara: "The Gaza Strip a case of economic de-development," Journal of
Palestine Studies, 1987.
Salvatore, Dominick: International economics, Macmillan Publishing Co., 1983.
Shurmar, Hazem: Economic and social conditions during the intifada, PASSIA,
Jerusalem, 1989.
Todaro, Michael: Economic development in the third world, fourth ed.,
Lon~Jman Co., 1989.
UNCTAD: "Recent economic developments in the occupied Palestinian territories, with special reference to the external trade sector" (TD/B/1183),
1988.
"Recent economic developments in the occupied Palestinian territory" (TD/B/1221), 1989.
"Palestinian external trade under Israeli occupation" (UNCTAD/RDP/SEU/l), 1989.
"Recent economic developments in the occupied Palestinian territory" (TD/B/1266), 1990.
"Recent economic developments in the occupied Palestinian territory" (TD/B/1305), 1991.
"Developments in the economy of the occupied Palestinian territory - with special reference to external trade" (TD/B/41 (1) /3) .
"Selected statistical series on the economy of the occupied Palestinian territories (West Bank and Gaza Strip) 1968-1987", unpublished, January 1991.
West Bank Department of Agriculture: Agricultural Statistics, various issues.
World Bank, "Emergency assistance to the occupied territories", Washington, D.C., March 1994.


;..\oo:.J \ r' ~ \ .;:.. v.,.~·:.. Js- J.,..-J \ '-:L! ,.JWI .(,..;1 ~.) CjyJ1 )J>J ",l.S...i1 .:r ;~I ,-'11 ",1)>,-,",)< J...-JI J-. .
. ~ .)JI ~)J" . .>:'.) ~I~,;..c..;.jl ,-YI,)I,..5"I;I
J/ofDJlI!j~~il-~lli/;li~
~f;~lllra l'llIi:tit lfi!tJ1!!!t'J 4>16 fO!HU.l:J$]li :!;t~o iAicJIJI6 i>JfOJ*:!JrnWll!'J;t.: B 1*l}jff.J~-fr~ll!~ l1!o
HOW TO OBTAIN UNITED NATIONS PUBLICATIONS
United Nations publications may be obtained from bookstores and distributors throughout the world. Consult your bookstore or write to: United Nations, Sales Section, New York or Geneva.
COMMENT SE PROCURER LES PUBLICATIONS DES NATIONS UNIES
Les publications des Nations Unies wnt en vente dans les librairies et les agences deposita ires du monde entier. Informez-vous aupres de votre Iibraire ou adressez-vous a : Nations Unies, Section des ventes, New York ou Geneve.
KAK rrOIIY"IHTb H3il:AHJI.H OPTAHH 3AIJ;HH OB'bEil:HHEHHbIX HAIJ;HH
H3,[{aHHH OpraHHJau,HH 06'be,ltHHeHHhIx HaUHH MO)KHQ KynHTb B KHl-DKHbIX Mara-
3HHax H areHTCTBax BO Bcex paHoHax MHpa. HaBoAHTe crrpaBKH 06 H3.1l,aHH.RX B
BaweM KHH>KHOM Mara3HHe HJIH nHIllHTe no aApecy: OpraHH3aU;HR 06'be,l:lHH€HHhIX
HaU;HH, CexUHR no npo.n:am.e H3,[{aHHH, HbHJ-TIOpK H.l1H }KeHeBa.
COMO CONSEGUIR PUBLICACIONES DE LAS NACIONES UNIDAS
Las publicaciones de las Naciones Unidas estan en venta en Iibrerfas y casas distribuidoras en todas partes del mundo. Consulte a su librero 0 dirfjase a: Naciones Unidas, Secci6n de Ventas, Nueva York 0 Ginebra.
Printed at United Nations, Geneva GE.94-54482-November 1994-4,500
United Nations publication