maids multivariate analysis of fatal accidents · multivariate analysis of maids fatal accidents...
TRANSCRIPT

ACEM REPORT
MULTIVARIATE ANALYSIS OF MAIDS FATAL ACCIDENTS
DRI-TR-08-11
Technical Report
T.A. Smith
April 2009 This document is proprietary, and it is not to be released without the written permission of ACEM (Association des Constructeurs Européens de Motocycles) and Dynamic Research, Inc.
ACEM • Avenue de la Joyeuse Entrée 1• 1040 Brussels • BELGIUM • www.acem.eu
355 Van Ness Ave • Torrance • California 90501 • 310-212-5211 • Fax 310-212-5046 • www.dynres.com

ii
TABLE OF CONTENTS
Page
I. INTRODUCTION ......................................................................................................... 1
A. Background ......................................................................................................... 1
II. METHODOLOGY ........................................................................................................ 3
III. RESULTS .................................................................................................................... 8
All PTW RESULTS ..................................................................................................... 18
L1 RESULTS .............................................................................................................. 23
L3 RESULTS ............................................................................................................. 28
IV. SUMMARY ................................................................................................................. 30
V. REFERENCES ........................................................................................................... 33

1
Section I
INTRODUCTION
This report describes the results of a multivariate analysis of the in-depth motorcycle
accident data collected during the MAIDS project. Data have been presented according to
all powered two wheeler (PTW), as well as L1 and L3 vehicle categories where appropriate.
A. BACKGROUND
A large amount of information and numerous key findings have been provided as a
result of the MAIDS research program (ACEM, 2004). In addition to this effort, ACEM has
requested that a multivariate analysis be made in order to quantify the effect that various
factors have upon a PTW rider fatality. It was requested that this analysis be done for all
PTWs as a group as well as separately for L1 and L3 vehicle categories.
In terms of appropriate statistical methods for the multivariate analysis of vehicular
accident data, recent literature suggests that multinomial logit models or multiple logistic
regression models be used to examine and quantify the effect of various factors on driver
and PTW rider injury severity (Shankar and Mannering, 1996, Ulfarsson and Mannering,
2004, and Savolainen and Mannering, 2007).
The multiple logistic regression model is an extension of the univariate logistic
regression model. For a binary response Y, in this case a fatal outcome, and a quantitative
explanatory variable X, it is possible to determine (x) which is the probability that a given
case will result in a fatality when X takes value x. The univariate logistic regression model
has a linear form for the logit of this probability which is:
xx
xx
)(1
)(log)(logit
This formula implies that (x) increases or decreases as an S-shaped function of x.
When there are several possible explanatory variables (k) for a binary response Y by X1,
X2 ,… Xk, the equation for the logit regression model may be expressed as:
kk xxx ....logit 2211
Where the parameter refers to the effect of Xi on the logarithmic odds that Y =1,
controlling for other Xs. The parameters are referred to as the partial regression
coefficients and when expressed in the form of an equation, may be used to predict the
binary outcome (i.e., in this analysis, a fatality). The regression coefficients may also be
used to compute the odds ratios for a given variable by exponentiating the partial

2
regression coefficient. For example, exp(i) is the multiplicative effect on the odds of a
1-unit increase in Xi at fixed levels of the other Xs.

3
Section II
METHODOLOGY
The original MAIDS accident database (version 1.3) was used as the PTW database
for this analysis (i.e., all PTWs). Two additional subset databases were generated using the
MAIDS database and these were separated according to L1 and L3 legal categories. The
definitions of these categories are as follows:
Powered Two Wheeler (PTW): Any L1 or L3 vehicle.
L1 vehicle: A two wheeled vehicle with an engine cylinder capacity in the case of a thermic
engine not exceeding 50 cm^3 and whatever the means of propulsion a maximum design
speed not exceeding 45 km/h1. Note: The L1 vehicle category included both L1 vehicles as
well as mofa vehicles.
L3 vehicle: A two wheeled vehicle with an engine cylinder capacity in the case of a thermic
engine exceeding 50 cm^3 or whatever the means of propulsion a maximum design speed
exceeding 45 km/h2.
A total of 100 fatal PTW rider cases were found in the MAIDS database and a new
binary variable (mcriderfatal) was generated to identify those cases in which there was a
PTW rider fatality. The distribution of PTW rider fatal cases in the 3 databases is presented
in Table 1.
Table 1: Distribution of PTW rider fatality data
MAIDS Database
(all PTWs)
L1 Database L3 Database
Fatal 100 25 75
Not fatal 821 373 448
Total 921 398 523
In order to perform the multivariate analysis, a series of new variables were developed
based upon existing MAIDS database variables. Table 2 describes those new variables
and the MAIDS database variables that were used to form them. The new variables were
generated either by the recoding of existing variables (e.g., daytime versus nighttime
accidents) or by using two variables to generate a third variable (e.g., motorcycle age). In
some cases, existing MAIDS variables were categorized in order to better understand the
1 Under EU regulations, the maximum design speed of L1 vehicles is 45 km/h, rather than 50 km/h as specified in the ECE definition of an L1 vehicle. 2 Under EU regulations, the maximum design speed of an L3 vehicle shall exceed 45 km/h, rather than 50 km/h as specified in the ECE definition of an L3 vehicle.

4
relationship between a PTW rider fatality and a given variable (e.g., PTW engine size and
PTW mass). Maximum velocity data (vmax) previously provided by ACEM were also
merged with the L3 database in order to add this variable for the multivariate analysis.
Table 2: New variables generated from MAIDS Database New variable: Time of day Daytime Night A.3.1.2 = daylight, bright OR daylight, not bright OR dusk, sundown OR dawn, sunup
A.3.1.2 = night, lighted OR night, not lighted
New variable: Type of area Urban Rural A.3.1.1 = urban, industrial OR commercial, business, shopping OR housing, apartments OR housing, residential OR urban school OR urban park
A.3.1.1 = rural developed area OR undeveloped wilderness OR rural school OR rural park
New variable: Type of roadway Curve roadway Straight roadway A.3.1.18 = curve left OR curve right A.3.1.18 = all other responses New variable: Intersection Intersection Non-intersection A.3.1.3 = T-intersection OR cross intersection OR angle intersection OR offset intersection OR roundabout OR over or under cross-over with feeders
A.3.1.3 = non-intersection OR alley, driveway OR other
New variable: MC rider impairment MC rider impaired MC rider not impaired A.5.1.1.32 = alcohol use OR drug use OR combined alcohol and drug use
A.5.1.1.32 = not applicable OR none
New variable: OV driver impairment OV driver impaired OV driver not impaired A.5.1.3.32 = alcohol use OR drug use OR combined alcohol and drug use
A.5.1.3.32 = not applicable OR none
New variable: Is the MC rider speeding? PTW rider speeding PTW rider not speeding If the difference between the traveling speed (A.4.2.2.a) and the posted speed limit (A.3.1.9) is greater than or equal to 10 km/h.
If the difference between the traveling speed (A.4.2.2.a) and the posted speed limit (A.3.1.9) is less than 10 km/h OR there is no posted speed limit (A.3.1.9 = 001).
New variable: PTW rider error PTW rider error No PTW rider error A.6.4.1.1 = PTW rider perception failure OR PTW rider comprehension failure OR PTW rider decision failure OR PTW rider reaction failure OR PTW rider failure, unknown type
A.6.4.1.1 = all other responses
New variable: OV driver error OV driver error No OV driver error A.6.4.1.1 = OV driver perception failure OR OV driver comprehension failure OR OV driver decision failure OR OV driver reaction failure OR OV driver failure, unknown type
A.6.4.1.1 = all other responses
New variable: PTW age The difference between PTW year of production (A.4.1.1.3) and the year of the accident (A.2.3)
Once the new variables and databases were generated, a series of independent
variables were selected for analysis from each database. Based on historical motorcycle
research, including the MAIDS report, these variables have been found to be frequently
reported factors in fatal PTW accidents. A list of the variables selected for this analysis
appears in Table 3.

5
Table 3: Variables selected for multivariate analysis
Factor Variable
Daytime or nighttime
Urban or rural area
Curved or straight roadway
Intersection or non-intersection accident site
Roadway type
Motorway
Major arterial
Minor road
Dedicated bicycle/moped path
Other type of roadway
Environmental
Daytime or nighttime
Motorcycle legal category (all PTW analysis only)
Motorcycle age
Less than or equal to 1 year
2 years to 5 years
Over 5 years
Engine displacement (All PTW and L3 vehicle analysis
only)
1 to 50 cc
51 to 125 cc
126 to 250 cc
251 to 500 cc
501 to 750 cc
751 to 1000 cc
Over 1000 cc
Vehicle gross mass
Under 100 kg
101 kg to 200 kg
Over 200 kg
Motorcycle style
Conventional street L1 or L3 with modifications
Dual purpose, on-road, off-road motorcycle
Sport, race replica
Cruiser
Chopper, modified chopper
Touring
Scooter
Step-through
Sport touring
Motorcycle plus side car
Off-road motorcycle, motocross, enduro
Vehicle
Vmax (L3 vehicle analysis only)

6
Factor Variable
50 to 116 km/h
117 to 172 km/h
173 to 205 km/h
206 to 240 km/h
Over 241 km/h
PTW rider age
Up to 15 yrs
16-17 yrs
18-21 yrs
22-25 yrs
26-40 yrs
41-55 yrs
Over 56 yrs
PTW rider impairment
PTW rider speeding
(i.e., traveling > 10 km/h above posted speed limit)
PTW rider error
OV driver error
OV driver impairment
PTW rider impairment
PTW rider speeding (i.e., traveling > 10 km/h above
posted speed limit)
Human
PTW rider error
Traveling speed
Crash speed
Collision
Collision object
Light passenger vehicle
Large vehicle
Roadway
Off-road environment, fixed object
Moveable object
Other impact partner
In order to better understand the relationship between these variables, the different
PTW categories and a fatal outcome, a series of univariate tables were generated to
illustrate the distribution of each variable. Following this, an initial chi-square analysis was
performed for each variable listed in Table 3. Those variables which were found to be
significant (i.e., there was a significant difference between the fatal and non-fatal outcomes
for a given variable) were then used to form the initial logistic regression model. Logistic
regression models were developed and analyzed for all three databases using Stata SE
software (i.e., all PTW, L1 only, L3 only). The dependent variable for all analyses was the
occurrence of a PTW rider fatality. The maximum likelihood estimation method was used to

7
provide maximum likelihood estimates of all regression coefficients and their standard
errors.
The goal of a logistic regression analysis is to correctly predict the outcome for
individual cases using the parsimonious or least complex model. To accomplish this goal, a
model is created that includes all predictor variables that are useful in predicting the
response variable (i.e., a PTW rider fatality). Stepwise regression is a statistical procedure
that sequentially evaluates the fit of a given model before and after a variable is added or
deleted. For this analysis, a backwards stepwise regression was used. This procedure
begins with a full model that contains all variables and the statistical software removes the
variables using an iterative process. The fit of the model is tested after the elimination of
each variable in order to ensure that the model still adequately fits the data. When no more
variables can be eliminated from the model, the analysis has been completed. In order to
minimize the potential for multicollinearity3 between variables, certain variables which were
known to be collinear were not included (e.g., engine displacement and Vmax) and
separate stepwise regression procedures were performed with each variable.
3 Multicollinearity is a situation in which there are strong correlations among different factors, causing variables to “overlap” and appear to have little or no effect on a fatal accident. Engine displacement and maximum velocity (vmax) would be an example of two such variables.

8
Section III
RESULTS
Distribution of variables
The distribution of PTW rider fatalities according to time of day is presented in Table 4.
The data shows that the majority of accidents occurred during daytime; however, for all
PTW legal categories the proportion of number of fatal accidents to number of accidents is
higher during the nighttime.
Table 4: Cross tabulation of PTW rider fatality by legal category and time of day Time of day
MC category Daytime Nighttime Total Not fatal 292 81 373 Fatal 15 10 25
L1 vehicle
Total 307 91 398 Not fatal 382 66 448 Fatal 59 16 75
L3 vehicle
Total 441 82 523 Not fatal 674 147 821 Fatal 74 26 100
All PTW
Total 748 173 921
The distribution of PTW rider fatalities by type of area and legal category is shown in
Table 5. The data shows that for L1 vehicles, more fatalities occurred in an urban area
while for L3 vehicles a larger number of fatalities occurred in a rural area.
Table 5: Cross tabulation of PTW rider fatality
by legal category and type of area Type of area
MC category Rural area Urban area Total Not fatal 37 336 373 Fatal 7 18 25
L1 vehicle
Total 44 354 398 Not fatal 142 306 448 Fatal 44 31 75
L3 vehicle
Total 186 337 523 Not fatal 179 642 821 Fatal 51 49 100
All PTW
Total 230 691 921
Table 6 presents the cross tabulation of PTW rider fatalities by the type of roadway
(i.e., straight roadway versus curved roadway). The data indicate that the majority of PTW
rider fatalities occurred on straight roadways for both the L1 and L3 vehicle categories.

9
However, it is important to note that 16.5% of all L3 vehicle crashes that did take place on a
curved roadway resulted in a PTW rider fatality.
Table 6: Cross tabulation of PTW rider fatality
by legal category and type of roadway Type of roadway
MC category Straight roadway
Curved roadway Total
Not fatal 305 68 373 Fatal 20 5 25
L1 vehicle
Total 325 73 398 Not fatal 296 152 448 Fatal 45 30 75
L3 vehicle
Total 341 182 523 Not fatal 601 220 821 Fatal 65 35 100
All PTW
Total 666 255 921
The distribution of PTW rider fatalities by legal category and the presence of an
intersection is presented in Table 7. The data show that the majority of MAIDS accidents
took place at an intersection (i.e., 60% of all cases); however, the majority of PTW rider
fatalities took place at a non-intersection location (i.e., 62% of all PTW rider fatalities).
Approximately 44% of all L1 vehicle accidents involving a L1 rider fatality took place at a
non-intersection location while 68% of all L3 vehicle accidents involving a L3 rider fatality
took place at a non-intersection location.
Table 7: Cross tabulation of PTW rider fatality
by legal category and presence of intersection Presence of intersection
MC category Non-
intersection Intersection Total Not fatal 117 256 373 Fatal 11 14 25
L1 vehicle
Total 128 270 398 Not fatal 189 259 448 Fatal 51 24 75
L3 vehicle
Total 240 283 523 Not fatal 306 515 821 Fatal 62 38 100
All PTW
Total 368 553 921
Table 8 presents the distribution of PTW rider fatalities by legal category and by
roadway type. The data show that the majority of PTW rider fatalities occur on major
arterials or minor roads (40% and 48% respectively). Fewer accidents occurred on major
arterials when compared to minor roads (192 accidents versus 601 accidents); however,

10
major arterial accidents account for 44% of L1 rider fatalities, 39% of L3 rider fatalities and
40% of all PTW rider fatalities.
The distribution of PTW rider fatality data according to the age of the motorcycle is
presented in Table 9. Fewer than 921 cases and fewer than 100 PTW rider fatalities were
reported in this data table because vehicle year of manufacture information was known in
only 787 cases. The data are approximately evenly distributed across all three categories
of motorcycle age (i.e., under 1 year, 2 year to 5 years, over 5 years). The highest reported
frequency of PTW rider fatality was for motorcycles that were between 2 years and 5 years
of age (27 cases or 39% of all reported fatalities in which the vehicle age was known). PTW
rider fatalities were also most frequently reported for L1 and L3 vehicles which were
between 2 years and 5 years of age (7 cases for L1 vehicles and 20 cases for L3 vehicles
respectively).
The distribution of PTW rider fatalities by legal category and engine size is presented
in Table 10. As expected, almost all L1 vehicles were found to have engine size of 50 cc or
less. Those vehicles that were found to have an engine size greater than 50 cc showed
direct evidence that the engine had been tampered with by the owner. The majority of L3
vehicles were found to have an engine size between 501 to 750 cc (i.e., 22% of all MAIDS
cases). This category of engine size was also found to have the highest frequency of fatal
L3 riders, approximately 30% of all reported L3 rider fatalities.
Table 11 presents the distribution of PTW rider fatalities by legal category and by
motorcycle mass. Nearly all of the L1 vehicles were found to weigh under 100 kg while
most of the L3 vehicles were found to weigh between 101 to 200 kg. The greatest number
of fatal PTW rider cases were also reported in these two weight categories.
The distribution of PTW rider fatalities by motorcycle style and by PTW legal category
is presented in Table 12. The data shows that the majority of L1 vehicles were scooter style
vehicles and this PTW style category was found to have the highest frequency of L1 rider
fatalities. The largest group of L3 vehicles involved in accidents was found to be sport, race
replica style motorcycles and this group was also found to have the highest reported
frequency of L3 rider fatalities.
Table 13 presents the distribution of PTW rider fatalities by legal category and by PTW
rider age. The majority of L1 riders were between the ages of 16 and 21 (206 total cases);
however, the L1 rider fatalities were generally distributed across all L1 rider age groups.
The majority of L3 riders were found to be between 26 and 40 years of age and the highest
frequency of L3 rider fatalities were also reported for this age group.

11
Table 8: Cross tabulation of PTW rider fatality by legal category and type of roadway Roadway Type
MC category Motorway Major arterial Minor road Dedicated bicycle
or moped path Other Total Not fatal 3 46 255 52 17 373 Fatal 0 11 11 2 1 25
L1 vehicle
Total 3 57 266 54 18 398 Not fatal 30 106 298 0 14 448 Fatal 6 29 37 0 3 75
L3 vehicle
Total 36 135 335 0 17 523 Not fatal 33 152 553 52 31 821 Fatal 6 40 48 2 4 100
All PTW
Total 39 192 601 54 35 921
Table 9: Cross tabulation of PTW rider fatality by legal category and age of PTW Age of PTW
MC category less than or equal to 1 yr
2 years to 5 years Over 5 years Total
Not fatal 103 148 63 314 Fatal 6 7 2 15
L1 vehicle
Total 109 155 65 329 Not fatal 117 150 136 403 Fatal 18 20 17 55
L3 vehicle
Total 135 170 153 458 Not fatal 220 298 199 717 Fatal 24 27 19 70
All PTW
Total 244 325 218 787

12
Table 10: Cross tabulation of PTW rider fatality by legal category and engine size MC engine size category
MC category 1 to
50 cc 51 to
125 cc 126 to 250 cc
251 to 500 cc
501 to 750 cc
751 to 1000 cc
Over 1000 cc Total
Not fatal 371 2 0 0 0 0 0 373 Fatal 23 2 0 0 0 0 0 25
L1 vehicle
Total 394 4 0 0 0 0 0 398 Not fatal 0 77 34 49 177 63 48 448 Fatal 0 8 3 7 29 17 10 74
L3 vehicle
Total 0 85 37 56 206 80 58 522 Not fatal 371 79 34 49 177 63 48 821 Fatal 23 10 3 7 29 17 10 99
All PTW
Total 394 89 37 56 206 80 58 920
Table 11: Cross tabulation of PTW rider fatality by legal category and PTW mass PTW mass
MC category Under 100 kg
101 to 200 kg
Over 200 kg Total
Not fatal 343 7 0 350 Fatal 21 0 0 21
L1 vehicle
Total 364 7 0 371 Not fatal 27 251 159 437 Fatal 2 32 37 71
L3 vehicle
Total 29 283 196 508 Not fatal 370 258 159 787 Fatal 23 32 37 92
All PTW
Total 393 290 196 879

13
Table 12: Cross tabulation of PTW rider fatality by legal category and PTW style
A.4.1.1.4.2-MC mechanical factors/ Specifications/ PTW style
MC category
Conventional street L1 or L3 vehicle
without modification
Conventional street L1 or
L3 vehicle with modification
Dual purpose, on-road off-road
motorcycle
Sport, race
replica Cruiser
Chopper, modified chopper Touring Scooter
Step-through
Sport touring
Motorcycle plus
sidecar
Off-road motorcycle, motocross,
enduro, trials Total Not fatal 23 6 8 10 0 0 0 274 49 0 0 1 371
Fatal 4 0 0 1 0 0 0 17 2 0 1 0 25
L1 vehicle
Total 27 6 8 11 0 0 0 291 51 0 1 1 396
Not fatal 88 18 34 99 35 31 26 59 0 34 2 19 445
Fatal 16 1 1 27 2 5 5 4 0 11 1 2 75
L3 vehicle
Total 104 19 35 126 37 36 31 63 0 45 3 21 520
Not fatal 111 24 42 109 35 31 26 333 49 34 2 20 816
Fatal 20 1 1 28 2 5 5 21 2 11 2 2 100
All PTW
Total 131 25 43 137 37 36 31 354 51 45 4 22 916
Table 13: Cross tabulation of PTW rider fatality by legal category and PTW rider age PTW rider age
MC category up to 15 16-17 18-21 22-25 26-40 41-55 Over 56 Total Not fatal 26 94 101 39 66 36 10 372 Fatal 2 8 3 3 2 4 3 25
L1 vehicle
Total 28 102 104 42 68 40 13 397 Not fatal 1 22 32 72 231 80 9 447 Fatal 0 2 6 18 32 14 3 75
L3 vehicle
Total 1 24 38 90 263 94 12 522 Not fatal 27 116 133 111 297 116 19 819 Fatal 2 10 9 21 34 18 6 100
All PTW
Total 29 126 142 132 331 134 25 919

14
Table 14 presents the distribution of PTW rider fatalities by legal category and by PTW
rider impairment. The data shows that 26 of 398 L1 riders involved in a crash were
impaired at the time of the crash (i.e., 6.5% of all L1 riders) while only 17 of 523 L3 riders
involved in a crash were impaired at the time of the crash (i.e., 3.3% of all L3 riders). Four
riders or 16% of all L1 rider fatalities were reported as impaired at the time of the crash. Six
riders or 8% of all L3 rider fatalities were reported as being impaired at the time of the
crash.
Table 14: Cross tabulation of PTW rider fatality by legal category and PTW rider impairment
MC Rider Impairment
MC category Rider not impaired
Rider impaired Total
Not fatal 351 22 373 Fatal 21 4 25
L1 vehicle
Total 372 26 398 Not fatal 437 11 448 Fatal 69 6 75
L3 vehicle
Total 506 17 523 Not fatal 788 33 821 Fatal 90 10 100
All PTW
Total 878 43 921
The distribution of those cases in which the PTW rider was speeding, or traveling over
10 km/h above the posted speed limit is presented in Table 15. The data shows that
approximately 15% of the L1 vehicle riders were speeding at the time of the crash and
approximately 32% of the L3 vehicle riders were speeding at the time of the crash. Of those
riders that were speeding, 12% of the L1 vehicle riders (or 7 cases) resulted in a L1 rider
fatality while 24% of the L3 vehicle riders (or 40 cases) resulted in a L3 rider fatality.
Overall, the data show that 24.5% of all riders were traveling over 10 km/h above the
posted speed limit at the time of the accident.
Table 15: Cross tabulation of PTW rider fatality by legal category and PTW rider speeding
Was MC rider speeding?
MC category MC rider not
speeding MC rider speeding Total
Not fatal 320 53 373 Fatal 18 7 25
L1 vehicle
Total 338 60 398 Not fatal 322 126 448 Fatal 35 40 75
L3 vehicle
Total 357 166 523 Not fatal 642 179 821 Fatal 53 47 100
All PTW
Total 695 226 921

15
Table 16 presents the distribution of PTW rider fatalities by legal category and by PTW
rider error. A PTW rider error was coded for every case in which the primary accident
contributing factor was identified as a specific PTW rider error (i.e., perception failure,
comprehension failure, etc.). The data show that nearly 40% of all L1 vehicle crashes
involved a L1 rider error (n=154), whereas 64% of L1 fatal crashes involved rider error.
Thirty-five percent (35%) of all L3 vehicle crashes involved a L3 rider error (n=184),
whereas 49% of L3 fatal crashes involved rider error. These data indicate a larger
percentage of rider error occurs in fatal crashes, in comparison to all crashes.
Table 16: Cross tabulation of PTW rider fatality by legal category and PTW rider error
MC Rider error
MC category No MC rider
error MC rider
error Total Not fatal 235 138 373 Fatal 9 16 25
L1 vehicle
Total 244 154 398 Not fatal 301 147 448 Fatal 38 37 75
L3 vehicle
Total 339 184 523 Not fatal 536 285 821 Fatal 47 53 100
All PTW
Total 583 338 921
The data presented in Table 17 shows a cross tabulation of PTW rider fatalities by
legal category and by other vehicle driver error. The data indicates that approximately 48%
of all PTW crashes involve OV driver error, whereas only 33% of fatal crashes involve OV
driver error. This distribution was consistent for both the L1 vehicle category as well as the
L3 vehicle category. These data indicate a smaller percentage of OV driver error occurs in
fatal crashes, in comparison to all crashes.
Table 17: Cross tabulation of PTW rider fatality
by legal category and other vehicle driver error OV driver error
MC category No OV
driver error OV driver
error Total Not fatal 186 187 373 Fatal 17 8 25
L1 vehicle
Total 203 195 398 Not fatal 223 225 448 Fatal 50 25 75
L3 vehicle
Total 273 250 523 Not fatal 409 412 821 Fatal 67 33 100
All PTW
Total 476 445 921
16
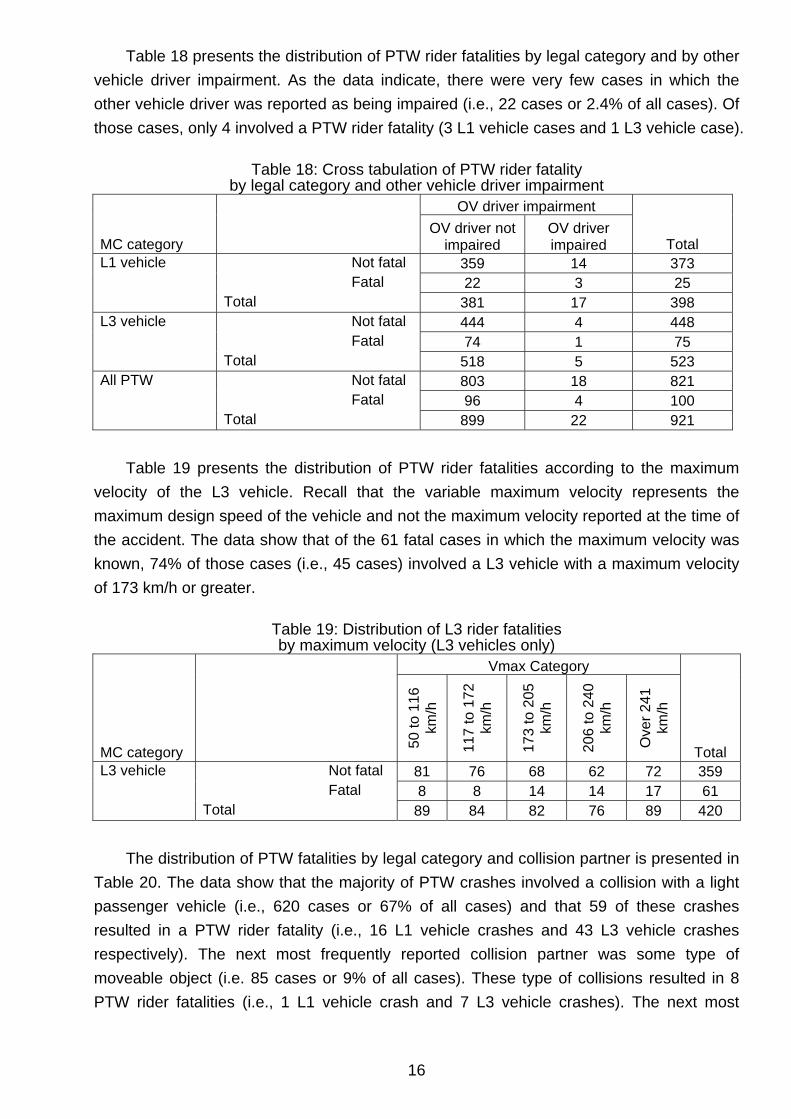
Table 18 presents the distribution of PTW rider fatalities by legal category and by other
vehicle driver impairment. As the data indicate, there were very few cases in which the
other vehicle driver was reported as being impaired (i.e., 22 cases or 2.4% of all cases). Of
those cases, only 4 involved a PTW rider fatality (3 L1 vehicle cases and 1 L3 vehicle case).
Table 18: Cross tabulation of PTW rider fatality by legal category and other vehicle driver impairment
OV driver impairment
MC category OV driver not
impaired OV driver impaired Total
Not fatal 359 14 373 Fatal 22 3 25
L1 vehicle
Total 381 17 398 Not fatal 444 4 448 Fatal 74 1 75
L3 vehicle
Total 518 5 523 Not fatal 803 18 821 Fatal 96 4 100
All PTW
Total 899 22 921
Table 19 presents the distribution of PTW rider fatalities according to the maximum
velocity of the L3 vehicle. Recall that the variable maximum velocity represents the
maximum design speed of the vehicle and not the maximum velocity reported at the time of
the accident. The data show that of the 61 fatal cases in which the maximum velocity was
known, 74% of those cases (i.e., 45 cases) involved a L3 vehicle with a maximum velocity
of 173 km/h or greater.
Table 19: Distribution of L3 rider fatalities by maximum velocity (L3 vehicles only)
Vmax Category
MC category
50 to
116
km
/h
117
to 1
72
km/h
173
to 2
05
km/h
206
to 2
40
km/h
Ove
r 24
1 km
/h
Total Not fatal 81 76 68 62 72 359 Fatal 8 8 14 14 17 61
L3 vehicle
Total 89 84 82 76 89 420
The distribution of PTW fatalities by legal category and collision partner is presented in
Table 20. The data show that the majority of PTW crashes involved a collision with a light
passenger vehicle (i.e., 620 cases or 67% of all cases) and that 59 of these crashes
resulted in a PTW rider fatality (i.e., 16 L1 vehicle crashes and 43 L3 vehicle crashes
respectively). The next most frequently reported collision partner was some type of
moveable object (i.e. 85 cases or 9% of all cases). These type of collisions resulted in 8
PTW rider fatalities (i.e., 1 L1 vehicle crash and 7 L3 vehicle crashes). The next most

17
frequently reported collision partner for PTW rider fatalities was a large vehicle (i.e., 76
cases or 8.3% of all cases).
Table 20: Cross tabulation of PTW rider fatality by legal category and collision partner
Collision partner
MC category Ligh
t pas
seng
er
vehi
cle
Larg
e ve
hicl
e
Ro
adw
ay
Off-
road
en
viro
nmen
t, fix
ed o
bjec
t
Mov
eabl
e ob
ject
Oth
er
Total Not fatal 266 34 16 11 43 3 373
Fatal 16 4 0 4 1 0 25
L1 vehicle
Total 282 38 16 15 44 3 398 Not fatal 295 31 41 46 34 1 448
Fatal 43 7 7 11 7 0 75
L3 vehicle
Total 338 38 48 57 41 1 523 Not fatal 561 65 57 57 77 4 821
Fatal 59 11 7 15 8 0 100
All PTW
Total 620 76 64 72 85 4 921

18
All PTW Analysis
As mentioned previously, a univariate chi-square analysis was performed using each
variable listed in Table 3. This was done in order to identify those factors which may have
an influence upon a fatal PTW rider outcome. Table 21 presents the chi-square results for
the database that includes all PTWs. As indicated in the table, 14 environmental, vehicle
and human factors were found to be statistically significant. This means that a statistically
significant difference was noted between the fatal and non-fatal cases when analyzed with
the given MAIDS database variable. It is important to note that each variable was
considered individually and not as an aggregate group of variables.
Table 21: Univariate chi square analysis of individual factors using all PTW database
Parameter Degrees of freedom Chi-square P-value
Nighttime 1 3.55 0.0594
Urban 1 35.62 <0.0001*
Curve 1 2.87 0.0900
Intersection 1 22.20 <0.0001*
Roadway type 4 26.11 <0.0001*
PTW legal category 1 16.01 0.0001*
PTW age 2 0.41 0.8153
PTW engine displacement 6 23.94 0.0005*
PTW mass 2 22.82 <0.0001*
PTW style 11 45.81 <0.0001*
MC rider age 6 12.74 0.0473*
MC rider impairment 1 5.69 0.0171*
MC rider speeding 1 27.05 <0.0001*
MC rider error 1 12.37 0.0004*
OV driver error 1 10.76 0.0010*
OV driver impairment 1 1.07 0.3014
Traveling speed 1 10.90 0.0010*
Crash speed 1 84.44 <0.0001*
Collision object 4 8.35 0.0796 * indicates significance at < 0.05
Table 22 represents the results of the backwards stepwise regression analysis using
the statistically significant factors identified in Table 21. Where possible, variables were
separated into categorical data in order to better understand any relationships between a
specific category and a PTW rider fatality. The stepwise regression analysis sequentially
removes those factors which do not contribute to the model’s ability to predict a PTW rider
fatality. A threshold significance level of 0.1 was selected for removal from the model and a
threshold significance level of 0.05 was selected for addition to the model.

19
The results indicate that the variables of major arterial roadway, rider age, PTW rider
errors, and PTWs with sidecars are all significant predictors of a PTW rider fatality. It
should be noted that there were so few cases with PTWs with sidecars that this statistical
finding may not be reliable (see Table 12). Engine displacement up to 50cc was added to
the model; however, it was not found to be a significant predictor of a PTW rider fatality. An
analysis of the odds ratios for these variables indicates that the risk of a PTW rider fatality
increases with age and while the rider is on a major arterial roadway. The risk of a PTW
rider fatality was actually found to decrease if the accident occurs at an intersection (i.e.,
the odds ratio is less than 1).
Table 22: Logistic regression model 1 using all significant factors All PTW Model 1 Number of observations: 869 R2 value: .2360
Parameter Coefficient Std. Error z-value Prob. Odds ratio 95% CI
Constant .0413 2.621 0.02 0.987 Crash speed .0320 0.005 6.68 0.000* 1.032 1.023 1.042 Intersection -.5983 0.270 -2.22 0.027* 0.550 0.324 0.933 Motorway -1.033 0.669 -1.55 0.122 0.356 0.096 1.319 Major arterial 1.331 0.271 4.92 0.000* 3.783 2.226 6.430 Conventional street MC with modifications
-2.010 1.197 -1.68 0.093 0.134 0.013 1.402
Dual purpose MC style -1.583 1.047 -1.51 0.131 0.205 0.026 1.600 PTW legal category -2.495 1.321 -1.89 0.059 0.083 0.006 1.098 1 to 50cc engine size -2.514 1.318 -1.91 0.056 0.081 0.006 1.072 PTW rider error 0.623 0.259 2.40 0.016* 1.865 1.121 3.100 PTW rider age 0.028 0.011 2.55 0.011* 1.028 1.007 1.051 Cruiser MC style -1.260 0.809 -1.56 0.120 0.284 0.058 1.386 PTW with sidecar 3.305 1.657 1.99 0.046* 27.245 1.059 700.968
* indicates significance at < 0.05
When the variables of nighttime accident, curved roadway and PTW age were
added to the model, the regression procedure produced a model with slightly different
variables (see Table 23). Accidents that occurred at night, PTW crash speed, non-
intersections, major arterial roadways and rider age were all found to be significant
predictors of a PTW rider fatality. PTW rider speeding was included as a variable in the
overall model; however, it was not found to be statistically significant (i.e., it was not a good
predictor of a PTW rider fatality). As observed in the previous model, accidents that
occurred at intersections actually had a lower risk of resulting in a fatality (i.e., the odds
ratio is less than 1). Accidents which take place on a major arterial roadway have nearly a
4 times higher risk of a fatality when compared to a minor roadway (i.e., the reference
category). For every 10 km/h increase in crash speed, the odds of a PTW rider fatality
increase by a factor of 1.31 (i.e., 1.028^10), i.e., 31%. Rider age was once again found to
be a significant predictor of a PTW rider fatality.

20
Table 23: Logistic regression model 2 using all significant factors as well as night, curve
and PTW age variables All PTW Model 2 – Same as model 1 except night, curve and PTW age variables added Number of observations: 731 R2 value: .2323
Parameter Coefficient Std.
Error z-value Prob. Odds ratio
95% CI
Constant .-5.1282 0.6209 -8.26 0.000 Nighttime 0.9280 0.3485 2.66 0.008* 2.529 1.278 5.007 Crash speed 0.0276 0.0052 5.32 0.000* 1.028 1.018 1.039 Dual purpose MC style -1.6828 1.1121 -1.51 0.130 0.186 0.021 1.64 Intersection -0.7093 0.3061 -2.32 0.021* 0.492 0.270 0.897 PTW Rider age 0.0290 0.0132 2.20 0.028* 1.030 1.003 1.057 Major arterial road 1.3766 0.3062 4.50 0.000* 3.961 2.174 7.219 MC rider speeding 0.5839 0.3184 1.83 0.067 1.793 0.961 3.347
* indicates significance at < 0.05
In order to better understand how age relates to prediction of a PTW rider fatality,
the age variable as reported in the MAIDS database was categorized into several different
categories (see Table 13). Table 24 presents the results of the stepwise regression
analysis using all the PTW significant variables identified above, with the exception that
age was treated as a categorical variable. The categories chosen were the same as those
used in the MAIDS Final Report. The data shows that the over 56 year age category was
significant predictor of a PTW rider fatality in the all PTW database. The odds ratio for this
group was 1.104 meaning that the risk of a PTW fatality in the over 56 year old age group
was 10.4% higher when compared to the 26-40 year old age group (i.e., the reference age
group). Once again, an accident on a major arterial roadway was found to have a nearly 4
times greater risk of being involved in a PTW rider fatality when compared to a minor road
(i.e. the reference category).

21
Table 24: Logistic regression model 3 using categorized age variable All PTW Model 3 – Same as Model 2 except rider age variable categorized Number of observations: 731 R2 value: .2503
Parameter Coefficient Std.
Error z-value Prob. Odds ratio
95% CI
Constant -4.647 0.503 -9.25 0.000 Nighttime 0.936 0.349 2.68 0.007* 2.550 1.286 5.055 Crash speed 0.033 0.005 6.55 0.000* 1.033 1.023 1.043 MC rider error 0.579 0.300 1.93 0.054 1.784 0.991 3.214 Intersection -0.603 0.315 -1.91 0.056 0.547 0.294 1.016 PTW rider 41-55 yrs 0.705 0.383 1.84 0.066 2.024 0.954 4.291 Major arterial 1.339 0.309 4.33 0.000* 3.817 2.081 6.999 Dual purpose MC style -1.564 1.099 -1.42 0.155 0.209 0.024 1.803 PTW rider over 56 yrs 1.494 0.711 2.10 0.036* 4.453 1.104 17.968 PTW rider 18-21 yrs -1.419 0.750 -1.89 0.059 0.242 0.056 1.053
* indicates significance at < 0.05
In an effort to simplify the regression model, another model was developed by using
rider age as a binary value (i.e., over or under 25 years of age). The output from this model
is presented in Table 25. This model indicates that rider age becomes less of a predictor of
a PTW rider fatality when presented as a binary value of over or under 25 years of age (i.e.,
it is removed from the model). The factors of an intersection or non-intersection, crash
speed and a major arterial roadway become significant predictors of a PTW rider fatality,
with the odds ratios being very similar to those values that were presented in previous
models.
Table 25: Logistic regression model 4 using age as binary variable All PTW Model 4 – Same as Model 2 except MC rider age categorized as under25 (yes/no) Number of observations: 731 R2 value: 0.2345
Parameter Coefficient Std. Error z-value Prob. Odds ratio
95% CI
Constant -4.2847 0.4229 -10.13 0.000 Nighttime .6783 .3490 1.94 0.052 1.971 0.994 3.906 MC rider speeding 0.6197 0.3218 1.93 0.054 1.858 0.989 3.492 MC rider impaired 0.8953 0.5089 1.76 0.079 2.448 0.903 6.637 Intersection -0.6960 0.3063 -2.27 0.023* 0.499 0.273 0.909 Crash speed 0.0274 0.0052 5.27 0.000* 1.028 1.017 1.038 Major arterial 1.3977 0.3072 4.55 0.000* 4.046 2.216 7.388 Dual purpose MC style -1.8467 1.2151 -1.52 0.129 0.158 0.015 1.707 PTW with sidecar 3.1693 1.7660 1.79 0.073 23.791 0.747 757.973
* indicates significance at < 0.05
When all variables listed in Table 3 are added to the initial full model, the stepwise
regression produces a model with 8 variables, 6 of which are statistically significant
predictors of a PTW rider fatality. Nighttime accidents, crash speed, rider age and a major
arterial roadway all increase the risk of being in a crash involving a PTW rider fatality.
Conversely, roadway collisions and OV driver errors reduce the risk of being involved in

22
crash involving a PTW rider fatality, as noted by an odds ratio of less than 1 for each
variable.
Table 26: Logistic regression model 5 using all variables All PTW Model 5 – All variables listed in Table 2 Number of observations: 729 R2 value: 0.2441
Parameter Coefficient Std. Error z-value Prob. Odds ratio 95% CI
Constant -5.234 .640 -8.18 0.000 Nighttime 1.041 0.3519 2.96 0.003* 2.831 1.420 5.641 Crash speed 0.0336 0.0049 6.84 0.000* 1.034 1.024 1.044 Dual purpose MC style -1.6631 1.0889 -1.53 0.127 0.190 0.022 1.601 Intersection -0.5749 0.3184 -1.81 0.071 0.563 0.302 1.051 PTW rider age 0.0364 0.0132 2.75 0.006* 1.037 1.010 1.064 Major arterial 1.4646 0.3120 4.69 0.000* 4.326 2.347 7.973 Roadway collision partner
-1.5935 0.7131 -2.23 0.025* 0.203 0.050 0.822
OV driver error -0.6495 0.3221 -2.02 0.044* 0.522 0.278 0.982 * indicates significance at < 0.05

23
L1 Analysis
Table 27 presents the results of the univariate chi-square analysis using the L1
database. The analysis shows that urban accidents, roadway type, riders over 40 years of
age, L1 rider errors, crash speed and collision object are all factors that are significant
predictors of a L1 rider fatality (based on a univariate logistic regression). These factors
were selected for the preliminary multiple logistic regression model presented in Table 28.
It is interesting to note that for L1 vehicles neither L1 rider age nor L1 vehicle style
were found to be significant predictors of a L1 rider fatality. As expected, L1 rider speeding
was not found to be significant predictor of a L1 rider fatality, confirming the maximum
speed limit construction of L1 vehicles and the difficulty of traveling above the speed limit
on an L1 vehicle.
Table 27: Univariate chi-square analysis of individual factors using L1 database
Parameter Degrees of freedom Chi-square P-value
Nighttime 1 3.93 0.0474
Urban 1 5.91 0.0151*
Curve 1 0.05 0.827
Intersection 1 1.63 0.2012
Roadway type 3 14.01 0.0029*
L1 vehicle age 2 0.58 0.7482
L1 vehicle style 3 3.25 0.3543
L1 rider age 6 9.25 0.1600
L1 rider under 20 yrs 1 1.13 0.2880
L1 rider under 25 yrs 1 0.35 0.5546
L1 rider over 40 yrs 1 5.65 0.0175*
L1 rider impairment 1 2.93 0.0867
L1 rider speeding 1 2.95 0.0861
L1 rider error 1 6.98 0.0083*
OV driver error 1 3.16 0.0757
OV driver impairment 1 2.75 0.0973
Traveling speed 1 0.19 0.6594
Crash speed 1 14.51 0.0001*
Collision object 3 8.84 0.0315* * indicates significance at < 0.05
Table 28 presents the multiple logistic regression model generated by the stepwise
regression procedure using only those variables in Table 27 that were found to be
significant. When all factors are taken into consideration, no variables were removed from
the model and a model with all 6 variables produced the model with the highest possible R2

24
value. All variables shown in the table were found to be significant at an alpha level of 0.05.
In terms of relative risk, the odds ratio results for this model show a reduction in risk for L1
urban accidents (OR = 0.26) relative to non-urban accidents (i.e., rural) and an increase in
risk for major arterial accidents and fixed object collisions (OR = 4.72 and 4.79
respectively). The data also show that for every 10 km/h increase in crash speed, the odds
of being in a fatal crash increases by 1.71 (i.e., OR = 1.055^10).
Table 28: L1 logistic regression model using all significant variables L1 Vehicles Only Model 1 Number of observations: 378 R2 value: 0.2825
Parameter Coefficien
t Std. Error z-value Prob. Odds ratio 95% CI
Constant -5.316 0.950 -5.60 0.000 Urban -1.337 0.571 -2.34 0.019* 0.263 0.086 0.807 Major arterial 1.556 0.506 3.07 0.002* 4.726 1.753 12.741 Crash speed 0.054 0.016 3.41 0.001* 1.055 1.023 1.089 Fixed object collision partner
1.566 0.729 2.15 0.032* 4.789 1.147 19.997
L1 rider age over 40 2.317 0.590 3.93 0.000* 10.146 3.194 32.230 L1 rider error 1.374 0.523 2.63 0.009* 3.951 1.419 11.001
* indicates significance at < 0.05
When all variables listed in Table 27 are presented, the stepwise logistic regression
procedure produces a model that includes the variables of nighttime accident, fixed object
collision partner, crash speed, other vehicle driver impairment and L1 rider age (see Table
29). All variables in this model were also found to be significant predictors of a L1 rider
fatality. The presence of the variable nighttime indicates that when all other factors in the
model are taken into consideration, nighttime accidents become significant predictors of a
motorcycle rider fatality. The odds ratio indicates that the odds of a L1 rider fatality increase
1.06 times for a nighttime accident when compared to a daytime accident. As seen in the
first L1 model, a fixed object collision partner impact is a significant predictor of a L1 rider
fatality in an L1 accident. The odds ratio indicates that there is an 8.1 times increase in the
risk of being killed in an L1 accident when the collision partner is a fixed object when
compared to a light passenger vehicle impact (i.e., the reference category). Once again
crash speed was also found to be a significant predictor of a L1 rider fatality. In this model,
a 10 km/h increase in crash speed increases the odds of being in a fatal accident by a
factor of 1.24, i.e., 24%. Other vehicle driver impairment was also found to be a significant
predictor of a L1 rider fatality, with an odds ratio of 5.74 indicating a significant risk to L1
riders when the OV driver is impaired. L1 rider age was also found to be a significant
predictor of a L1 rider fatality, with a slight increase in risk (i.e., OR=1.08) for every year
increase in L1 rider age.

25
Table 29: L1 logistic regression model using all variables L1 Vehicles Only Model 2 – using all variables listed in Table 27 with age as a continuous variable Number of observations: 251 R2 value: 0.2874
Parameter Coefficient Std. Error z-value Prob. Odds ratio 95% CI
Constant -8.205 1.429 -5.74 0.000 Nighttime 1.381 0.676 2.04 0.041* 3.978 1.057 14.972 Fixed object collision partner
2.094 0.834 2.51 0.012* 8.120 1.583 41.640
Crash speed 0.061 0.020 3.01 0.003* 1.063 1.022 1.106 OV driver impaired 1.748 0.898 1.95 0.052* 5.741 0.988 33.363 L1 rider age 0.079 0.022 3.54 0.000* 1.083 1.036 1.131
* indicates significance at < 0.05
Table 30 presents the results of the stepwise regression procedure when L1 rider
age is converted to a categorical variable rather than a continuous variable. The age
categories generated were identical to those used in the MAIDS Final Report. The data
shows that once again nighttime accidents are significant predictors of a L1 rider fatality.
The data also show that L1 riders over 41 years of age are significant predictors of an L1
motorcycle fatality. The increase in risk of dying in an L1 accident increases 8.69 times for
a rider on an L1 vehicle that is between 41 and 55 years of age when compared to riders
26 to 41 years of age. The odds ratio for L1 riders over 56 years of age is also extremely
high (i.e., 75.0); however, this may be due to the small sample size for this category of L1
rider (i.e., n=13) and the high number of L1 rider fatalities in this age category (i.e., n=3
fatalities); therefore, this result should be viewed with caution (see Table 13). Similar to
previous L1 models, a fixed object impact was a significant predictor of a fatality and the
risk of a fatality in a collision with a fixed object was found to be over 13 times greater than
for an impact with a light passenger vehicle (i.e., the reference category). An interesting
finding in this particular model was that traveling speed was found to be a significant
predictor of an L1 motorcycle rider fatality. This is different from the previous L1 logistic
regression models in that crash speed was found to be a significant predictor of an L1
motorcycle rider fatality. The odds ratio indicates that for every 10 km/h increase in
traveling speed, the risk of a fatality increases by 2.12 (i.e., 1.078^10).
Table 30: L1 logistic regression model using all variables with age as a categorical variable
L1 Vehicles Only Model 3 – using all variables listed in Table 27 with age as a categorical variable Number of observations: 182 R2 value: 0.3327
Parameter Coefficient Std. Error z-value Prob. Odds ratio 95% CI
Constant -7.074 1.356 -5.22 0.000 Nighttime 1.593 0.706 2.26 0.024* 4.918 1.233 19.616 L1 rider over 56 yrs 4.318 1.230 3.51 0.000* 75.018 6.733 835.806 L1 rider 41-55 yrs 2.162 0.819 2.64 0.008* 8.693 1.743 43.346 Fixed object collision partner
2.594 1.057 2.45 0.014* 13.377 1.687 106.100
Travelling speed 0.074 0.024 3.08 0.002* 1.078 1.027 1.130 * indicates significance at < 0.05
Given the findings presented in Table 30, the age variable was condensed to a
binary variable of over and under 40 yrs of age. The purpose of this modification was to
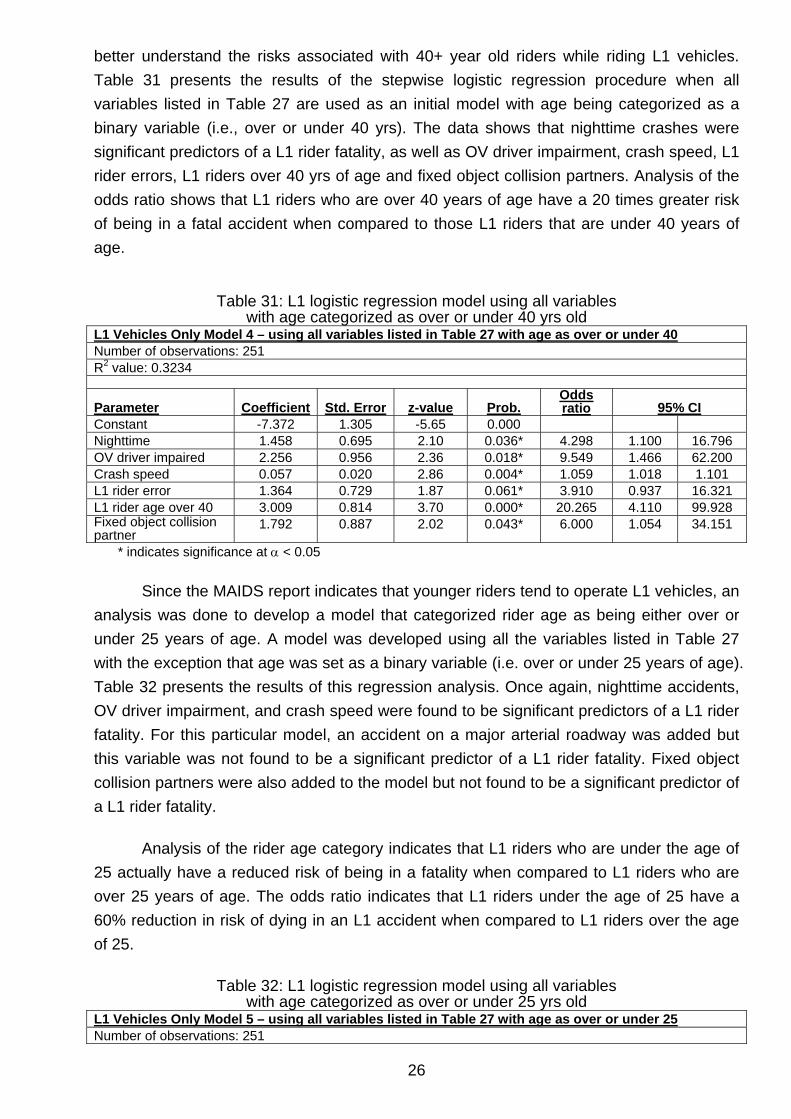
26
better understand the risks associated with 40+ year old riders while riding L1 vehicles.
Table 31 presents the results of the stepwise logistic regression procedure when all
variables listed in Table 27 are used as an initial model with age being categorized as a
binary variable (i.e., over or under 40 yrs). The data shows that nighttime crashes were
significant predictors of a L1 rider fatality, as well as OV driver impairment, crash speed, L1
rider errors, L1 riders over 40 yrs of age and fixed object collision partners. Analysis of the
odds ratio shows that L1 riders who are over 40 years of age have a 20 times greater risk
of being in a fatal accident when compared to those L1 riders that are under 40 years of
age.
Table 31: L1 logistic regression model using all variables with age categorized as over or under 40 yrs old
L1 Vehicles Only Model 4 – using all variables listed in Table 27 with age as over or under 40 Number of observations: 251 R2 value: 0.3234
Parameter Coefficient Std. Error z-value Prob. Odds ratio 95% CI
Constant -7.372 1.305 -5.65 0.000 Nighttime 1.458 0.695 2.10 0.036* 4.298 1.100 16.796 OV driver impaired 2.256 0.956 2.36 0.018* 9.549 1.466 62.200 Crash speed 0.057 0.020 2.86 0.004* 1.059 1.018 1.101 L1 rider error 1.364 0.729 1.87 0.061* 3.910 0.937 16.321 L1 rider age over 40 3.009 0.814 3.70 0.000* 20.265 4.110 99.928 Fixed object collision partner
1.792 0.887 2.02 0.043* 6.000 1.054 34.151
* indicates significance at < 0.05
Since the MAIDS report indicates that younger riders tend to operate L1 vehicles, an
analysis was done to develop a model that categorized rider age as being either over or
under 25 years of age. A model was developed using all the variables listed in Table 27
with the exception that age was set as a binary variable (i.e. over or under 25 years of age).
Table 32 presents the results of this regression analysis. Once again, nighttime accidents,
OV driver impairment, and crash speed were found to be significant predictors of a L1 rider
fatality. For this particular model, an accident on a major arterial roadway was added but
this variable was not found to be a significant predictor of a L1 rider fatality. Fixed object
collision partners were also added to the model but not found to be a significant predictor of
a L1 rider fatality.
Analysis of the rider age category indicates that L1 riders who are under the age of
25 actually have a reduced risk of being in a fatality when compared to L1 riders who are
over 25 years of age. The odds ratio indicates that L1 riders under the age of 25 have a
60% reduction in risk of dying in an L1 accident when compared to L1 riders over the age
of 25.
Table 32: L1 logistic regression model using all variables with age categorized as over or under 25 yrs old
L1 Vehicles Only Model 5 – using all variables listed in Table 27 with age as over or under 25 Number of observations: 251

27
R2 value: 0.3038
Parameter Coefficient Std. Error z-value Prob. Odds ratio 95% CI
Constant -4.810 0.935 -5.14 0.000 Nighttime 1.424 0.699 2.04 0.042* 4.155 1.056 16.352 OV driver impaired 1.998 0.956 2.09 0.037* 7.378 1.129 48.192 L1 rider error 1.216 0.699 1.74 0.082* 3.373 0.858 13.269 Crash speed 0.046 0.213 2.14 0.032* 1.047 1.004 1.092 Major arterial 1.186 0.703 1.69 0.092 3.276 0.825 13.001 L1 rider age under 25 -2.297 0.756 -3.04 0.002* 0.400 0.023 0.443 Fixed object collision partner
1.692 0.887 1.91 0.156 5.433 0.956 30.883
* indicates significance at < 0.05

28
L3 Analysis
Table 33 presents the univariate chi-square analysis identifying those factors which
may be good predictors of an L3 rider fatality. The table indicates that 12 factors were all
found to be significant (i.e., alpha < 0.05). It is interesting to note that motorcycle engine
displacement was not found to be statistically significant or a good predictor of a L3 rider
fatality.
Table 33: Univariate chi-square analysis of individual factors using L3 database
Parameter Degrees of freedom Chi-square P-value
Nighttime 1 1.97 0.1602
Urban 1 19.50 <0.0001*
Curve 1 1.03 0.3111
Intersection 1 17.38 <0.0001*
Roadway type 3 8.46 0.0375*
L3 vehicle age 2 0.35 0.8410
L3 engine displacement 5 6.54 0.2568
Maximum velocity (Vmax) 1 6.90 0.0086*
L3 vehicle mass 3 6.81 0.0332*
L3 vehicle style 10 23.08 0.0105*
L3 rider age 6 5.03 0.4124
L3 rider impairment 1 4.84 0.0278*
L3 rider speeding 1 17.66 <0.0001*
L3 rider error 1 7.41 0.0065*
OV driver error 1 7.49 0.0062*
OV driver impairment 1 0.12 0.7293
Traveling speed 1 21.57 <0.0001*
Crash speed 1 56.37 <0.0001*
Collision object 3 2.51 0.6427 * indicates significance at < 0.05
When all significant variables from Table 33 were used to form the multiple logistic
regression model, the stepwise regression model sequentially removed variables until it
found a best fit model that included traveling speed and four other environmental variables
(see Table 34). Only traveling speed, intersection accidents and major arterial roadway
accidents were found to be significant predictors of an L3 rider fatality. Analysis of the odds
ratio indicates that for every 10 km/h increase in traveling speed, the odds of a L3 rider
fatality increase by 1.38 (i.e., 1.033^10). The odds of an L3 rider fatality actually decrease
by 55% when considering accidents that occur at intersections as compared to accidents
that do not occur at intersections. As observed in the regression models for the other
motorcycle categories (i.e., All PTWs and L1 vehicles), accidents that take place on major

29
arterial roadways are more likely to result in a L3 rider fatality. For L3 accidents, the odds of
a rider fatality on a major arterial roadway are 3.3 times greater than on a minor roadway
(i.e., the reference category).
Table 34: L3 logistic regression model using all significant variables L3 Vehicles Only Model 1 Number of observations: 404 R2 value: 0.2134
Parameter Coefficient Std. Error z-value Prob. Odds ratio
95% CI
Constant -4.284 0.556 -7.70 0.000 Travelling speed 0.033 0.006 5.81 0.000* 1.033 1.022 1.045 Intersection -0.809 0.348 -2.33 0.020* 0.445 0.225 0.880 Motorway -1.233 0.756 -1.63 0.102 0.291 0.066 1.280 Major arterial 1.187 0.351 3.38 0.001* 3.280 1.648 6.528 Other roadway type 1.579 0.745 2.12 0.034 4.85 1.126 20.871
* indicates significance at < 0.05
When all variables are added to the initial model, 4 of the variables noted above are
included in the model (see Table 35). The only variable that was removed from this model
was a motorway accident, which was not found to be significant in the first L3 model
developed. In the model presented in Table 35, all variables were found to be significant
predictors of an L3 rider fatality. The same trends noted above were also observed for this
model (i.e., increase in traveling speed increases the odds of a fatality, etc.).
Table 35: L3 logistic regression model using all variables L3 Vehicles Only Model 2 : All factors listed in Table 33 Number of observations: 346 R2 value: 0.2224
Parameter Coefficient Std. Error z-value Prob. Odds ratio
95% CI
Constant -4.421 0.637 -6.94 0.000 Travelling speed 0.031 0.006 4.96 0.000* 1.031 1.019 1.044 Major arterial 1.444 0.391 3.69 0.000* 4.238 1.969 9.121 Other roadway type 1.853 0.759 2.44 0.015* 6.376 1.441 28.205 Intersection -0.843 0.407 -2.07 0.039* 0.430 0.194 0.956
* indicates significance at < 0.05
Given the effect that the variable rider age had upon the PTW and L1 models,
similar analyses were performed using age as a continuous variable as well as using the
age categories used in the MAIDS Final Report. In all cases, the stepwise regression
removed the L3 rider age variable from the model, indicating that age was not a significant
predictor of an L3 rider fatality. However, when age was combined with the speeding
variable, a significant interaction was noted. Table 36 presents the logistic regression
model that was developed comparing different L3 rider age groups and speeding. The
results indicate that a significant interaction was found for those L3 riders that are 22 to 25

30
years of age and were found to be speeding. The odds ratio indicates that the risk of an L3
rider fatality for this particular group is over 6 times greater than for L3 riders that are aged
26 to 41 years of age (i.e., the reference group).
Table 36: L3 logistic regression model using motorcycle rider speeding and L3 rider age category variables
L3 Vehicles Only Model 3: motorcycle rider speeding and age categories and interactions Number of observations: 517 R2 value: 0.0735
Parameter Coefficient Std. Error z-value Prob. Odds ratio
95% CI
Constant -2.147 0.249 -8.62 0.000 L3 rider speeding 0.441 0.383 1.15 0.248 1.556 0.735 3.293 L3 rider age 16-17 yrs -0.050 0.786 -0.06 0.949 0.951 0.204 4.435 L3 rider age 18–21 yrs -0.050 0.658 -0.08 0.939 0.951 0.262 3.450 L3 rider age 22-25 yrs -0.437 0.575 -0.76 0.447 0.646 0.209 4.994 L3 rider age 41-55 yrs -0.189 0.495 -0.38 0.703 0.828 0.314 2.184 L3 rider over 56 yrs 1.048 0.584 1.23 0.220 2.851 0.535 15.197 Speeding X 18-21 yrs 1.245 0.025 1.21 0.225 3.471 0.466 25.870 Speeding X 22-25 yrs 1.837 0.734 2.50 0.012* 6.276 1.488 26.476 Speeding X 41-55 yrs 1.082 0.714 1.52 0.129 2.952 0.728 11.966 Speeding X over 56 yrs -0.441 1.465 -0.30 0.763 0.643 0.036 11.355
* indicates significance at < 0.05

31
Section IV
SUMMARY
An analysis of the MAIDS database was performed in order to identify factors that
may be good predictors of a PTW rider fatality. Analyses were performed using the full
MAIDS database (i.e., all PTW accidents) as well as using subsets of the MAIDS database
that contained only L1 and L3 accidents. It should be noted that the database used to
develop all the multinomial logistic regression models was the MAIDS database. As a result,
this database includes only those riders that were involved in a motorcycle crash and
includes those factors which are known to be over and under-represented as previously
reported in the MAIDS Final Report. How well the regression models would actually predict
a motorcycle rider fatality for a different data set is not known at this time. Nonetheless, the
results of this analysis provide an important insight into those factors which, when
considered together, significantly increase the risk of a PTW rider fatality.
As a result of this analysis, the following major findings were observed:
• All PTW accident characteristics
- The risk of a PTW rider fatality increases with age. PTW riders over 41 years of
age appear to be at greater risk. PTW riders between 18 to 21 years appear to
have lesser risk of being involved in a fatality when compared to 26 to 41 year
old PTW riders.
- There is a significant increase in the risk of a PTW rider fatality when the
accident takes place on a major arterial roadway.
- Accidents that take place at a site other than an intersection appear to have a
greater risk of PTW rider fatality.
- PTWs with sidecars were found to have a higher risk of PTW rider fatality;
however, there are insufficient cases in the MAIDS database to confirm this
conclusively.
- When other factors are taken into consideration, no vehicle factors were found to
be statistically significant predictors of a PTW rider fatality (other than the
motorcycles with sidecar result noted above).
- PTW rider speeding was not found to be a good predictor of a PTW rider fatality.
- For every 10 km/h increase in crash speed, the odds of a PTW rider fatality
increase by 1.31.

32
• L1 vehicle accident characteristics
- Urban accidents have a reduced risk of fatality when compared to rural accidents
- Nighttime accidents have a greater risk of fatality when compared to daytime
accidents (odds ratio = 1.06).
- Accidents involving a collision with a fixed object have an 8.1 times greater risk
of involving a L1 rider fatality when compared to a collision with a light passenger
vehicle
- For every 10 km/h increase in crash speed, the odds of a L1 rider fatality
increase by 1.24
- Other vehicle driver impairment significantly increased the odds of a L1 rider
fatality (odds ratio = 5.74).
- L1 rider errors significantly increased the odds of a L1 rider fatality (odds ratio =
3.37).
- The risk of a L1 rider fatality increases with age. L1 riders over 41 years of age
have an 8.5 times greater risk of being involved in a fatality when compared to L1
riders that are 26-40 years of age.
• L3 vehicle accident characteristics
- Travelling speed was found to be a significant factor in predicting an L3 rider
fatality. For every 10 km/h increase in traveling speed, the odds of a L3 rider
fatality increase by 1.38.
- Environmental factors (i.e., intersections and major arterial roadways) were also
found to be significant in predicting an L3 rider fatality.
- L3 vehicle engine displacement and L3 vehicle maximum velocity are not
significant predictors of an L3 rider fatality.
- L3 rider age was not a good predictor of an L3 rider fatality. However, when
considering L3 rider speeding, L3 riders aged 22-25 were found to have a
significant increase in risk of L3 rider fatality when compared to L3 riders aged 26
to 40 years.
- OV driver errors were not found to be a significant predictor of an L3 rider fatality

33
Section V
REFERENCES
Association des Constructeurs Européens de Motocycles, "MAIDS accident database,
Final Report 1.2," 2005, www.maids-study.eu.
Shankar, V., Mannering, F. “An Exploratory Multinomial Logit Analysis of Single-Vehicle
Motorcycle Accident Severity,” Journal of Safety Research 27(3):183-194, 1996.
Savolainen, P., Mannering, F. “Probabilistic models of motorcyclists’ injury severities in
single- and multi-vehicle crashes. Accident Analysis and Prevention 39(5):955-963, 2007.
Ulfarsson, G., Mannering, F. “Differences in male and female injury severities in sport-utility
vehicle, minivan, pickup and passenger car accidents.” Accident. Analysis and Prevention
36 (2):135–147, 2004.