magnetometer 4 vlf-electromagnetic …...32e04se0006 2.12683 adair 010 l magnetometer 4...
TRANSCRIPT
32E04SE0006 2.12683 ADAIR010
l
MAGNETOMETER 4 VLF-ELECTROMAGNETIC SURVEYS
RAVE RESOURCES INC. GROUP
Abbotsford-Adair Townships,Ontario
by
F.T.Archibald, B.Se.Geologist
August 10, 1989.
Table of Contents
page
Summary l
Property 2
Location and Access 2
Topography and Vegetation 2
General Geology 3
Discussion of Magnetometer Equipment 5
Discussion of VLF Electromagnetic Equipment 5
VLF Electromagnetic Results 7
Magnetometer Results 11
Conclusions and Recommendations 12
figures
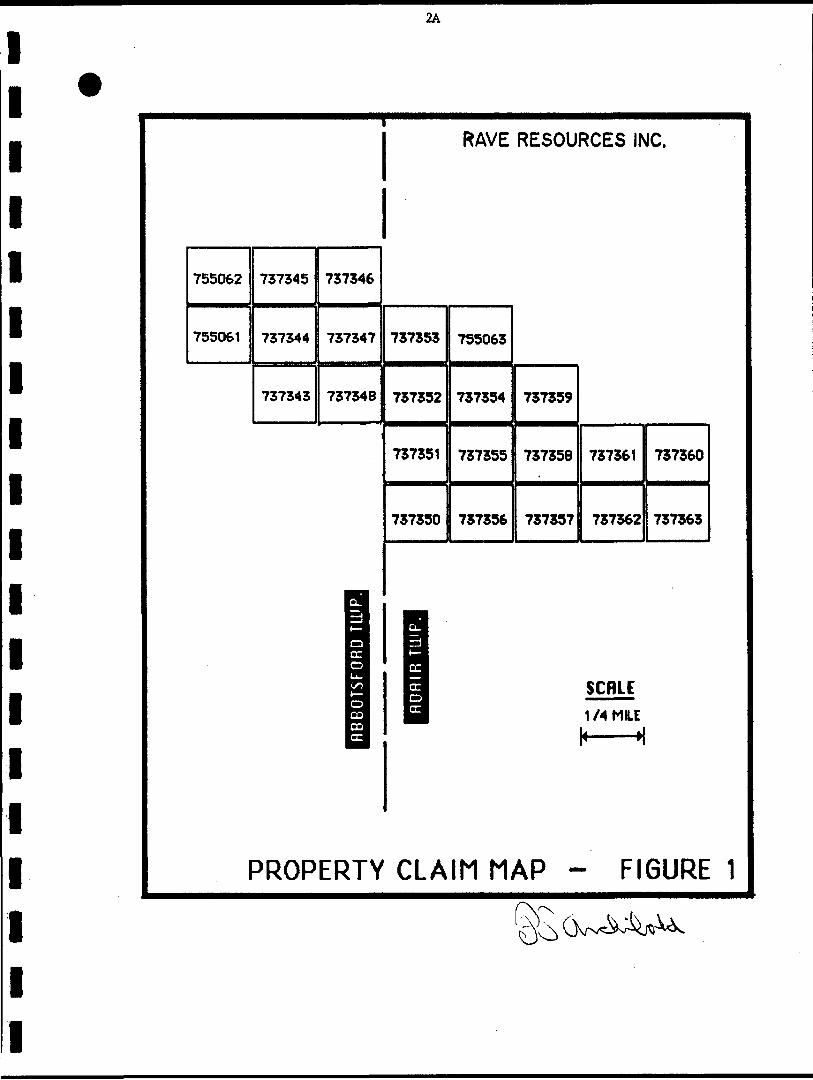
Property claim map l inch to 1/4 mile 2A
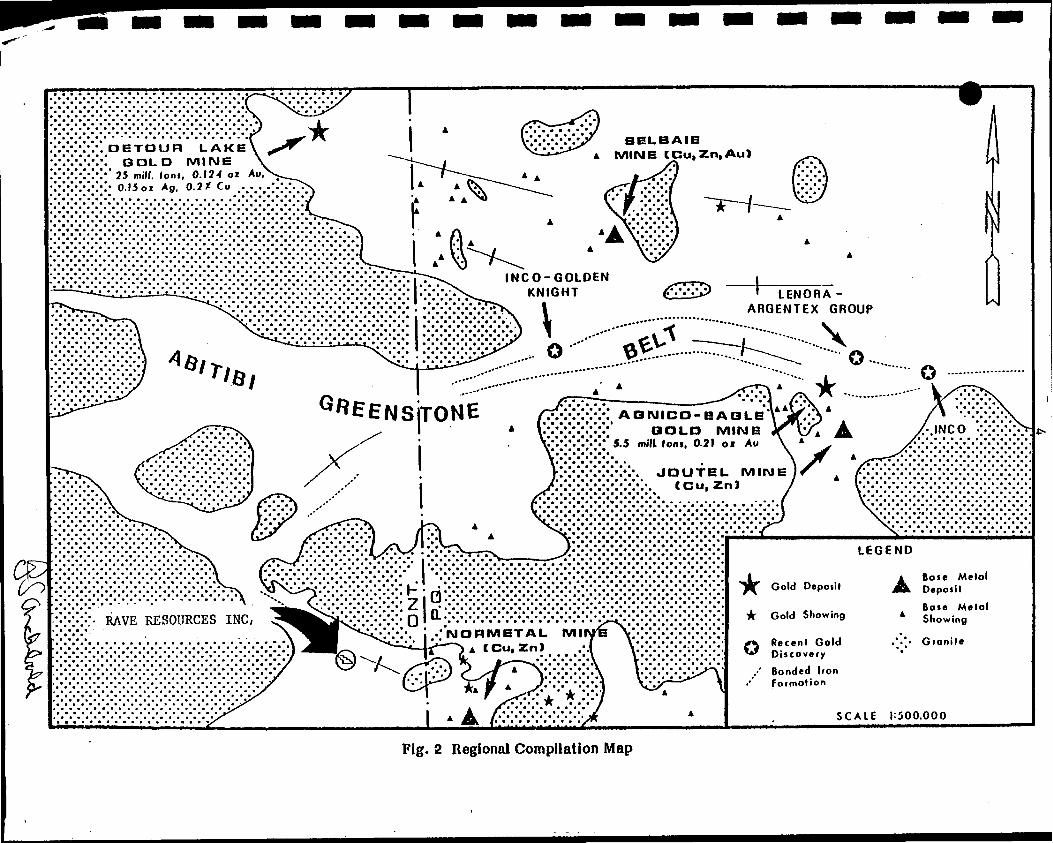
Regional Geological Compilation map 1: 500,000 4
appendix
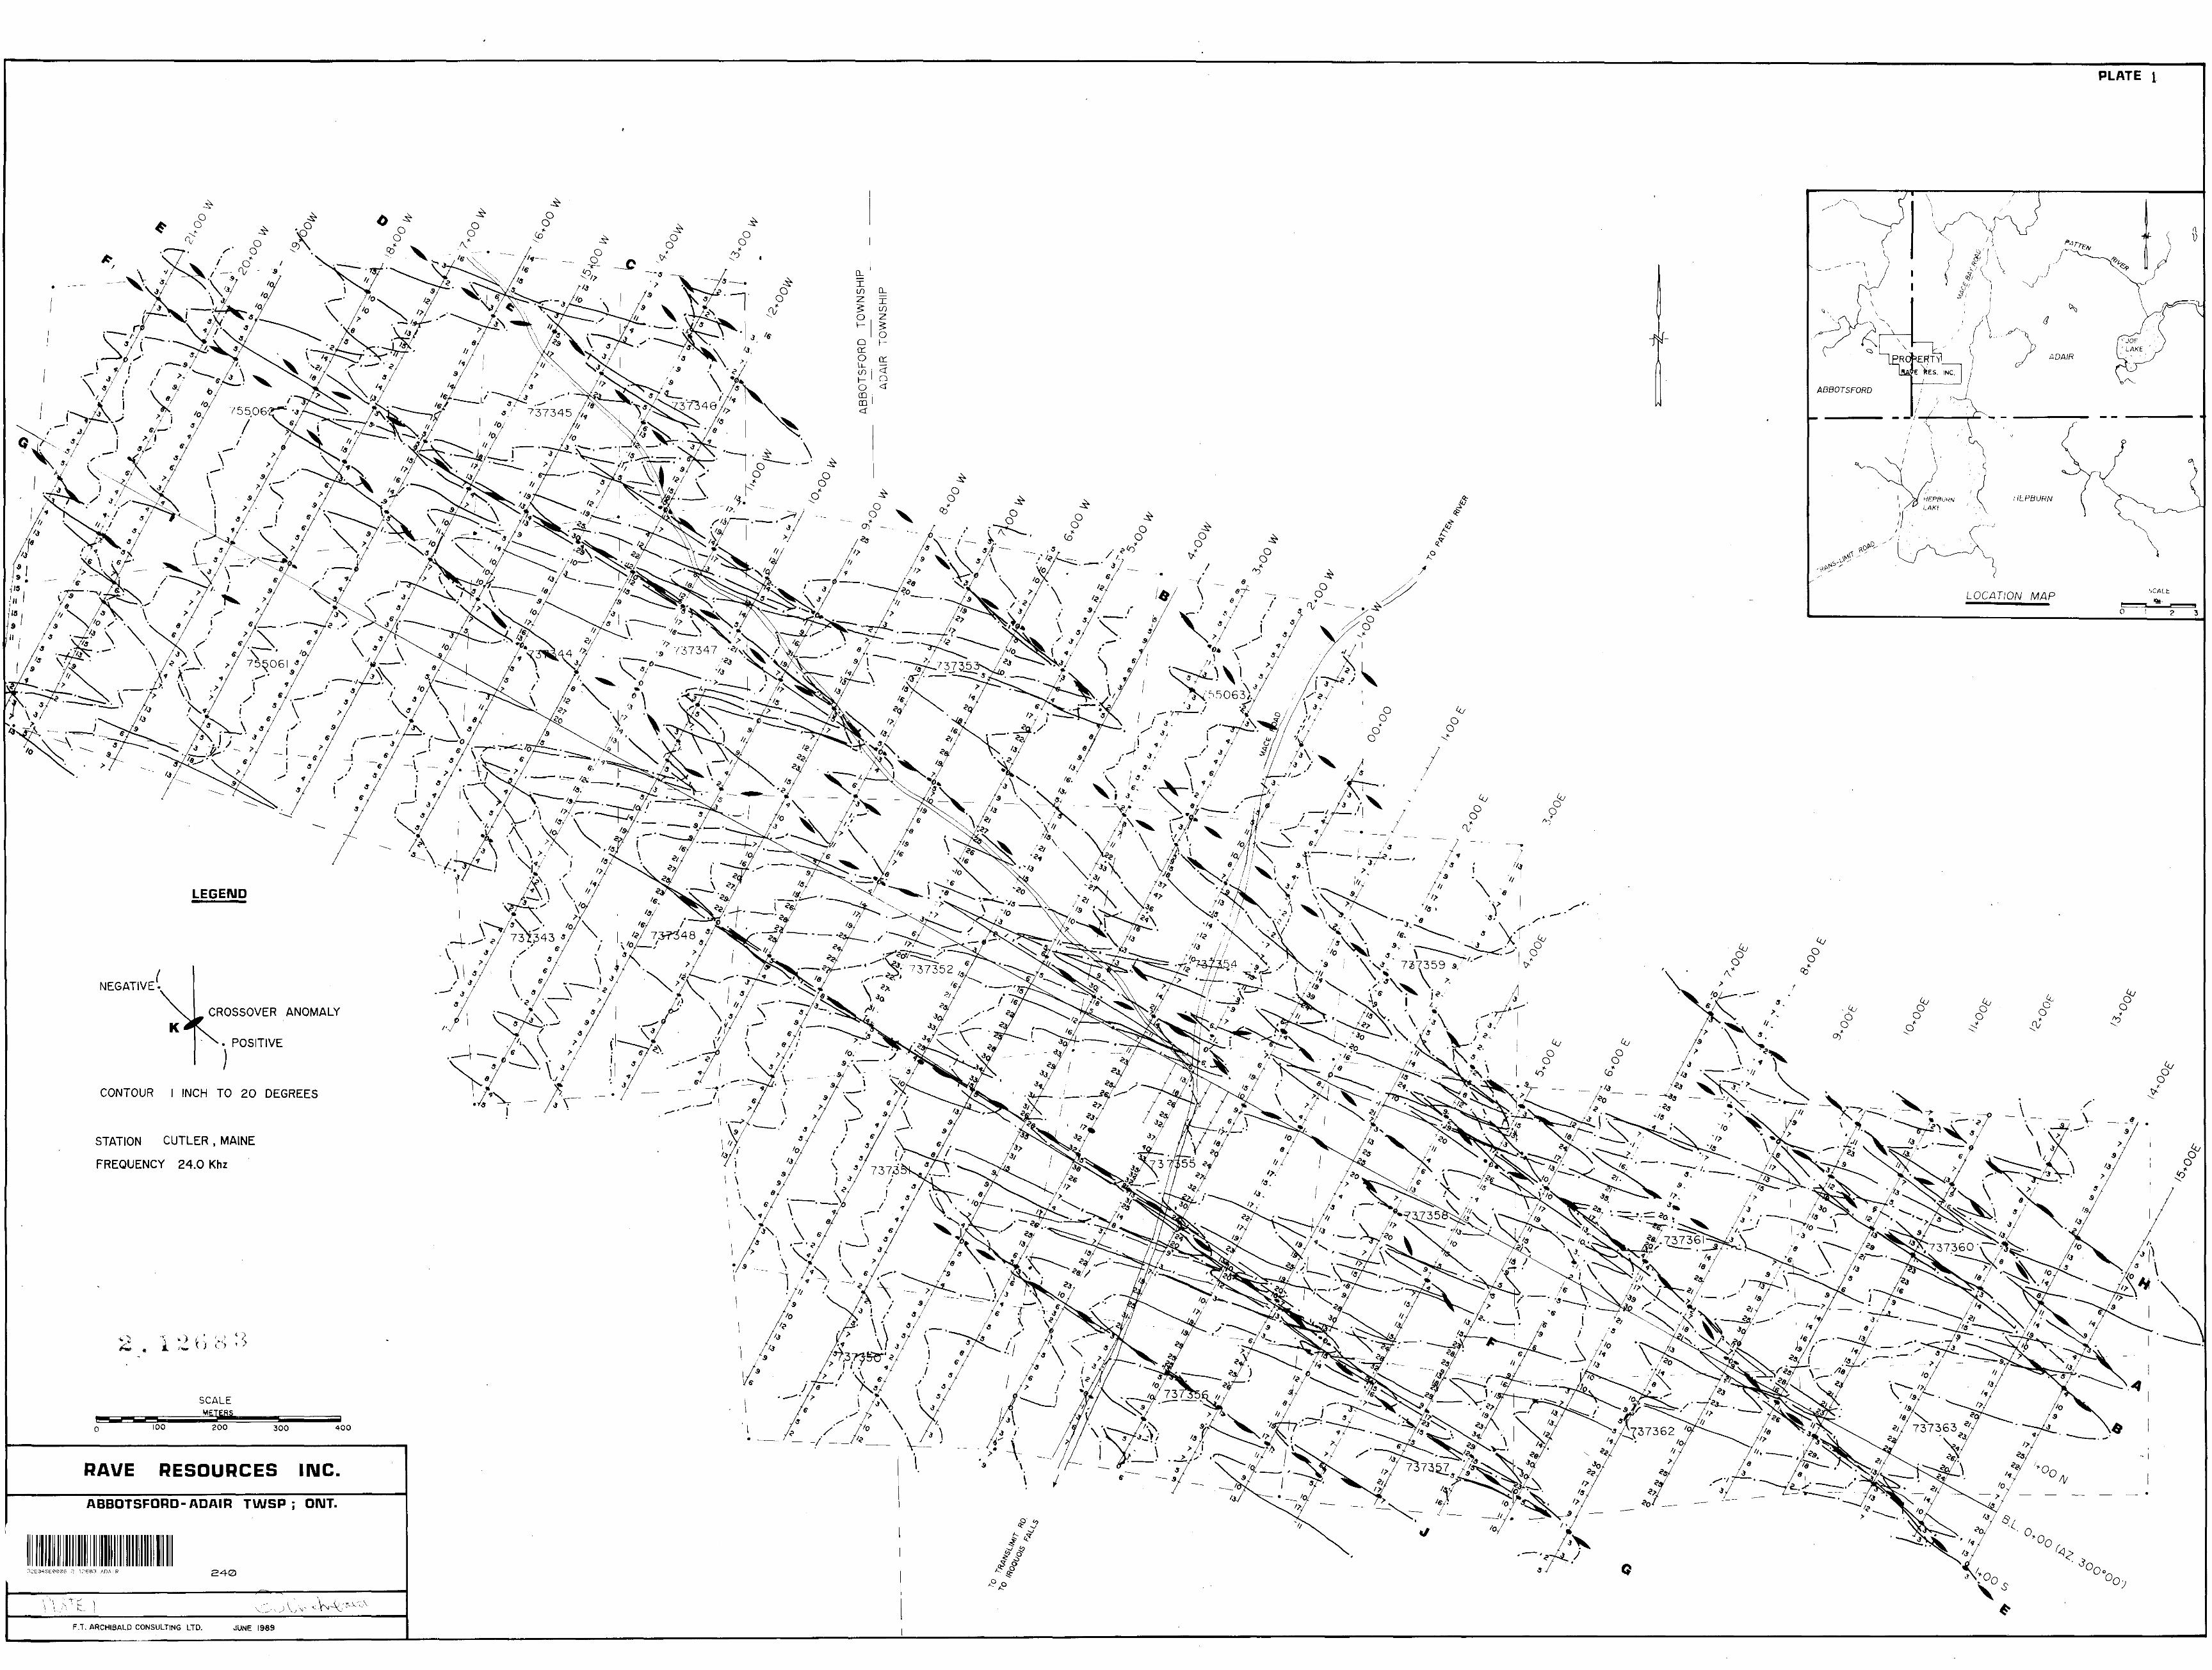
VLF Electromagnetics- dip angles l inch to 100 m. Plate l
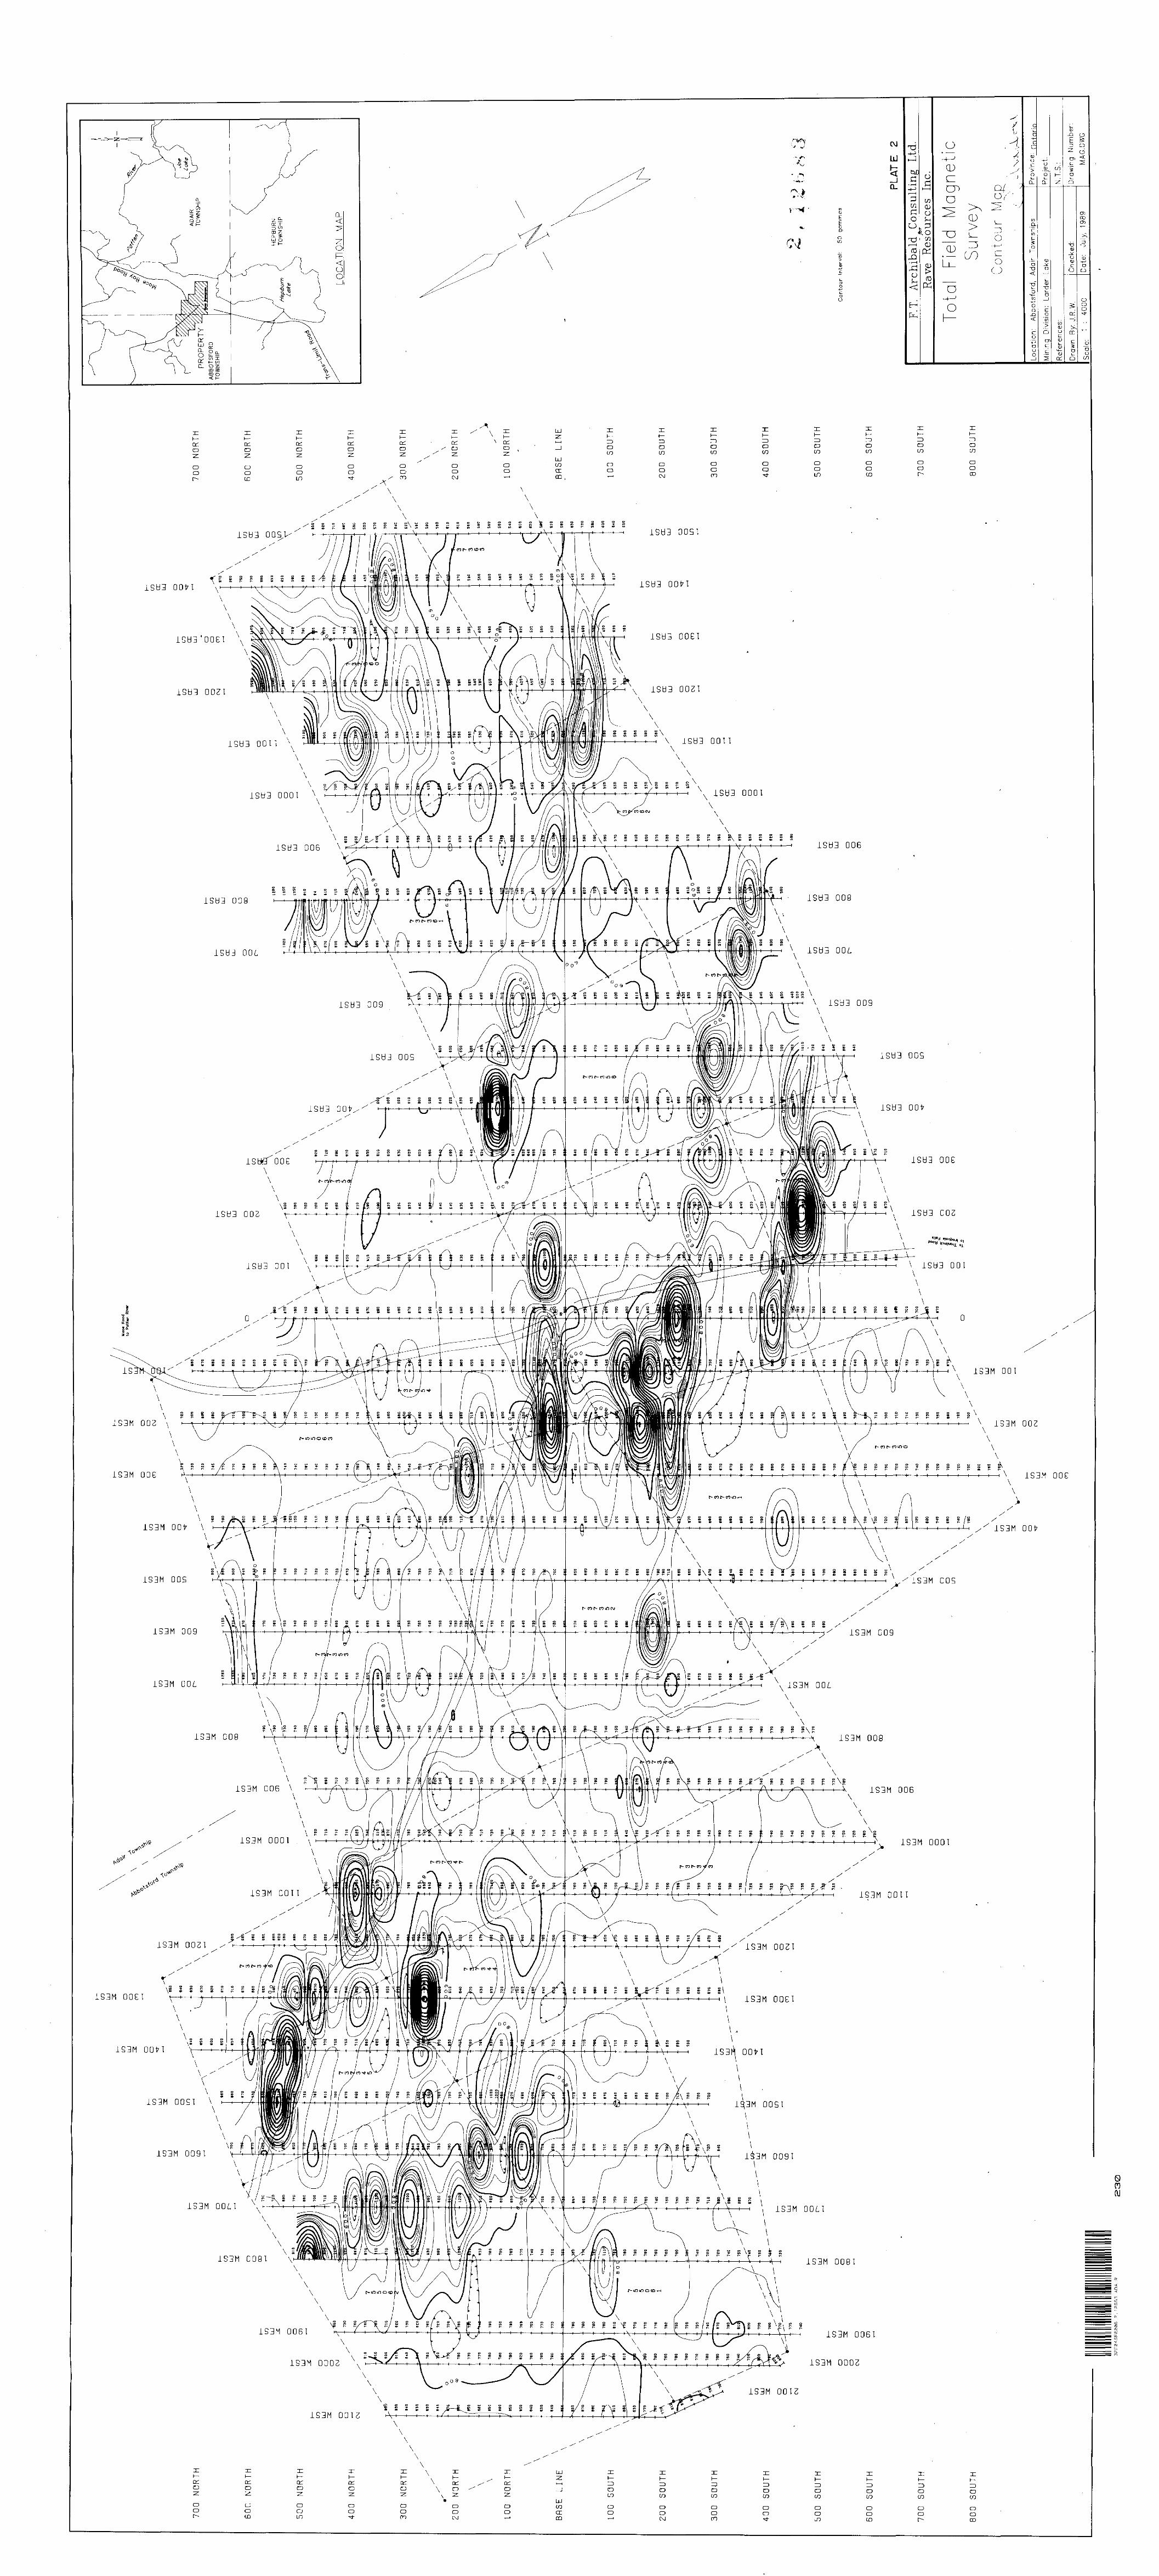
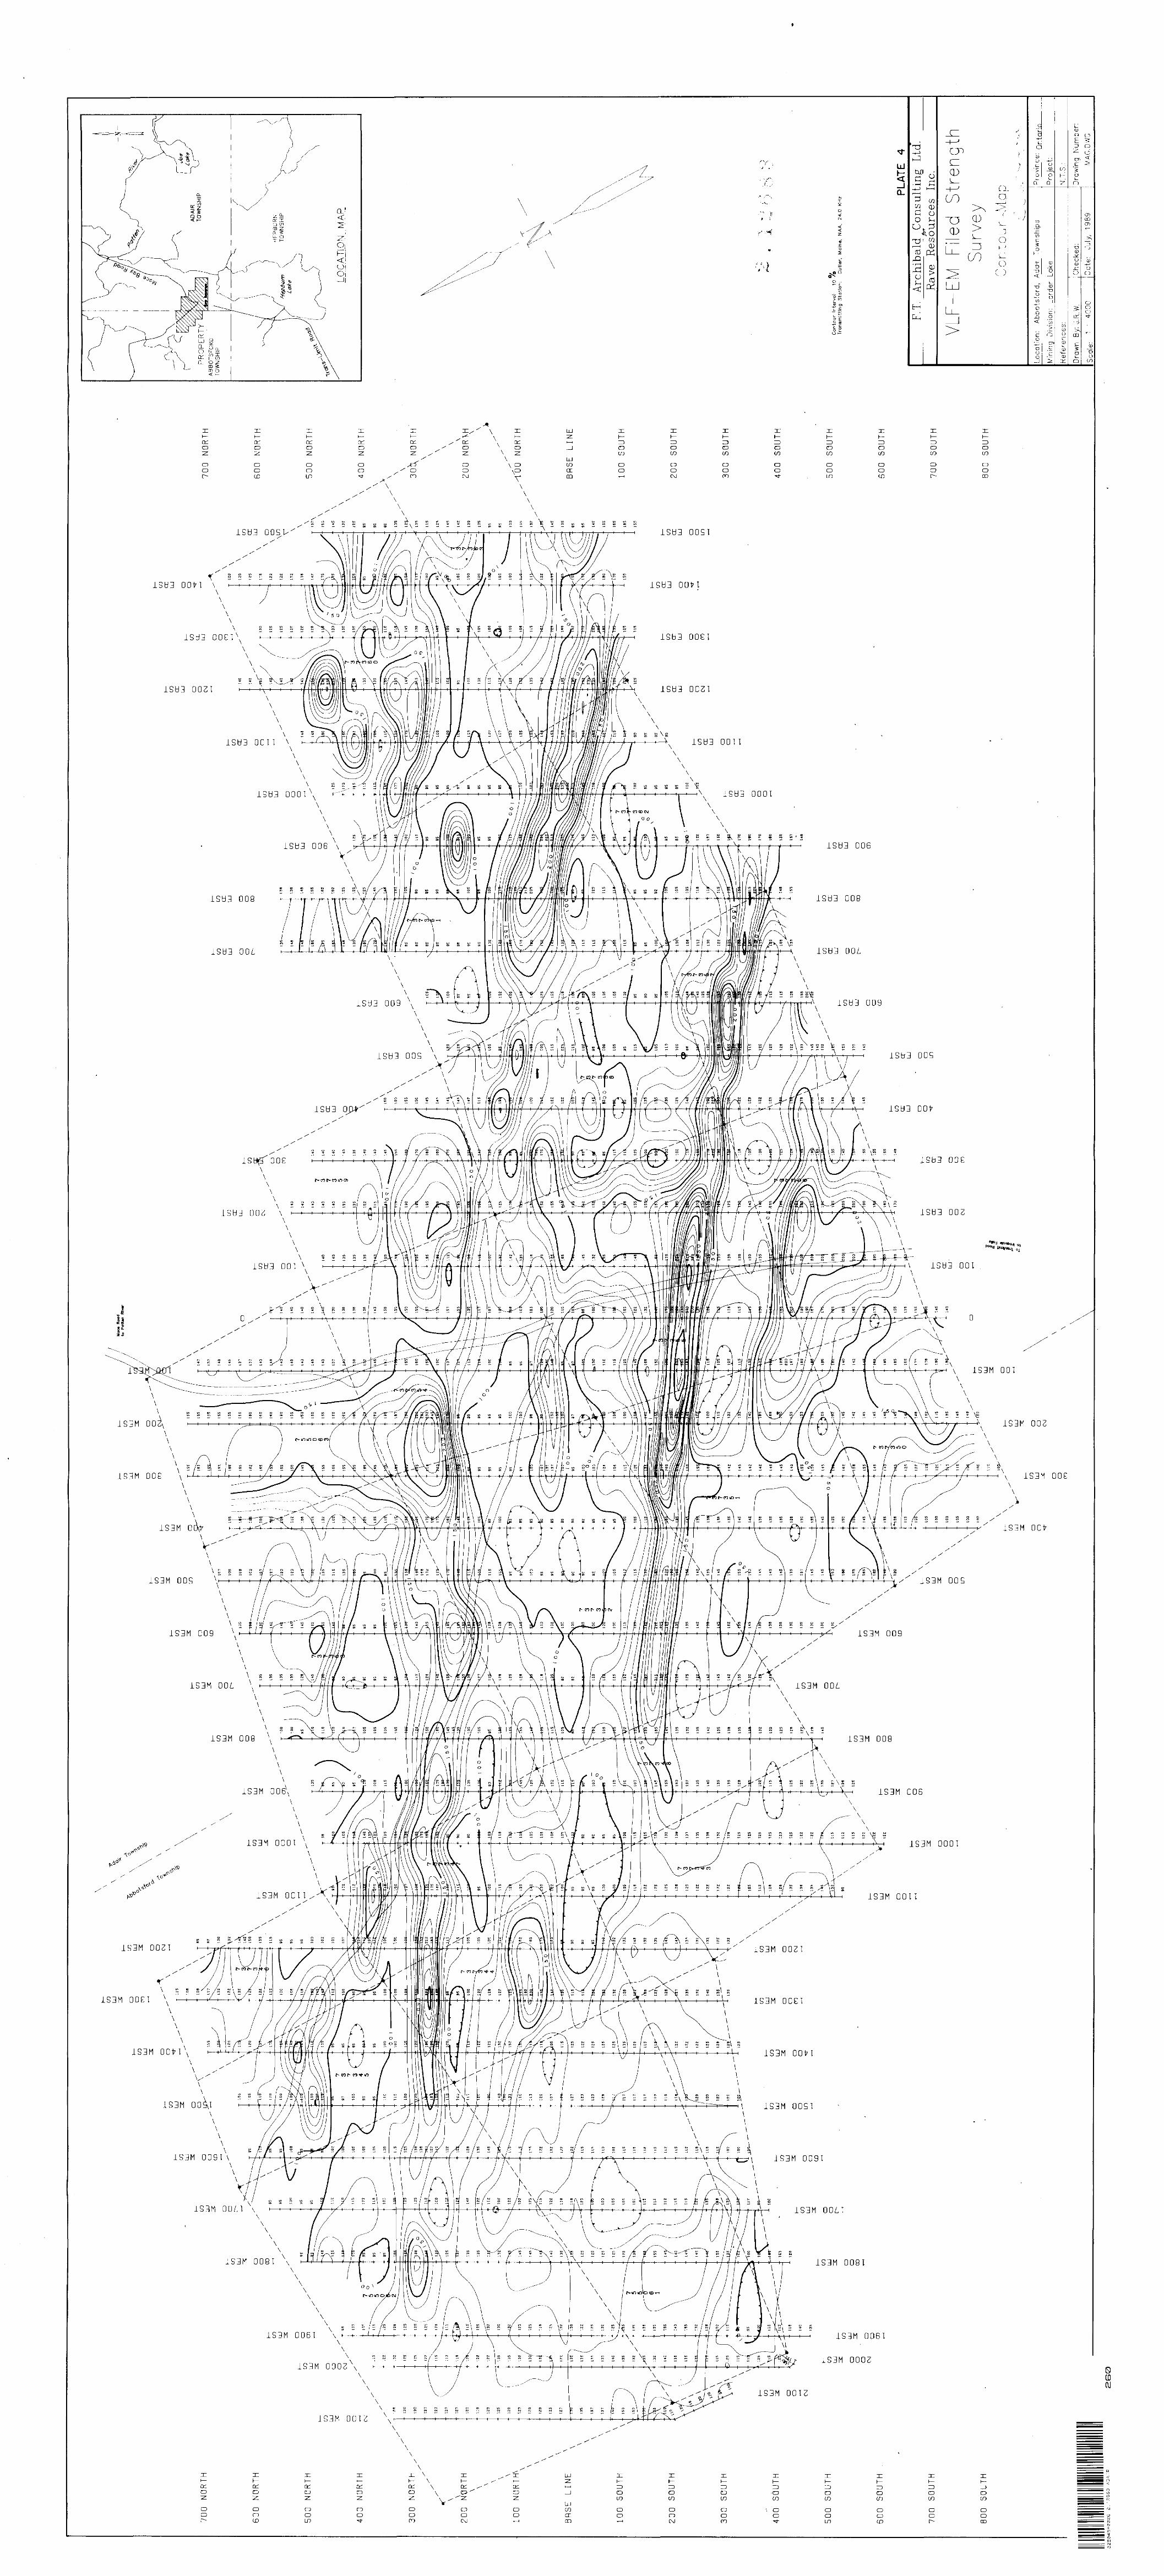
VLF Electromagnetics- field strength contourl inch to 100 m. Plate 2
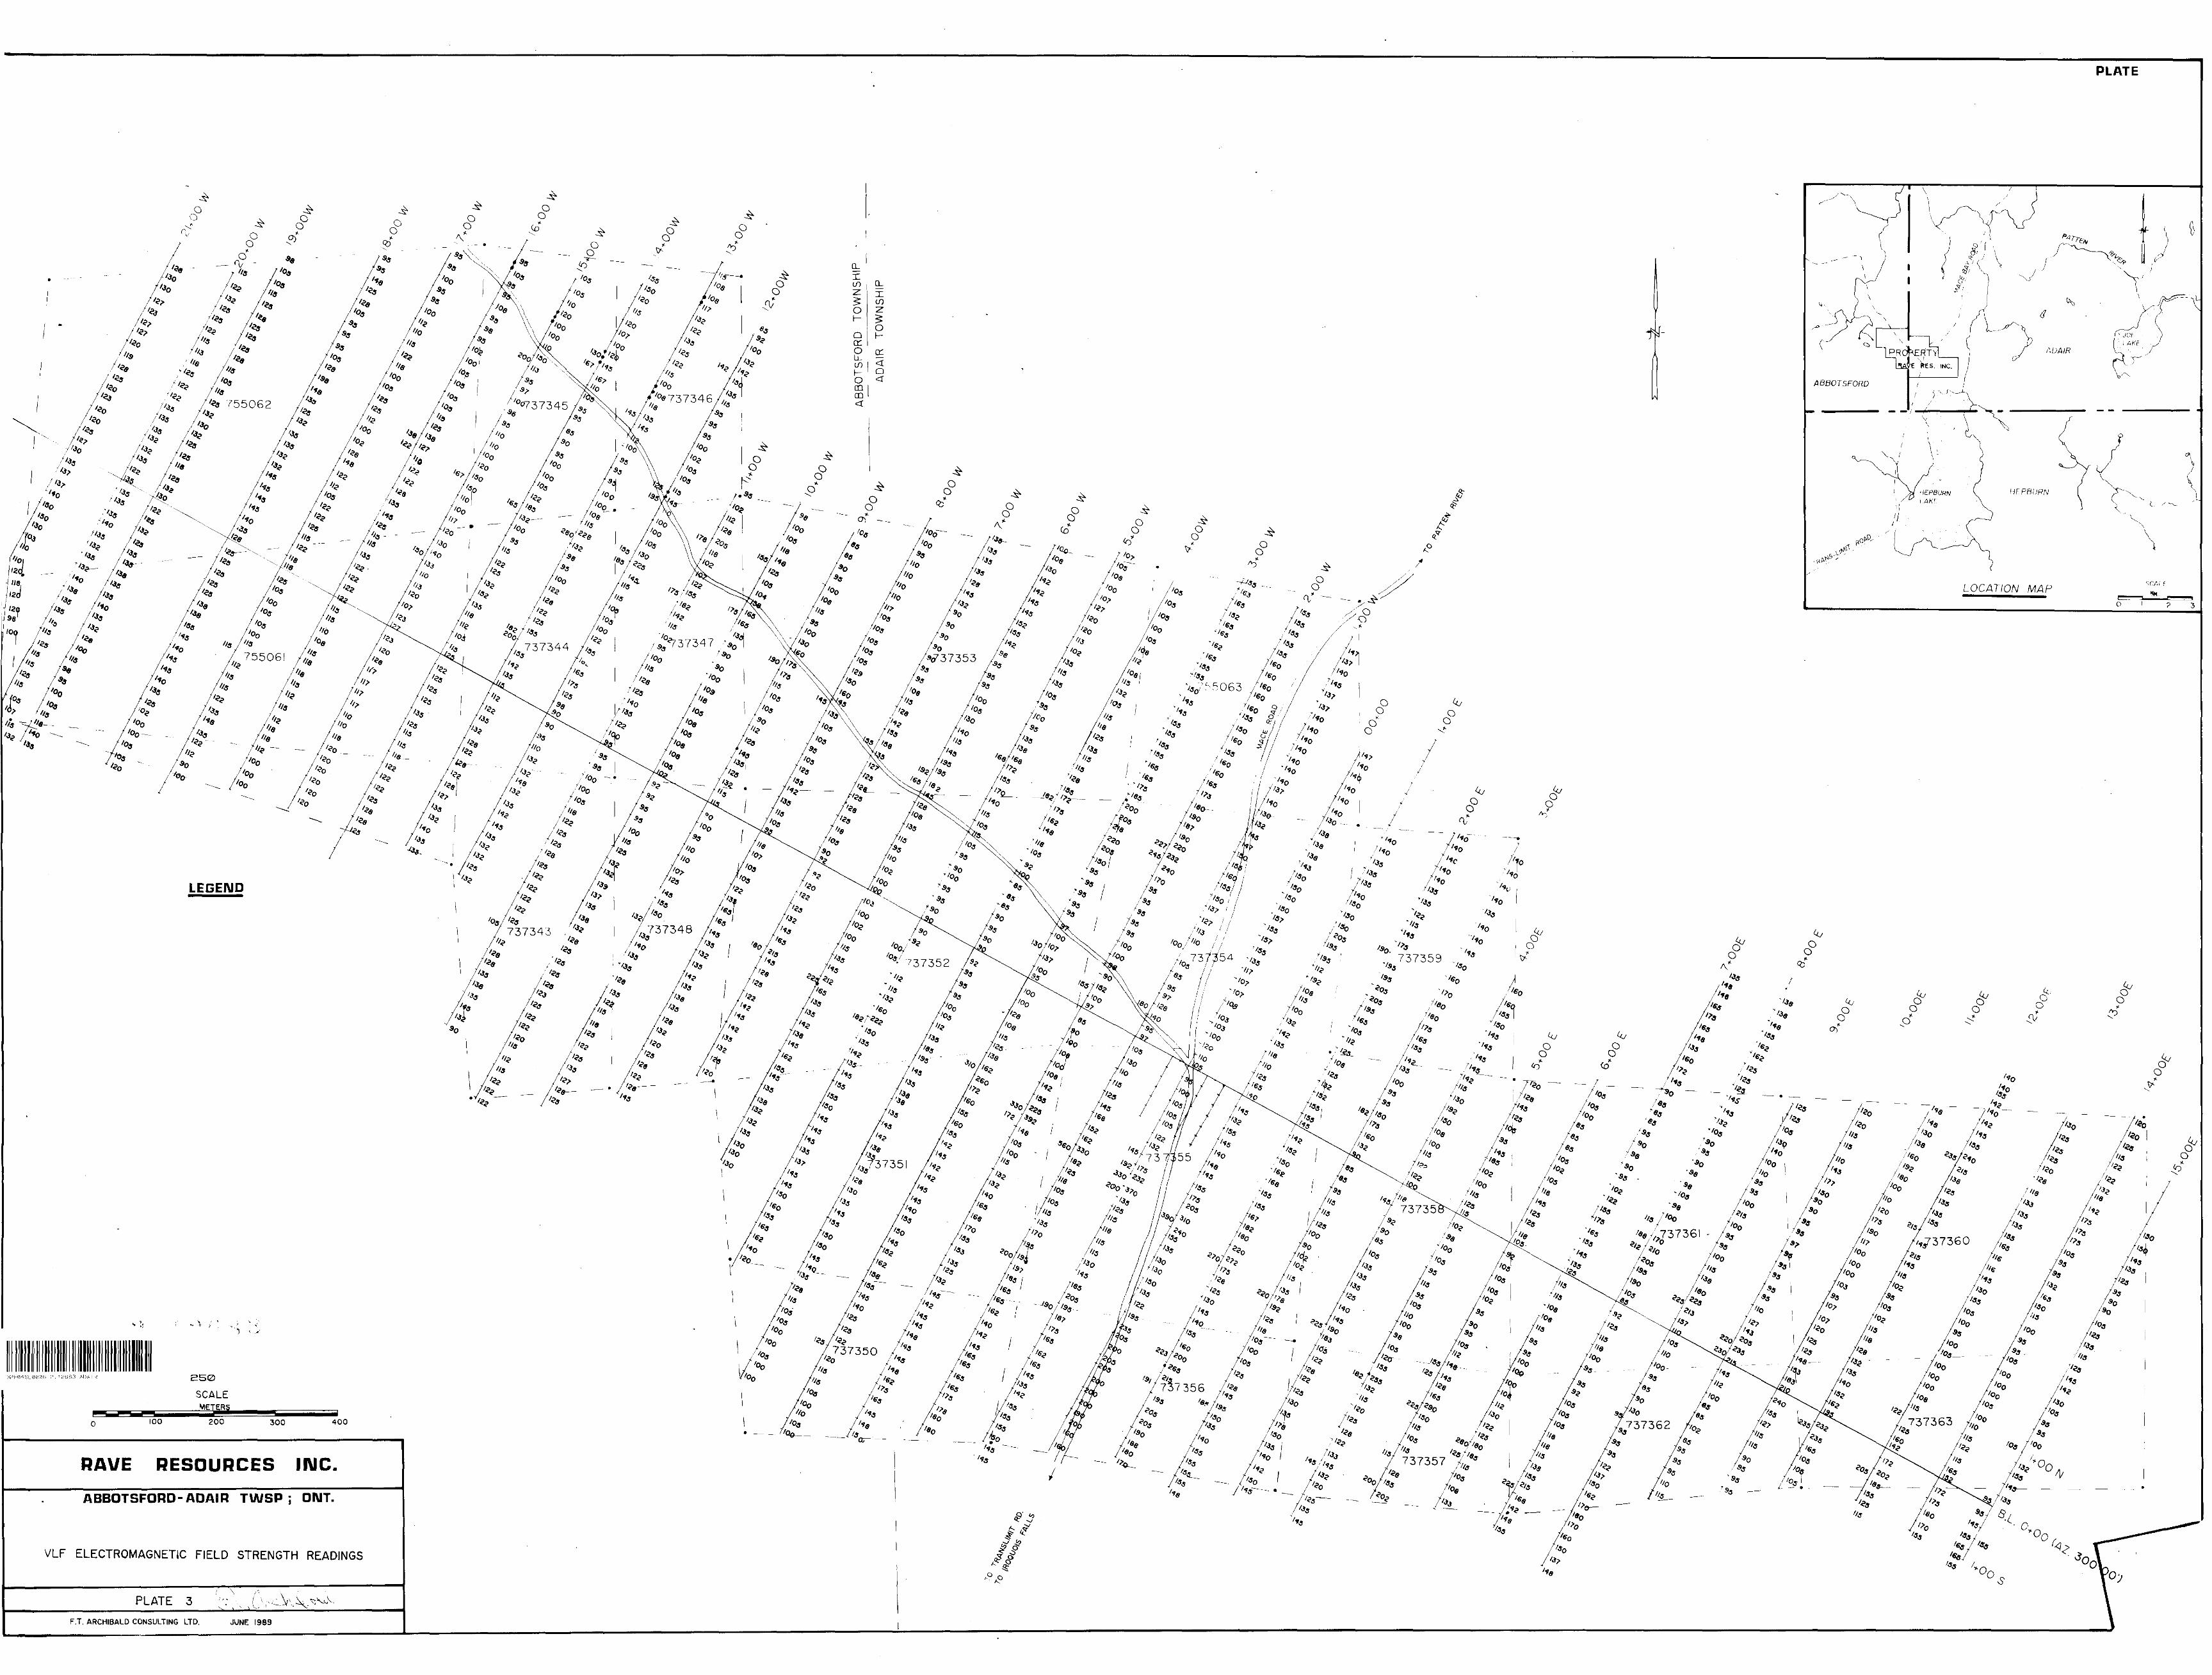
VLF Electromagnetics- field strength readingsl inch to 100 m. .Plate 3
Proton Magnetometer Survey - contoursl inch to 100 m. Plate 4
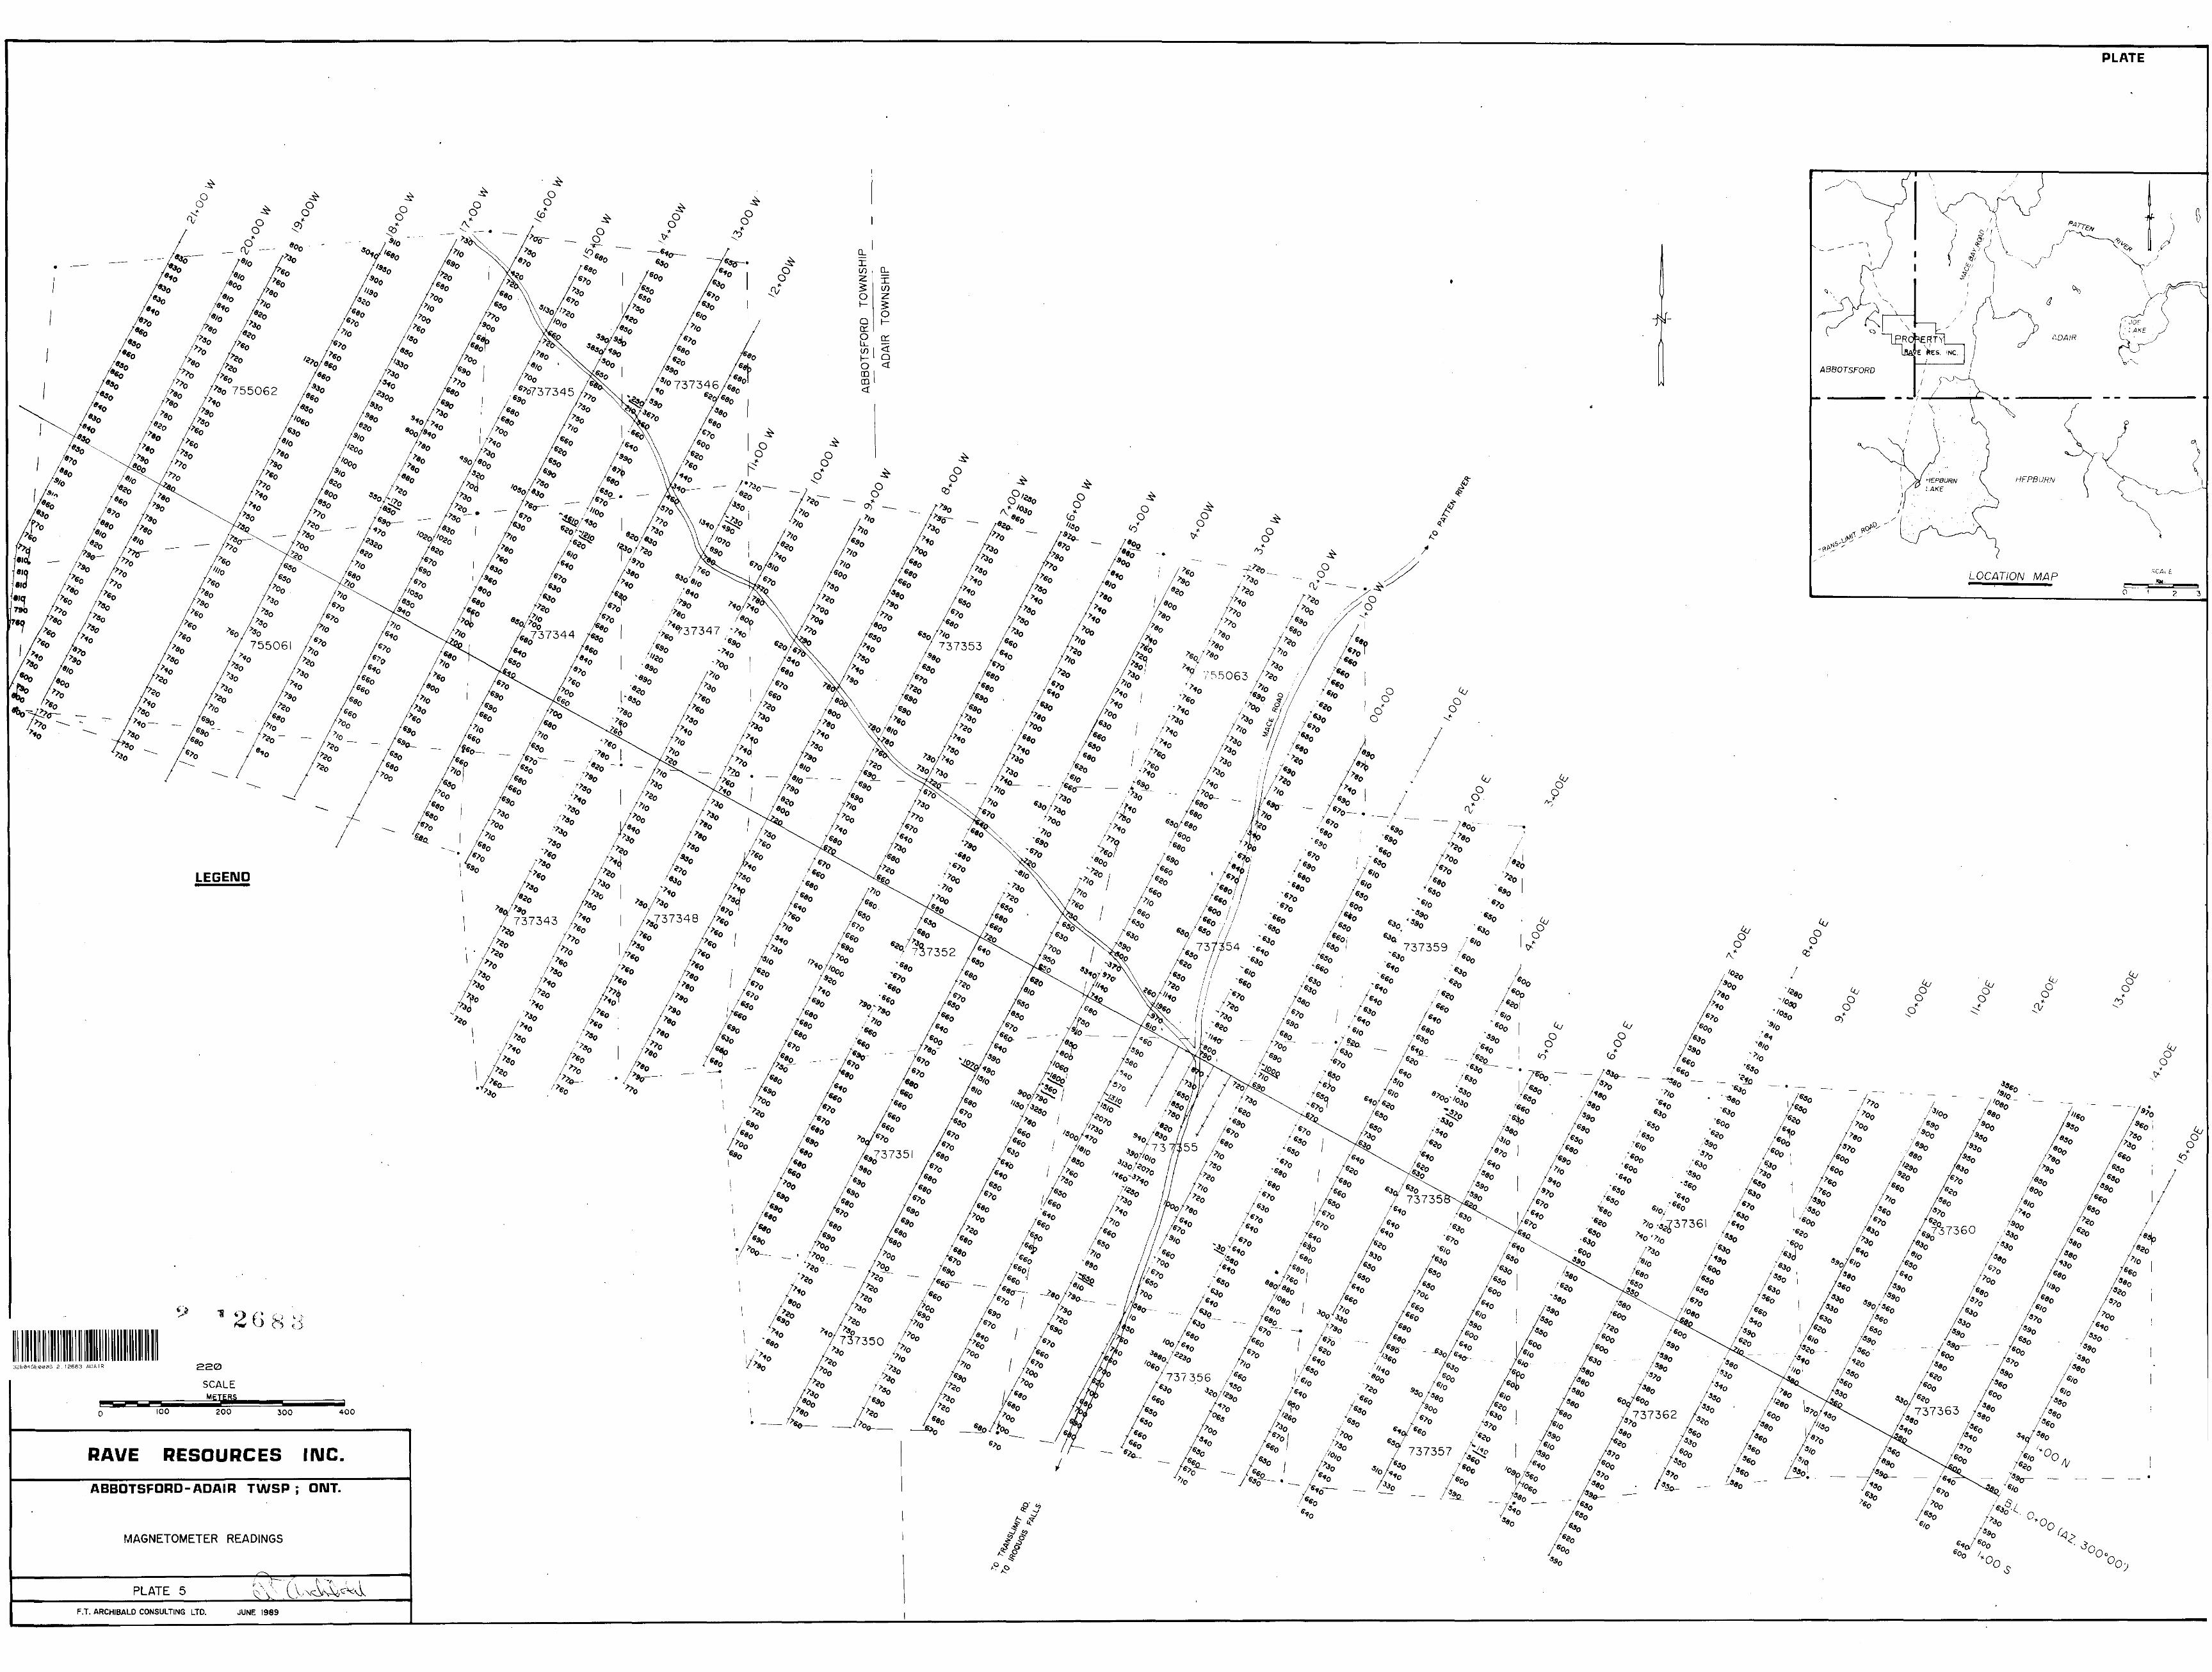
Proton Magnetometer Survey- readingsl inch to 100 m. Plate 5
RAVE RESOURCES INC. MAGNETOMETER S VLF-ELECTROMAGNETIC SURVEYS
Abbotsford-Adair Townships, Ont.
Summary"
The Rave Resources Ltd. Property consists of twenty-three contiguous
mining claims located in Abbotsford and Adair Townships in the Larder Lake
Mining Division of Northeastern Ontario.
The property is located within the Abitibi Greenstone Belt which is
the host for the Agnico-Eagle, Inco- Golden Knight, and Normetal deposits.
The property is underlain by mainly felsic-tuffaceeous volcanics which are
bounded by mafic volcanic horizons in the norttu-and south extremities of the
property.
The electromagnetic and magnetometer surveys were run over lines at
one hundred meters apart and stations at every twenty meters. If anomalous
values were encountered then stations were taken every ten meters apart. A
total of approximately 2200 stations were outlined during each survey, and
approximately fourty kilometers was traversed during each survey.
Both the magnetometer and electromagnetic surveys outlined several
strong sulphide-conductor zones, traversing in a southeast-northwest direction.
The VLF electromagnetics defined at least eight strong conductors within
the felsic-tuffaceous rock units. These conductive zones correspond with
sulphide-rich iron formation up to one hundred feet in width. Some of these
zones contain up to three closely spaced parallel bands.
The magnetometer survey has outlined most of the iron formation
bands which were defined by the electromagnetic surveys. The magnetics have
also defined the geological contact area between the felsic and mafic volcanics
in the northeastern section of the claim group.
The closely spaced orientation of the magnetometer and VLF electromagnetic
surveys have better defined the anomalous areas which were outlined by a
previous airborne survey. It appears that some of the airborne anomalies were
up to one hundred meters away from the actual locations of the conductors.
Of the thirteen diamond drill holes which were drilled by Canadian Javelin Ltd.,
five were drilled overtop of the anomalies and possibly two or three were
drilled down-dip and too far away to intersect the conductor zones.
Several targets have been outlined for surface stripping and sampling;
and followup diamond drilling is suggested for four of the zones as they are
in areas of deep overburden. Three of the conductors coincide with basal
till anomalies.
Property-
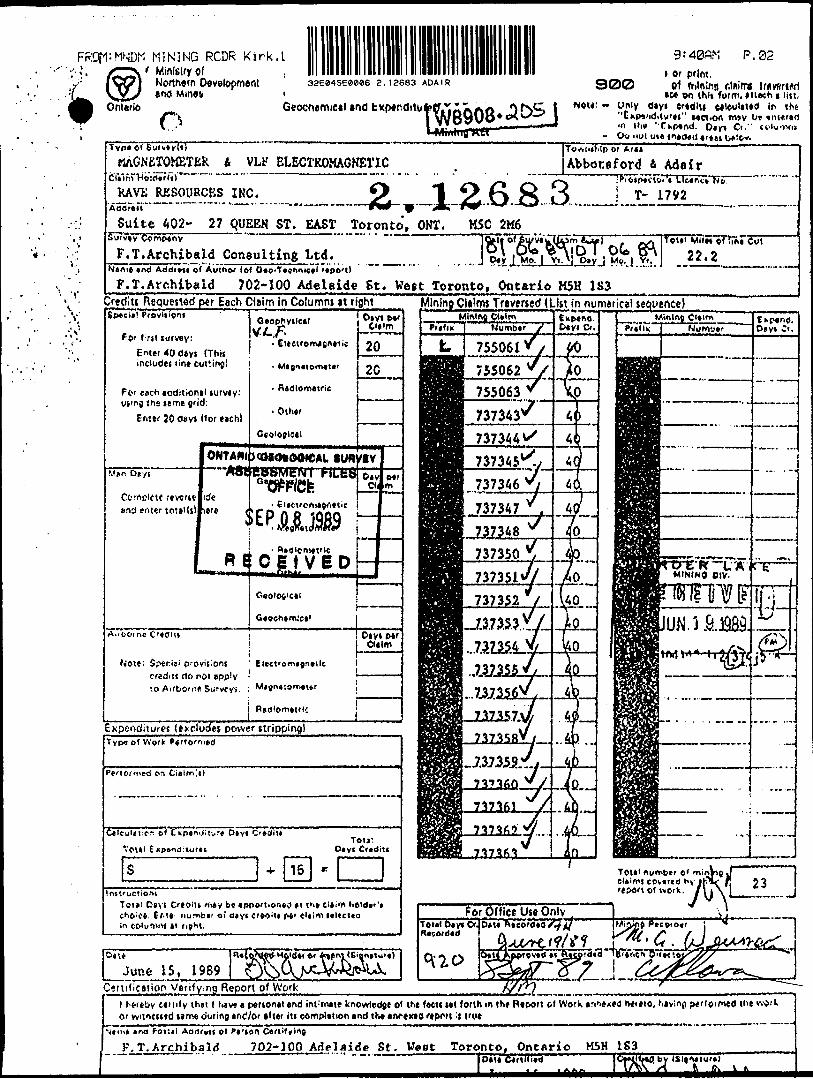
The property consists of twenty-three contiguous and unpatented mining
claims situated in Abbotsford and Adair Townships of the Larder Lake Mining
District (Kirkland Lake), Northeastern Ontario. Eight of the claims are in the
eastern half of Abbotsford Township and fifteen of the claims are in the
western section of Adair Township.
The claims are numbered as follows:
737343 to 737348 inclusive Abbotsford Township
737350 to 737363 inclusive Adair Township
755061 to 755062 inclusive Abbotsford Township
755063 Adair Township
Location and Access"
The claims are located approximately 122 kilometers east of Iroquois
Falls or thirty kilometers northwest of La Sarre. Access is along the
Translimit road to mile 112, and then for another ten kilometers to the
property. The Translimit Road is an all-season gravel road while the last
ten kilometers is accessable by vehicle only during the non-winter months.
Topography S Vegetation-
The area is covered by gently undulating knolls with flat-swamp areas
in the south, west, and northern areas of the property. The east section
is covered by mainly flat- boulder till material. The swamp areas are generally
covered by thick clay overburden. Rock ridges, outcropping on approximately
five to ten percent of the property, are generally found on the central and
northeast sections of the property.
Vegetation consists of thick spruce and tag in the lower sections to
birch and poplar in the higher sections of the property. The vegetation
is generally young as the timber has previously been cut-over.
2A
RAVE RESOURCES INC.
755062
755061
737345
737344
737343
737346
737347
737348
737353
737352
737351
737350
755063
737354
737355
737356
737359
737358
737357
737361
737362
737360
737363
SCRLE1 /4 MILEh—
PROPERTY CLAIM MAP - FIGURE 1
3
General Geology-
The property lies within the Abitibi Greenstone Belt, which includes
the Mattagami, Normetal, and Joutel (Agnico-Eagle) mineral occurences.
The property lies on the southern limb of an anticlinal fold, (see Figure 2)
The main portion of the property consists of felsic tuff volcanic rocks
with mafic volcanic rocks at the extreme northern and southern extremities of
the property.
The volcanic units are cut by northwest trending diabase and amphibolite
dykes.
Granite plutons of the Mistawak and Casa Batholiths, grading from
monzonite to granodiorite in composition, intrude into the volcanic units.
One of these is located north of the base line on line 7 East; dipping southwest.
Banded iron formations and chert formations are found to cross the
property in a northwest to southeast direction; parallel to the regional
geological strke. Most of these dip steeply to the northeast at 80 to 90
degrees.
Feldspar porphyry and carbonate occur along zones of shearing and
in areas of iron formation.
Pyrite and quartz concentrations are found within the shears, iron
formations and granite pluton contacts. In some cases accumulations of up to 5%
pyrite overall are found. Graphite rich horizons are also found within the
iron formations.
BEt-BAIE A MINE ICu, Zn.Au)'.OETDUn LAKE
GOLD MINE vlv" 25 mill, loni, 0.124 oz Aux-:-:-:- 0.15 OI *g, 0.2x
INCO-GOLOEN KNIGHT LENORA -
ARGENTEX GROUP
AONICO
Bate Metal Dcpoiil
Bate Melol
Gold Oepoiil
Gold Showing:-:-:- RAVE RESOURCES INC; .-NORMETAL MI
l Cu, Zn ) Recent Gold Discovery
X Bonded Iron Formotion
SCALE 1.500.000
Fig. 2 Regional Compilation Map
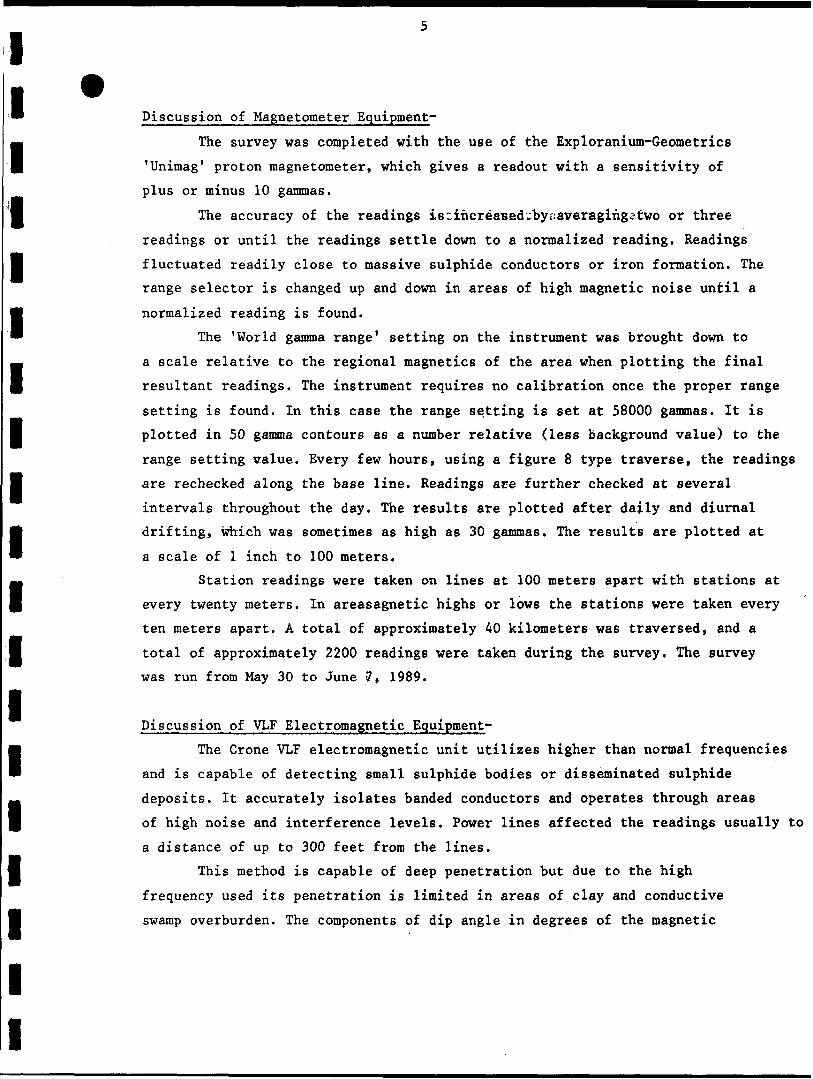
Discussion of Magnetometer Equipment-
The survey was completed with the use of the Exploranium-Geometrics
'Unimag 1 proton magnetometer, which gives a readout with a sensitivity of
plus or minus 10 gammas.
The accuracy of the readings istincreaBedubyaaveragingeiwo or three
readings or until the readings settle down to a normalized reading. Readings
fluctuated readily close to massive sulphide conductors or iron formation. The
range selector is changed up and down in areas of high magnetic noise until a
normalized reading is found.
The 'World gamma range 1 setting on the instrument was brought down to
a scale relative to the regional magnetics of the area when plotting the final
resultant readings. The instrument requires no calibration once the proper range
setting is found. In this case the range setting is set at 58000 gammas. It is
plotted in 50 gamma contours as a number relative (less background value) to the
range setting value. Every few hours, using a figure 8 type traverse, the readings
are rechecked along the base line. Readings ace further checked at several
intervals throughout the day. The results are plotted after daily and diurnal
drifting, which was sometimes as high as 30 gammas. The results are plotted at
a scale of l inch to 100 meters.
Station readings were taken on lines at 100 meters apart with stations at
every twenty meters. In areasagnetic highs or lows the stations were taken every
ten meters apart. A total of approximately 40 kilometers was traversed, and a
total of approximately 2200 readings were taken during the survey. The survey
was run from May 30 to June 7, 1989.
Discussion of VLF Electromagnetic Equipment-
The Crone VLF electromagnetic unit utilizes higher than normal frequencies
and is capable of detecting small sulphide bodies or disseminated sulphide
deposits. It accurately isolates banded conductors and operates through areas
of high noise and interference levels. Power lines affected the readings usually to
a distance of up to 300 feet from the lines.
This method is capable of deep penetration but due to the high
frequency used its penetration is limited in areas of clay and conductive
swamp overburden. The components of dip angle in degrees of the magnetic
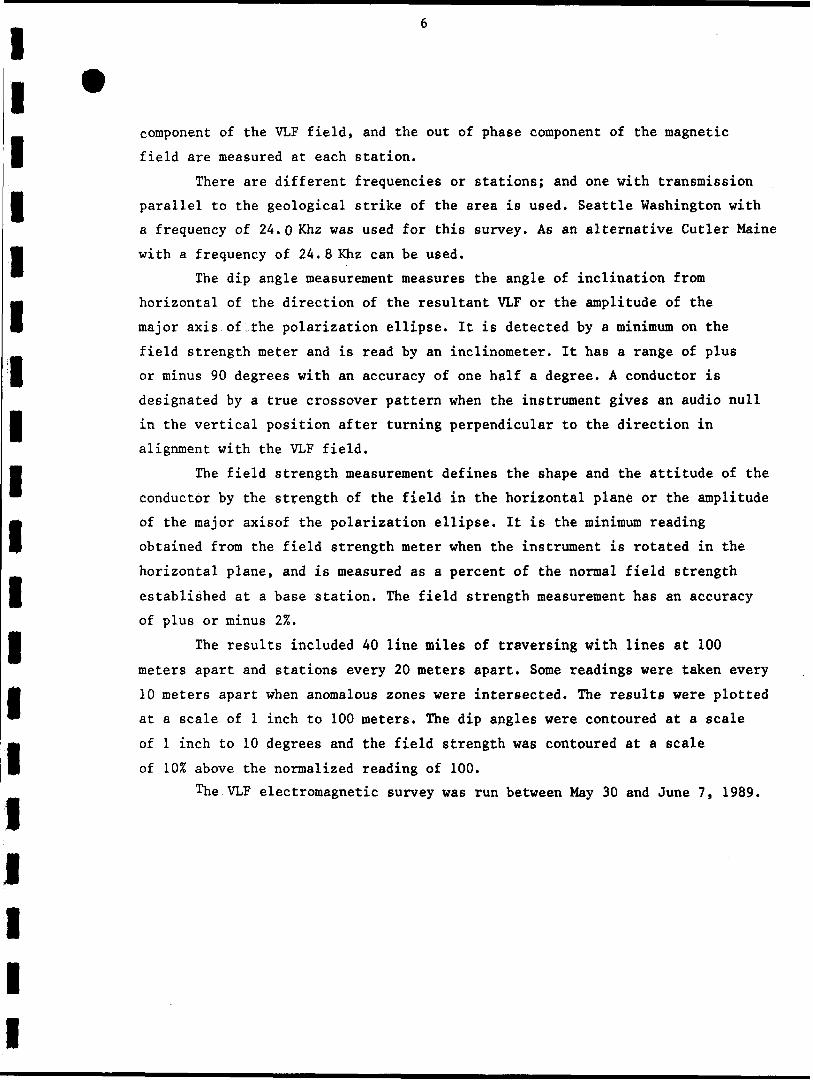
component of the VLF field, and the out of phase component of the magnetic
field are measured at each station.
There are different frequencies or stations; and one with transmission
parallel to the geological strike of the area is used. Seattle Washington with
a frequency of 24.0 Khz was used for this survey. As an alternative Cutler Maine
with a frequency of 24.8 Khz can be used.
The dip angle measurement measures the angle of inclination from
horizontal of the direction of the resultant VLF or the amplitude of the
major axis of.the polarization ellipse. It is detected by a minimum on the
field strength meter and is read by an inclinometer. It has a range of plus
or minus 90 degrees with an accuracy of one half a degree. A conductor is
designated by a true crossover pattern when the instrument gives an audio null
in the vertical position after turning perpendicular to the direction in
alignment with the VLF field.
The field strength measurement defines the shape and the attitude of the
conductor by the strength of the field in the horizontal plane or the amplitude
of the major axisof the polarization ellipse. It is the minimum reading
obtained from the field strength meter when the instrument is rotated in the
horizontal plane, and is measured as a percent of the normal field strength
established at a base station. The field strength measurement has an accuracy
of plus or minus 2%.
The results included 40 line miles of traversing with lines at 100
meters apart and stations every 20 meters apart. Some readings were taken every
10 meters apart when anomalous zones were intersected. The results were plotted
at a scale of l inch to 100 meters. The dip angles were contoured at a scale
of l inch to 10 degrees and the field strength was contoured at a scale
of 10% above the normalized reading of 100.
The VLF electromagnetic survey was run between May 30 and June 7, 1989.
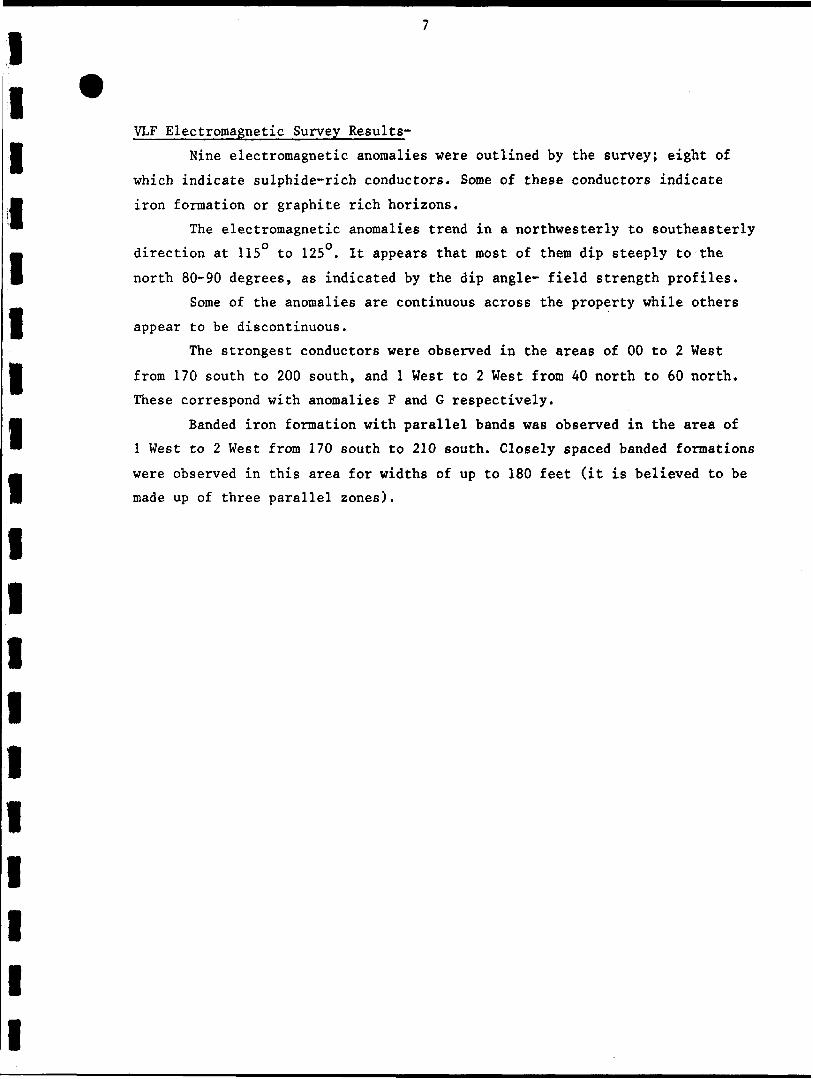
VLF Electromagnetic Survey Results-
Nine electromagnetic anomalies were outlined by the survey; eight of
which indicate sulphide-rich conductors. Some of these conductors indicate
iron formation or graphite rich horizons.
The electromagnetic anomalies trend in a northwesterly to southeasterly
direction at 115 to 125 . It appears that most of them dip steeply to the
north 80-90 degrees, as indicated by the dip angle- field strength profiles.
Some of the anomalies are continuous across the property while others
appear to be discontinuous.
The strongest conductors were observed in the areas of 00 to 2 West
from 170 south to 200 south, and l West to 2 West from 40 north to 60 north.
These correspond with anomalies F and G respectively.
Banded iron formation with parallel bands was observed in the area of
l West to 2 West from 170 south to 210 south. Closely spaced banded formations
were observed in this area for widths of up to 180 feet (it is believed to be
made up of three parallel zones).
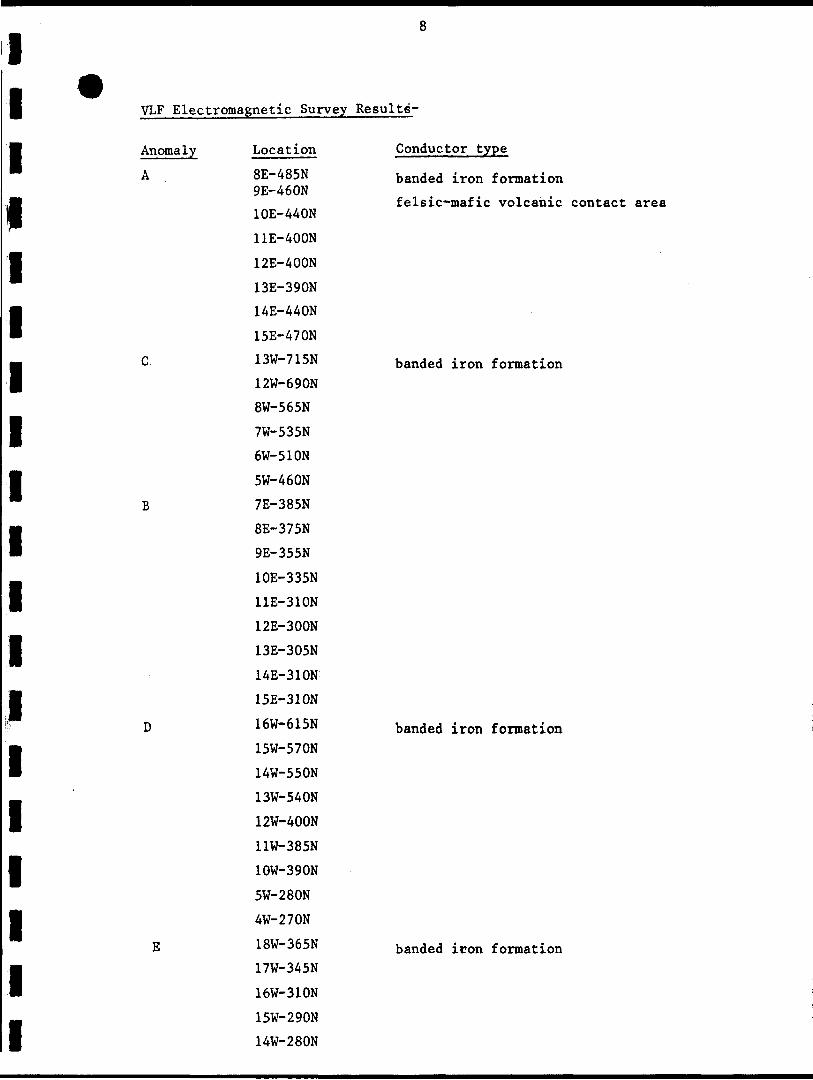
VLF Electromagnetic Survey Results-
Anomaly
A
Location
8E-485N 9E-460N
10E-440N
11E-400N
12E-400N
13E-390N
14E-440N
15E-470N
13W-715N
12W-690N
8W-565N
7W-535N
6W-510N
5W-460N
7E-385N
8E-375N
9E-355N
10E-335N
11E-310N
12E-300N
13E-305N
14E-310N
15E-310N
16W-615N
15W-570N
14W-550N
13W-540N
12W-400N
11W-385N
10W-390N
5W-280N
4W-270N
18W-365N
17W-345N
16W-310N
15W-290N
14W-280N
Conductor type
banded iron formation
felsic-mafic volcanic contact area
banded iron formation
banded iron formation
banded icon formation
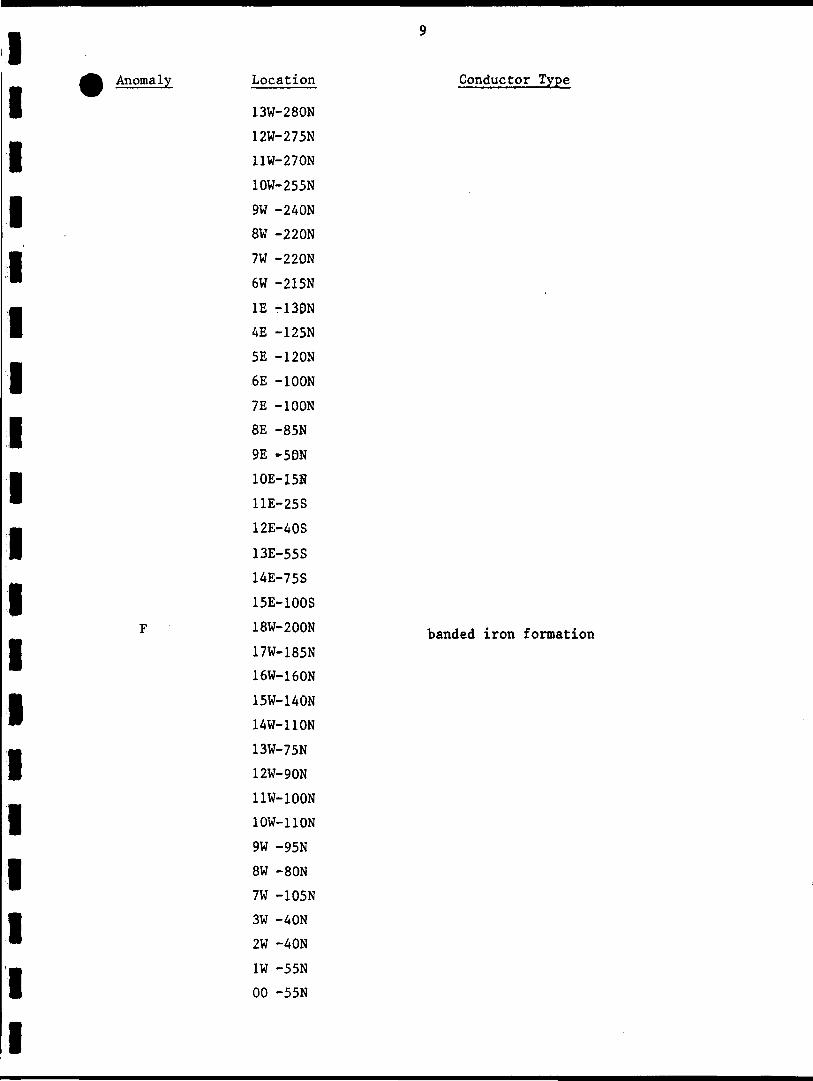
Anomaly Location
13W-280N
12W-275N
11W-270N
10W-255N
9W -240N
8W -220N
7W -220N
6W -21SN
IE -ISDN
4E -125N
5E -120N
6E -100N
7E -lDON
8E -85N
9E -SON
10E-158
11E-25S
12E-40S
13E-55S
14E-75S
15E-100S
18W-200N
17W-185N
16W-160N
15W-140N
14W-110N
13W-75N
12W-90N
11W-100N
10W-110N
9W -95N
8W -SON
7W -105N
3W -40N
2W -40N
1W -55N
00 -55N
Conductor Type
banded iron formation
10
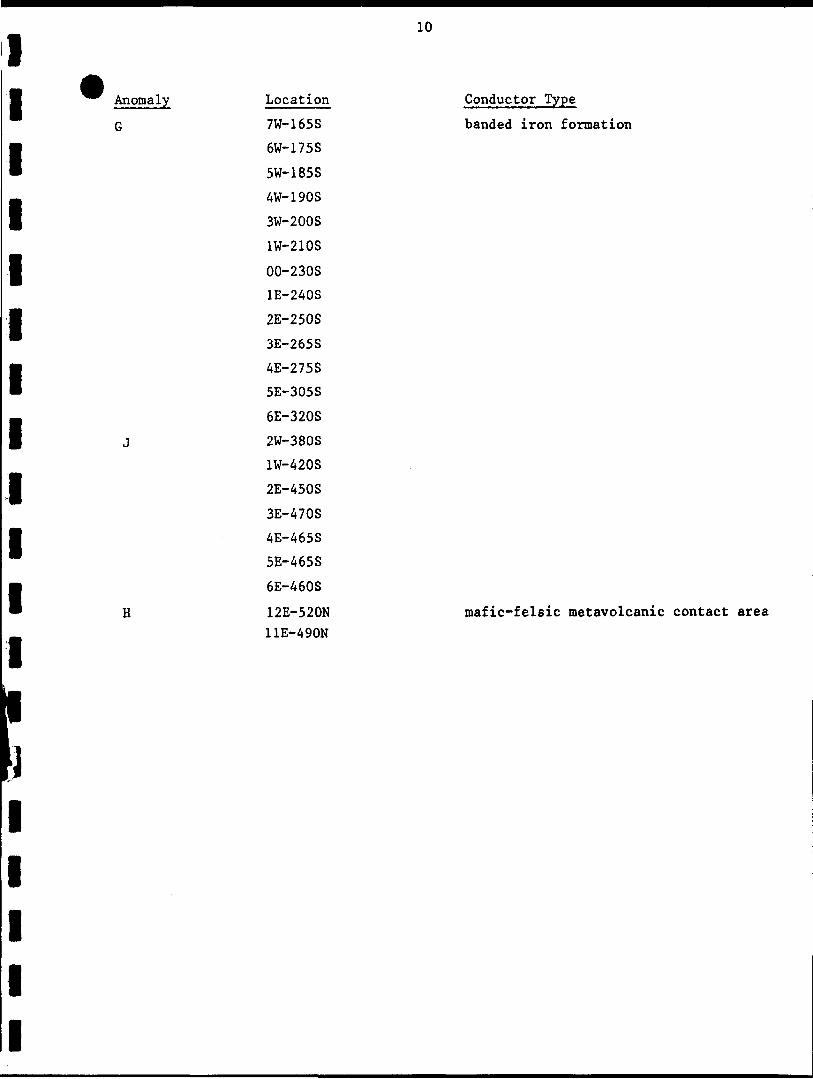
Anomaly
G
H
Location
7W-165S
6W-175S
5W-185S
AW-l90S
3W-200S
1W-210S
00-230S
1E-240S
2E-250S
3E-265S
4E-275S
5E-305S
6E-320S
2W-380S
1W-420S
2E-450S
3E-470S
4E-465S
5E-465S
6E-460S
12E-520N 11E-490N
Conductor Type
banded iron formation
mafic-felsic metavolcanic contact area
11
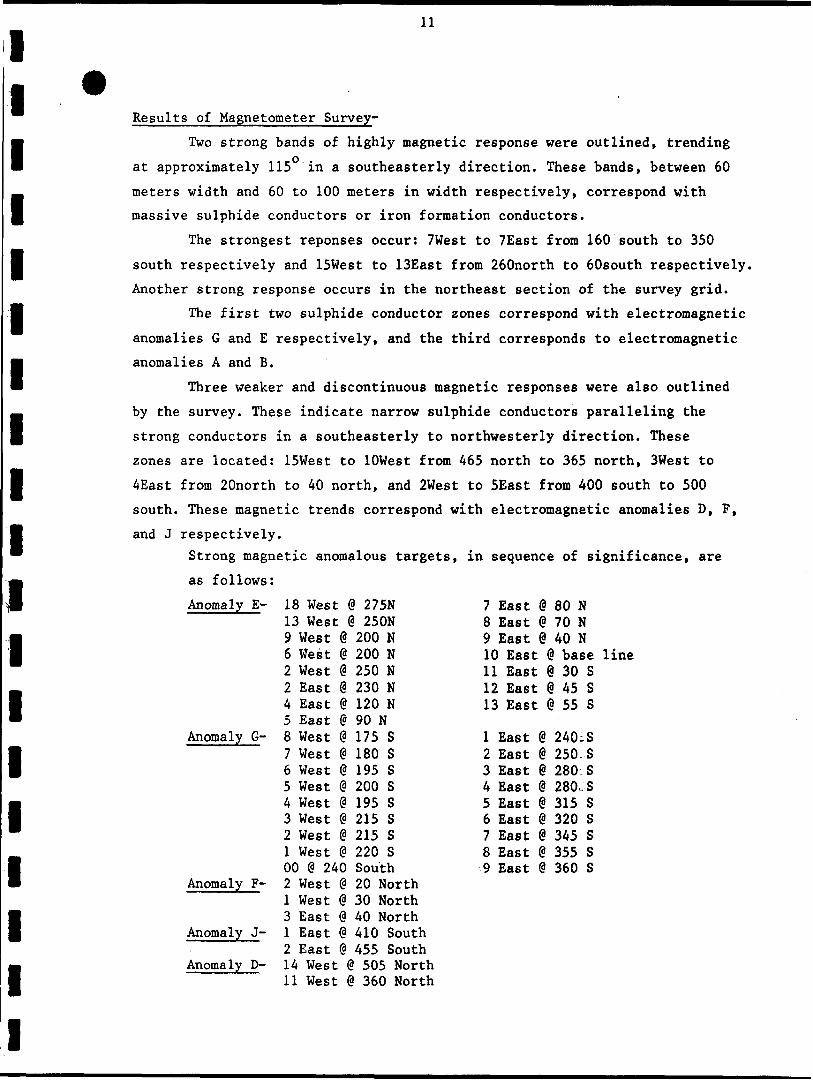
Results of Magnetometer Survey-
Two strong bands of highly magnetic response were outlined, trending
at approximately 115 in a southeasterly direction. These bands, between 60
meters width and 60 to 100 meters in width respectively, correspond with
massive sulphide conductors or iron formation conductors.
The strongest reponses occur: 7West to 7East from 160 south to 350
south respectively and ISWest to ISEast from 260north to 60south respectively.
Another strong response occurs in the northeast section of the survey grid.
The first two sulphide conductor zones correspond with electromagnetic
anomalies G and E respectively, and the third corresponds to electromagnetic
anomalies A and B.
Three weaker and discontinuous magnetic responses were also outlined
by the survey. These indicate narrow sulphide conductors paralleling the
strong conductors in a southeasterly to northwesterly direction. These
zones are located: ISWest to lOWest from 465 north to 365 north, 3West to
4East from 20north to 40 north, and 2West to SEast from 400 south to 500
south. These magnetic trends correspond with electromagnetic anomalies D, F,
and J respectively.
Strong magnetic anomalous targets, in sequence of significance, are
as follows:
Anomaly E-
Anomaly G-
Anomaly F-
Anomaly J-
Anomaly D-
18 West @ 275N 13 West @ 250N 9 West @ 200 N 6 West @ 200 N 2 West @ 250 N 2 East @ 230 N4 East @ 120 N5 East @ 90 N 8 West @ 175 S 7 West @ 180 S 6 West @ 195 S 5 West @ 200 S 4 West @ 195 S 3 West g 215 S 2 West @ 215 S1 West @ 220 S 00 @ 240 South2 West @ 20 NorthI West @ 30 North 3 East @ 40 North1 East @ 410 South2 East @ 455 South 14 West @ 505 NorthII West @ 360 North
7 East @ 80 N8 East @ 70 N9 East @ 40 N10 East @ base line11 East @ 30 S12 East @ 45 S13 East O 55 S
1 East @ 240-S2 East @ 250.S3 East @ 280 S4 East @ 280,S5 East @ 315 S6 East @ 320 S7 East @ 345 S8 East @ 355 S9 East @ 360 S
12
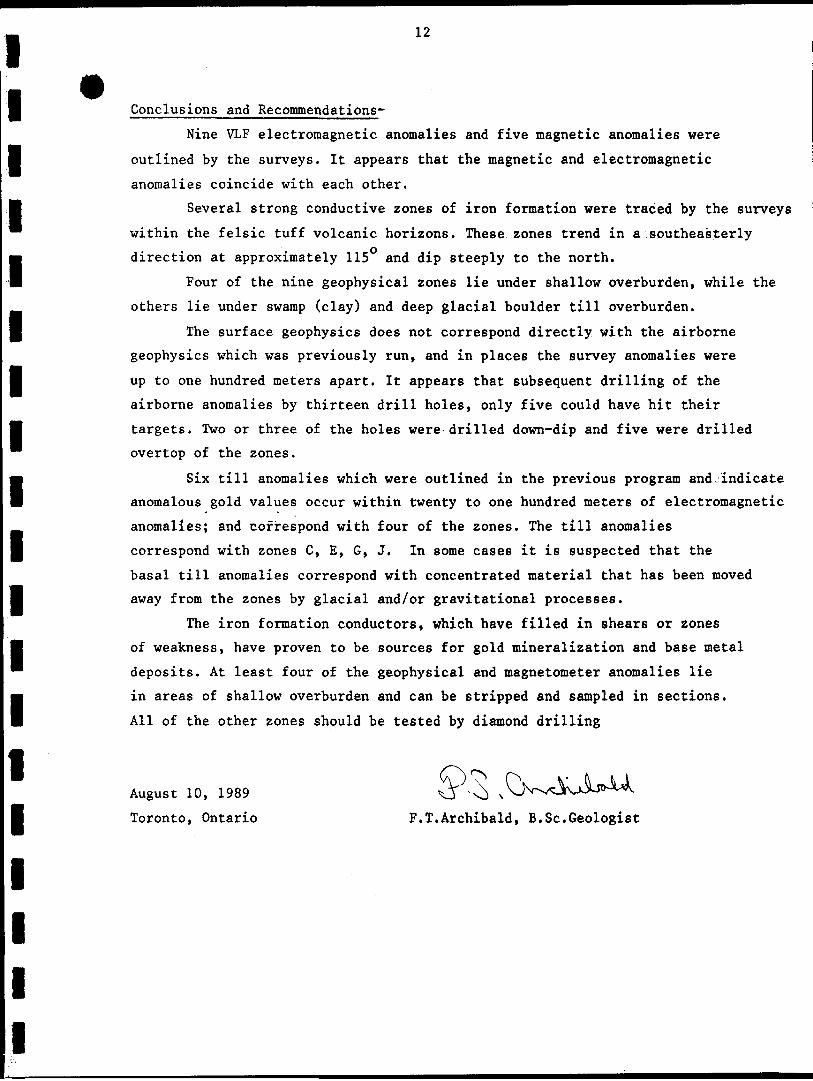
Conclusions and Recommendations-
Nine VLF electromagnetic anomalies and five magnetic anomalies were
outlined by the surveys. It appears that the magnetic and electromagnetic
anomalies coincide with each other.
Several strong conductive zones of iron formation were traced by the surveys
within the felsic tuff volcanic horizons. These zones trend in a southeasterly
direction at approximately 115O and dip steeply to the north.
Four of the nine geophysical zones lie under shallow overburden, while the
others lie under swamp (clay) and deep glacial boulder till overburden.
The surface geophysics does not correspond directly with the airborne
geophysics which was previously run, and in places the survey anomalies were
up to one hundred meters apart. It appears that subsequent drilling of the
airborne anomalies by thirteen drill holes, only five could have hit their
targets. Two or three of the holes were drilled down-dip and five were drilled
overtop of the zones.
Six till anomalies which were outlined in the previous program and indicate
anomalous gold values occur within twenty to one hundred meters of electromagnetic
anomalies; and correspond with four of the zones. The till anomalies
correspond with zones C, E, G, J. In some cases it is suspected that the
basal till anomalies correspond with concentrated material that has been moved
away from the zones by glacial and/or gravitational processes.
The iron formation conductors, which have filled in shears or zones
of weakness, have proven to be sources for gold mineralization and base metal
deposits. At least four of the geophysical and magnetometer anomalies lie
in areas of shallow overburden and can be stripped and sampled in sections.
All of the other zones should be tested by diamond drilling
August 10, 1989
Toronto, Ontario F.T.Archibald, B.Se.Geologist
C||i:WDr". MIKING RCDR Kirk.L
. Nortnefn Development end Mines
Ontario
4 VLF ELECTROMAGNETIC Abbotsford a Adair
KAVE RES011IRCES IKC.
9M0SM P. 02t Or prim, el fnlnifis r.Kiirra
•c* on thij form, *it*ch i lin, NOW' *- Uniy d*yi C'tdlif d'.tf'ttld ir ihs
M d .on msy Ut *ni*r*rt •o III* ' Ckp*nd. D*yt Ci." tvlu'ivii
M Oo nut ui
Suite 402- 27 QUEEN ST. EAST Toronto, ONT. M5C 2H6
F.T.Archibald Consulting Ltd.T 'tpO'O
..__... . .....J 0*Y I'fao. l Yt.
of
Addittl o( Author (6f
F.T..Arfthib6ld 702-^100 Adelaide St. Vest Toronto, Ontario H5H
.y i M((, J Vf.
Mil** of ;in* Cut
22.2
Creditt Requeued pet Each Claim in Columns tt right Mining Cla'tns Tfflverted tlin in numttice! sequence)
(excludes power ttrlppinp)
~0t*l ftombtr
't&octof work.
Tot*! Civs OfCiiU nuy be ipportEM*' iiumbir 01 o*yi C
in toW^til ti ripHt.
* Ci*. f-i' tUiol Itltclio ForOMice Use Only
Cenificatiop Vcfifying Report of Worki l taw c penon*! *nd inl'nute knowledge of the ftcti ut forth in the Rt port of Work tfiiened htieio, hiving p^rfo"*^ed toe i
Or wnocntd ism* during tncf/ot tlttr iti comptition and t^i* tnrtxtd 'tpo'l t trut tM6 ana Fottai AorK.T.Archibald 702-100 Adelaide St. Went Toronto, Ontario K5H 1S3
DtU Certified C*Mif**5 by VA\V fly A K
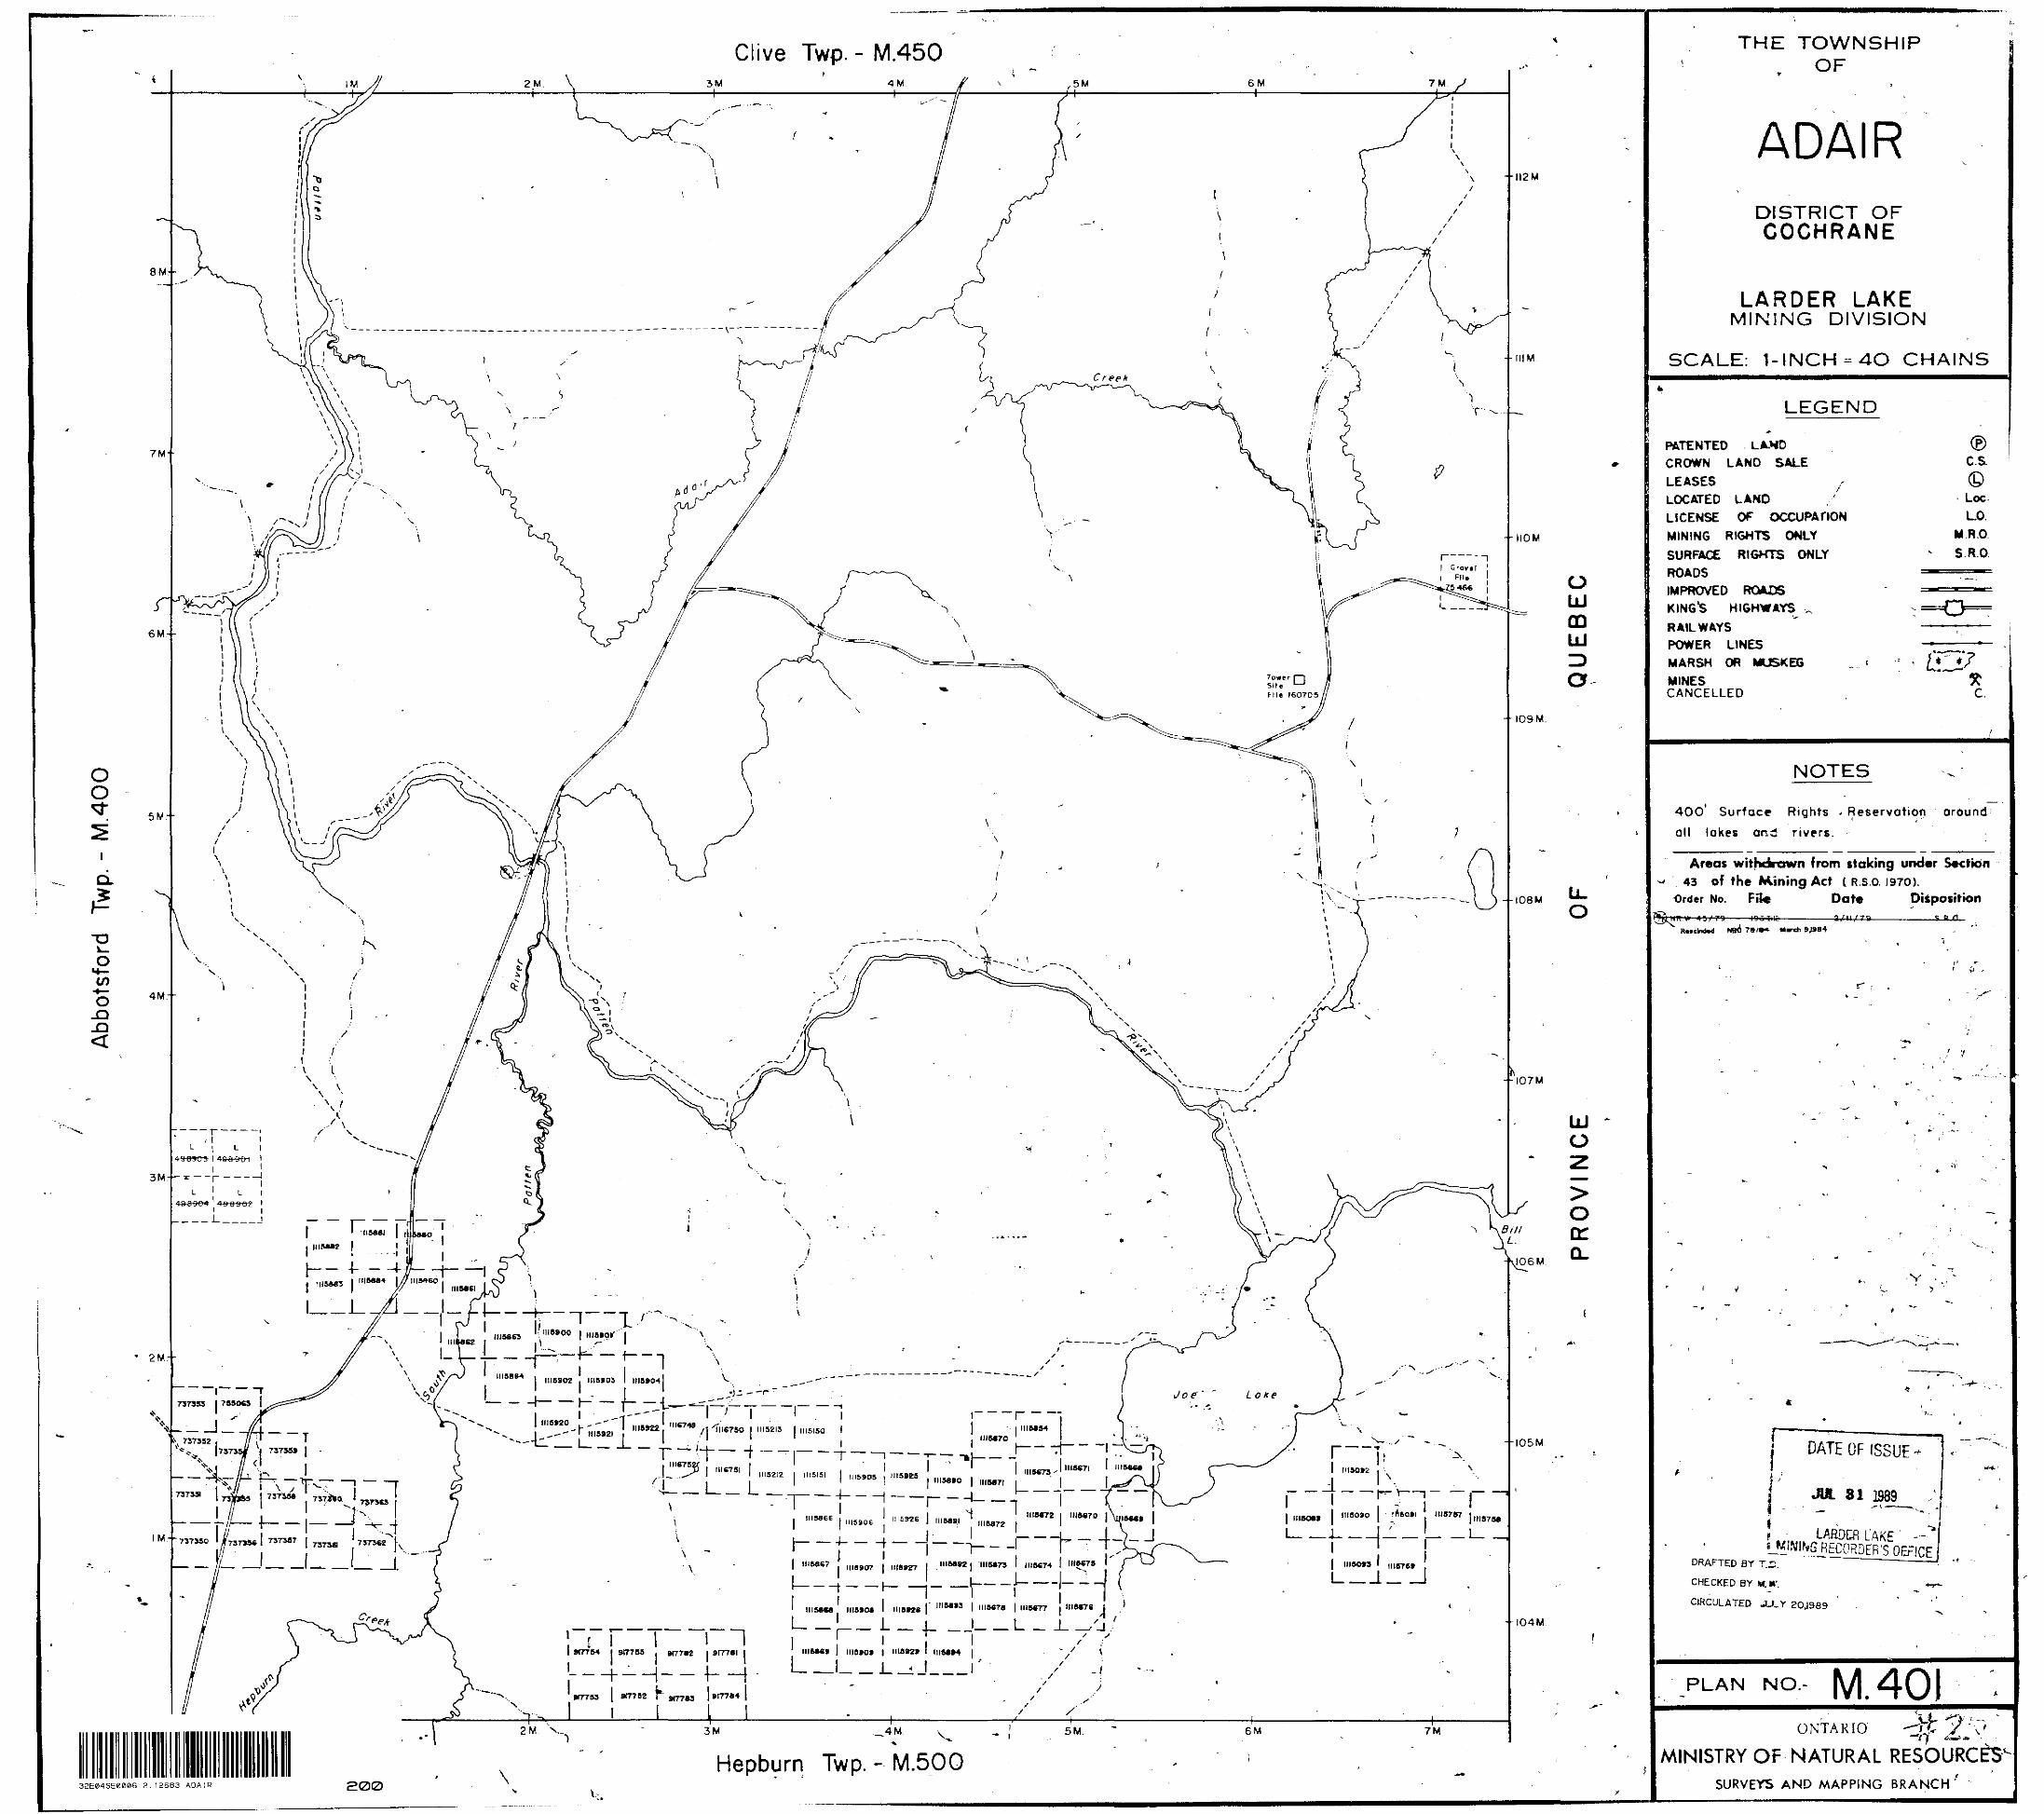
THE TOWNSHIPClive Twp. - M.450
ADAIRDISTRICT OFCOCHRANE
LARDER LAKEMINING DIVISION
SCALE: 1-INCH -4O CHAINS
LEGEND
PATENTED L AM)CROWN LAND SALE
LEASESLOCATED LANDLICENSE OF OCCUPAflON
MINING RIGHTS ONLY
SURFACE RIGKTS ONLY
ROADS
IMPROVED ROADSKING'S HIGHWAYS ^
RAILWAYS
POWER LINES
MARSH OR MUSKEG
NOTES
400 Surface Rights - Reservation around all lakes and rivers.
Areas withdrawn from staking under Section 43 of the Mining Act l R S O. 1970).
Order No. File Date Disposition
l—— 4- --I-
l______L -/J- j———
1115902 . 1113*05 l 1115*04
— t- - -L - ' — u- !" — " ~~~ DATE OF ISSUE
JW. 31 1389
-'| — -^ ^- — -- — --
___ I-—— - LAflDER LAKE ' —"*'S OEFICE
DRAFTED BY '
CHECKED BY MLW.
CIRCULATED JJLY 20,1989
L __ L- Jmate* |' 1I1M" l *"**n l '"**77 i IMMTI j
.J- - L . J. ' '
---h—i--Pf7753 W77S2 f
PLAN NO.- M. 401
ONTARIO
MINISTRY OF NATURAL RESOURCES"SURVEYS AND MAPPING BRANCH''
Hepburn Twp. - M.5003EE04SE0006 2.12683 ADAIR
UJo
uK UJto"-JUJu
^ ^i
D OGCQ tOz o
5 wT W
i? fX O
UJ
LU OD 2 ,.-
Q IUJ COail
5 S?CC Z) H- t/J
> uCC H
Q W
W S ^OJ CO (J
Z .j (j-J Q Z
55|-J D. 2
XgCCi El ?X -1< >S t
CC D
2 O
Oo
O U
O
o zO '
ff f^ og 3Z. u.
ffi
z -, o
o
-i Cf< oZ Tio w!r ccCC <O 5
D Z OsUJi/i H
LO
- CC
s c o m c 3o<
oQC OLL.O
00oa.00
o zgLO
— x
l- ' 'C3 y' ' CC ^ >
g O 7
Z
y o
5 ?^ w
* - *-l 4* iy
o ^ inK ^ Q'
Hi uj rtH I-
U
o o
O O OO(M
- O)- LU
< -J> -^cr u.1
g Q tny cc LU-j O cc u to
Q sVWH^^B ^^
O s
xSO
CO
Om QQ
P UJ5 ^QC * <
B ujs 3a: Z —i o: ^ o:o Q: Q LU* X CD Qoc o f o:* o * <s o s -j
z oo> o
to
LU2
o
a. o
*4— Q)O Q (A
O)
c -oi z gM- Mo o*^- ^W D OC -d O)•^ fC Q)S 2 QC
O
CO
ro iCD
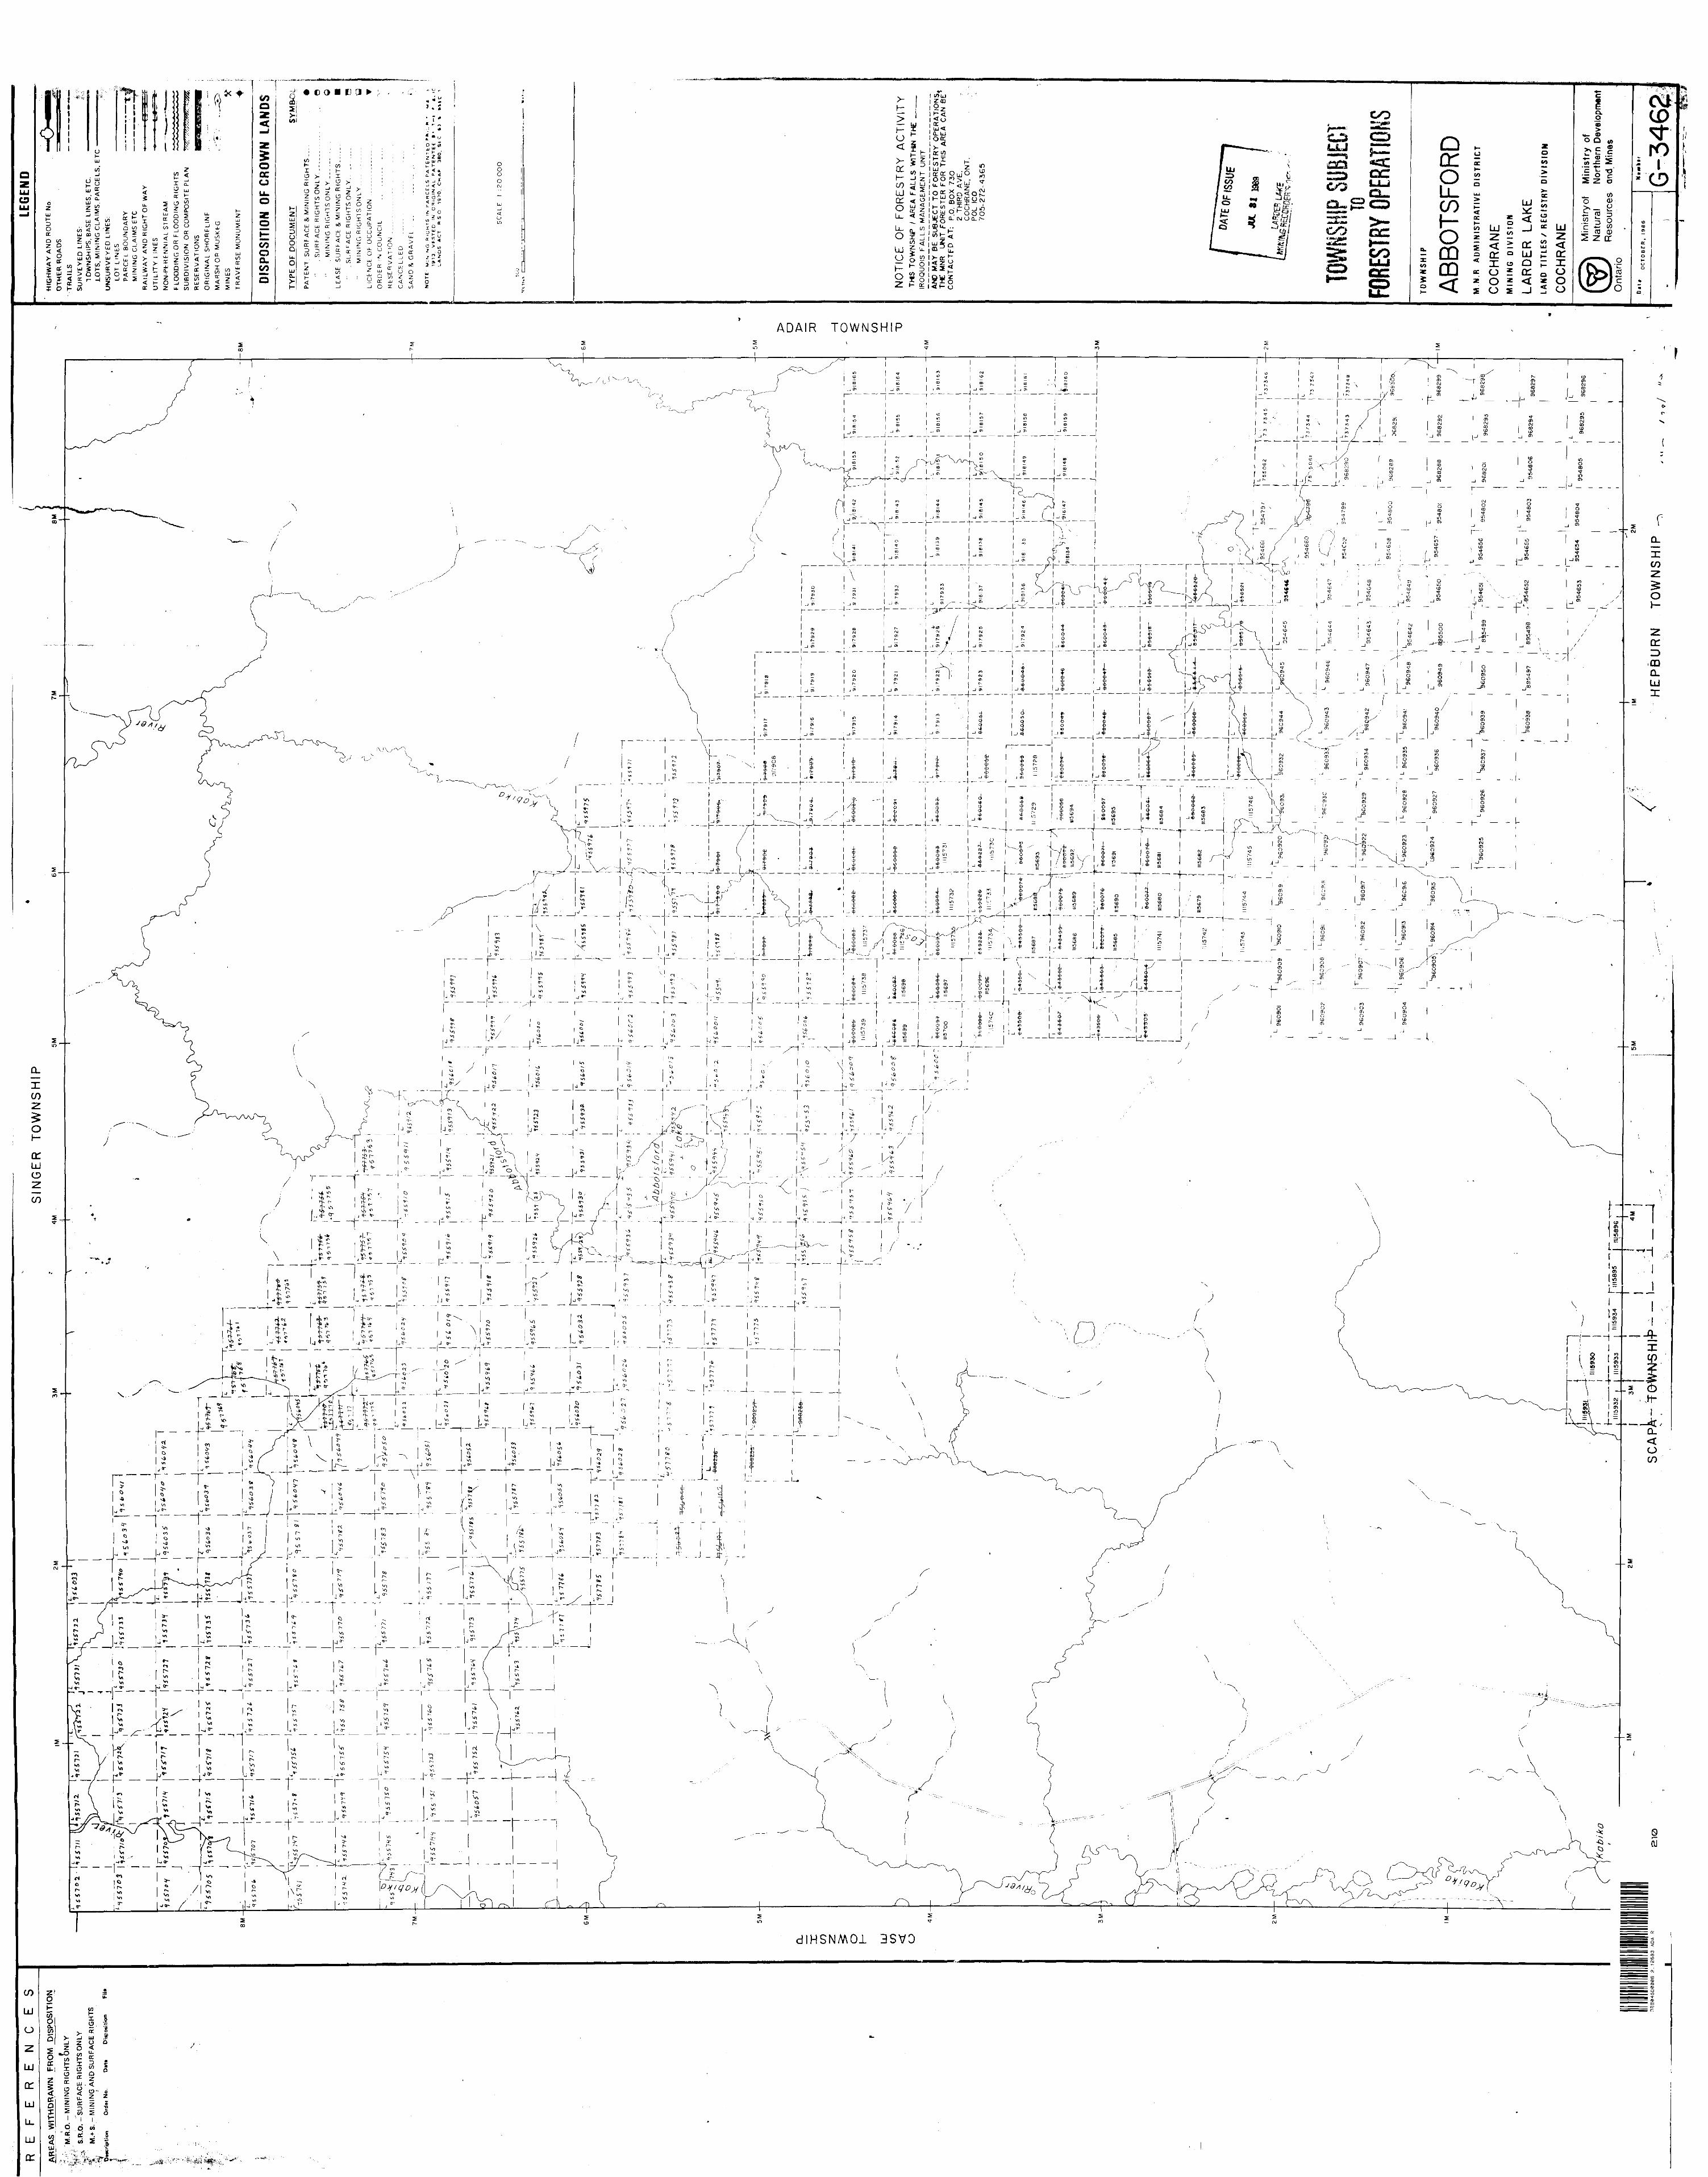
ADAIR TOWNSHIP
dlHSNMOl 3SVO
CO
Ul
ozUl
o: utUL
LU
o:
zoEoo.enQ5OCC u.
'HDRAWN
i—5(A^rUJ CC
-J2
LO1-TO
MINING RI
ld
" CC
5
-j2OCO
x o
SURFACE F
' l
dcc w
'*' 1 itf 1*' '*
CO
I a.
UJoUL CC D WoMINING AN
1w•t- 2
^*
mU"
J
ia
m O
ciZ5 •oO
g
S^,, •w*
LOCATION MAP
RAVE RESOURCES INC.
ABBOTSFORD-ADAIR TWSP ; O W T.
MAGNETOMETER READINGS
PLATE 5fv -f
F.T. ARCHIBALD CONSULTING LTD. JUNE 1989
CU
LiJ
Q.
-J
tiQ
O ^i.
H
V] O)K
a; > co
0
c:
o
D
O
O/"
0
0
c C
c o "en
Q
enc
CO
o
q d <
t:3ok^Q
CO CTl
o;
m
O Oo
D O 00
o o r-
oCO
oD OJ
o to
o a ro
oCO
o o
oCO
o o
oCO
o oCO
O CO
o o r-
ID O CO
O O CO
!Sb3 OOSI
19b3 OOfrT 19b3 OOM
1SH3'OQE1 ' ooei
19b3 0021
19b3 006
1SU3 009
19ti3 DOS
01?
ooe
193M 001
193M 002
i \ 1SH3 00111SH3 OOII
1SH3 0001!Sb3 0001
1SU3 006 \
JSb3 009
\ 1SH3 009ISb3 009
!Sb3 OOS
ISdfl OOG
19b3 OOZ
19H3 00JSb3 001
^ "1S3M 005193M DOS
1S3M 009 193M 009
193M 009 IS3M 008
193M 006 \ 193M 006
193M 0001 \ 1S3M 0001
193M OOU 193M oon
193M 0021 1S3M 0021
193M OOei v 1S3M ooei
1S3M OOtl 1S3M OOtl
193M 0091 \
I93M 0091
1S3M OQM
193H 0091 \" 193M 0091
1S3M 0061
193M OOOZ
193M OOIZ
193M OOIZ
193M 009
1S3M 0061
193M 0002
oCO
o oCO
oCO
o o r-
oCO
o oCO
0 CO 01
PLATE
LOCATtON MAPSCALE
V S\A.O. *'' \\ ''
x .\ ^y
^7V\ . —— T^-'7 Ni ^
\ A "- , iV\ /\ 7''-'v 7 V- \ V \* A V
. \ /,\ \ V
CROSSOVER ANOMALY
\. POSITIVE
NEGATIVE
CONTOUR l INCH TO 20 DEGREES
STATION CUTLER , MAINE
FREQUENCY 24.0 Khz
*3 " ^ h '-i 4 i. /^ * J ^'
SCALE METERS
100 200 300 400
RAVE RESOURCES INC
ABBOTSFORD-ADABR TWSP ; ONT.
F.T. ARCHIBALD CONSULTING LTD. JUNE 1989
PLATE
737359
RAVE RESOURCES INC.
ABBOTSFORD-ADAIR TWSP ; OIMT.
VLF ELECTROMAGNETIC FIELD STRENGTH READINGS
PLATE 3
F.T. ARCHIBALD CONSULTING LTD. JUNE 1969
UJ
CL
^ oSK
H
tlflc
uQJ
CD
00o.o,
CDo
LJ
o
QJJU
Dl-Ci
CD
^J-
01 o
a a ^
ctD
OoCD
z:
cc o
CD O LO
ct:o
oCD •ct
*
men o
^ro ro
k^cr: o
o CD CNJ
z: h- ct: CD
\ \ o\0V\
COexCD
OCO
oo
oCO
o oC\J
ID O
O O CO
Oeno o
oCO
o o in
oCO
o oCD
O CO
o o
ID O CO
CD O03
19b3 !Sb3 OOSl
19b3 !Sb3 OOfl
ooei
19b3 OOZI
15b3 006
1SU3 008
19b3 OOEI
19b3 OOZI
19b3 001119b3 001 l \
19b3 0001
1SU3 006 \
19b3 008
!Sb3 DO/.
19U3 0091SH3 009
Sb3 DOS \
193M OOfr
193M 005 I93M DOS
\ \\
\ 1S3M 009 1S3M 009
\ 193M
1S3M 008 193M 009
^ r A A193M 006 193M 006l————l————Hrr-4———tt——t-l——l————H——rt————l————l——\H
193M 000 IS3M 0001
1S3M 0011 1S3M 0011
IS3M OOZI 1S3M OOZI
193H OOEI 1S3M OOEI
1S3M 00V
1S3M 009,1 \ 1S3M OOSI
1S3M 0091 \ \ 1S3M 0091
193M OOM
" V " "T " "193M 0081 193H 0081
193M 0061 \
1S3M OOOZ
1S3M 0061
193M OOOZ0 tD (U
1S3M 0012
1S3M 0012
32\—o:o~z.
oor-
z:i—CdD^L
OOCD
JZf—cc:D^.
OOLD
z:h-Q±O^i
OO•"d-
\ \\
JZ \1- \01 \? ^~V"ooro
z:t—ct ^- ^(P-
•''Z.
ooCsJ
^ ^- z:
^- i —ct:o~z.
DO— *
^'^
UJ~Z-\ — 1—1UJCOcrCD
1C1—HDOCO
oo— '
z:h-rDoCO
ooCNJ
z:i—IDOCO
Oom
z:i—Z3•OOD
. - oa•^j-
T:t—Z3OCO
ooin
z:i—IDOen
ooCD
DZ1—IDOCO
OOr-
z:H-moCO
ooOD