magneto-thermally activated spin-state transition in la · magneto-thermally activated spin-state...
TRANSCRIPT

1
2
Magneto-thermally Activated Spin-state Transition in La0.95Ca0.05CoO3:
Magnetically-tunable Dipolar Glass and Giant Magneto-electricity
Suchita Pandey, Jitender Kumar#, and A.M. Awasthi
*
Thermodynamics Laboratory, UGC-DAE Consortium for Scientific Research,
University Campus, Khandwa Road, Indore- 452 001 (India)
ABSTRACT
Magneto-dielectric spectroscopy of La0.95Ca0.05CoO3 covering the crossover of spin states reveals
strong coupling of its spin and dipolar degrees of freedom. Signature of spin-state transition at 30K
clearly manifests in the magnetization data at 1Tesla optimal field. Our Co L3,2-edge X-ray absorption
spectrum on the doped-specimen is consistent with its suppressed low-to-intermediate spin-state
transition temperature-- ~30K vis-à-vis ~150K documented on the pure LaCoO3. Dispersive
activation-step in dielectric constant ~)(TΔ O(102) with associated relaxation-peak in imaginary
permittivity )(T characterize the allied influence of coexistent spin-states on the dielectric character.
Dipolar relaxation in the low-spin regime below the transition temperature is partly segmental (Vogel-
Fulcher-Tamman (VFT) kinetics) and features magnetic-field tunability, whereas in the
low/intermediate-spin disordered state above, it is uncorrelated (Arrhenic kinetics) and almost
impervious to the magnetic field H. Kinetics-switchover defines the dipolar-glass transition
temperature Tg(H) (=27K|0T), below which their magneto-thermally-activated cooperative relaxations
freeze-out by the VFT temperature T0(H) (=15K|0T). Applied magnetic field facilitates thermal-
activation in toggling the low-spins up into the intermediate-states. Consequently, the downsized
dipolar-glass segments in the low-spin state and independent dipoles in the intermediate state exhibit
accelerated dynamics. Critical 5Tesla field collapses the entire relaxation-kinetics onto a single
Arrhenic behaviour, signaling that the dipolar-glass is completely devitrified under all higher fields.
Magneto-electricity (ME) spanning sizeable thermo-spectral range registers diverse signatures here in
the kinetic, spectral, and field behaviors, in contrast to the static/perturbative ME observed close to
the spin-ordering in typical multiferroics. Intrinsic magneto-dielectricity (50%) along with vanishing
magneto-loss is obtained at (27K/50kHz)9T. Sub-linear deviant and field-hysteretic split seen in
)(, HT above 4Tesla suggests the emergence of robust dipoles organized into nano-clusters, induced
by the internally-generated high magneto-electric field. An elaborate ω-T multi-dispersions diagram
maps the rich variety of phase/response patterns, revealing highly-interacting magnetic and electric
moments in the system.
Keywords: Spin State Transition, Magneto-thermal Activation, Dielectric Relaxation, Dipolar Glass,
Magneto-electricity, X-ray Absorption Spectroscopy.
* Corresponding Author e-mail: [email protected]. Tel: +91 731 2463913.
# Present Address: Indian Institute of Science Education and Research, Homi Bhabha Road, Pashan, Pune- 411 008 (India).
3
Introduction
Multiferroics (MF) as functional materials offer loss-free and fast cross-control of quad-state
spintronics configurations via coupled electrical and magnetic order-parameters [1]. A most favorable
situation is realized in the magneto-electric (ME) materials where two different ferroic states e.g.,
ferro/antiferroelectric and ferro/antiferromagnetic, coexist [2]. Besides the much desirable yet scarce
linear ME coupling in the MF’s featuring magnetic/electrical ordering (type-I&II multiferroics), there
is ample scope for magneto-dielectricity (MD) in materials having quench-disordered or vitreous spin
and/or polar degrees of freedom (“type-III” multiferroics or “multiglasses”). For example, in
Sr0.98Mn0.02TiO3 [3] and K0.97Mn0.03TaO3 [4], appreciable MD coupling exists between their polar and
spin glass attributes, CuCr1/2V1/2O2 is magnetic and dipolar glass [5] with different freezing
temperatures for magnetic and electrical moments, partially-disordered double-perovskite La2NiMnO6
[6] exhibits large room temperature MD (8-20%) across its wide polar glass regime, and MD comes
from spin-reorientation in La1/2Sr1/2NiO4 [7]. Substantial non-linear ME has been obtained in the
antiferromagnetic dipole glass CuCr1-xInxP2S6 [8] and the spin-glass PbFe1/2Nb1/2O3 [9]. In a recent
study [10], magneto-electricity was found to manifest an emergent quantum paraelectric glass (QPG)
state in SrCu3Ti4O12.
Rare-earth LaCoO3 (LCO) has been vigorously investigated [11] for its thermally-activated spin-
state transition (SST). In the cobaltate family, disorder-broadened crossover proceeds with increasing
temperature from the low-spin (1A1,
0
g
6
g2 et ; S =0) state through the intermediate-spin (3T1,
1
g
5
g2 et ; S =1)
to the high-spin (5T2,
2
g
4
g2 et ; S =2) state [12]; LS→(LS-IS)→IS→(IS-HS) [13]. The 1
g
5
g2 et configuration
gives higher dielectric constant probably due to a Jahn-Teller (JT) lattice distortion in the IS state;
though recent local-distortion studies have challenged this as the cause in LaCoO3 [13, 14]. Magnetic
and other measurements determined the low-spin (LS) to intermediate-spin (IS) transition in LaCoO3
around 150K [11]. SST also occurs in other cobaltates such as Pr1/2Ca1/2CoO3 [15] and GdBaCo2O5
[16]. LCO exhibits trigonal symmetry with space group R3 c, and small monoclinic distortion due to
orbital ordering [3]. Dispersive permittivity in LaCoO3 [17] is understood as resulting from the
nanoscale coexistence of monoclinic IS and rhombohedral LS phases [18]. The latter is evident in the
bi-splitting of the La-O vibrational-mode degeneracy above 120K [17, 19], attributed to local
symmetry-lowering that accompanies the LS→(LS-IS) transition. As with antiferroelectric &
ferroelectric domains in relaxors, phase coexistence in cobaltates with Co-ions in different electronic
structures is responsible for quantitative similarity of their dielectric dispersions.
Schmidt et. al. [20] reported magneto-dielectricity in the rare-earth cobaltates across magnetic
spin-polaron defect region, which indicated the presence of spin-dipole coupling. Beside these, hole-
doped (La-site) cobaltates show unusual behaviour vis-à-vis pure LCO. In La1-xAxCoO3, divalent
cation A2+
(such as Sr2+
and Ca2+
) generates extra charge state of Cobalt (Co+4
) with prominent
effects; at lower concentrations of Sr the system is disordered and shows spin-glass behaviour (below
4
x = 0.18). With further doping, the system becomes optimally ferromagnetic by x =0.5 (equal
concentrations of Co+3
and Co+4
cations), which facilitates double exchange in the system [21]. We
have mildly replaced La in LaCoO3 by (5%) Ca (hereafter called LCCO5); prospecting that with
reduced SST temperature, dipolar (spin) interactions may realize quench-disordered/multiglass
system, and exhibit appreciable magneto-dielectricity over wide thermo-spectral window. That Ca-
doped La0.95Ca0.05CoO3 undergoes the spin-state transition at a lower temperature vis-à-vis pure
LaCoO3 is confirmed by the magnetization results, supported via our Cobalt L-edge XAS spectra, and
consequential to the electrical transport. Our magneto-dielectric measurements on LCCO5 reveal that
the coupled electrical/spin state is altered upon Ca-doping, and huge intrinsic MD effects are obtained
under the application of up to 9T field. Permittivity spectra are carefully analyzed to separate the low-
frequency extrinsic/conductive (Maxwell-Wagner/free-charge) and high-frequency
intrinsic/relaxational (dielectric-dipolar) responses. Genuine magneto-dielectricity is identified within
intrinsic regime, uncorrelated to the magneto-conductive part, over particulate thermo-spectral band.
Experimental
Ceramic La0.95Ca0.05CoO3 sample was prepared by standard solid state reaction method using high-
purity (99.99%) powders of La2O3, CaCO3, and Co3O4. As most of the rare-earth oxides absorb
atmospheric moisture, La2O3 was preheated at 1000°C for 6hrs. All the powders were mixed in
stoichiometric ratio, ground and calcined at 1000°C and 1100°C for 24hrs, and then pressed into disc-
shaped 2.5 mm thick pellets of diameter 10 mm. The pelletized samples were sintered at 1200°C for
20hrs and silver-coated for good electrical contacts for dielectric measurements. XRD
characterization of the sample was done with Bruker D8 Advanced Diffractometer using Cu-Kα
radiation. It was found that the desired compound formed in single phase with no detectable
secondary phase, and the diffraction pattern could be indexed purely with the trigonal space group
R3 c perovskite-like crystal structure. Magnetization measurements were done on VSM-SQUID
(Quantum Design) up to 7 Tesla. Room temperature soft X-ray absorption spectroscopy (XAS) was
performed across Co L3,2 edges in LCCO5 at beamline BL-01, Indus-2 (RRCAT, Indore Synchrotron
Source) in total electron yield (TEY) mode. Base-pressure in the XAS chamber during the
measurements was ~ 10-10
mbar and energy-resolution at Cobalt L-edge energy was ~ 300 meV.
Broadband permittivity spectra were collected with 1V ac-excitation, using NOVO-CONTROL
(Alpha-A) High Performance Frequency Analyzer. Magneto-dielectric characterization (up to 9 Tesla)
was done using an Oxford NanoScience Integra System Magnet-Cryostat along with the Novo-
Control Analyzer.
Results and Discussion
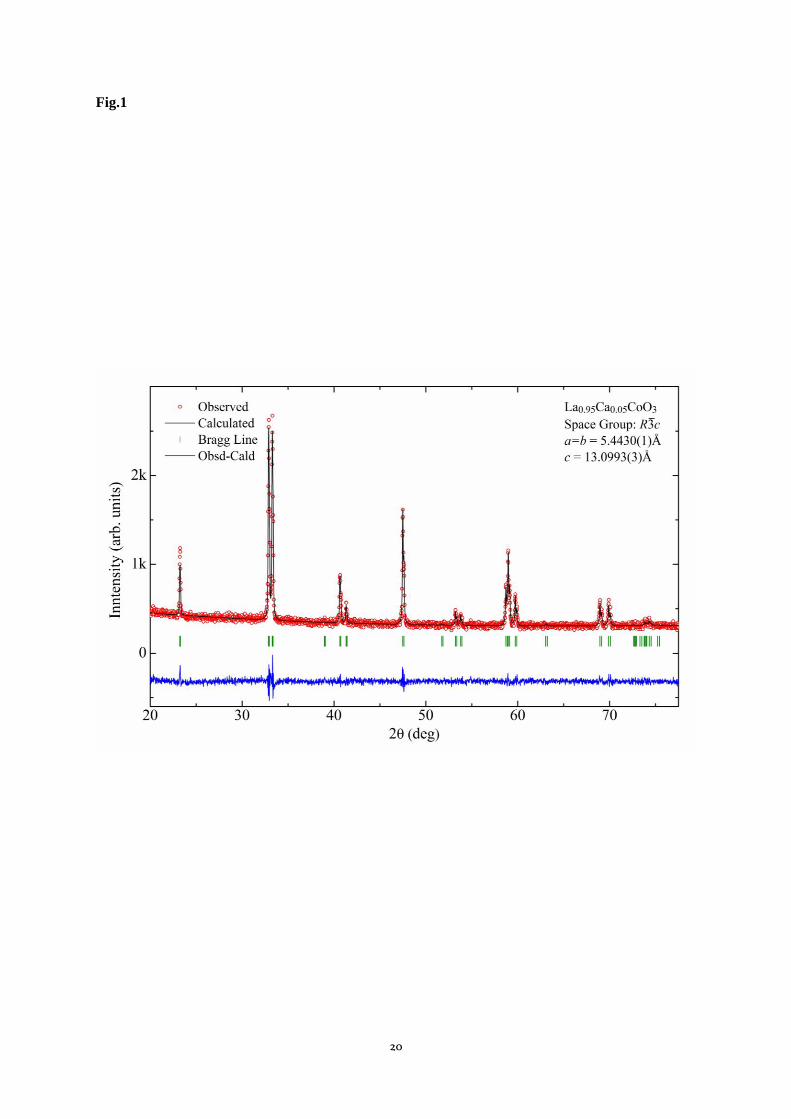
Figure 1 shows the room temperature XRD pattern of our La0.95Ca0.05CoO3 sample, collected using
Cu-Kα radiation ( = 1.5405Å). Within the sensitivity limit of Brucker D8 XRD set up, no extra peaks
have been observed. All the observed reflections can be very well indexed within the trigonal space
5
group R3 c, similar to the parent LaCoO3. In order to accurately determine the lattice parameters as
well as to confirm the designated space group, XRD pattern has been fitted using LeBail peak profile
program (Full-Prof software, profile matching with constant scale factor) and the goodness of fit (χ2)
was 1.52. The lattice parameters are obtained as: a, b = 5.4430(1)Å, and c = 13.0993(3)Å.
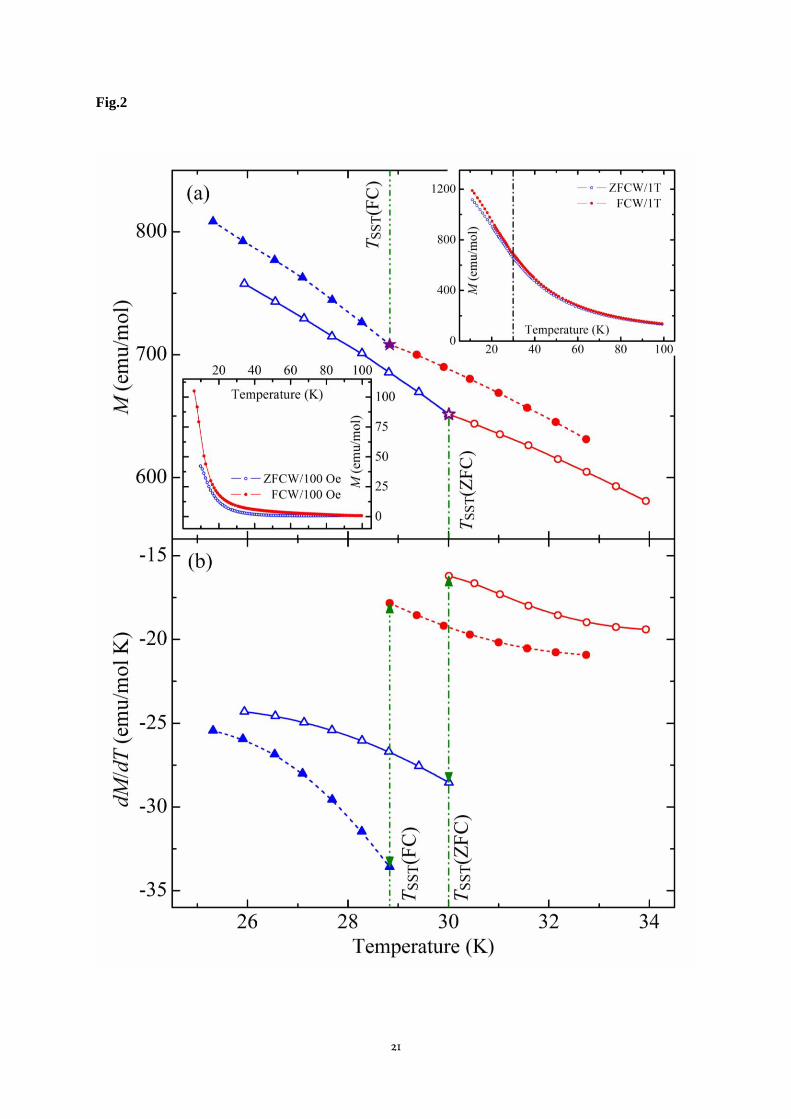
Magnetization versus temperature and field is shown in figs.2 and 3 respectively. Splitting of
zero-field cooled warming (ZFCW) and field-cooled warming (FCW) M(T) data (fig.2a insets)
indicates some magnetic-ordering at ~90K. In addition, clear slope-discontinuity (with shallow notch)
at 30K (ZFCW) and ~29K (FCW) is well discerned in the M-T data at 1T. This anomaly signifying
the spin state transition (SST) vanishes at higher (7T) and lower fields, and is completely washed out
at 100 Oe (lower inset, fig.2a). The particulate SST signature can be understood as follows. The low-
spin (LS) to intermediate-spin (IS) transition on warming involves increase in both the magnetic
moment (μ) and the energy-split (Δ ~ μH) between its up/down configurations under the applied field.
As regards the sample magnetization M(T), these increases mutually compete/oppose across TSST;
increased-Δ wins first to slightly reduce )( SST
TM then increased μ slightly raises )( SST
TM , versus an
otherwise-smoother nominal M(TSST). Finally, increased μ gives a higher and increased Δ gives a less-
steeper M(T > TSST) baseline, vis-à-vis that extrapolated from M(T < TSST). Figure 2b shows the
discontinuous slopes (dM/dT) in ZFCW and FCW M(T) data taken at 1Tesla field, with appreciable
jumps at TSST and
SSTSST TTdTdMdTdM as noted above. Evidently, considerations of relative
changes in μ, Δ, and M across TSST determine the observability here of the sharp TSST-anomaly at
1Tesla optimal field. Note that the TSST-anomaly is more pronounced in the field-cooled (FCW) data.
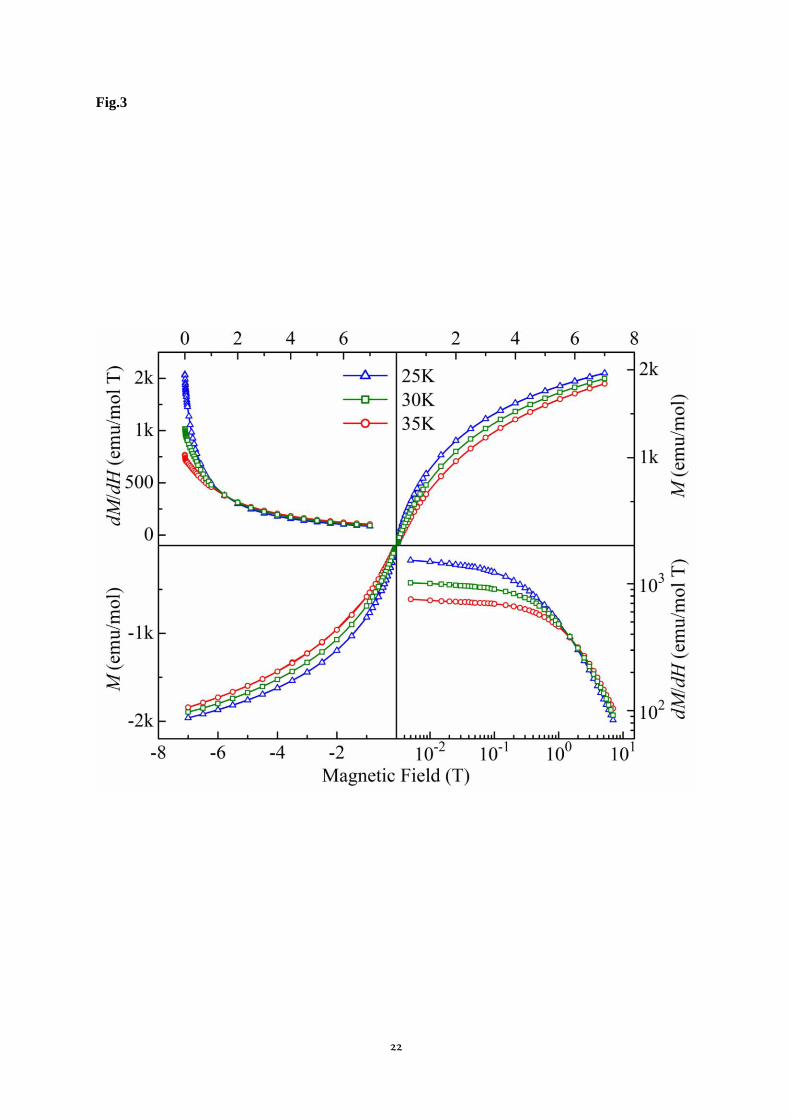
Figure 3 shows the M(H) data taken at 25, 30, and 35K. At 25K, the low-field/linear regime is
presumably due to the LS-rich state; the local-susceptibility (dM/dH) points to the onset of
nonlinearity at approx. 400 Oe and eventually displays power-law behaviour in H from 4T onwards
(fig.3 lower-right panel). The mostly IS-rich state at 35K (having larger μ and Δ) understandably
enters non-linearity at a higher field (~ 0.1T), with (dM/dH) following power-law in H beyond 3Tesla.
A wider crossover field-span (4T/400 Oe =100) for 25K data (despite lower temperature) versus that
for 35K (3T/0.1T=30) evidences LS→IS conversions at 25K stretching the otherwise Brillouin field-
window. Convergence of 25 & 30K local-susceptibility with that at 35K beyond 1.5Tesla (upper-
left/lower-right panels) signals the establishment of robust IS state, complementing the TSST-anomaly
seen at 30K in M(T)|1T, besides explaining its absence in M(T) at lower and higher fields.
Soft X-ray absorption spectroscopy is an ideal tool to investigate the valence states and
phenomena like spin state transitions (SST) by measuring the strength of core shell electrons’
transition to the unoccupied states (absorption phenomenon). XAS studies at Cobalt L3,2-edges probe
the vacancies in partially-filled 3d levels via the electronic transitions into them from spin-orbit split
2p3/2 and 2p1/2 levels, termed as L3 and L2 edges, respectively. Here, relative populations in t2g and eg
sub-bands of 3d levels varies with the Co spin-state (LS:0
g
6
g2 et , S=0; IS:1
g
5
g2 et , S=1; HS:2
g
4
g2 et , S=2)
6
and consequently, peak-profiles of L-edges reflect its variation. It is to be mentioned that in several of
hole-doping (as large as up to 30%) studies in LaCoO3, absence of edge-shift signatures rules out Co3+
valence states’ variation [22]; so our analysis of peak-profile is focused to highlight/estimate the spin
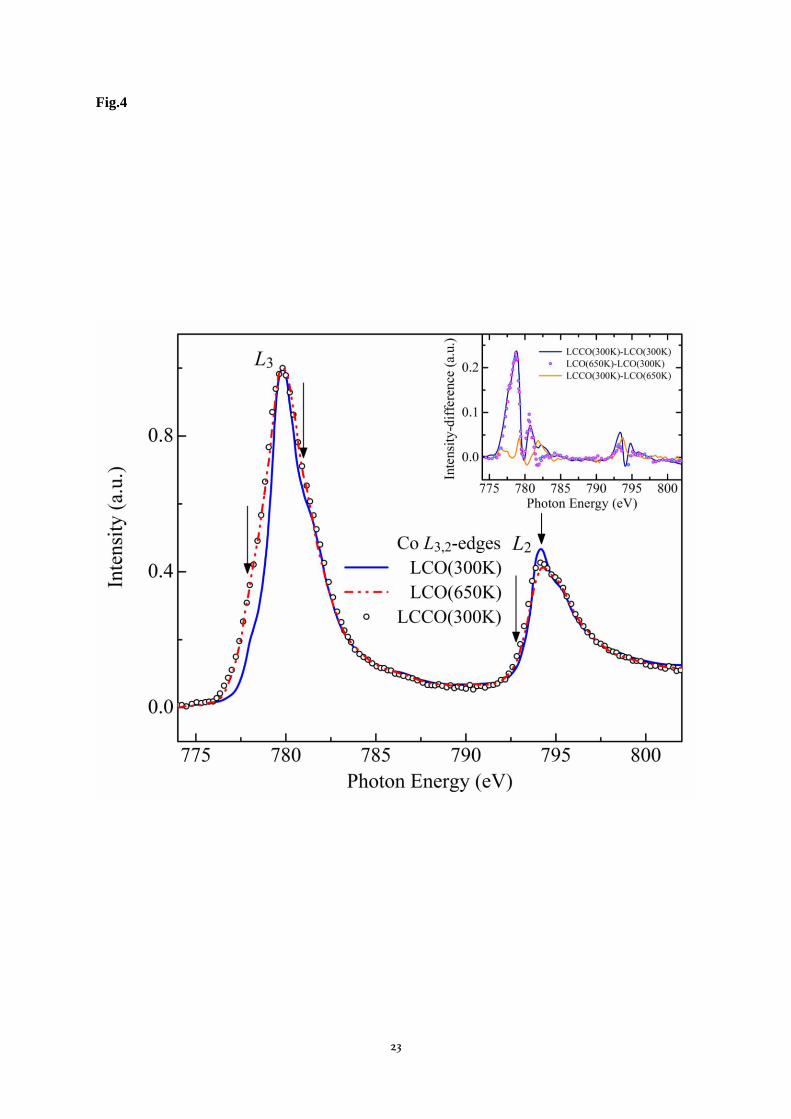
states in LCCO5. In fig.4 we have plotted our room temperature XAS at Cobalt L-edges in LCCO5
along with the same in pure LaCoO3 by Haverkort et. al. [23], by matching their white-line peaks.
Excellent agreement in pre-edge and post-edge lines of these normalized spectra clearly shows that a
one-to-one correlation of the features in these spectra can be made, which is not resolution-limited.
Features marked with arrows in our spectra represent the broadening/extra-intensity, reflecting
increased vacancy in t2g sub-bands, and consequently a higher fraction of the HS-state at room
temperature in the Ca-doped vs. the pure specimen. Further, our room temperature XAS resembles
much more with that of the pure LaCoO3 at 650K [23]. Notably, under-the-peaks area-differences are
found as ~10.7% (LCCO5/300K vs. LCO/300K), ~8.9% (LCO/650K vs. LCO/300K), and ~1.65%
(LCCO5/300K vs. LCO/650K). From their temperature-dependent XAS, Haverkort et. al. determined
the HS-state population-increase from 25% at 300K to 40% at 650K in LaCoO3; most probably, HS-
occupation in our LCCO5 is about ~40% at room temperature itself. Therefore vs. LaCoO3, higher
HS-state-fraction at 300K indicates that the transition into the LS-state is expected to occur in LCCO5
at a lower temperature than in LaCoO3 (~150K, SST from dielectric), as confirmed by our
magnetization data, having implications for the magneto-electric transport.
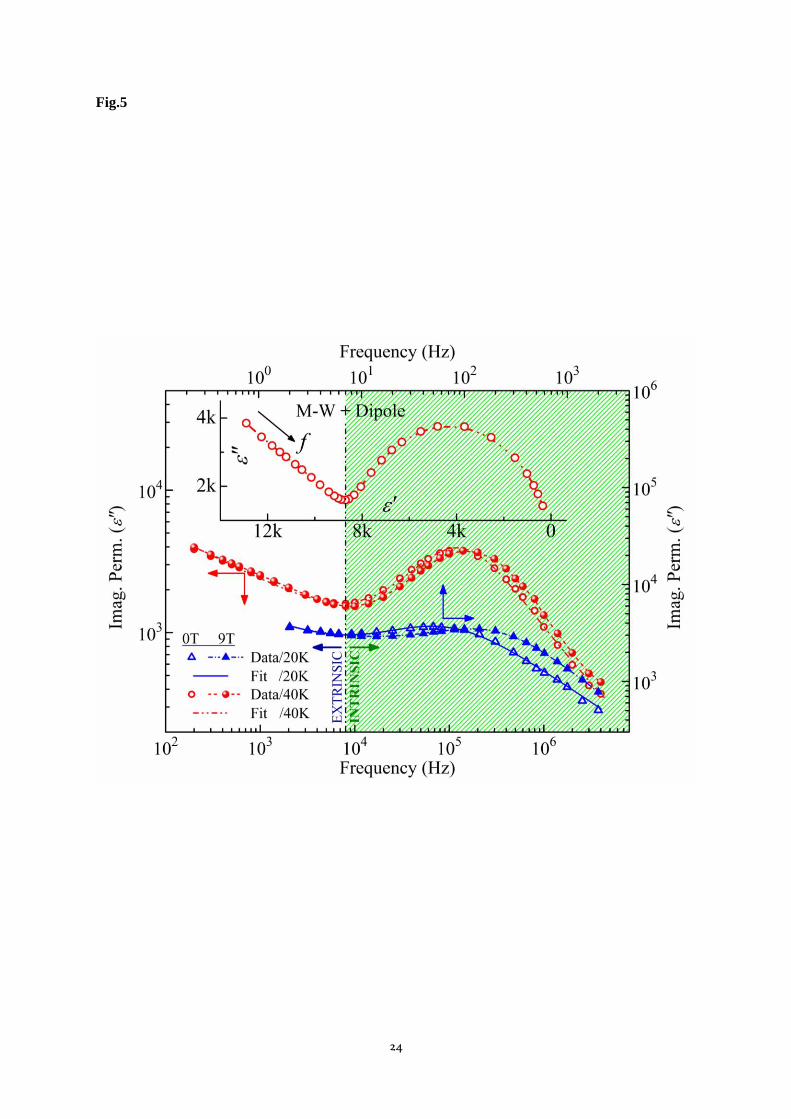
Figure 5 shows ɛ''(ω) at 20K and 40K, fitted (WinFit Software/NovoControl) using the
Havriliak-Negami (H-N) equation [24]:
n
ii
Δi
0
0
1)(* (1)
This equation accurately estimates the relaxation time and shape-parameters of the relaxation-peak.
Here, ω=2πf is the probing (angular) frequency, ε0 denotes the vacuum permittivity, τ is the mean
relaxation time, α and β (both 0 to 1) are the spectral -width (broadening) and -shape (asymmetry)
parameters of the relaxation peak ε″(ωp), and Δε = ε′0-ε′∞ is known as the dielectric strength of the
material. Fig.5 shows that the lower frequency region dominated by the Maxwell-Wagner effect is
confined below 7Hz/0T (15Hz/9T) at low temperature (20K), while at high temperature (40K) it
extends up to 8kHz/0T (10kHz/9T). Applied 9T field accelerates dipolar relaxations in the mixed (LS-
IS) state at 20K much more (by +4.6dB) than those in the robust IS state at 40K (only by +0.84dB), of
crucial consequence to ME transport. Cole-Cole plot (inset) of ε″ vs. ε′ at 40K/0T clearly delineates
the well-defined extrinsic (conductance-dominant/M-W, ε′ ε″ ≡ ε0σ′/ω) and intrinsic (relaxational,
semicircle) regimes; the intrinsic response in LCCO5 turns dramatically broadband only below ~30K.
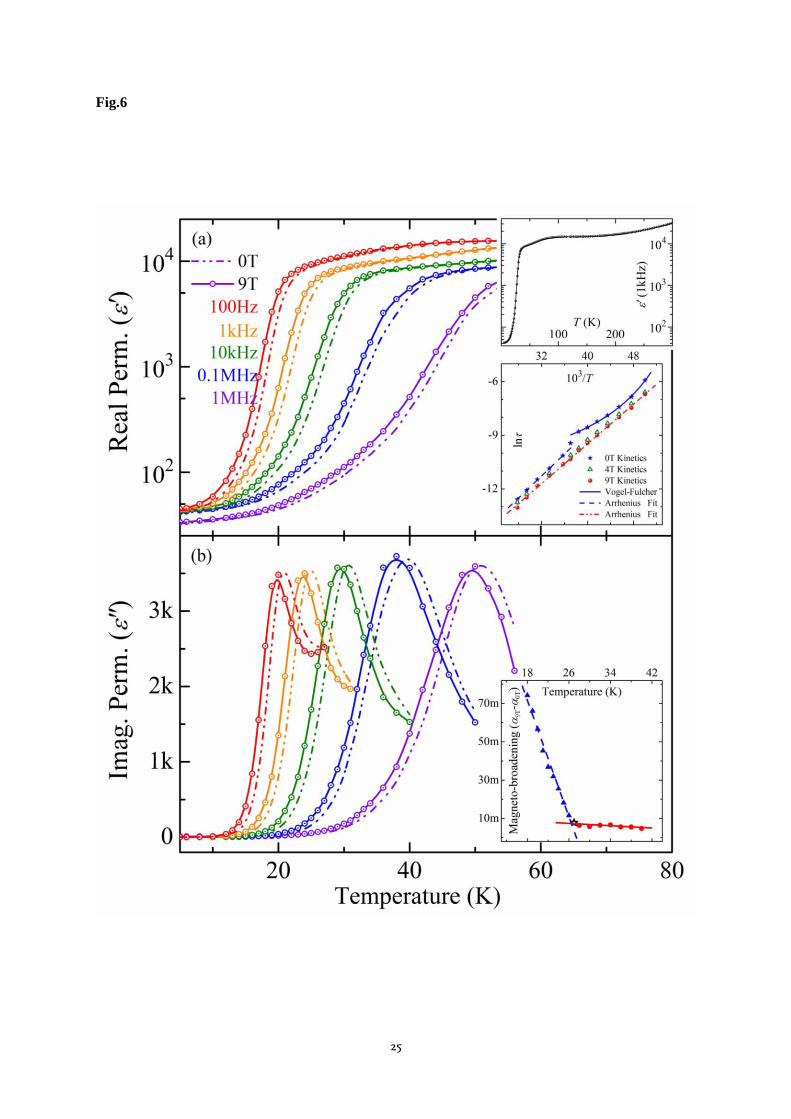
Temperature dependent dielectric constant at selected frequencies, measured under zero and 9T
magnetic field is shown in fig.6a. It gives giant dielectric constant over a wide T-range with room
temperature value ~3104 at 1kHz (upper inset), which is much larger than that reported in the Mn-
doped LaCoO3 [25]. Observation of dielectric steps around ~150K across the spin states in pure
7
LaCoO3 is already reported by Sudheendra et. al. [17]; with Ca-doping at La-site, a broadened
dielectric step with magnitude ~O(102) appears here at lower temperature ~30K. Broadened step is a
characteristic signature of disorder, i.e., the coexistence of different spin states, and is resolved here
into three regimes. (1) In the lower temperature regime (≤10K), robust low-spin (LS) state exists with
little effect under the applied H-field. (2) Step-rise region (around 30K) where intermediate spin (IS)
islands nucleate in the LS matrix [17] (LS-IS coexistent region). The longer Co-O bond due to larger
J-T distortion in the IS state corresponds to higher dielectric constant with temperature-rise, resulting
from more admixture of the IS-states. This region offers optimum scope for large magneto-dielectric
effect, due to magnetically-tunable spin-state admixture. It is to be mentioned that this type of
collective behaviour is characteristic in the spin-reorientation type materials, such as La3/2Sr1/2NiO4+
[7]. (3) Higher-temperature IS-rich regime, with relatively field-impervious single-particle dipolar-
relaxation again exhibits much mitigated magneto-dielectricity.
Step-like increase of the dielectric constant (ɛ') is associated with a relaxation peak in the
imaginary part of permittivity ɛ'' (shown in fig.6b, the higher-T data for each frequency have been
clipped for clarity). Relaxation peaks in ɛ'' vs. T shift towards the higher temperature with increasing
probe frequency, reflecting the activated character of relaxations. The observed relaxation behaviour
is different from that of colossal dielectric constant (CDC) materials [26], and more akin to the
activation associated with spin-reorientation, as has been observed in La1.5Sr0.5NiO4+ [7]. Application
of magnetic field is seen to steepen the ɛ'-step of the dielectric permittivity and cause T-downshift
~O(1K) in the ε″-peak temperatures (fig.6b), within the mixed (LS-IS) regime. This is due to the
larger dielectric constant of the field-induced/extra IS states and accelerated dynamics of the
independent dipoles associated with the same. Further, with field-facilitation of the LS→(LS-IS)
thermally-activated transition, size-reduced cooperative-dipoles (LS) undergo less-sluggish relaxation.
An important implication of the zero-field data in fig.6b is the variation of relaxation-kinetics
character across its broad spin-state crossover temperature, as made precise in the following.
We have analyzed the relaxation-kinetics viz., thermal-dispersion of spectral peak position in
imaginary permittivity ɛ''T(ω), with Arrhenic and/or Vogel-Fulcher-Tamman (VFT) [27] behaviors,
respectively given below
τ = τ0A Exp(Ea/kBT), (2)
τ = τ0V Exp[Ua/(T-T0)] (3)
Here τ0 is a characteristic/approach time as T→∞, Ea is activation energy for single-dipole relaxations,
T0 is the VFT temperature (freezing temperature) and Ua is the (apparent) activation energy, of
correlated-dipoles’ relaxation process [27]. Arrhenius plots of the effective relaxation time τp(T)= 1/ωp
against the corresponding inverse temperature 103/T are shown in fig.6a lower-inset. The low-
temperature part at zero-field provides the glassy/VFT-parameters as Ua(0T)= 2.21meV, T0(0T)=
15K, τ0V(0T)= 1.4710-5
sec and the high-temperature part exhibiting the linear/Arrhenic kinetics has
8
activation energy Ea(0T)= 26meV and τ0A(0T)= 6.7110-10
sec. Orders of magnitude gap between
τ0V(0T) (in LS) and τ0A(0T) (in IS) here relates to the widely different polaronic characters in the two
spin states, responsible for their dipolar-responses [25, 28]. This huge increase of the approach-
timescale over-compensates the observed anomalous decrease of barrier-activation energy upon
vitrification (for an overall deceleration of relaxation-dynamics at lower temperatures); Ua(0T) <
Ea(0T), contrary to latter’s expected increase [29] when the elemental dipoles’ integrity remains intact
across the glass transition.
Under high magnetic field (9T), relaxation kinetics becomes globally Arrhenic (lower inset,
fig.6a), with the activation energy Ua(9T) ≡ Ea(9T) ~24meV, T0(9T) =0K, and τ0V(9T) ≡ τ0A(9T)
=1.1410-9
sec, reflecting unsegmented-dipoles’ relaxation. Thus, there is relatively little change in
the high-T activation-energy under the applied magnetic-field (ΔEa(9T)/Ea(0T)~ 7%), also merged to
at high-H by the low-T apparent activation-energy Ua(9T). This evidences that thermal-
activation/kinetics of uncorrelated dipoles is rather impervious to the spin-state (LS, IS, or HS) they
are associated with; although as we shall witness later, their spectral-behaviors to the applied
magnetic field may differ. Notice that τ0A(0T) < τ0A(9T) already indicates some ME-field-induced
organization of the dipolar-entities in the IS state, which, due to their higher inertia (larger-sizescale)
eventually (T→∞) relax slower vis-à-vis their “bare”/zero-field counterparts’ high-T dynamics. Below
Tg, field-activated (LS→LS-IS) switching of the character of relaxing entities from glassy/cooperative
to independent, is thus also vindicated energetically and kinetically, as the dominant mechanism of
magneto-electricity in the system. Here, the optimal scope for this crucial switching is seen to exist
below Tg(0T)= 27K down to ~15K (fig.6a). This circumstance solely emerges from the lowered spin-
state transition-temperature in LCCO5 (resulting in different Arrhenic (VFT) kinetics above (below)
roughly TSST ≈30K) vis-à-vis pure LCO (featuring entirely Arrhenic kinetics above and below TSST
≈150K, [17]). This TSST-lowering endows the doped-specimen with much higher propensity for (and
the realization of) the dipolar-glass state (segmentation of dipolar-dynamics, unperturbed by thermal-
fluctuations). Further, as per expected, the Arrhenic activation energies of the doped (25meV) and the
pure specimens (120meV, [17]) scale directly with their respective transition temperatures, by
comparing their eq.2 for same 1/τ ~ 8.25kHz = fp(30K) and the expected universal τ0A for IS-state
dipoles in both LCO & LCCO5.
The observed variation in the behavior of ɛ'' vs. T under zero and finite magnetic field can be
understood as follows. At zero-field, Arrhenic kinetics results from the independent-dipoles (purely
Debyean, exponential relaxations) above ~30K while below, cooperative-dipoles relax nonlinearly
(Kohlrausch-Williams-Watts, stretched-exponential relaxations [30]), as manifest in the VFT kinetics
(lower inset of fig.6a). Over the VFT-region, divergence of relaxation time by the finite freezing
temperature T0(0T)=15K evidences segmentation of the relaxing entities [31]. In the high-temperature
regime, Arrhenic fitting indicates unsegmented dipole-relaxations, evidently little-dependent on the
applied H-field. Change in the relaxation type at ~27K defines the glass transition temperature Tg(0),
9
and for H ≥ 5T, Arrhenic behaviour (single-particle relaxation) is recovered throughout ɛ''-peak
temperature range, signifying complete devitrification of the low-temperature dipolar-glass phase. It is
important to note however, that the persistence of observed bi-dispersion over the broad thermo-
spectral domain qualitatively distinguishes the dipoles’ organization here from that in relaxor,
ferroelectric, and even unordered paraelectric states. The glass transition temperature is also manifest
in the thermal behavior of relaxation-broadening as follows. Inset of fig.6b shows the differential--
“magneto-broadening” parameter obtained from relaxation peaks at 9T and 0T; α(T) = α9T-α0T.
Saturated values of α0T and α9T above ~30K give a very small and almost T-independent α(T),
whereas at lower temperatures α(T) rises sharply. Abrupt change at the onset temperature of 26.8K
essentially reflects the sudden drop in α0T below the glass transition temperature (no vitreous state at
9T field), made steeper by taking the differential. The sluggish dipolar-dynamics slows down and
inhomogenizes (spectrally-broadens) the relaxations much more rapidly below Tg [32].
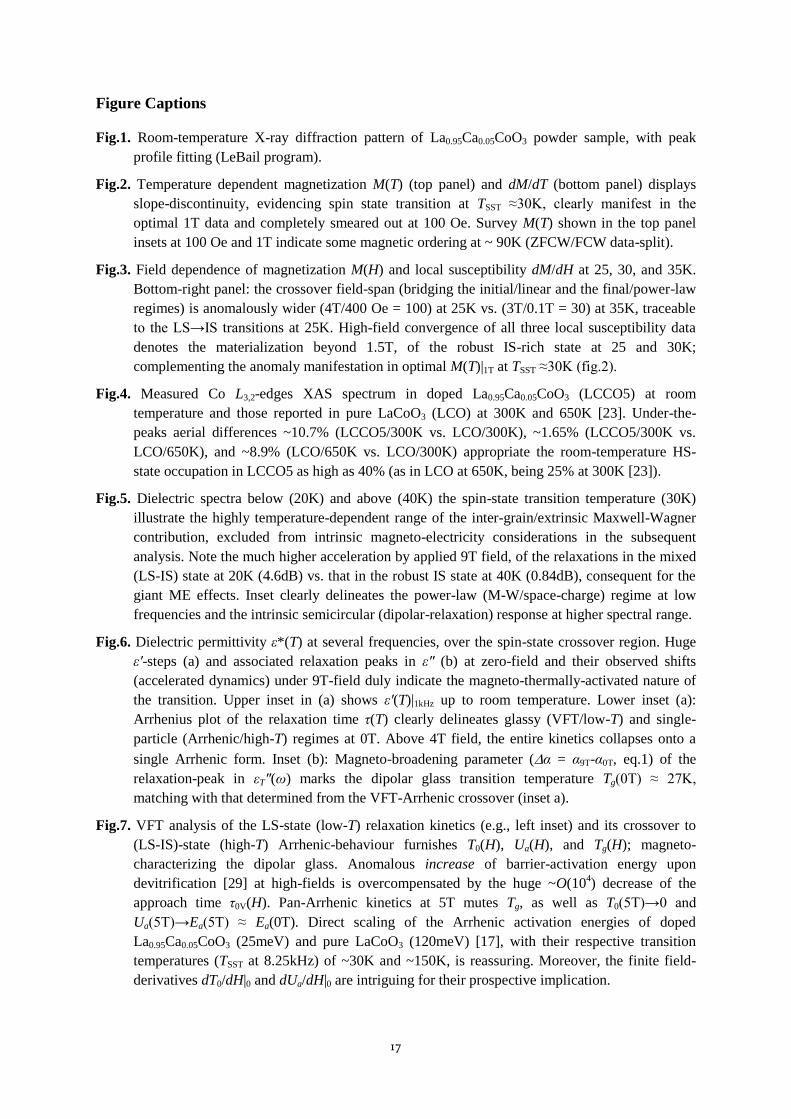
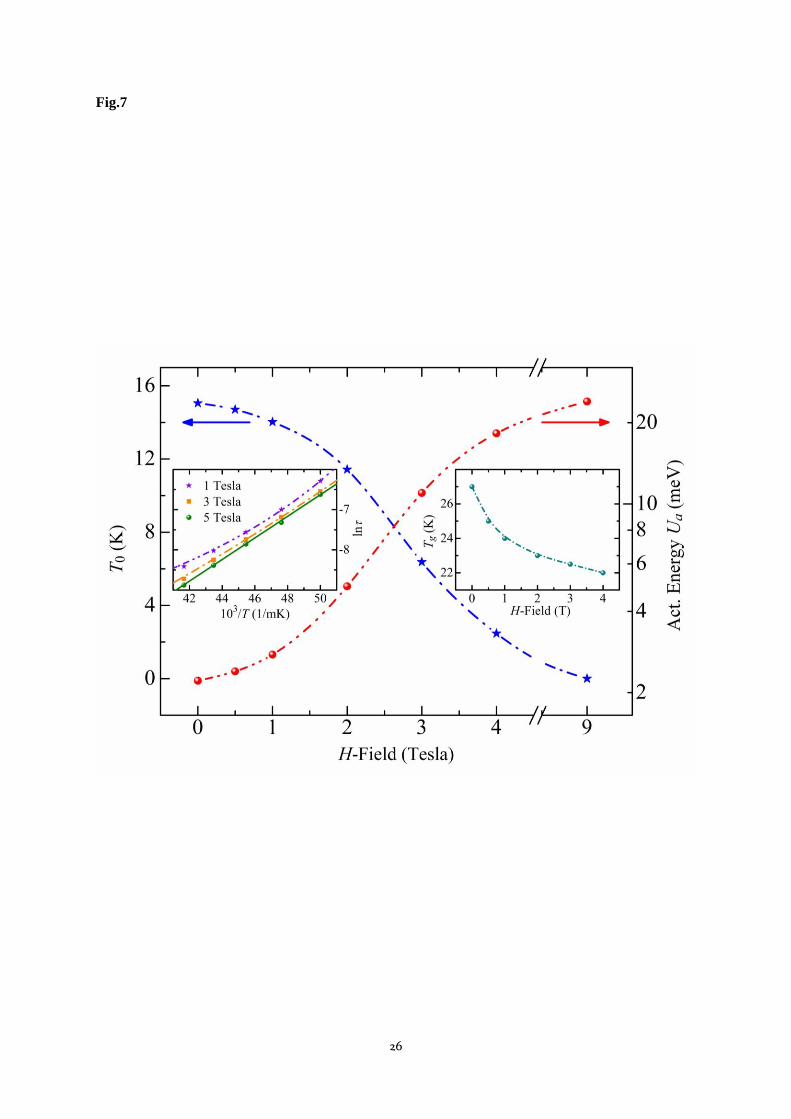
The precision kinetics and its systematic evolution with the applied H-field allow the evaluation
of field-dependent VFT-parameters in the LS glass-phase, as it retreats to lower temperatures with the
increasing field. In fig.7 are shown T0(H) (left y-axis), Ua(H) (right y-axis), and Tg(H) (right-inset), ,
evaluated from the VFT (Arrhenic) fits to the low (high)-T dispersion-kinetics dataset, consistent with
fig.6a lower-inset & fig.7 left-inset. VFT parameters at 5T (not explicitly shown, due to the H-axis
broken for better representation) are almost the same as those at 9T. Glass transition temperature
Tg(H) (right inset) is readily identified from the VFT to Arrhenic kinetics-crossover at each H; it
presents a novel ME effect on an unconventional electrical characteristic-- other than permittivity and
polarization. More precisely, with T0(H) and Ua(H) implicit in eq.3, we realize that the LS→IS
crossover is magneto-thermally activated, since the effects on τ (eq.3) and on ε* (fig.6) of increasing
H and/or T are similar over here. With increasing field, monotonous drop of the freezing temperature
T0(H) to absolute zero accompanies logarithmically-equanimous (order of magnitude) rise in the
activation energy Ua(H). This remarkably-large difference of the activation energy between
glassy/non-vitreous phases in LS-state of LCCO5 is beside its ~5 reduction vs. that in the pure LCO
[17], and partly compensates for the emergence of finite T0 (rapid divergence of τ below Tg), for
quasi-continuation of τ over the narrow VFT-Arrhenic crossover region. Intriguing finite initial field-
derivatives of the VFT freezing/activation parameters (dT0/dH|H=0 and dUa/dH|H=0 ≠ 0) is noteworthy.
Practical aspects of H-field driven devitrification of the dipolar-glass phase are examined by the
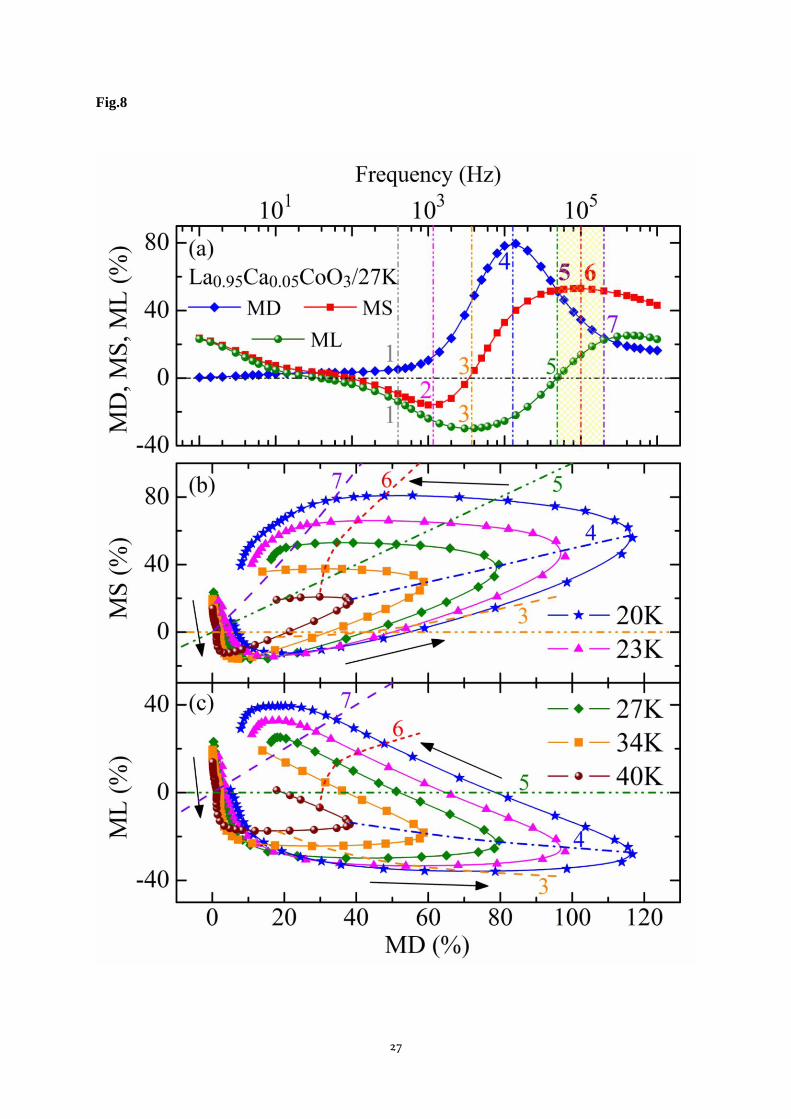
spectral behaviour of canonical magneto-capacitance/conductance/loss. The standard ME parameters,
evaluated at the benchmark glass temperature Tg(0T)=27K for the maximum 9T field used presently,
are defined below and shown in fig.8a over six decades in frequency.
MD= [{ɛ′(9T) - ɛ′(0T)}/ɛ′(0T)] (4)
MS= [{ɛ″(9T) - ɛ″(0T)}/ɛ″(0T)] = [{σ′(9T) - σ′(0T)}/σ′(0T)] (5)
ML= [{tan(9T) - tan(0T)}/tan(0T)] (6)
also their inter-relation, ML= (MS-MD)/(1+MD) (7)
10
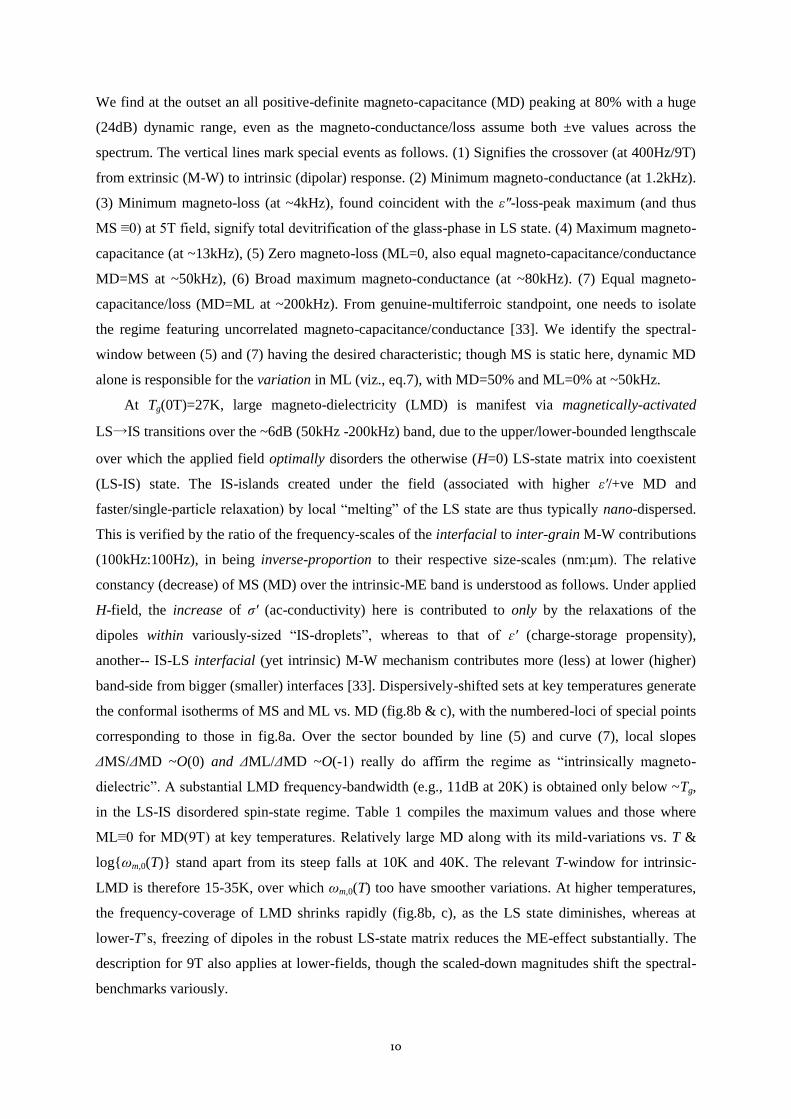
We find at the outset an all positive-definite magneto-capacitance (MD) peaking at 80% with a huge
(24dB) dynamic range, even as the magneto-conductance/loss assume both ±ve values across the
spectrum. The vertical lines mark special events as follows. (1) Signifies the crossover (at 400Hz/9T)
from extrinsic (M-W) to intrinsic (dipolar) response. (2) Minimum magneto-conductance (at 1.2kHz).
(3) Minimum magneto-loss (at ~4kHz), found coincident with the ε″-loss-peak maximum (and thus
MS ≡0) at 5T field, signify total devitrification of the glass-phase in LS state. (4) Maximum magneto-
capacitance (at ~13kHz), (5) Zero magneto-loss (ML=0, also equal magneto-capacitance/conductance
MD=MS at ~50kHz), (6) Broad maximum magneto-conductance (at ~80kHz). (7) Equal magneto-
capacitance/loss (MD=ML at ~200kHz). From genuine-multiferroic standpoint, one needs to isolate
the regime featuring uncorrelated magneto-capacitance/conductance [33]. We identify the spectral-
window between (5) and (7) having the desired characteristic; though MS is static here, dynamic MD
alone is responsible for the variation in ML (viz., eq.7), with MD=50% and ML=0% at ~50kHz.
At Tg(0T)=27K, large magneto-dielectricity (LMD) is manifest via magnetically-activated
LS→IS transitions over the ~6dB (50kHz -200kHz) band, due to the upper/lower-bounded lengthscale
over which the applied field optimally disorders the otherwise (H=0) LS-state matrix into coexistent
(LS-IS) state. The IS-islands created under the field (associated with higher ε′/+ve MD and
faster/single-particle relaxation) by local “melting” of the LS state are thus typically nano-dispersed.
This is verified by the ratio of the frequency-scales of the interfacial to inter-grain M-W contributions
(100kHz:100Hz), in being inverse-proportion to their respective size-scales (nm:μm). The relative
constancy (decrease) of MS (MD) over the intrinsic-ME band is understood as follows. Under applied
H-field, the increase of σ′ (ac-conductivity) here is contributed to only by the relaxations of the
dipoles within variously-sized “IS-droplets”, whereas to that of ɛ′ (charge-storage propensity),
another-- IS-LS interfacial (yet intrinsic) M-W mechanism contributes more (less) at lower (higher)
band-side from bigger (smaller) interfaces [33]. Dispersively-shifted sets at key temperatures generate
the conformal isotherms of MS and ML vs. MD (fig.8b & c), with the numbered-loci of special points
corresponding to those in fig.8a. Over the sector bounded by line (5) and curve (7), local slopes
ΔMS/ΔMD ~O(0) and ΔML/ΔMD ~O(-1) really do affirm the regime as “intrinsically magneto-
dielectric”. A substantial LMD frequency-bandwidth (e.g., 11dB at 20K) is obtained only below ~Tg,
in the LS-IS disordered spin-state regime. Table 1 compiles the maximum values and those where
ML≡0 for MD(9T) at key temperatures. Relatively large MD along with its mild-variations vs. T &
log{ωm,0(T)} stand apart from its steep falls at 10K and 40K. The relevant T-window for intrinsic-
LMD is therefore 15-35K, over which ωm,0(T) too have smoother variations. At higher temperatures,
the frequency-coverage of LMD shrinks rapidly (fig.8b, c), as the LS state diminishes, whereas at
lower-T’s, freezing of dipoles in the robust LS-state matrix reduces the ME-effect substantially. The
description for 9T also applies at lower-fields, though the scaled-down magnitudes shift the spectral-
benchmarks variously.
11
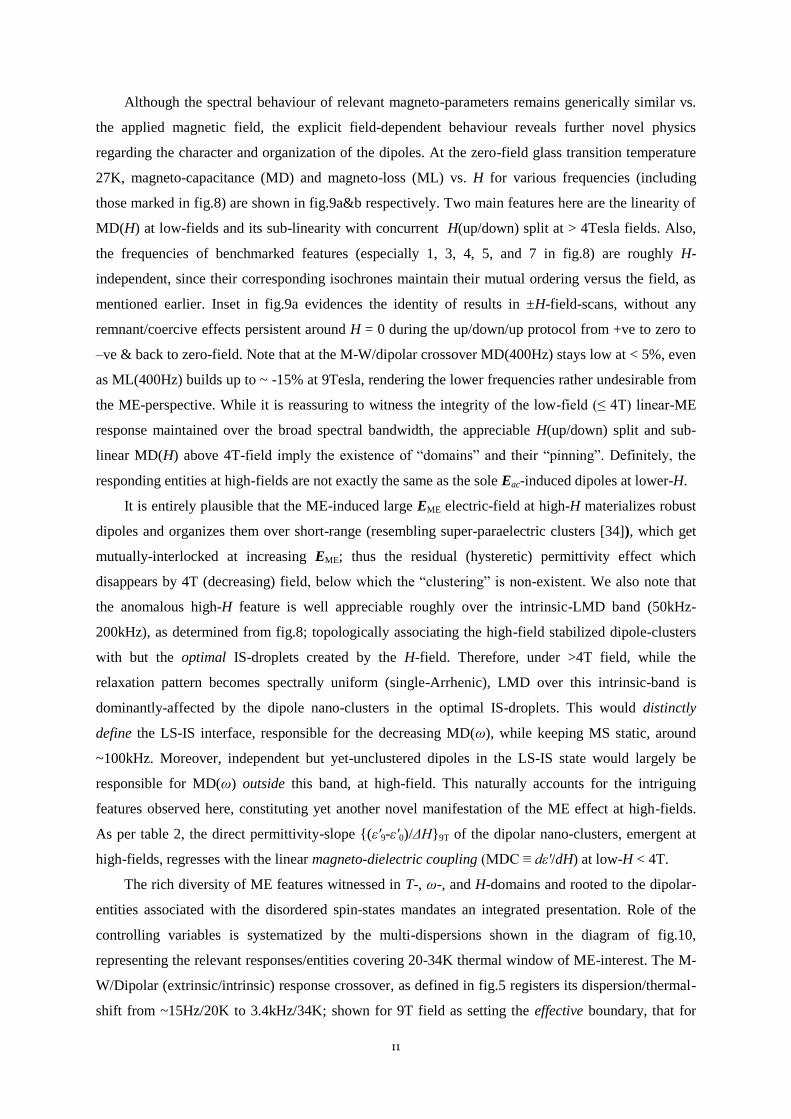
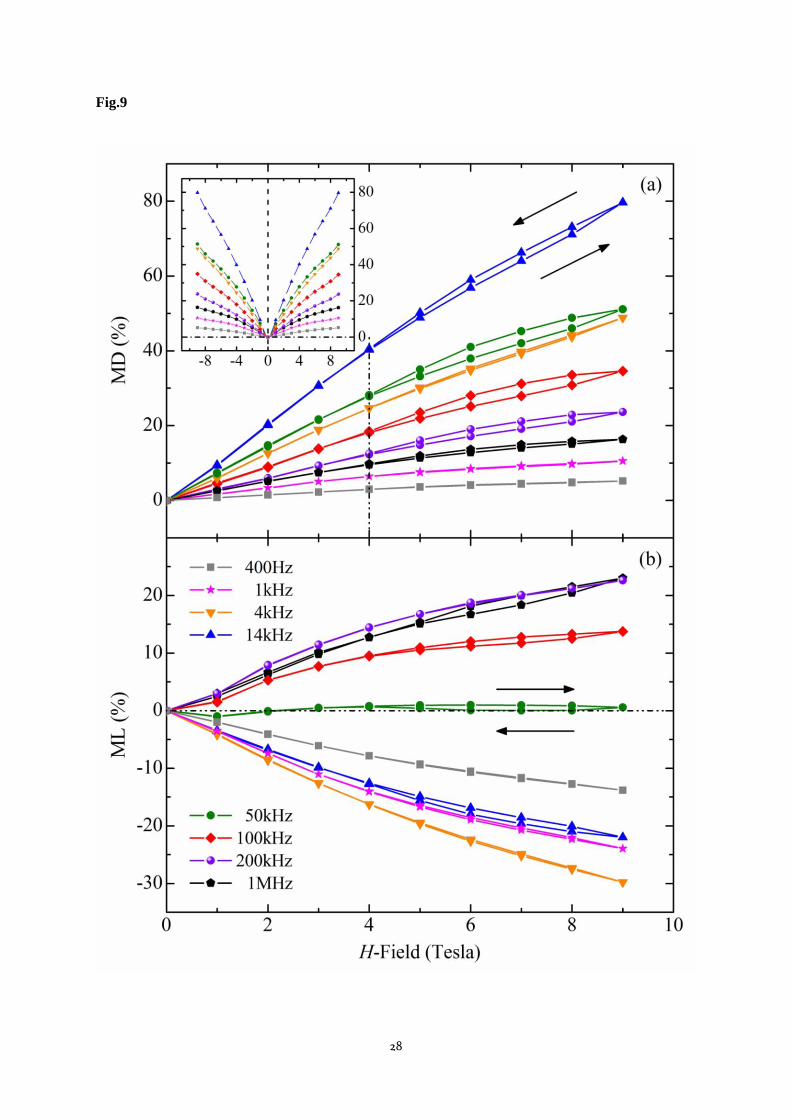
Although the spectral behaviour of relevant magneto-parameters remains generically similar vs.
the applied magnetic field, the explicit field-dependent behaviour reveals further novel physics
regarding the character and organization of the dipoles. At the zero-field glass transition temperature
27K, magneto-capacitance (MD) and magneto-loss (ML) vs. H for various frequencies (including
those marked in fig.8) are shown in fig.9a&b respectively. Two main features here are the linearity of
MD(H) at low-fields and its sub-linearity with concurrent H(up/down) split at > 4Tesla fields. Also,
the frequencies of benchmarked features (especially 1, 3, 4, 5, and 7 in fig.8) are roughly H-
independent, since their corresponding isochrones maintain their mutual ordering versus the field, as
mentioned earlier. Inset in fig.9a evidences the identity of results in ±H-field-scans, without any
remnant/coercive effects persistent around H = 0 during the up/down/up protocol from +ve to zero to
–ve & back to zero-field. Note that at the M-W/dipolar crossover MD(400Hz) stays low at < 5%, even
as ML(400Hz) builds up to ~ -15% at 9Tesla, rendering the lower frequencies rather undesirable from
the ME-perspective. While it is reassuring to witness the integrity of the low-field (≤ 4T) linear-ME
response maintained over the broad spectral bandwidth, the appreciable H(up/down) split and sub-
linear MD(H) above 4T-field imply the existence of “domains” and their “pinning”. Definitely, the
responding entities at high-fields are not exactly the same as the sole Eac-induced dipoles at lower-H.
It is entirely plausible that the ME-induced large EME electric-field at high-H materializes robust
dipoles and organizes them over short-range (resembling super-paraelectric clusters [34]), which get
mutually-interlocked at increasing EME; thus the residual (hysteretic) permittivity effect which
disappears by 4T (decreasing) field, below which the “clustering” is non-existent. We also note that
the anomalous high-H feature is well appreciable roughly over the intrinsic-LMD band (50kHz-
200kHz), as determined from fig.8; topologically associating the high-field stabilized dipole-clusters
with but the optimal IS-droplets created by the H-field. Therefore, under >4T field, while the
relaxation pattern becomes spectrally uniform (single-Arrhenic), LMD over this intrinsic-band is
dominantly-affected by the dipole nano-clusters in the optimal IS-droplets. This would distinctly
define the LS-IS interface, responsible for the decreasing MD(ω), while keeping MS static, around
~100kHz. Moreover, independent but yet-unclustered dipoles in the LS-IS state would largely be
responsible for MD(ω) outside this band, at high-field. This naturally accounts for the intriguing
features observed here, constituting yet another novel manifestation of the ME effect at high-fields.
As per table 2, the direct permittivity-slope {(ε′9-ε′0)/ΔH}9T of the dipolar nano-clusters, emergent at
high-fields, regresses with the linear magneto-dielectric coupling (MDC ≡ dε′/dH) at low-H < 4T.
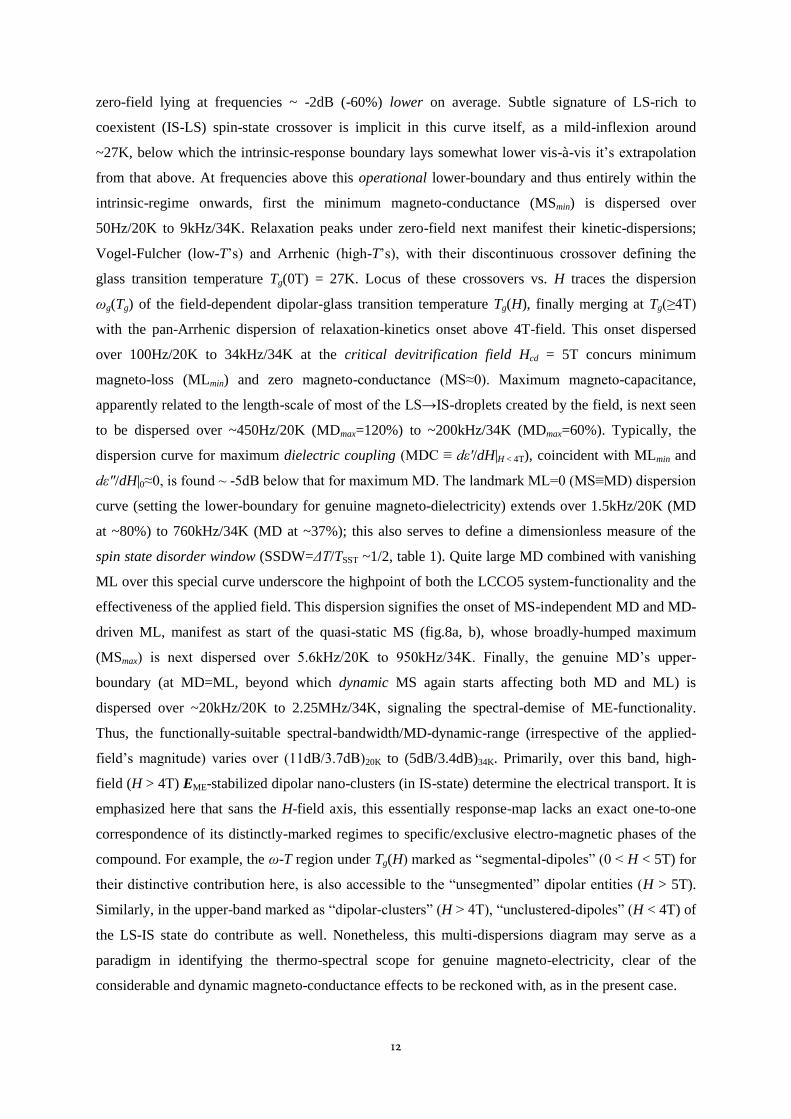
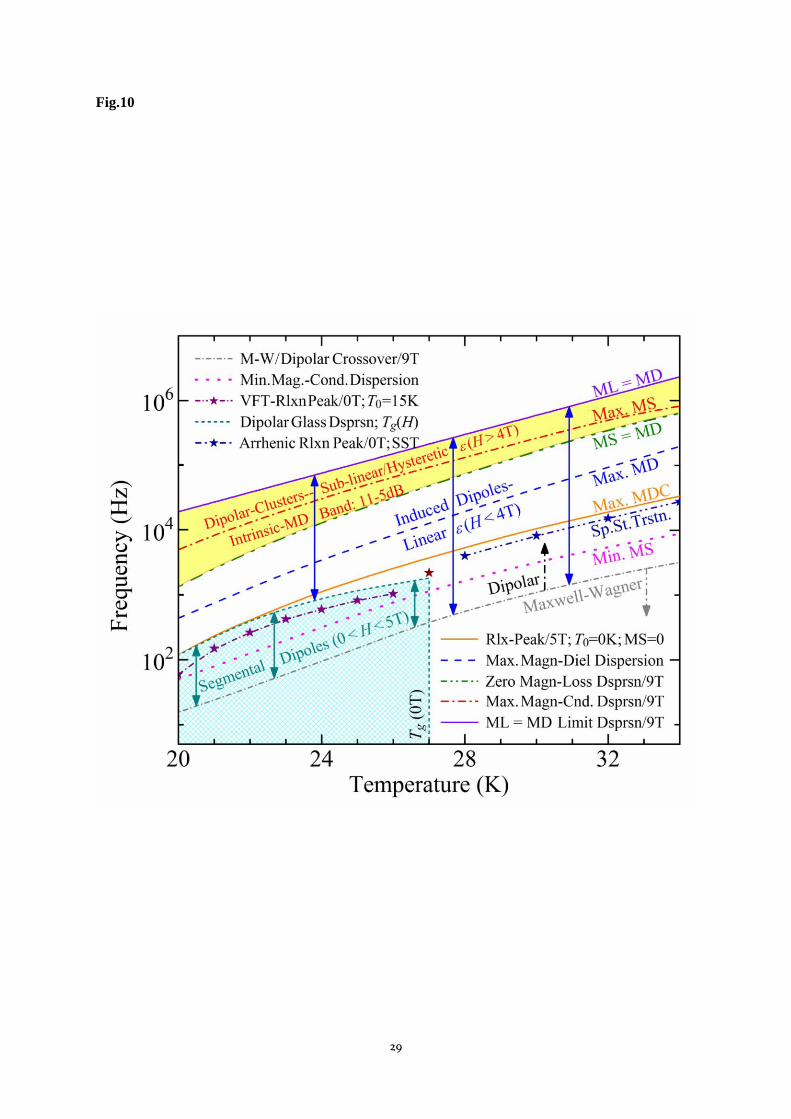
The rich diversity of ME features witnessed in T-, ω-, and H-domains and rooted to the dipolar-
entities associated with the disordered spin-states mandates an integrated presentation. Role of the
controlling variables is systematized by the multi-dispersions shown in the diagram of fig.10,
representing the relevant responses/entities covering 20-34K thermal window of ME-interest. The M-
W/Dipolar (extrinsic/intrinsic) response crossover, as defined in fig.5 registers its dispersion/thermal-
shift from ~15Hz/20K to 3.4kHz/34K; shown for 9T field as setting the effective boundary, that for
12
zero-field lying at frequencies ~ -2dB (-60%) lower on average. Subtle signature of LS-rich to
coexistent (IS-LS) spin-state crossover is implicit in this curve itself, as a mild-inflexion around
~27K, below which the intrinsic-response boundary lays somewhat lower vis-à-vis it’s extrapolation
from that above. At frequencies above this operational lower-boundary and thus entirely within the
intrinsic-regime onwards, first the minimum magneto-conductance (MSmin) is dispersed over
50Hz/20K to 9kHz/34K. Relaxation peaks under zero-field next manifest their kinetic-dispersions;
Vogel-Fulcher (low-T’s) and Arrhenic (high-T’s), with their discontinuous crossover defining the
glass transition temperature Tg(0T) = 27K. Locus of these crossovers vs. H traces the dispersion
ωg(Tg) of the field-dependent dipolar-glass transition temperature Tg(H), finally merging at Tg(≥4T)
with the pan-Arrhenic dispersion of relaxation-kinetics onset above 4T-field. This onset dispersed
over 100Hz/20K to 34kHz/34K at the critical devitrification field Hcd = 5T concurs minimum
magneto-loss (MLmin) and zero magneto-conductance (MS≈0). Maximum magneto-capacitance,
apparently related to the length-scale of most of the LS→IS-droplets created by the field, is next seen
to be dispersed over ~450Hz/20K (MDmax=120%) to ~200kHz/34K (MDmax=60%). Typically, the
dispersion curve for maximum dielectric coupling (MDC ≡ dε′/dH|H < 4T), coincident with MLmin and
dε″/dH|0≈0, is found ~ -5dB below that for maximum MD. The landmark ML=0 (MS≡MD) dispersion
curve (setting the lower-boundary for genuine magneto-dielectricity) extends over 1.5kHz/20K (MD
at ~80%) to 760kHz/34K (MD at ~37%); this also serves to define a dimensionless measure of the
spin state disorder window (SSDW=ΔT/TSST ~1/2, table 1). Quite large MD combined with vanishing
ML over this special curve underscore the highpoint of both the LCCO5 system-functionality and the
effectiveness of the applied field. This dispersion signifies the onset of MS-independent MD and MD-
driven ML, manifest as start of the quasi-static MS (fig.8a, b), whose broadly-humped maximum
(MSmax) is next dispersed over 5.6kHz/20K to 950kHz/34K. Finally, the genuine MD’s upper-
boundary (at MD=ML, beyond which dynamic MS again starts affecting both MD and ML) is
dispersed over ~20kHz/20K to 2.25MHz/34K, signaling the spectral-demise of ME-functionality.
Thus, the functionally-suitable spectral-bandwidth/MD-dynamic-range (irrespective of the applied-
field’s magnitude) varies over (11dB/3.7dB)20K to (5dB/3.4dB)34K. Primarily, over this band, high-
field (H > 4T) EME-stabilized dipolar nano-clusters (in IS-state) determine the electrical transport. It is
emphasized here that sans the H-field axis, this essentially response-map lacks an exact one-to-one
correspondence of its distinctly-marked regimes to specific/exclusive electro-magnetic phases of the
compound. For example, the ω-T region under Tg(H) marked as “segmental-dipoles” (0 < H < 5T) for
their distinctive contribution here, is also accessible to the “unsegmented” dipolar entities (H > 5T).
Similarly, in the upper-band marked as “dipolar-clusters” (H > 4T), “unclustered-dipoles” (H < 4T) of
the LS-IS state do contribute as well. Nonetheless, this multi-dispersions diagram may serve as a
paradigm in identifying the thermo-spectral scope for genuine magneto-electricity, clear of the
considerable and dynamic magneto-conductance effects to be reckoned with, as in the present case.
13
Finally, we place our findings in perspective against similar literature-reported studies. The LS-
IS spin state transition investigated here in only mildly-doped La0.95Ca0.05CoO3 uniquely features
devitrification of a dipolar-glass phase, qualitatively different from the diffused-FM transition in the
half-doped single crystal LaMn1/2Co1/2O3, exhibiting only a switchover between independent-dipoles
characters with different (Arrhenic) activations [25]. In case of SST in pure LaCoO3, even the barrier-
activation energies of independent dipoles in the LS and IS states are alike [17]; a scenario realized in
LCCO5 here at high-fields. The most important functional consequence of the novel phenomenon in
LCCO5 is a huge intrinsic MD (~80% at 20K/1.5kHz), and together with its pan-spectral broad
linearity in the H ≤ 4T field manifests a giant and direct ME-coupling. This is in sharp contrast with
the low (6%) MD reported below the disordered FM-TC in single crystal LaMn1/2Co1/2O3 [25] and
still-lower (≤ 0.6%) MD reported in CuCr1/2V1/2O2 multiglass [6]; latter being visibly quadratic in H is
due to the higher-order ME-effects. Yet another, recent study on the spin-cluster glass Fe2TiO5 [35]
reported a miniscule (≤ 0.04%) quadratic MD at vastly-high fields (~14T, negligible up to ~5T).
Emergence of super-paraelectric-like nano-clusters at high (> 4T) fields is the other significant
maiden signature of exceptionally strong ME coupling in LCCO5. Studies on polycrystalline/thin-film
samples of e.g., DyMn1/3Fe2/3O3 [36], La2MnNiO6 [6, 37], and LaMn1/2Co1/2O3 [38] have also reported
large dielectric constants and MD; though the low-frequency response (mainly by the M-W/inter-
grain/electrode-boundary) focused on does not represent the high-frequency/intrinsic ME. The present
study has carefully excluded these extrinsic effects, as well as identified specific high-frequency band
where magneto-capacitance/loss are impervious of the magneto-conductance.
Topological disorder created by the mild-substitution of smaller/heterovalent-Ca at larger-La site
in spin-active LaCoO3 thus proves optimally effective for LMD as follows. (1) It raises the high-spin
state population vis-à-vis that in the virgin cobaltate, simulating the heating effect and thus lowers the
LS→IS transition temperature in the doped-specimen. (2) It creates highly inhomogeneous spin-state
ensembles at low temperature, catalyzing the vitrification of the polaronic dipoles in the LS state. (3)
The enhanced nanoscale LS-IS phase-coexistence (SSDW=ΔT/TSST ~1/2 for LCCO5 (table 1) vs. ~3/8
for LCO [17], from a common 1.54kHz-990kHz intrinsic-bandwidth for their respective dispersions)
further differentiates the polaronic characters in the LS and IS states dramatically, making local
lattice-distortions [14] as more dominant in LCCO5, exceeding those due to J-T interactions. (4)
Finally, devitrification of the dipolar-glass state allied with magneto-thermally activated LS→IS
transition endows the LCCO5 cobaltate high-functionality/tunability with relatively modest external
magnetic-field, featuring maidenly large and diverse magneto-electric effects. Otherwise direct (Co-
site) substitutions reduce the Co-ions’ number themselves, thereby contracting the scope & influence
of LS→IS transitions, responsible for the peculiar ME characteristics witnessed here. For example,
the single crystal LaMn1/2Co1/2O3 undergoes only a diffused-FM ordering at ~150K [25], exhibiting
mild ME at close by temperatures, sans any spin state physics.
14
Conclusions
To summarize, the magnetic characterization of mildly-doped La0.95Ca0.05CoO3 evidences its spin-
state transition temperature suppressed to 30K vs. ~150K of the pure LaCoO3. We have established
the nature of the disordered transition in La0.95Ca0.05CoO3 as magneto-thermally-activated; the
accelerating-influence of magnetic-field on strongly allied dipolar degrees of freedom simulates
temperature-increment effects. We witness diverse signatures of magneto-electricity here in thermal,
spectral, kinetic, and field domains, for the first time. Magneto-dielectric study of the crossover
reveals the low-temperature LS-rich state harboring magnetically tunable dipolar-glass phase, which
is completely devitrified under the critical 5Tesla field. Significantly, the linear magneto-dielectric
coupling (dε′/dH|0) is maximized and magneto-dielectric loss-rate vanishes (dε″/dH|0=0) exactly on ω-
T locus of the relaxation-peak at 5T. Splitting of the LS-rich matrix into nanometric IS-droplets
(LS→LS-IS disorder) under applied magnetic field is found to dramatically alter the organization of
their associated dipoles; from glassy character in the LS-state to super-paraelectric-like (high-H)
nano-clusters in the IS-state. This accounts well as the dominant novel mechanism for the large
magneto-dielectricity (LMD, field-hysteretic and sub-linear above 4T) and covers a wide thermo-
spectral window of spin-state disordered LS-IS phase-coexistence. The LMD is spectrally isolated
from the extrinsic effects and also disentangled from the comparable magneto-conductance. It would
be interesting to investigate in single crystals the implicit issue of local polarization of dipoles in the
nano-clusters emergent at high-fields. Our study offers a template prescription to examine similar
systems for unusual magneto-electricity.
Acknowledgments
Dinesh Shukla is thankfully acknowledged for the XAS data on La0.95Ca0.05CoO3 and its analysis.
Authors sincerely thank Ram Janay Choudhary for providing the magnetization data and for the
discussion of its analyzed results.
15
References
[1] W. Eerenstein, N.D. Mathur, and J.F. Scott, Nature (London) 442, 759 (2006); Daniel Khomskii,
Physics 2, 20 (2009).
[2] N. Hur, S. Park, P.A. Sharma, J.S. Ahn, S. Guha, and S.-W. Cheong, Nature (London) 429, 392
(2004).
[3] V.V. Shvartsman, S. Bedanta, P. Borisov, W. Kleemann, A. Tkach, and P.M. Vilarinho, Phys.
Rev. Lett. 101, 165704 (2008).
[4] V.V. Shvartsman, S. Bedanta, P. Borisov, W. Kleemann, A. Tkach, and P.M. Vilarinho, J. Appl.
Phys. 107, 103926 (2010).
[5] Kiran Singh, Antoine Maignan, Charles Simon, Sanjay Kumar, Christine Martin, Oleg Lebedev,
Stuart Turner, and G. Van Tendeloo, J. Phys.: Cond. Matter 24, 226002 (2012).
[6] D. Choudhury, P. Mandal, R. Mathieu, A. Hazarika, S. Rajan, A. Sundaresan, U.V. Waghmare, R.
Knut, O. Karis, P. Nordblad, and D.D. Sarma, Phys. Rev. Lett. 108, 127201 (2012).
[7] Dang Thanh Tran, Dinh LamVu, Van Hong Le, The-Long Phan, and Seong-Cho, Yu, Adv. Nat.
Sci.: Nanosci. Nanotechnol. 4, 025010 (2013).
[8] P. Colombet, A. Leblanc, M. Danot, and J. Rouxel, J. Sol. State Chem. 41,174 (1982).
[9] W. Kleemann, V.V. Shvartsman, P. Borisov, and A. Kania, Phys. Rev. Lett.. 105, 257202 (2010).
[10] J. Kumar, R.J. Choudhury, and A.M. Awasthi, Appl. Phys. Lett 104, 262905 (2014).
[11] W.H. Madhusudan, K. Jagannathan, P. Ganguly, and C.N.R. Rao, J. Chem. Soc. Dalton. Trans.
1397 (1980); Y.Y. Kim, D. H. Lee, T.Y. Kwon, and S.H. Park, J. Solid State Chem. 112, 376
(1994).
[12] M. Itoh, I. Natori, S. Kubota, and K. Matoya, J. Phys. Soc. Jpn. 63, 1486 (1994).
[13] S. Yamaguchi, Y. Okimoto, and Y. Tokura, Phys. Rev. B 55, R8666 (1997).
[14] N. Sundaram, Y. Jiang, I.E. Anderson, D.P. Belanger, C.H. Booth, F. Bridges, J.F. Mitchell, Th.
Proffen, and H. Zheng, Phys. Rev. Lett. 102, 026401 (2009); Y. Jiang, F. Bridges, N. Sundaram,
D.P. Belanger, I.E. Anderson, J.F. Mitchell, and H. Zheng, Phys. Rev. B 80, 144423 (2009).
[15] S. Tsubouchi, T. Kyomen, M. Itoh, P. Ganguly, M. Oguni, Y. Shimojo, Y. Mori, and Y. Ishii,
Phys. Rev. B 66, 052418 (2002).
[16] C. Frontera, J.L. Garcia-Munoz, A. Llibet, M.A.G. Aranda, J. Rodriguez-Carvajal, M. Respaud,
J.M. Broto, B. Raquet, H. Rakato, and M. Goiran, J. Magn. Magn. Mater. 242–245, 751 (2002).
[17] L. Sudheendra, M.D. Motin Seikh, A.R. Raju, Chandrabhas Narayan, and C.N.R. Rao
Ferroelectrics, 306, 227 (2004).
[18] G. Maris, Y. Ren, V. Volotchev, C. Zobel, T. Lorenz, and T.T.M. Palstra, Phys. Rev. B 67,
224423 (2003).
[19] M.N. Iliev and M.V. Abrashev, J. Raman Spectrosc. 32, 805 (2001).
[20] Rainer Schmidt, J. Wu, C. Leighton, and I. Terry, Phys. Rev. B 79, 125105 (2009).
[21] J. Wu and C. Leighton, Phys. Rev. B 67, 174408 (2003).
[22] S. Medling, Y. Lee, H. Zheng, J.F. Mitchell, J.W. Freeland, B.N. Harmon, and F. Bridges, Phys.
Rev. Lett. 109, 157204 (2012), and references therein.
16
[23] M.W. Haverkort, Z. Hu, J.C. Cezar, T. Burnus, H. Hartmann, M. Reuther, C. Zobel, T. Lorenz,
A. Tanaka, N.B. Brookes, H.H. Hsieh, H.-J. Lin, C.T. Chen, and L.H. Tjeng, Phys. Rev. Lett. 97,
176405 (2006).
[24] S. Havriliak, Jr., and S. Negami, J. Polym. Sci. C 14, 99 (1966); S. Havriliak, Jr., and S. Negami,
Polymer 8, 161 (1967).
[25] Kaustuv Manna, Rajeev S. Joshi, Suja Elizabeth, and P.S. Anil Kumar. App. Phy. Lett. 104,
202905 (2014).
[26] Homes C.C., Vogt T., Shapiro S.M., Wakimoto S., and Ramirez A.P., Science 293, 673 (2001);
Deng G., He Z., and Muralt P., J. Appl. Phys. 105, 084106 (2009).
[27] H. Vogel, Z. Phys. 22, 245 (1921); G.S. Fulcher, J. Am. Ceram. Soc. 8, 339 (1925).
[28] D. Emin and T. Holstein, Ann. Phys. 53, 439 (1969); T. Holstein, Ann. Phys. 8, 343 (1959);
E. Quenneville, M. Meunier, A. Yelon, and F. Morin, J. Appl. Phys. 90, 1891 (2001).
[29] Th. Bauer, P. Lunkenheimer, and A. Loidl, Phys. Rev. Lett. 111, 225702 (2013).
[30] F. Kohlrausch, Pogg. Ann. Phys. (4) 29, 337 (1863); G. Williams and D.C. Watts, Trans. Faraday
Soc. 66, 80 (1970).
[31] G. Adam and J.H. Gibbs, J. Chem. Phys. 43, 139 (1965).
[32] Disorder Effects on Relaxational Processes, edited by R. Richert and A. Blumen (Springer-
Verlag, Berlin, 1994).
[33] G. Catalan, Appl. Phys. Lett. 88, 102902 (2006).
[34] Shigemi Kohiki, Shinichiro Nogami, Shintaro Kawakami, Syozo Takada, Hirokazu Shimooka,
Hiroyuki Deguchi, Masanori Mitome, and Masaoki Oku, Appl. Phys. Lett. 82, 4134 (2003).
[35] S. Sharma, T. Basu, A. Shahee, K. Singh, N.P. Lalla, and E.V. Sampathkumaran, Phys. Rev. B
90, 144426 (2014).
[36] F. Hong, Z. Cheng, and X. Wang, J. Appl. Phys. 112, 013920 (2012).
[37] N.S. Rogado, J. Li, A.W. Sleight, and M.A. Subramanian, Adv. Mater. 17, 2225 (2005).
[38] M.P. Singh, K.D. Truong, and P. Fournier, Appl. Phys. Lett. 91, 042504 (2007); S. Yanez-Vilar,
M. Sanchez-Andujar, J. Rivas, and M.A. Senaris-Rodriguez, J. Alloys Compd. 485, 82 (2009).
17
Figure Captions
Fig.1. Room-temperature X-ray diffraction pattern of La0.95Ca0.05CoO3 powder sample, with peak
profile fitting (LeBail program).
Fig.2. Temperature dependent magnetization M(T) (top panel) and dM/dT (bottom panel) displays
slope-discontinuity, evidencing spin state transition at TSST ≈30K, clearly manifest in the
optimal 1T data and completely smeared out at 100 Oe. Survey M(T) shown in the top panel
insets at 100 Oe and 1T indicate some magnetic ordering at ~ 90K (ZFCW/FCW data-split).
Fig.3. Field dependence of magnetization M(H) and local susceptibility dM/dH at 25, 30, and 35K.
Bottom-right panel: the crossover field-span (bridging the initial/linear and the final/power-law
regimes) is anomalously wider (4T/400 Oe = 100) at 25K vs. (3T/0.1T = 30) at 35K, traceable
to the LS→IS transitions at 25K. High-field convergence of all three local susceptibility data
denotes the materialization beyond 1.5T, of the robust IS-rich state at 25 and 30K;
complementing the anomaly manifestation in optimal M(T)|1T at TSST ≈30K (fig.2).
Fig.4. Measured Co L3,2-edges XAS spectrum in doped La0.95Ca0.05CoO3 (LCCO5) at room
temperature and those reported in pure LaCoO3 (LCO) at 300K and 650K [23]. Under-the-
peaks aerial differences ~10.7% (LCCO5/300K vs. LCO/300K), ~1.65% (LCCO5/300K vs.
LCO/650K), and ~8.9% (LCO/650K vs. LCO/300K) appropriate the room-temperature HS-
state occupation in LCCO5 as high as 40% (as in LCO at 650K, being 25% at 300K [23]).
Fig.5. Dielectric spectra below (20K) and above (40K) the spin-state transition temperature (30K)
illustrate the highly temperature-dependent range of the inter-grain/extrinsic Maxwell-Wagner
contribution, excluded from intrinsic magneto-electricity considerations in the subsequent
analysis. Note the much higher acceleration by applied 9T field, of the relaxations in the mixed
(LS-IS) state at 20K (4.6dB) vs. that in the robust IS state at 40K (0.84dB), consequent for the
giant ME effects. Inset clearly delineates the power-law (M-W/space-charge) regime at low
frequencies and the intrinsic semicircular (dipolar-relaxation) response at higher spectral range.
Fig.6. Dielectric permittivity ε*(T) at several frequencies, over the spin-state crossover region. Huge
ε′-steps (a) and associated relaxation peaks in ε″ (b) at zero-field and their observed shifts
(accelerated dynamics) under 9T-field duly indicate the magneto-thermally-activated nature of
the transition. Upper inset in (a) shows ε′(T)|1kHz up to room temperature. Lower inset (a):
Arrhenius plot of the relaxation time τ(T) clearly delineates glassy (VFT/low-T) and single-
particle (Arrhenic/high-T) regimes at 0T. Above 4T field, the entire kinetics collapses onto a
single Arrhenic form. Inset (b): Magneto-broadening parameter (α = α9T-α0T, eq.1) of the
relaxation-peak in εT″(ω) marks the dipolar glass transition temperature Tg(0T) ≈ 27K,
matching with that determined from the VFT-Arrhenic crossover (inset a).
Fig.7. VFT analysis of the LS-state (low-T) relaxation kinetics (e.g., left inset) and its crossover to
(LS-IS)-state (high-T) Arrhenic-behaviour furnishes T0(H), Ua(H), and Tg(H); magneto-
characterizing the dipolar glass. Anomalous increase of barrier-activation energy upon
devitrification [29] at high-fields is overcompensated by the huge ~O(104) decrease of the
approach time τ0V(H). Pan-Arrhenic kinetics at 5T mutes Tg, as well as T0(5T)→0 and
Ua(5T)→Ea(5T) ≈ Ea(0T). Direct scaling of the Arrhenic activation energies of doped
La0.95Ca0.05CoO3 (25meV) and pure LaCoO3 (120meV) [17], with their respective transition
temperatures (TSST at 8.25kHz) of ~30K and ~150K, is reassuring. Moreover, the finite field-
derivatives dT0/dH|0 and dUa/dH|0 are intriguing for their prospective implication.
18
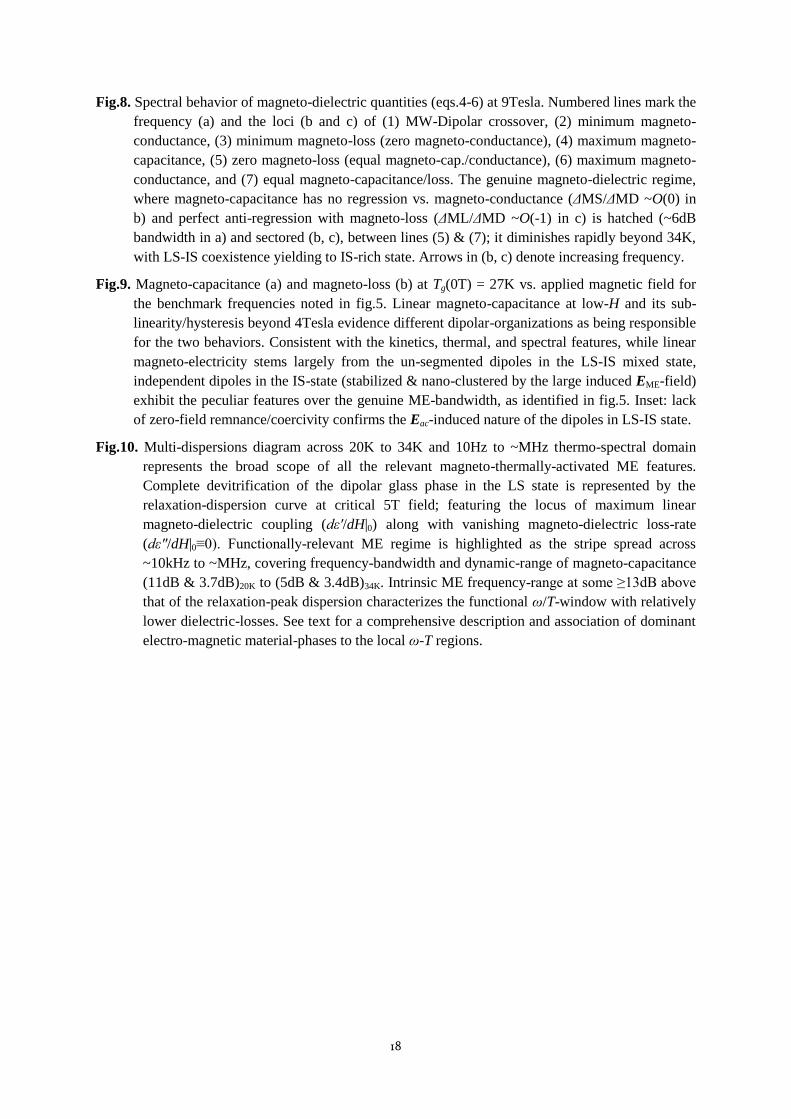
Fig.8. Spectral behavior of magneto-dielectric quantities (eqs.4-6) at 9Tesla. Numbered lines mark the
frequency (a) and the loci (b and c) of (1) MW-Dipolar crossover, (2) minimum magneto-
conductance, (3) minimum magneto-loss (zero magneto-conductance), (4) maximum magneto-
capacitance, (5) zero magneto-loss (equal magneto-cap./conductance), (6) maximum magneto-
conductance, and (7) equal magneto-capacitance/loss. The genuine magneto-dielectric regime,
where magneto-capacitance has no regression vs. magneto-conductance (ΔMS/ΔMD ~O(0) in
b) and perfect anti-regression with magneto-loss (ΔML/ΔMD ~O(-1) in c) is hatched (~6dB
bandwidth in a) and sectored (b, c), between lines (5) & (7); it diminishes rapidly beyond 34K,
with LS-IS coexistence yielding to IS-rich state. Arrows in (b, c) denote increasing frequency.
Fig.9. Magneto-capacitance (a) and magneto-loss (b) at Tg(0T) = 27K vs. applied magnetic field for
the benchmark frequencies noted in fig.5. Linear magneto-capacitance at low-H and its sub-
linearity/hysteresis beyond 4Tesla evidence different dipolar-organizations as being responsible
for the two behaviors. Consistent with the kinetics, thermal, and spectral features, while linear
magneto-electricity stems largely from the un-segmented dipoles in the LS-IS mixed state,
independent dipoles in the IS-state (stabilized & nano-clustered by the large induced EME-field)
exhibit the peculiar features over the genuine ME-bandwidth, as identified in fig.5. Inset: lack
of zero-field remnance/coercivity confirms the Eac-induced nature of the dipoles in LS-IS state.
Fig.10. Multi-dispersions diagram across 20K to 34K and 10Hz to ~MHz thermo-spectral domain
represents the broad scope of all the relevant magneto-thermally-activated ME features.
Complete devitrification of the dipolar glass phase in the LS state is represented by the
relaxation-dispersion curve at critical 5T field; featuring the locus of maximum linear
magneto-dielectric coupling (dε′/dH|0) along with vanishing magneto-dielectric loss-rate
(dε″/dH|0≡0). Functionally-relevant ME regime is highlighted as the stripe spread across
~10kHz to ~MHz, covering frequency-bandwidth and dynamic-range of magneto-capacitance
(11dB & 3.7dB)20K to (5dB & 3.4dB)34K. Intrinsic ME frequency-range at some ≥13dB above
that of the relaxation-peak dispersion characterizes the functional ω/T-window with relatively
lower dielectric-losses. See text for a comprehensive description and association of dominant
electro-magnetic material-phases to the local ω-T regions.
19
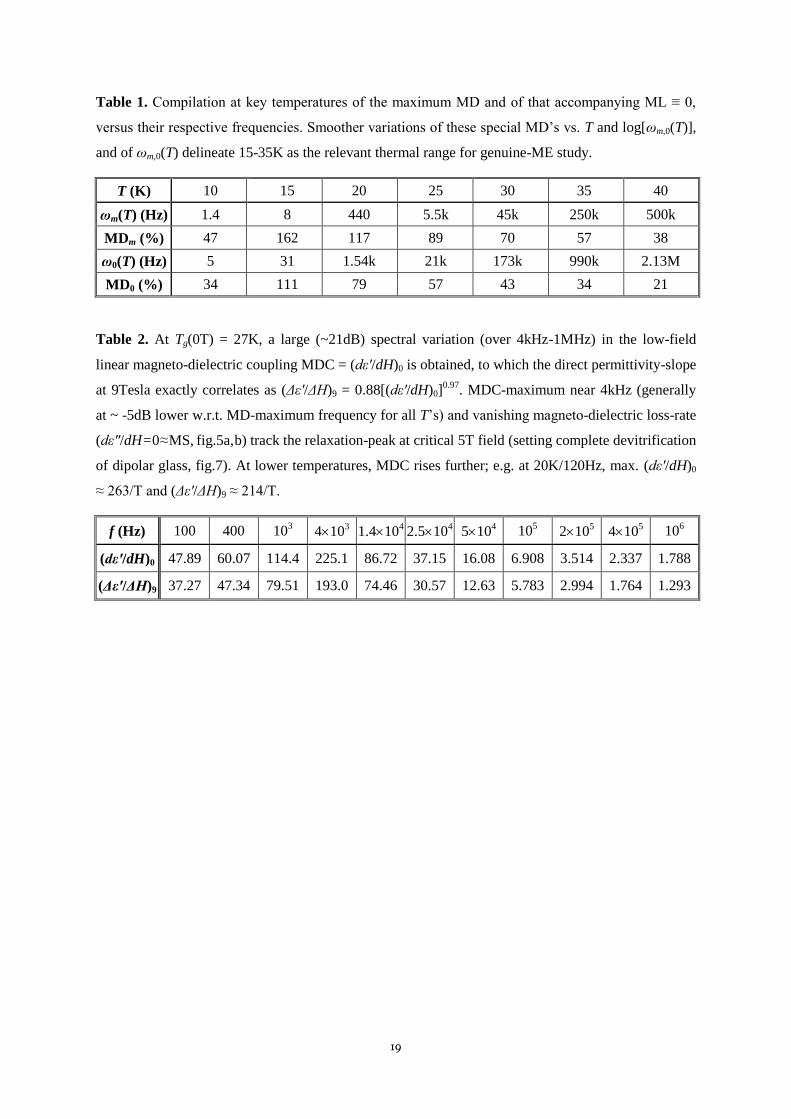
Table 1. Compilation at key temperatures of the maximum MD and of that accompanying ML ≡ 0,
versus their respective frequencies. Smoother variations of these special MD’s vs. T and log[ωm,0(T)],
and of ωm,0(T) delineate 15-35K as the relevant thermal range for genuine-ME study.
T (K) 10 15 20 25 30 35 40
ωm(T) (Hz) 1.4 8 440 5.5k 45k 250k 500k
MDm (%) 47 162 117 89 70 57 38
ω0(T) (Hz) 5 31 1.54k 21k 173k 990k 2.13M
MD0 (%) 34 111 79 57 43 34 21
Table 2. At Tg(0T) = 27K, a large (~21dB) spectral variation (over 4kHz-1MHz) in the low-field
linear magneto-dielectric coupling MDC = (dε′/dH)0 is obtained, to which the direct permittivity-slope
at 9Tesla exactly correlates as (Δε′/ΔH)9 = 0.88[(dε′/dH)0]0.97
. MDC-maximum near 4kHz (generally
at ~ -5dB lower w.r.t. MD-maximum frequency for all T’s) and vanishing magneto-dielectric loss-rate
(dε″/dH = 0 ≈ MS, fig.5a, b) track the relaxation-peak at critical 5T field (setting complete devitrification
of dipolar glass, fig.7). At lower temperatures, MDC rises further; e.g. at 20K/120Hz, max. (dε′/dH)0
≈ 263/T and (Δε′/ΔH)9 ≈ 214/T.
f (Hz) 100 400 103 410
3 1.410
4 2.510
4 510
4 10
5 210
5 410
5 10
6
(dε′/dH)0 47.89 60.07 114.4 225.1 86.72 37.15 16.08 6.908 3.514 2.337 1.788
(Δε′/ΔH)9 37.27 47.34 79.51 193.0 74.46 30.57 12.63 5.783 2.994 1.764 1.293
20
Fig.1
21
Fig.2
22
Fig.3
23
Fig.4
24
Fig.5
25
Fig.6
26
Fig.7
27
Fig.8
28
Fig.9
29
Fig.10