mae 1202: aerospace practicum lecture 8: airfoils and introduction to finite wings march 25, 2013...
TRANSCRIPT
MAE 1202: AEROSPACE PRACTICUM
Lecture 8: Airfoils and Introduction to Finite Wings
March 25, 2013
Mechanical and Aerospace Engineering Department
Florida Institute of Technology
D. R. Kirk

READING AND HOMEWORK ASSIGNMENTS• Reading: Introduction to Flight, by John D. Anderson, Jr.
– Next week, we will finish Chapter 5 in Anderson
– For next week’s lecture: Chapter 5, Sections 5.13-5.19
• Lecture-Based Homework Assignment:
– Problems: 5.7, 5.11, 5.13, 5.15, 5.17, 5.19
• DUE: Friday, March 29, 2013 by 5pm
• Turn in hard copy of homework
– Also be sure to review and be familiar with textbook examples in Chapter 5
• Rocket Project: March 29, 2013
– Do as complete of a literature review as your team can
– Pick an altitude and pick an engine – and tell me why
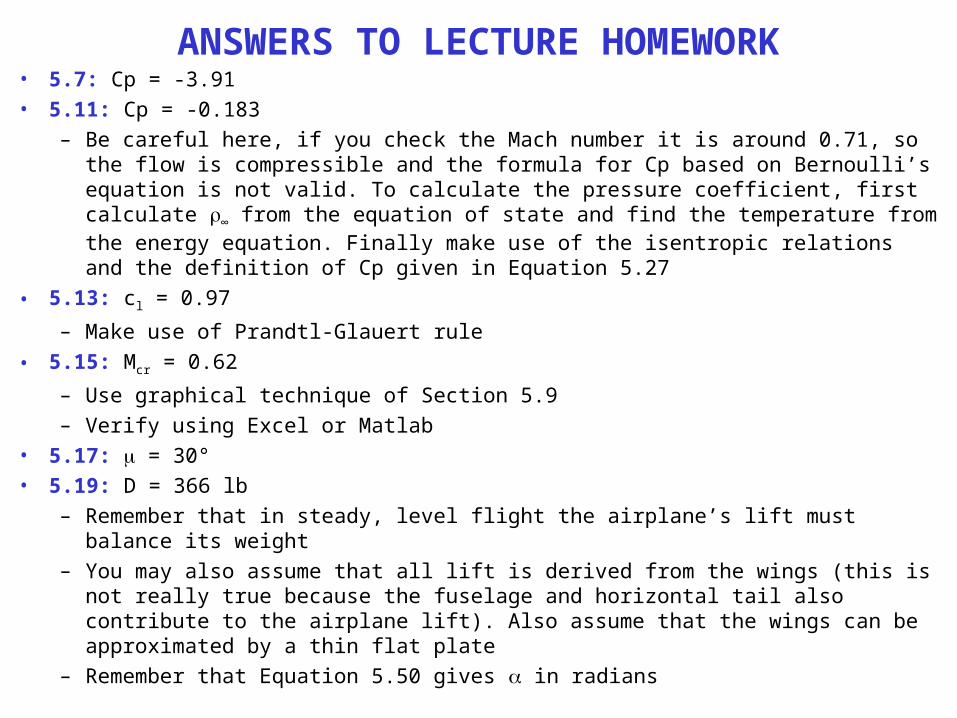
ANSWERS TO LECTURE HOMEWORK• 5.7: Cp = -3.91
• 5.11: Cp = -0.183
– Be careful here, if you check the Mach number it is around 0.71, so the flow is compressible and the formula for Cp based on Bernoulli’s equation is not valid. To calculate the pressure coefficient, first calculate ∞ from the equation of state and find the temperature from the energy equation. Finally make use of the isentropic relations and the definition of Cp given in Equation 5.27
• 5.13: cl = 0.97
– Make use of Prandtl-Glauert rule
• 5.15: Mcr = 0.62
– Use graphical technique of Section 5.9
– Verify using Excel or Matlab
• 5.17: = 30°
• 5.19: D = 366 lb
– Remember that in steady, level flight the airplane’s lift must balance its weight
– You may also assume that all lift is derived from the wings (this is not really true because the fuselage and horizontal tail also contribute to the airplane lift). Also assume that the wings can be approximated by a thin flat plate
– Remember that Equation 5.50 gives in radians
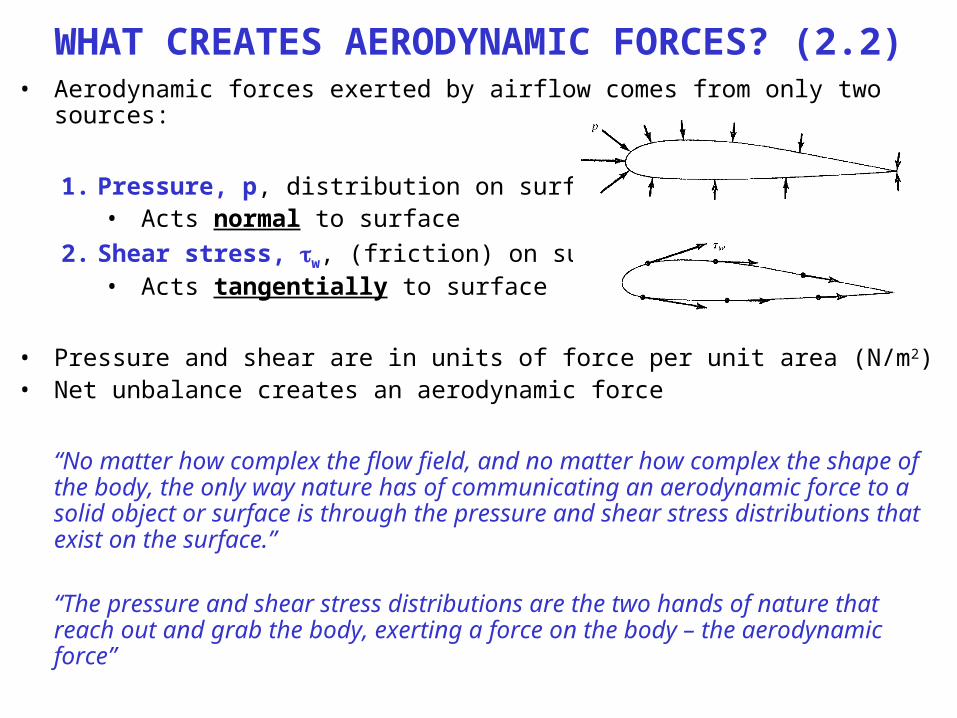
WHAT CREATES AERODYNAMIC FORCES? (2.2)• Aerodynamic forces exerted by airflow comes from only two sources:
1. Pressure, p, distribution on surface• Acts normal to surface
2. Shear stress, w, (friction) on surface• Acts tangentially to surface
• Pressure and shear are in units of force per unit area (N/m2)• Net unbalance creates an aerodynamic force
“No matter how complex the flow field, and no matter how complex the shape of the body, the only way nature has of communicating an aerodynamic force to a solid object or surface is through the pressure and shear stress distributions that exist on the surface.”
“The pressure and shear stress distributions are the two hands of nature that reach out and grab the body, exerting a force on the body – the aerodynamic force”
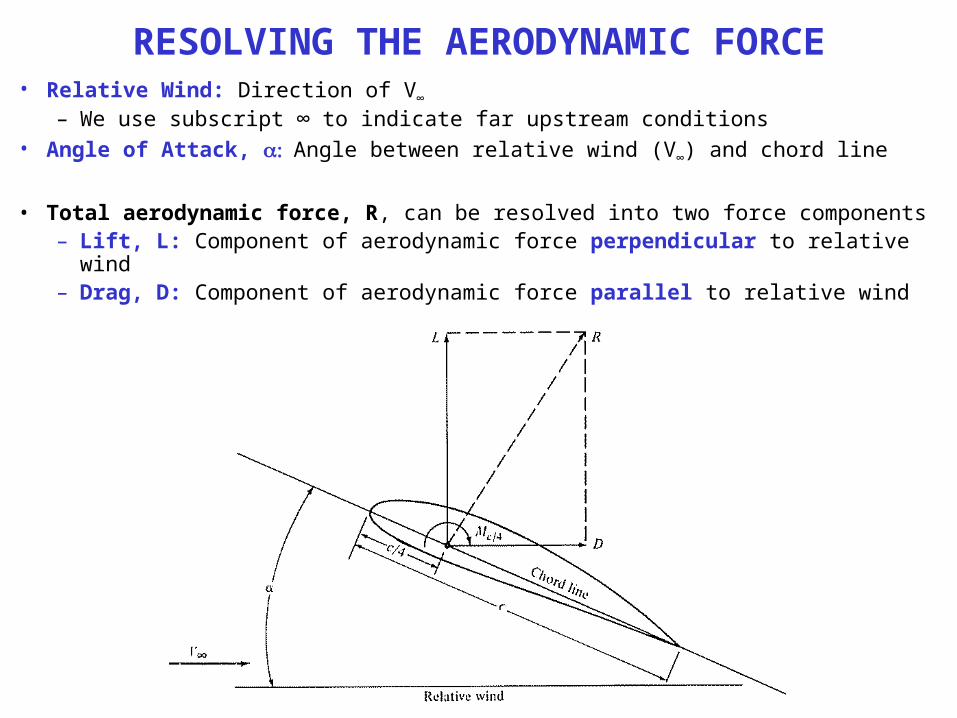
RESOLVING THE AERODYNAMIC FORCE• Relative Wind: Direction of V∞
– We use subscript ∞ to indicate far upstream conditions• Angle of Attack, Angle between relative wind (V∞) and chord line
• Total aerodynamic force, R, can be resolved into two force components– Lift, L: Component of aerodynamic force perpendicular to relative wind– Drag, D: Component of aerodynamic force parallel to relative wind
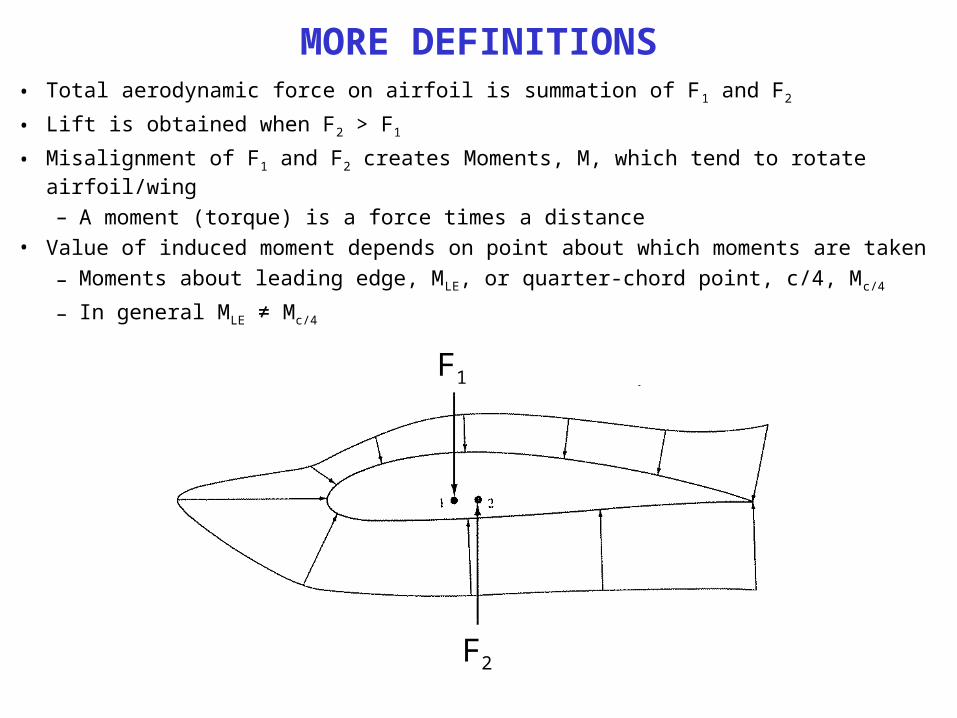
MORE DEFINITIONS• Total aerodynamic force on airfoil is summation of F1 and F2
• Lift is obtained when F2 > F1
• Misalignment of F1 and F2 creates Moments, M, which tend to rotate airfoil/wing
– A moment (torque) is a force times a distance
• Value of induced moment depends on point about which moments are taken
– Moments about leading edge, MLE, or quarter-chord point, c/4, Mc/4
– In general MLE ≠ Mc/4
F1
F2
VARIATION OF L, D, AND M WITH • Lift, Drag, and Moments on a airfoil or wing change as changes
• Variations of these quantities are important information for airplane designers
• Aerodynamic Center
– Point about which moments essentially do not vary with – Mac=constant (independent of )
– For low speed airfoils aerodynamic center is near quarter-chord point, c/4
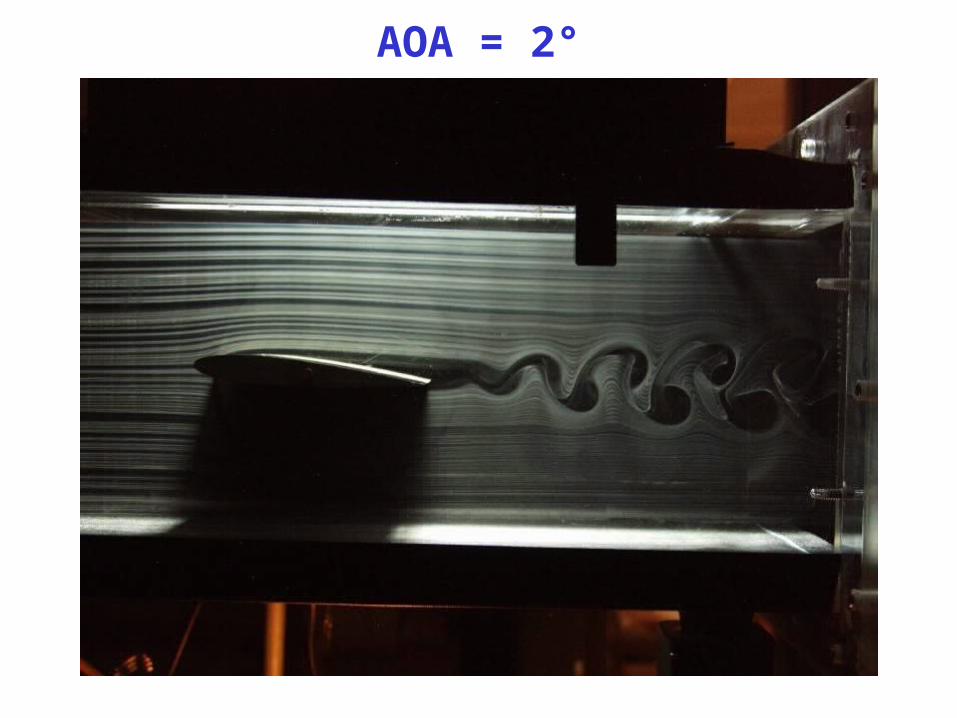
AOA = 2°
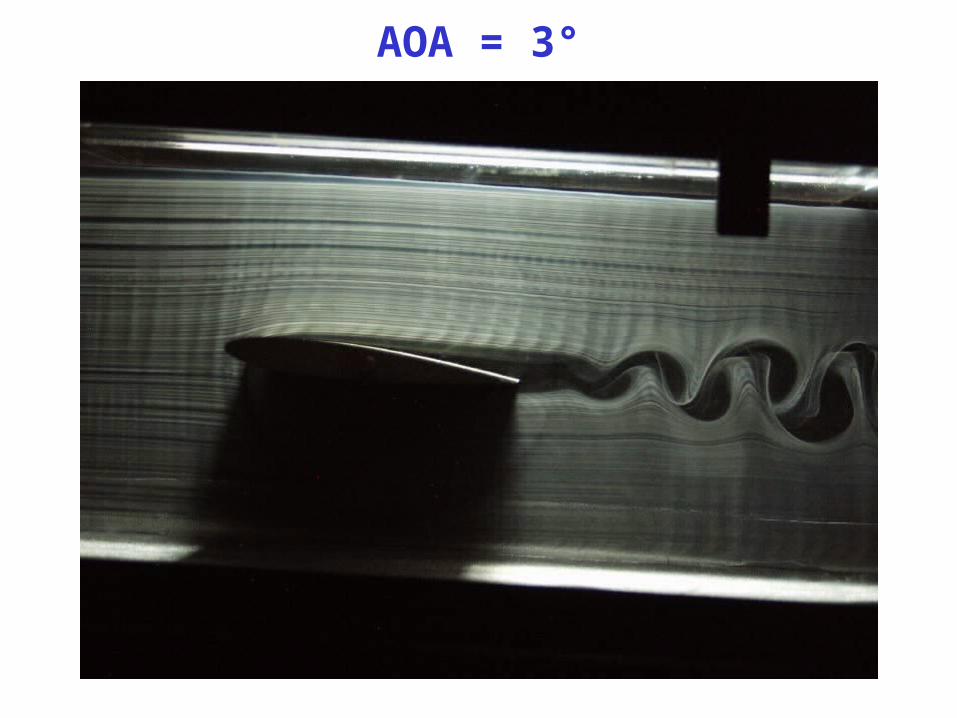
AOA = 3°
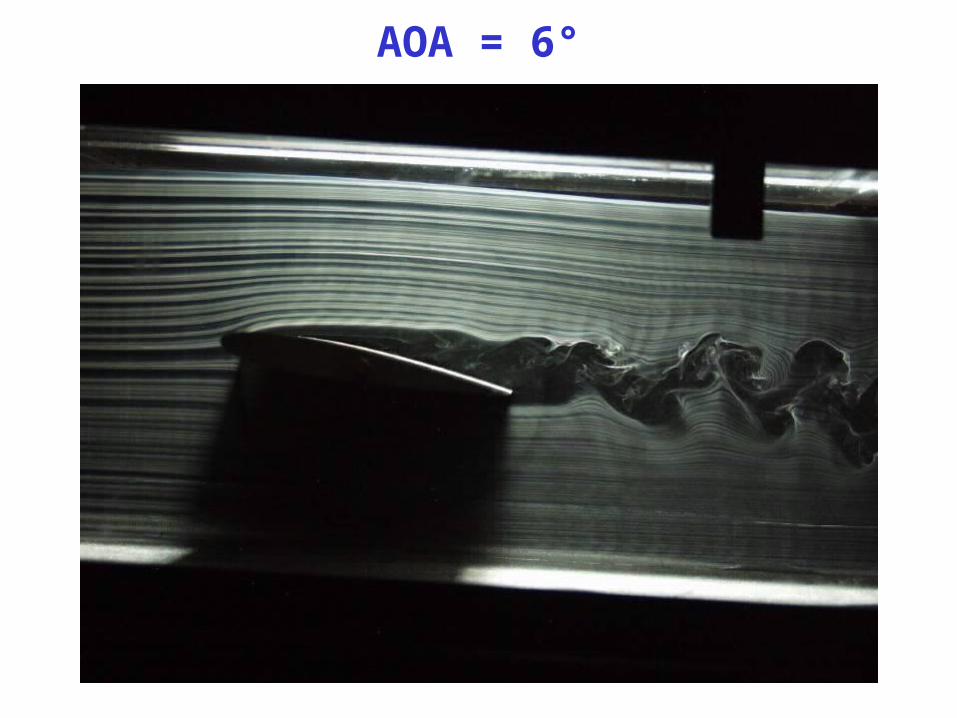
AOA = 6°

AOA = 9°
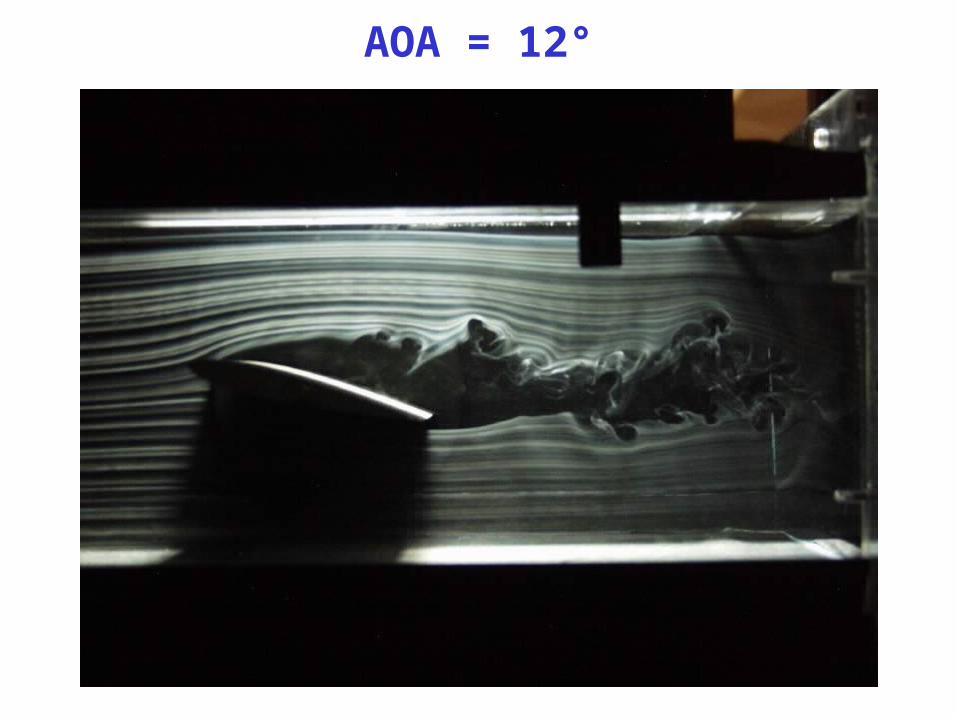
AOA = 12°
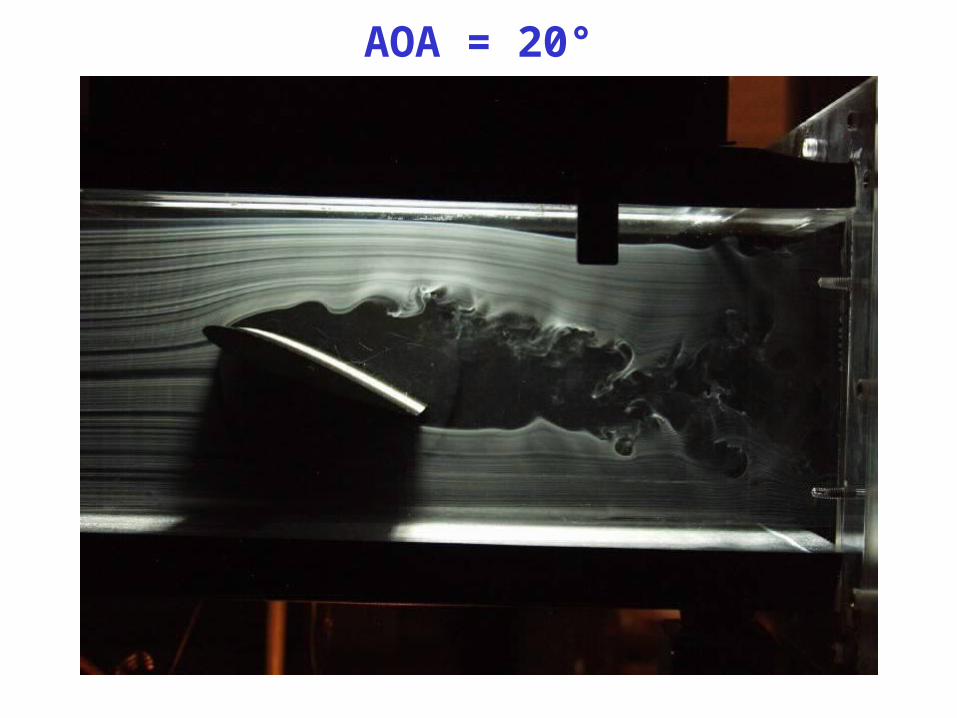
AOA = 20°
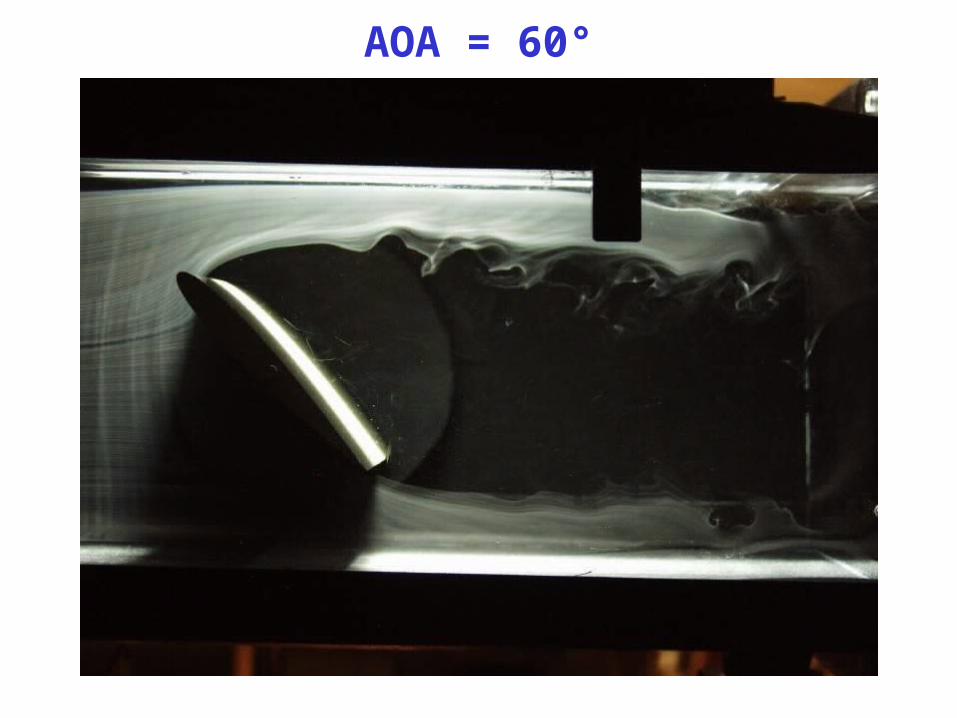
AOA = 60°
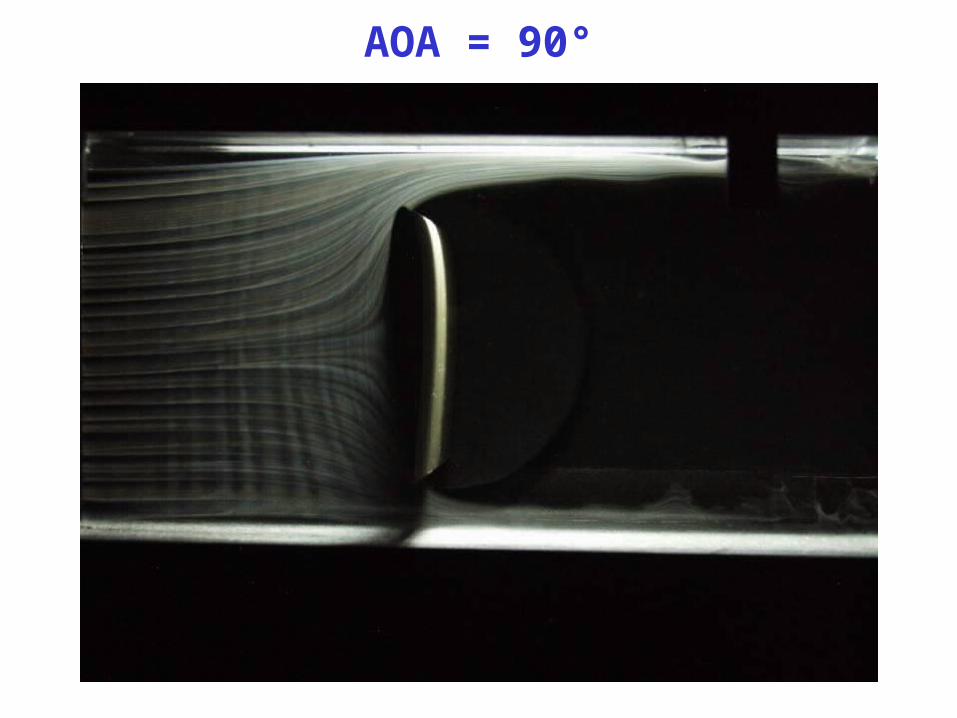
AOA = 90°
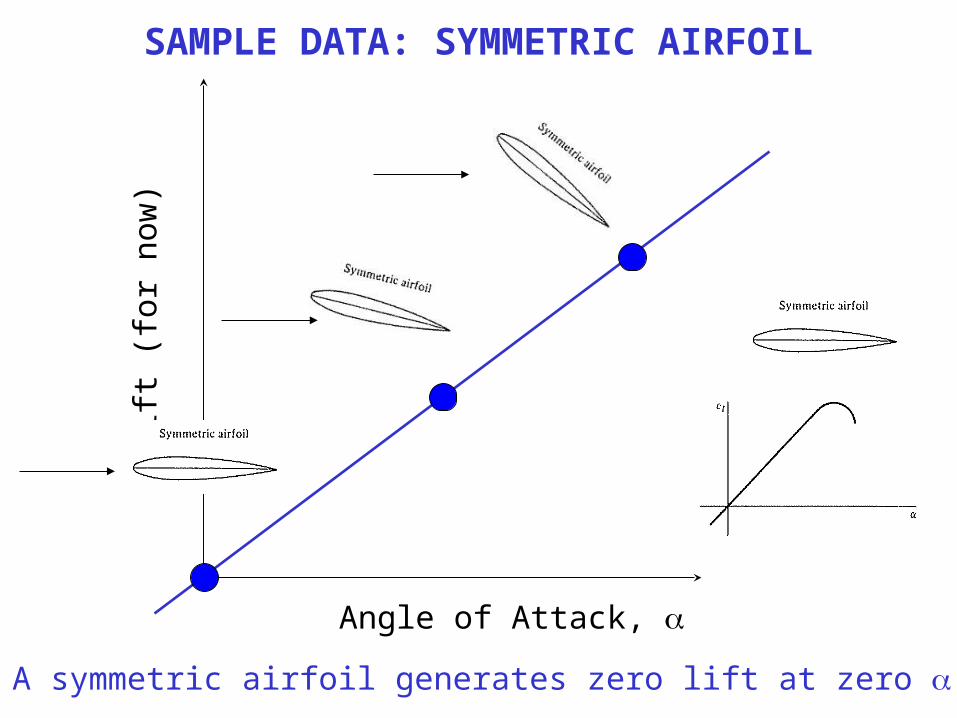
SAMPLE DATA: SYMMETRIC AIRFOIL
Lif
t (fo
r no
w)
Angle of Attack,
A symmetric airfoil generates zero lift at zero
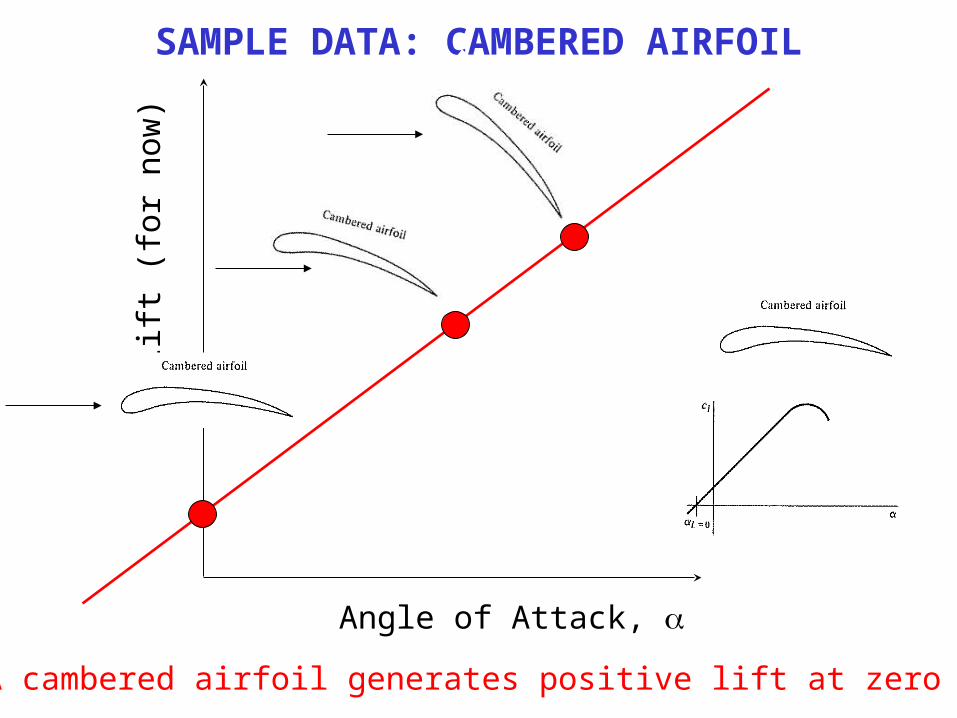
SAMPLE DATA: CAMBERED AIRFOIL
Lif
t (fo
r no
w)
Angle of Attack,
A cambered airfoil generates positive lift at zero
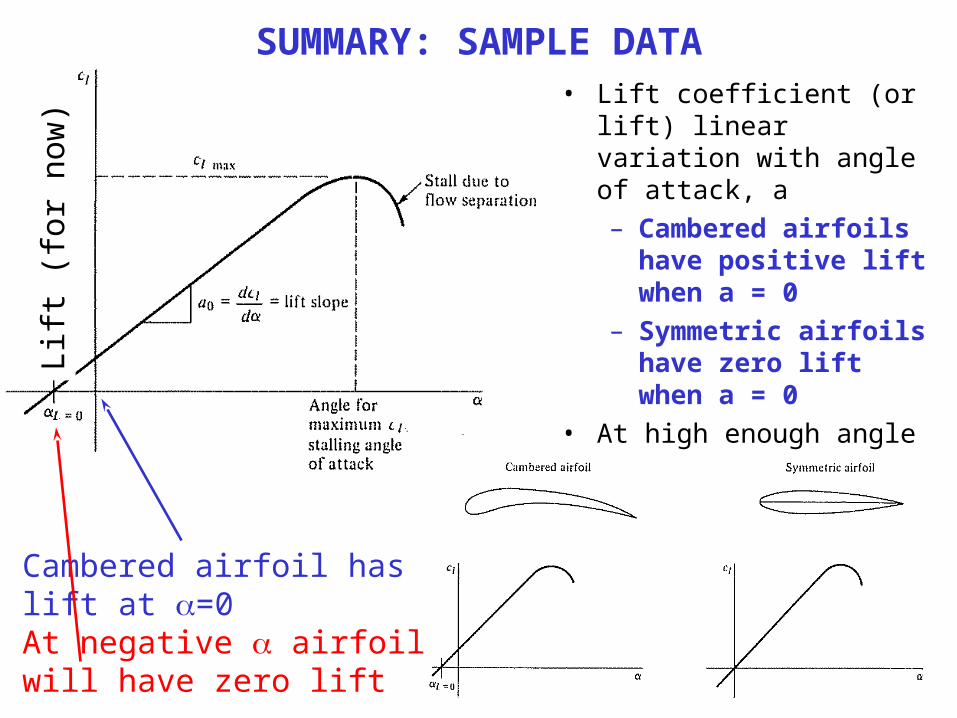
SUMMARY: SAMPLE DATA• Lift coefficient (or lift) linear
variation with angle of attack, a
– Cambered airfoils have positive lift when a = 0
– Symmetric airfoils have zero lift when a = 0
• At high enough angle of attack, performance of airfoil rapidly degrades → stall
Lif
t (fo
r no
w)
Cambered airfoil haslift at =0At negative airfoilwill have zero lift
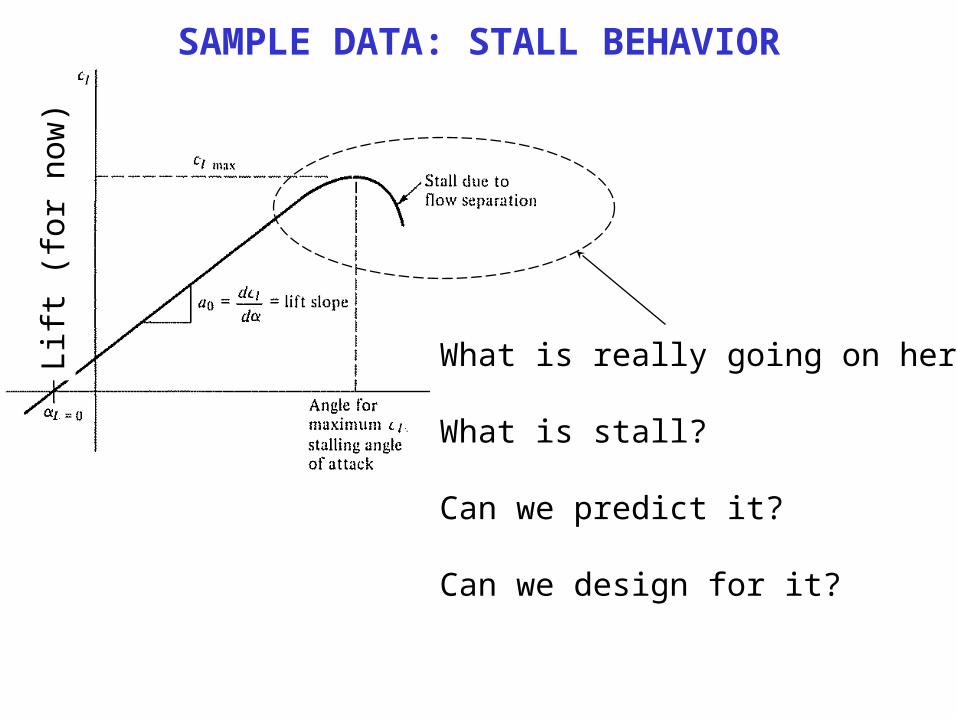
SAMPLE DATA: STALL BEHAVIORL
ift (
for
now
)
What is really going on here
What is stall?
Can we predict it?
Can we design for it?
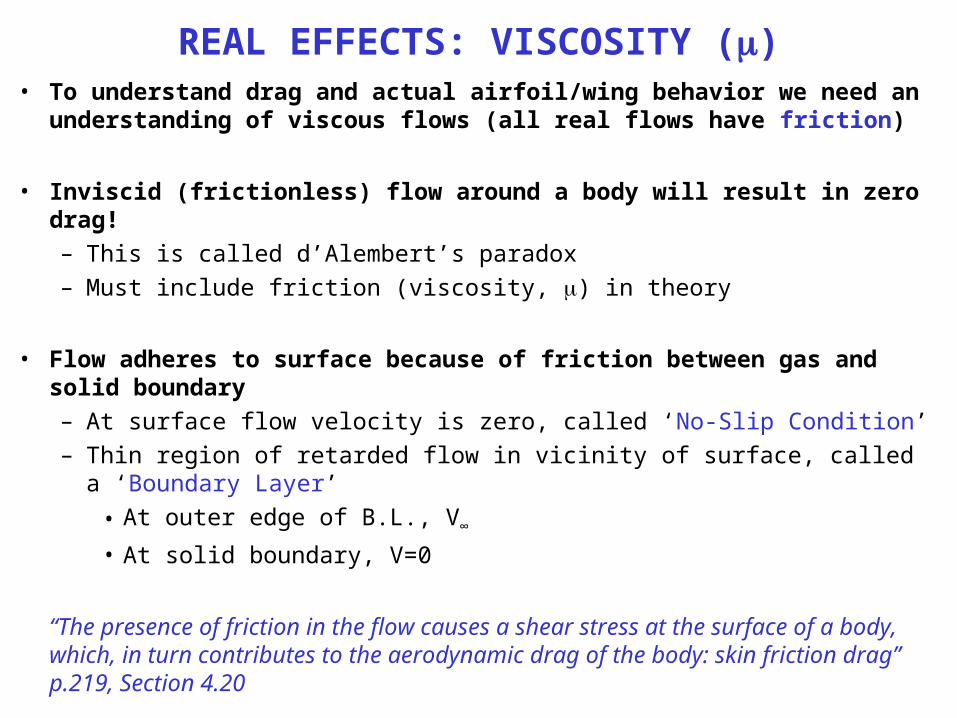
REAL EFFECTS: VISCOSITY ()• To understand drag and actual airfoil/wing behavior we need an
understanding of viscous flows (all real flows have friction)
• Inviscid (frictionless) flow around a body will result in zero drag!
– This is called d’Alembert’s paradox
– Must include friction (viscosity, ) in theory
• Flow adheres to surface because of friction between gas and solid boundary
– At surface flow velocity is zero, called ‘No-Slip Condition’
– Thin region of retarded flow in vicinity of surface, called a ‘Boundary Layer’
• At outer edge of B.L., V∞
• At solid boundary, V=0
“The presence of friction in the flow causes a shear stress at the surface of a body, which, in turn contributes to the aerodynamic drag of the body: skin friction drag” p.219, Section 4.20
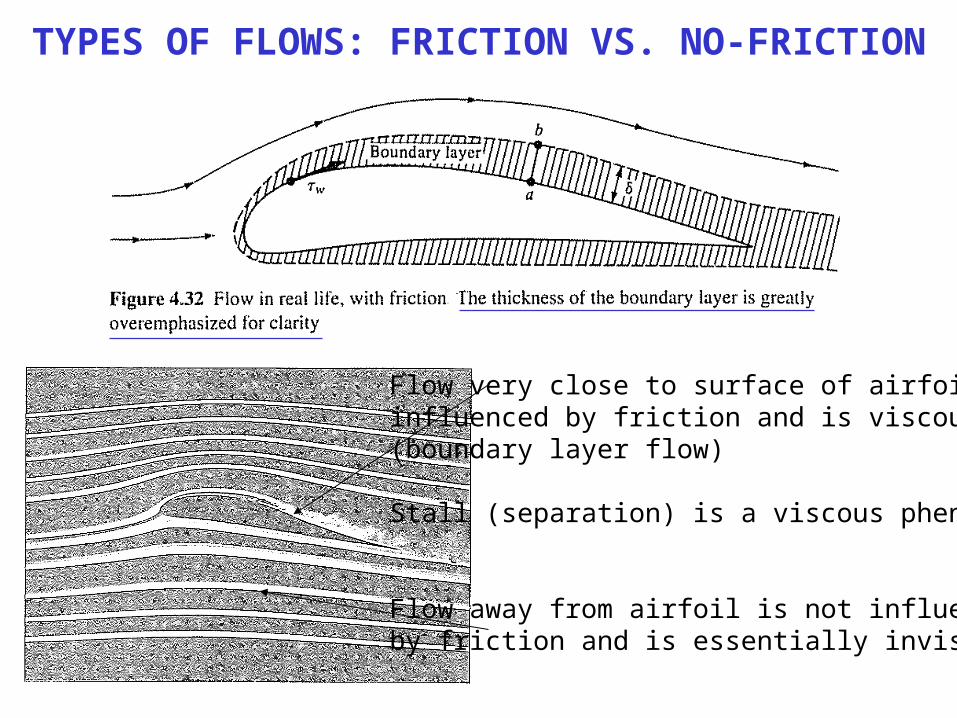
TYPES OF FLOWS: FRICTION VS. NO-FRICTION
Flow very close to surface of airfoil isinfluenced by friction and is viscous(boundary layer flow)
Stall (separation) is a viscous phenomena
Flow away from airfoil is not influencedby friction and is essentially inviscid
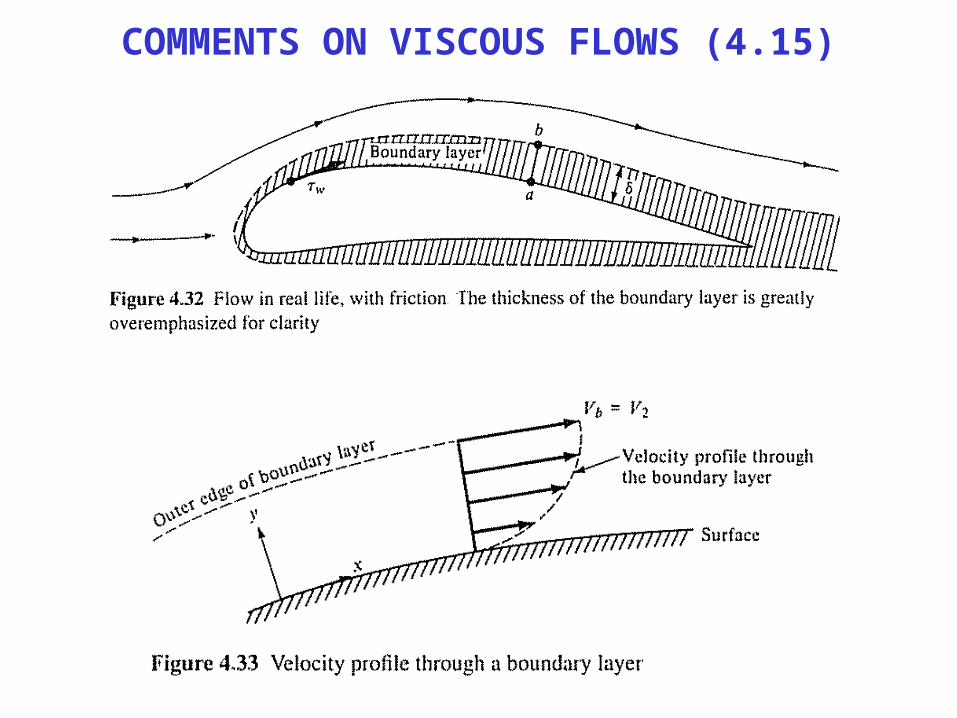
COMMENTS ON VISCOUS FLOWS (4.15)
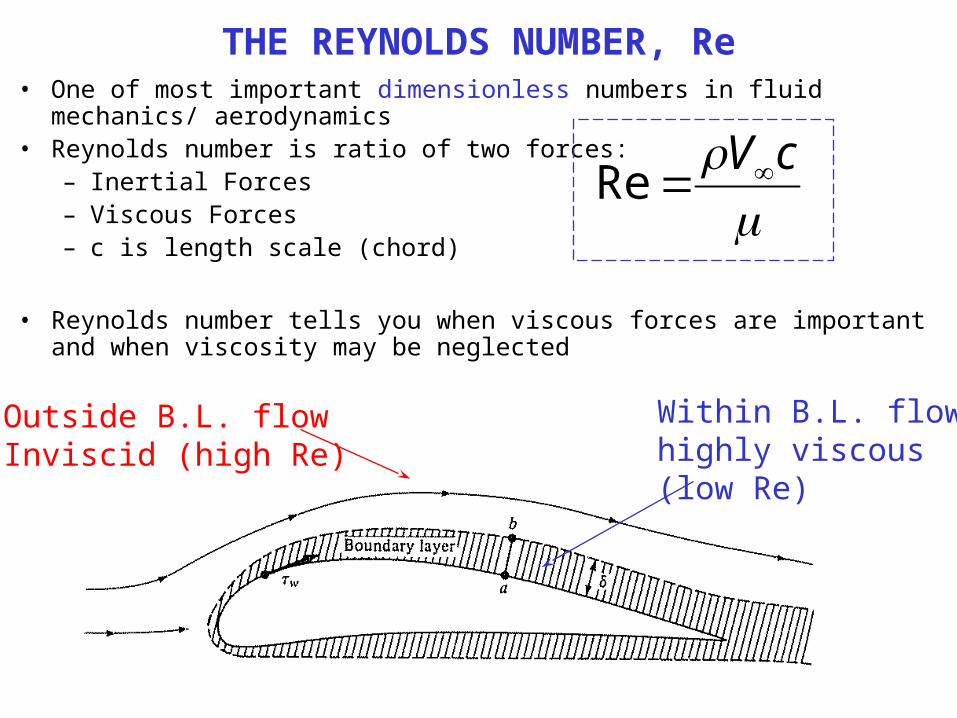
THE REYNOLDS NUMBER, Re• One of most important dimensionless numbers in fluid mechanics/ aerodynamics• Reynolds number is ratio of two forces:
– Inertial Forces– Viscous Forces– c is length scale (chord)
• Reynolds number tells you when viscous forces are important and when viscosity may be neglected
cVRe
Within B.L. flowhighly viscous(low Re)
Outside B.L. flowInviscid (high Re)
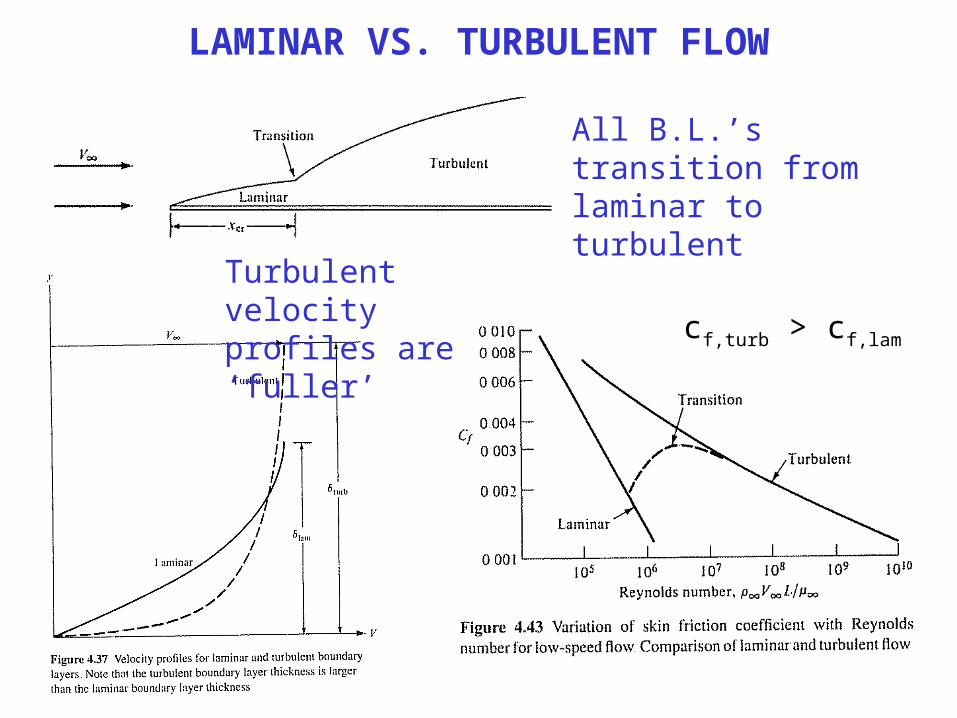
LAMINAR VS. TURBULENT FLOW
All B.L.’s transition from laminar to turbulent
cf,turb > cf,lam
Turbulent velocityprofiles are ‘fuller’
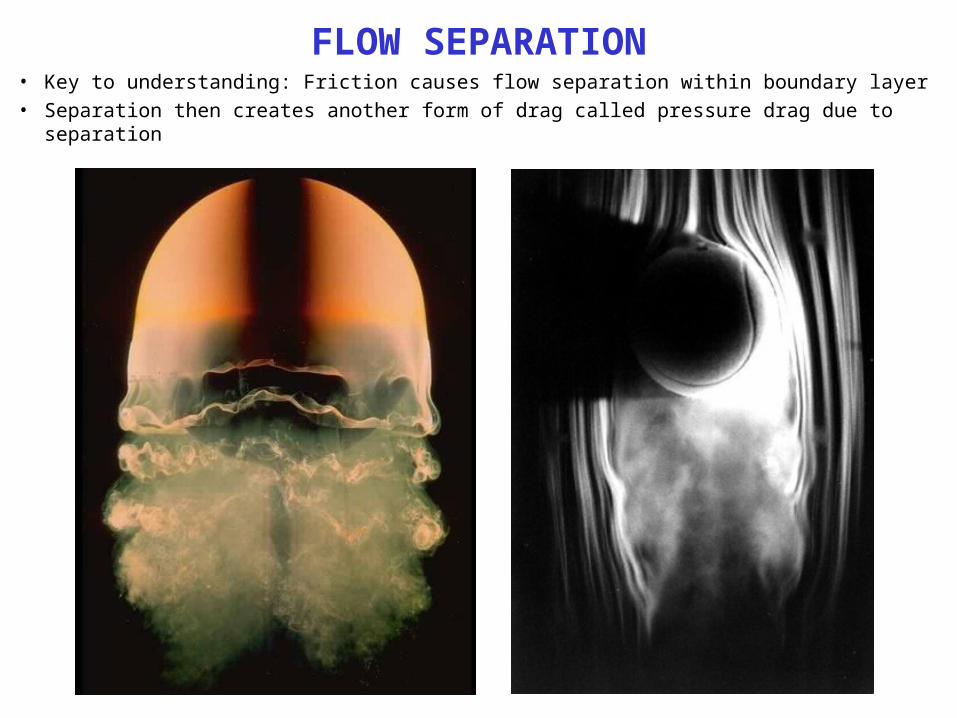
FLOW SEPARATION• Key to understanding: Friction causes flow separation within boundary layer
• Separation then creates another form of drag called pressure drag due to separation
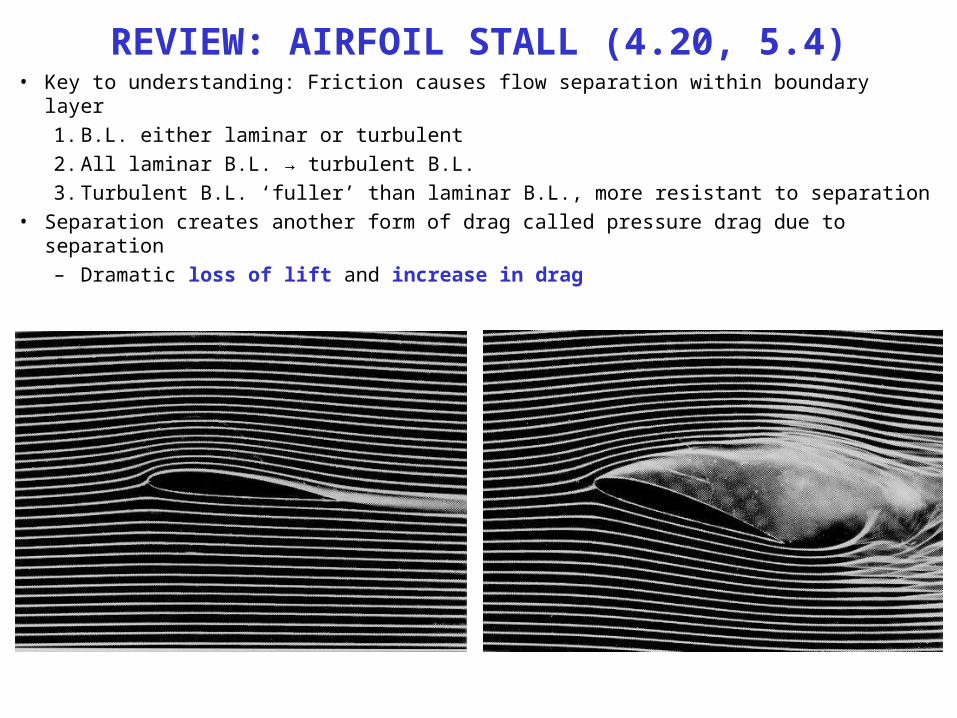
REVIEW: AIRFOIL STALL (4.20, 5.4)• Key to understanding: Friction causes flow separation within boundary layer
1. B.L. either laminar or turbulent
2. All laminar B.L. → turbulent B.L.
3. Turbulent B.L. ‘fuller’ than laminar B.L., more resistant to separation
• Separation creates another form of drag called pressure drag due to separation
– Dramatic loss of lift and increase in drag
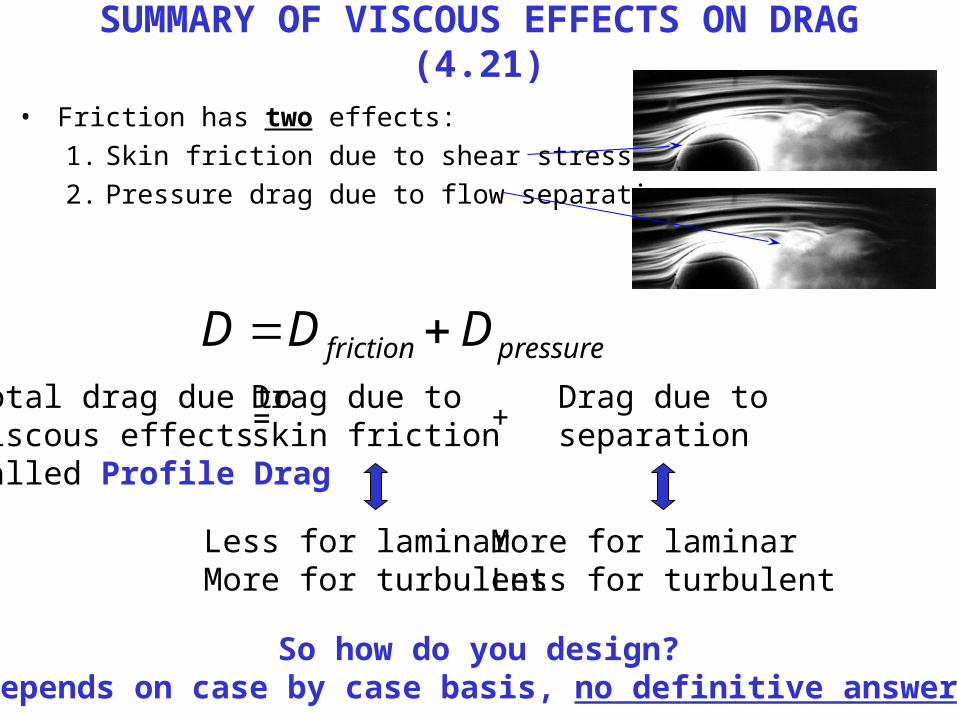
SUMMARY OF VISCOUS EFFECTS ON DRAG (4.21)
• Friction has two effects:
1. Skin friction due to shear stress at wall
2. Pressure drag due to flow separation
pressurefriction DDD Total drag due toviscous effectsCalled Profile Drag
Drag due toskin friction
Drag due toseparation= +
Less for laminarMore for turbulent
More for laminarLess for turbulent
So how do you design?Depends on case by case basis, no definitive answer!
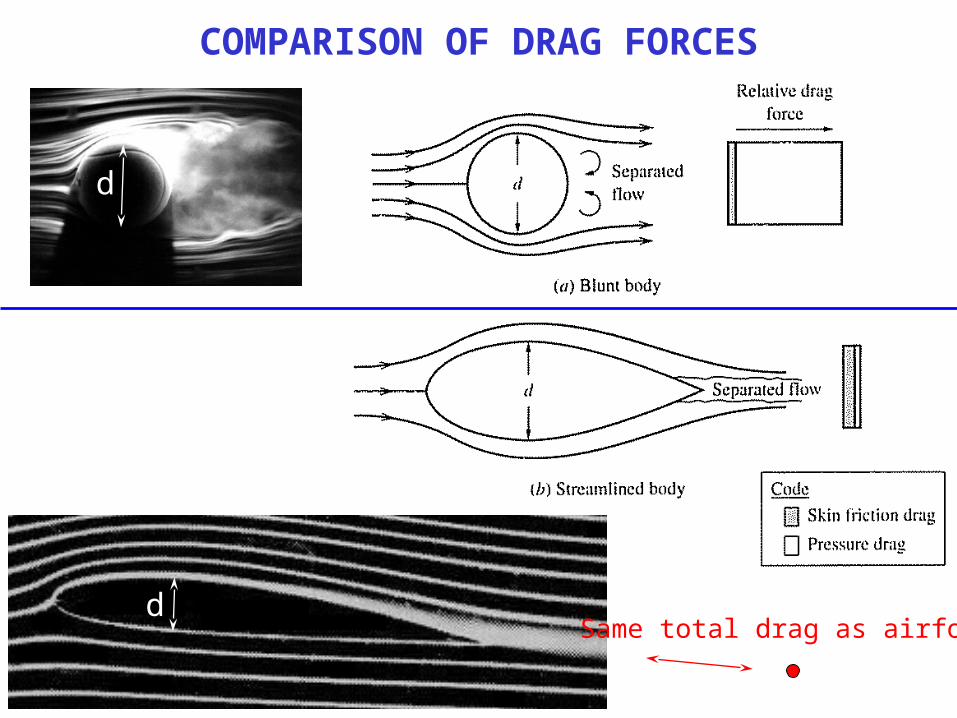
COMPARISON OF DRAG FORCES
d
d
Same total drag as airfoil
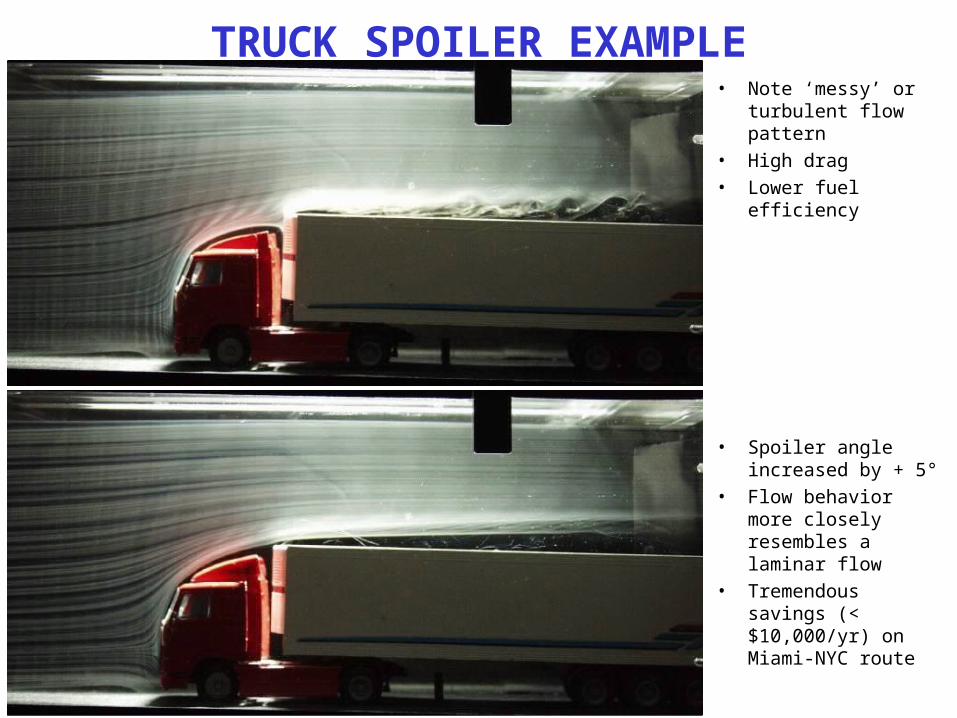
TRUCK SPOILER EXAMPLE• Note ‘messy’ or
turbulent flow pattern
• High drag
• Lower fuel efficiency
• Spoiler angle increased by + 5°
• Flow behavior more closely resembles a laminar flow
• Tremendous savings (< $10,000/yr) on Miami-NYC route
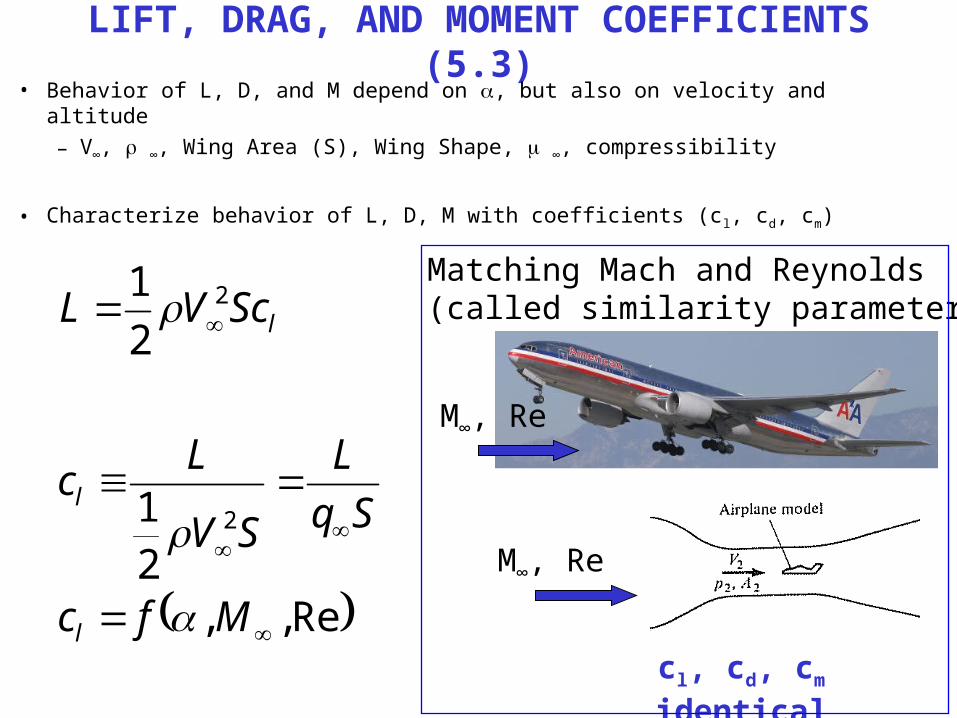
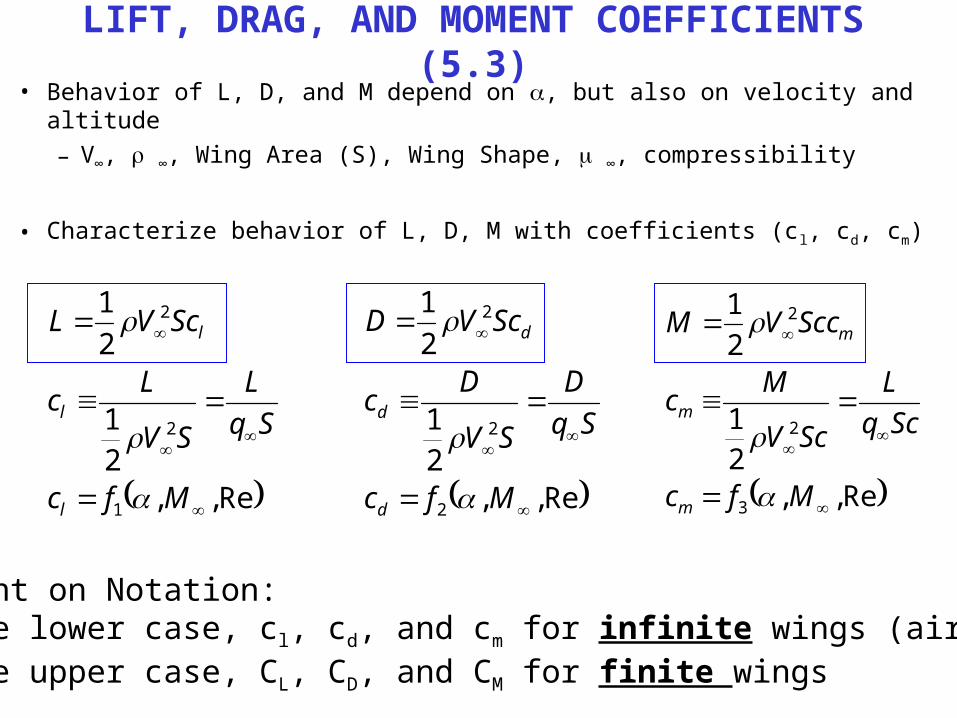
LIFT, DRAG, AND MOMENT COEFFICIENTS (5.3)• Behavior of L, D, and M depend on , but also on velocity and altitude
– V∞, ∞, Wing Area (S), Wing Shape, ∞, compressibility
• Characterize behavior of L, D, M with coefficients (cl, cd, cm)
Re,,21
2
1
2
2
Mfc
Sq
L
SV
Lc
ScVL
l
l
l
Matching Mach and Reynolds(called similarity parameters)
M∞, Re
M∞, Re
cl, cd, cm identical
LIFT, DRAG, AND MOMENT COEFFICIENTS (5.3)• Behavior of L, D, and M depend on , but also on velocity and altitude
– V∞, ∞, Wing Area (S), Wing Shape, ∞, compressibility
• Characterize behavior of L, D, M with coefficients (cl, cd, cm)
Re,,21
2
1
3
2
2
Mfc
Scq
L
ScV
Mc
SccVM
m
m
m
Re,,21
2
1
2
2
2
Mfc
Sq
D
SV
Dc
ScVD
d
d
d
Re,,21
2
1
1
2
2
Mfc
Sq
L
SV
Lc
ScVL
l
l
l
Comment on Notation:We use lower case, cl, cd, and cm for infinite wings (airfoils)We use upper case, CL, CD, and CM for finite wings
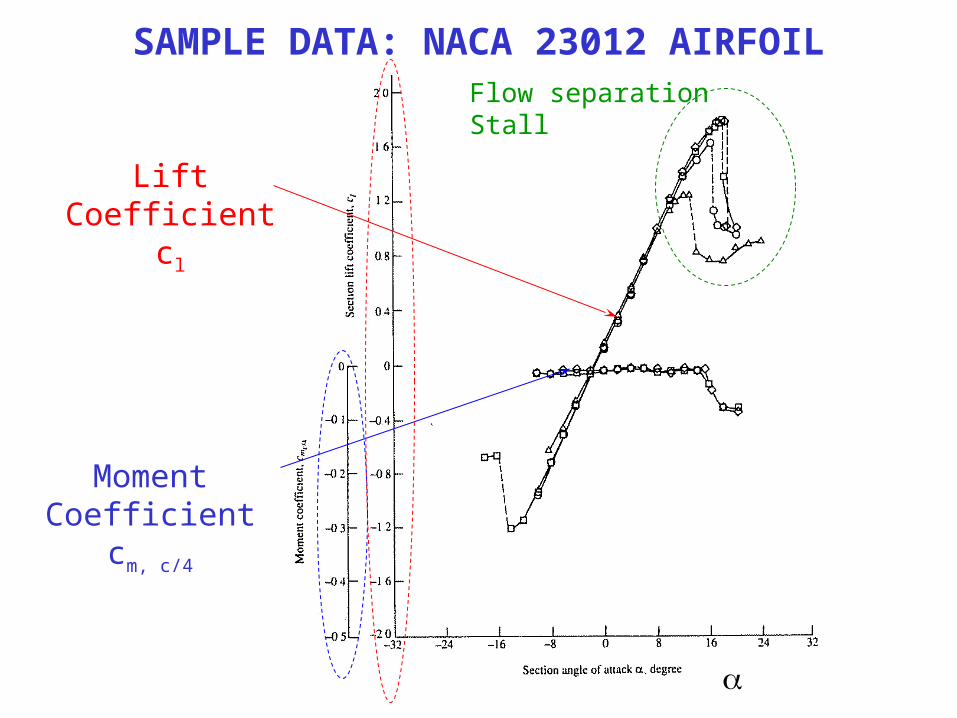
SAMPLE DATA: NACA 23012 AIRFOIL
Lift Coefficientcl
Moment Coefficientcm, c/4
Flow separationStall
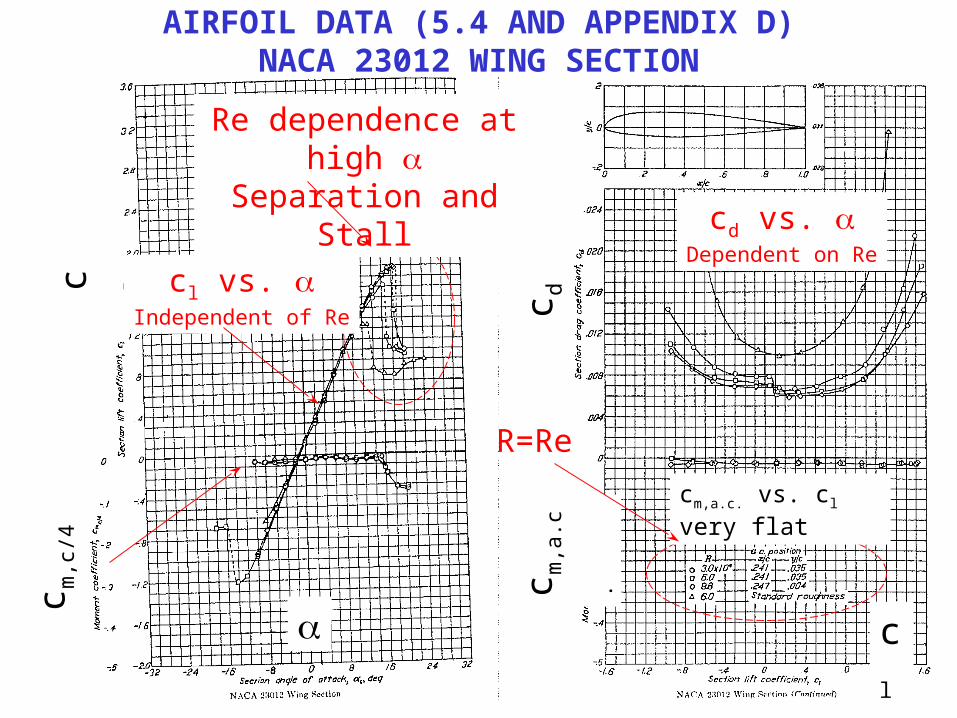
AIRFOIL DATA (5.4 AND APPENDIX D)NACA 23012 WING SECTION
c l
c m,c
/4
Re dependence at high Separation and Stall
cl
c dc m
,a.c
.
cl vs. Independent of Re
cd vs. Dependent on Re
cm,a.c. vs. cl very flat
R=Re
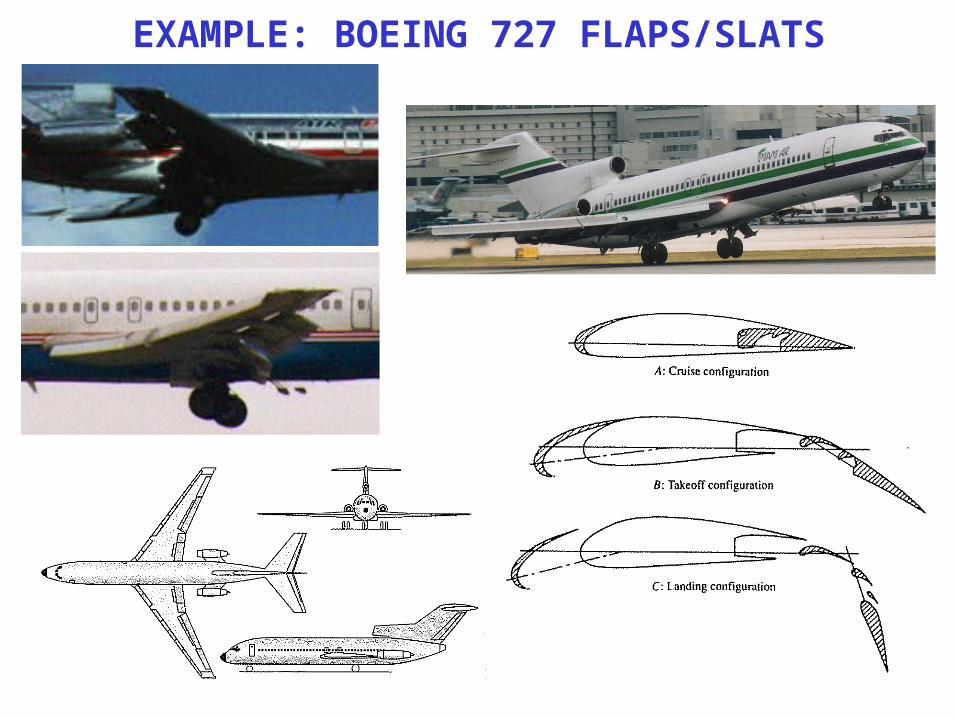
EXAMPLE: BOEING 727 FLAPS/SLATS
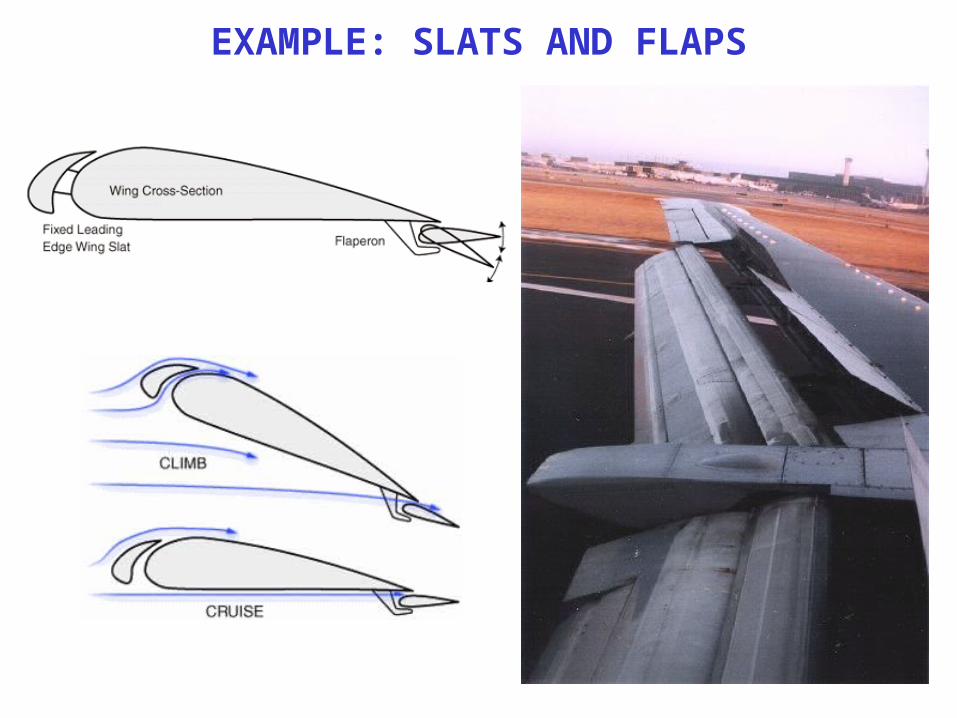
EXAMPLE: SLATS AND FLAPS
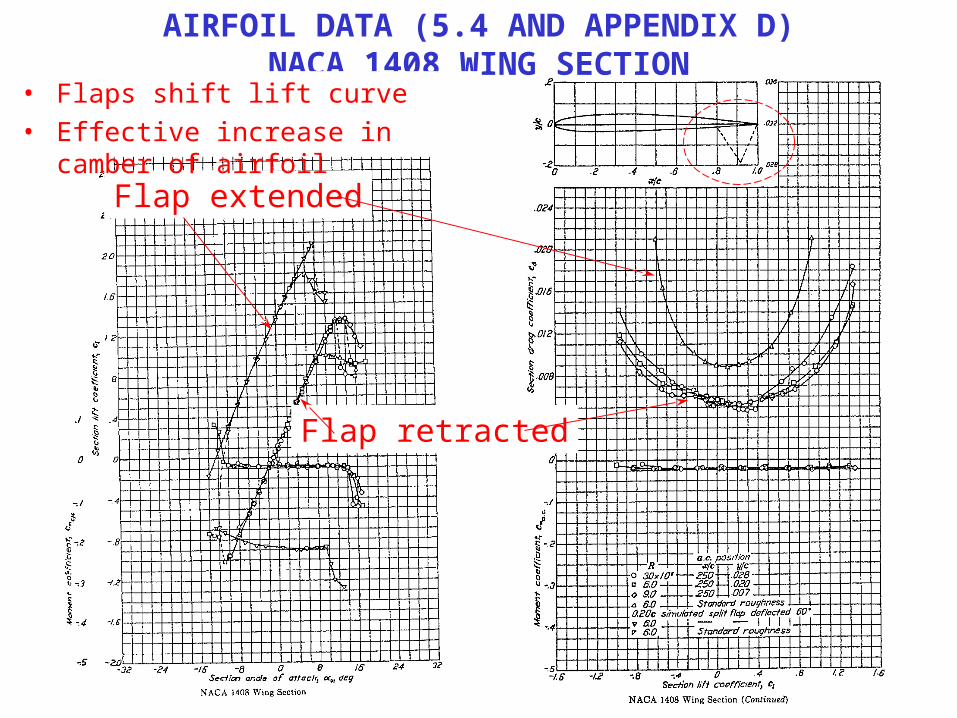
Flap extended
Flap retracted
AIRFOIL DATA (5.4 AND APPENDIX D)NACA 1408 WING SECTION
• Flaps shift lift curve
• Effective increase in camber of airfoil
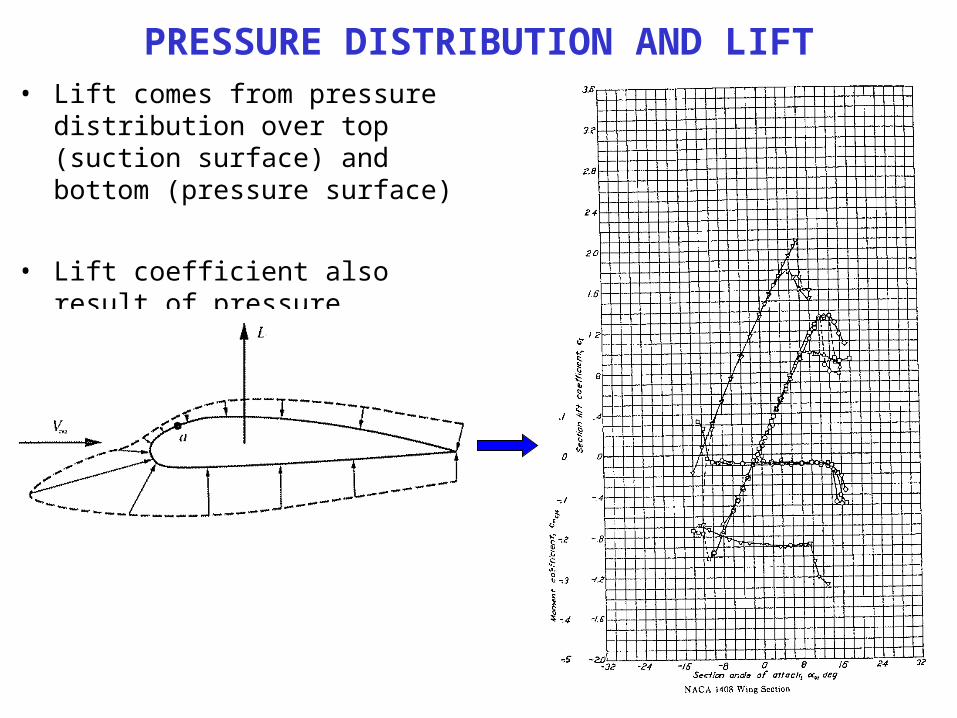
PRESSURE DISTRIBUTION AND LIFT• Lift comes from pressure distribution
over top (suction surface) and bottom (pressure surface)
• Lift coefficient also result of pressure distribution
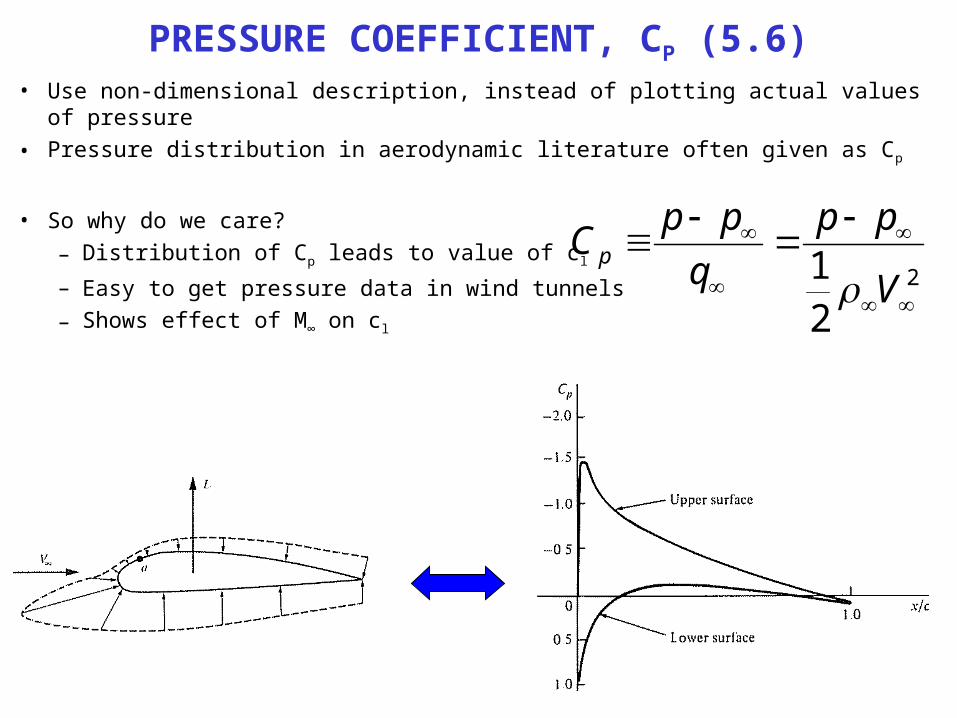
PRESSURE COEFFICIENT, CP (5.6)• Use non-dimensional description, instead of plotting actual values of pressure
• Pressure distribution in aerodynamic literature often given as Cp
• So why do we care?
– Distribution of Cp leads to value of cl
– Easy to get pressure data in wind tunnels
– Shows effect of M∞ on cl
2
21
V
pp
q
ppC p
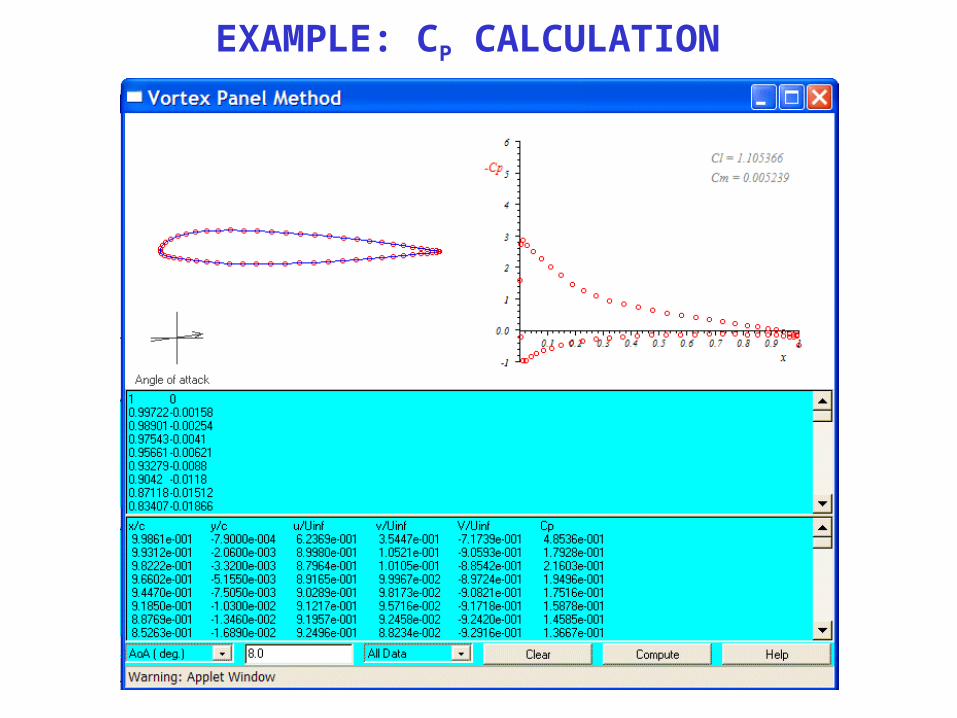
EXAMPLE: CP CALCULATION

For M∞ < 0.3, ~ constCp = Cp,0 = 0.5 = const
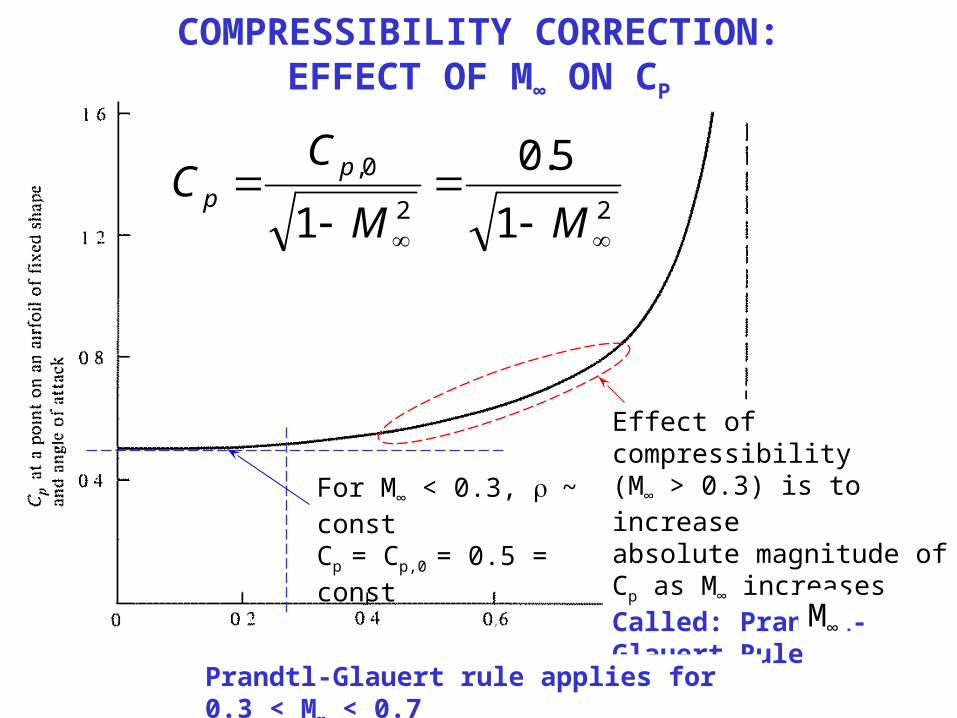
COMPRESSIBILITY CORRECTION:EFFECT OF M∞ ON CP
20,
21
V
ppC p
M∞
22
0,
1
5.0
1
MM
CC p
p
For M∞ < 0.3, ~ constCp = Cp,0 = 0.5 = const
Effect of compressibility(M∞ > 0.3) is to increaseabsolute magnitude of Cp as M∞ increasesCalled: Prandtl-Glauert Rule
Prandtl-Glauert rule applies for 0.3 < M∞ < 0.7
COMPRESSIBILITY CORRECTION:EFFECT OF M∞ ON CP
M∞
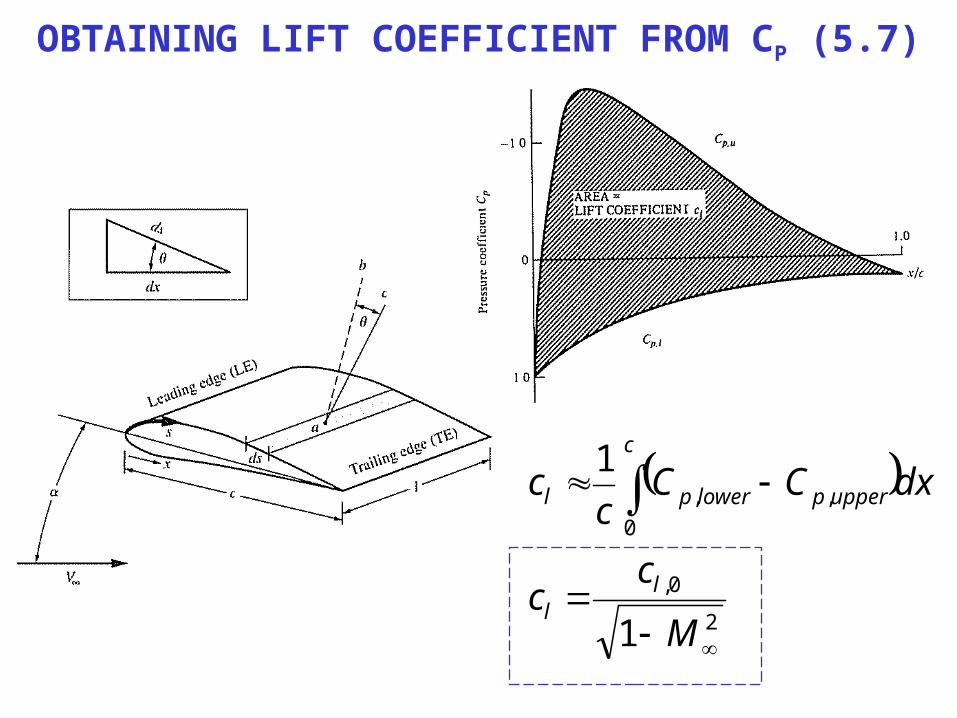
OBTAINING LIFT COEFFICIENT FROM CP (5.7)
2
0,
0
,,
1
1
M
cc
dxCCc
c
ll
c
upperplowerpl
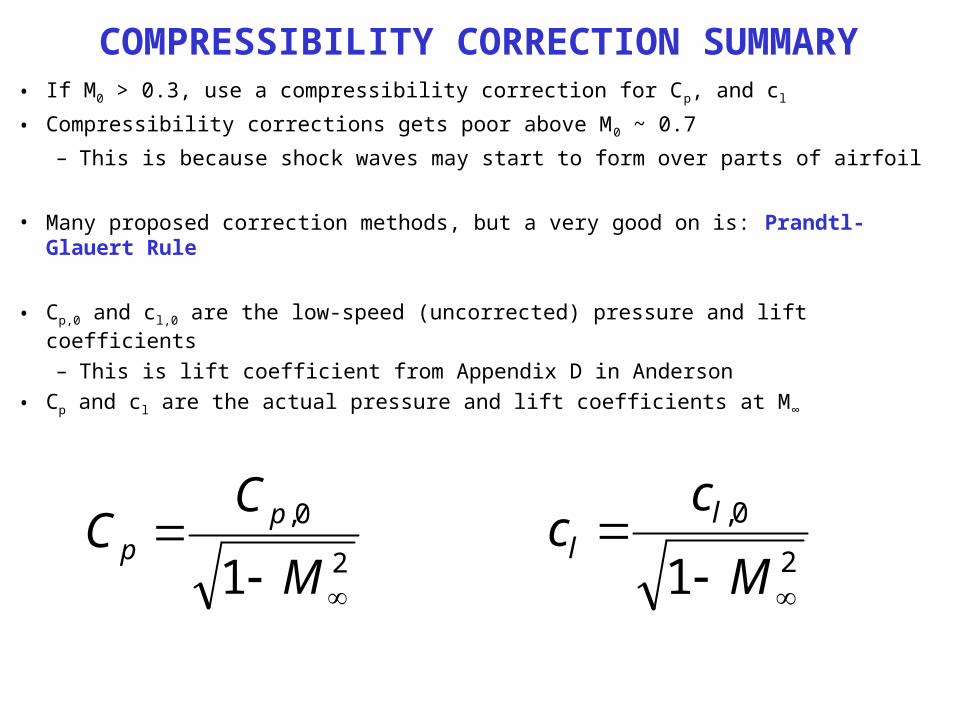
COMPRESSIBILITY CORRECTION SUMMARY• If M0 > 0.3, use a compressibility correction for Cp, and cl
• Compressibility corrections gets poor above M0 ~ 0.7
– This is because shock waves may start to form over parts of airfoil
• Many proposed correction methods, but a very good on is: Prandtl-Glauert Rule
• Cp,0 and cl,0 are the low-speed (uncorrected) pressure and lift coefficients
– This is lift coefficient from Appendix D in Anderson
• Cp and cl are the actual pressure and lift coefficients at M∞
2
0,
1
M
CC p
p 2
0,
1
M
cc l
l
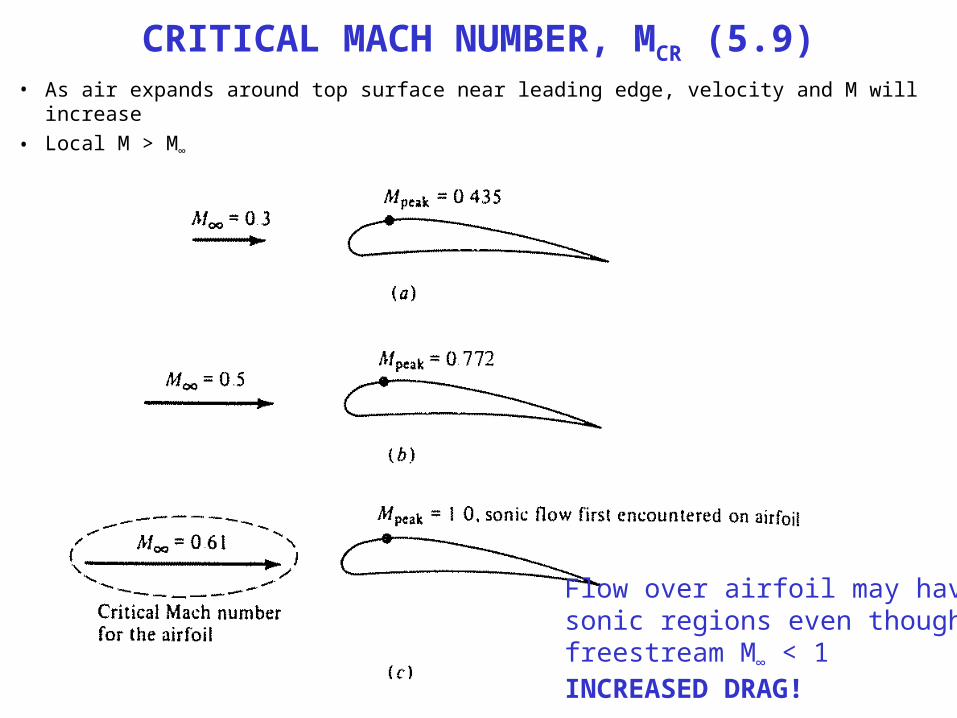
CRITICAL MACH NUMBER, MCR (5.9)• As air expands around top surface near leading edge, velocity and M will increase
• Local M > M∞
Flow over airfoil may havesonic regions even thoughfreestream M∞ < 1INCREASED DRAG!
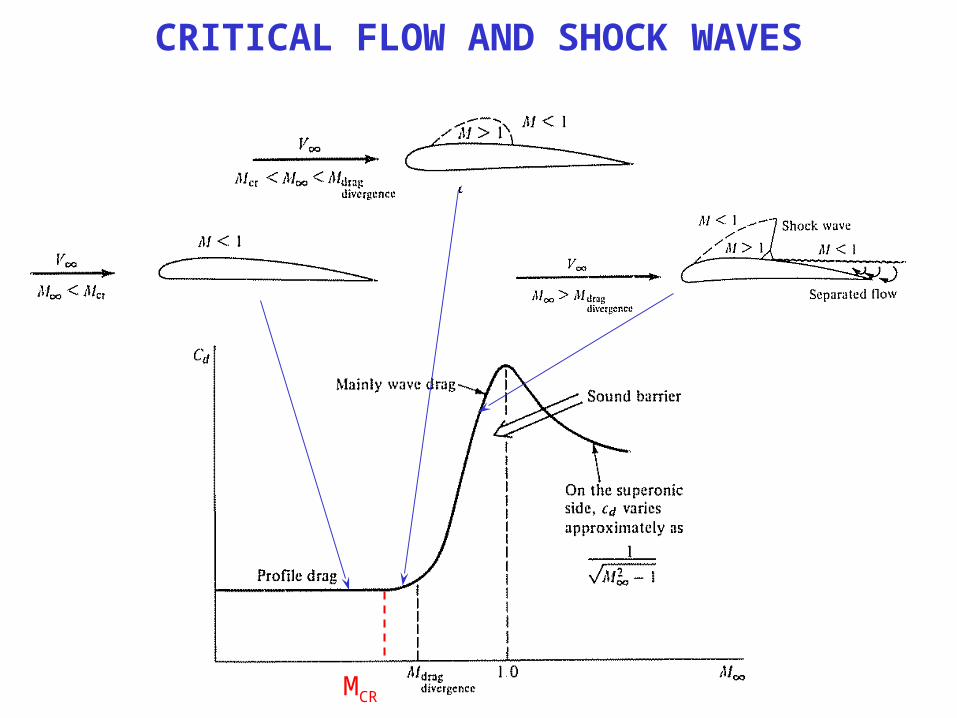
CRITICAL FLOW AND SHOCK WAVES
MCR
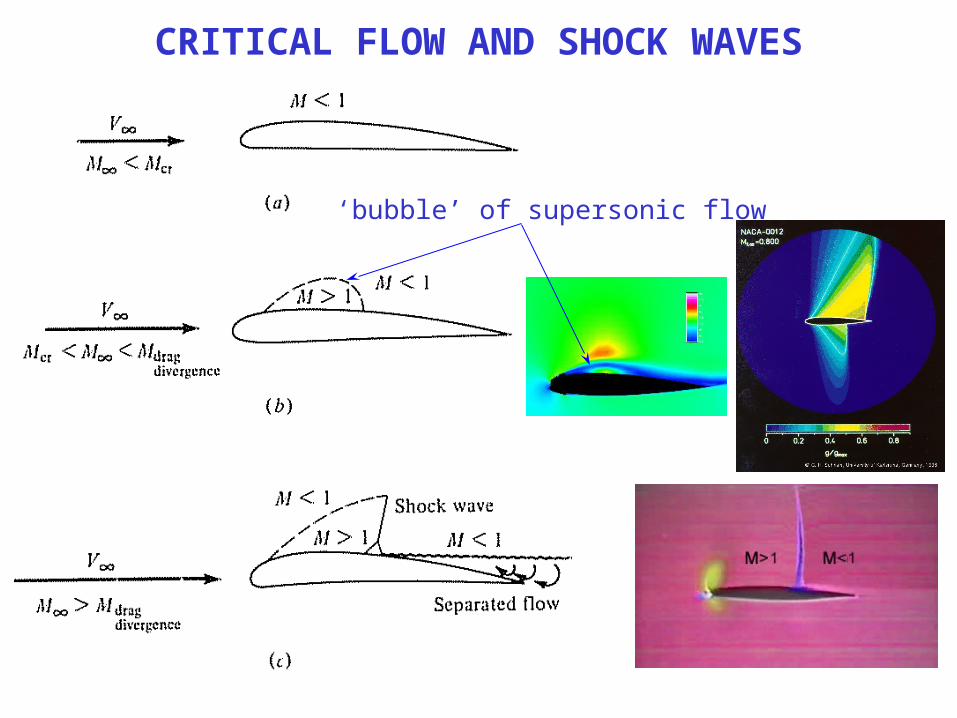
CRITICAL FLOW AND SHOCK WAVES
‘bubble’ of supersonic flow
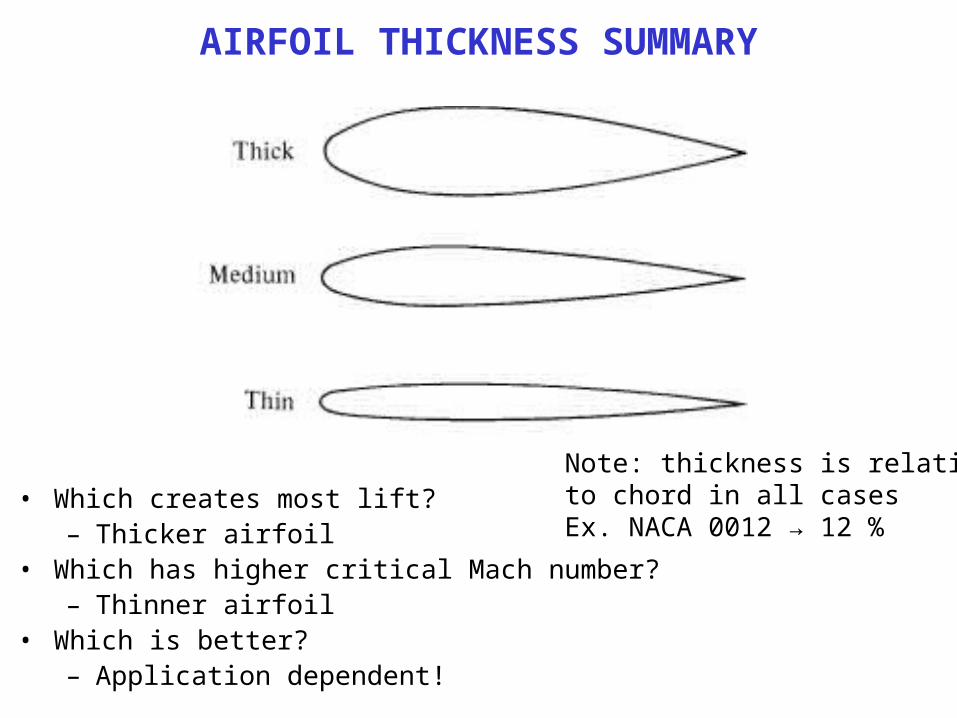
AIRFOIL THICKNESS SUMMARY
• Which creates most lift?– Thicker airfoil
• Which has higher critical Mach number?– Thinner airfoil
• Which is better?– Application dependent!
Note: thickness is relativeto chord in all casesEx. NACA 0012 → 12 %
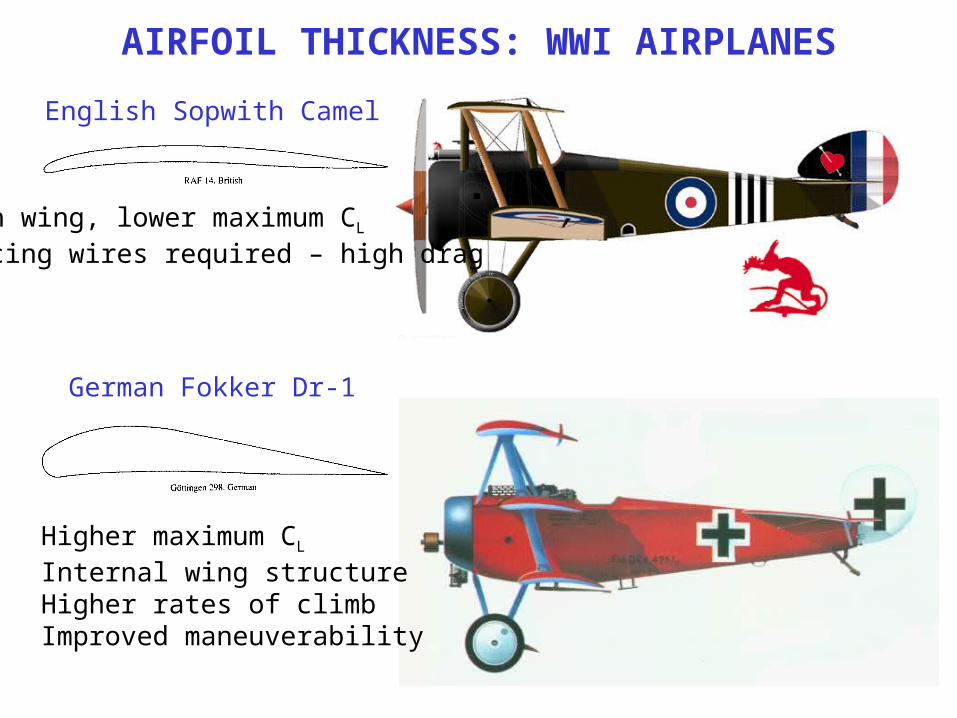
AIRFOIL THICKNESS: WWI AIRPLANES
English Sopwith Camel
German Fokker Dr-1
Higher maximum CL
Internal wing structureHigher rates of climbImproved maneuverability
Thin wing, lower maximum CL
Bracing wires required – high drag
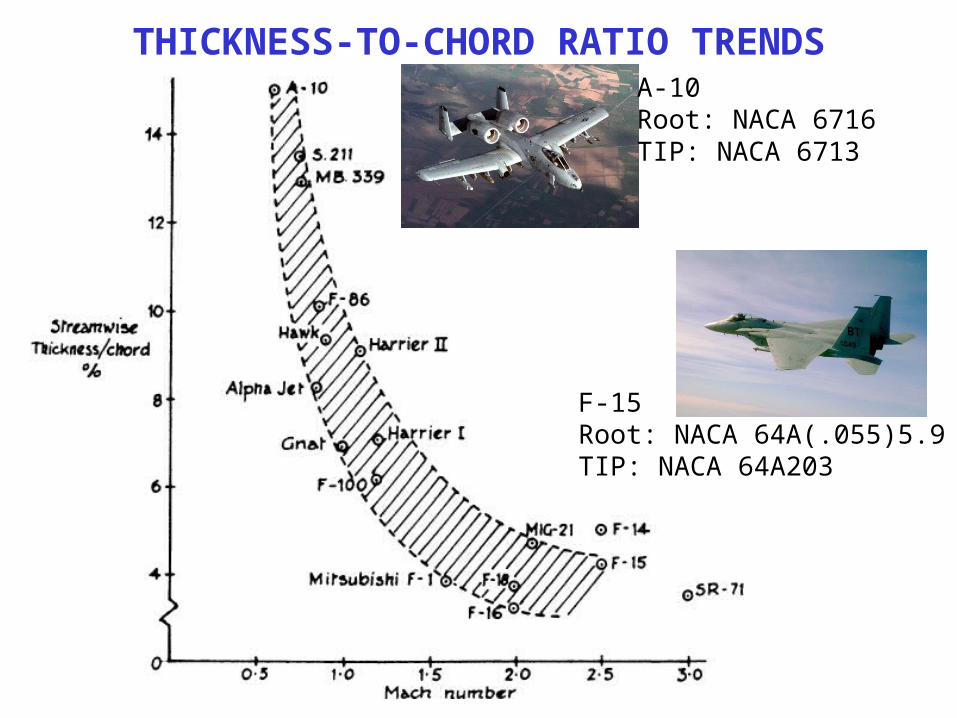
THICKNESS-TO-CHORD RATIO TRENDSA-10Root: NACA 6716TIP: NACA 6713
F-15Root: NACA 64A(.055)5.9TIP: NACA 64A203
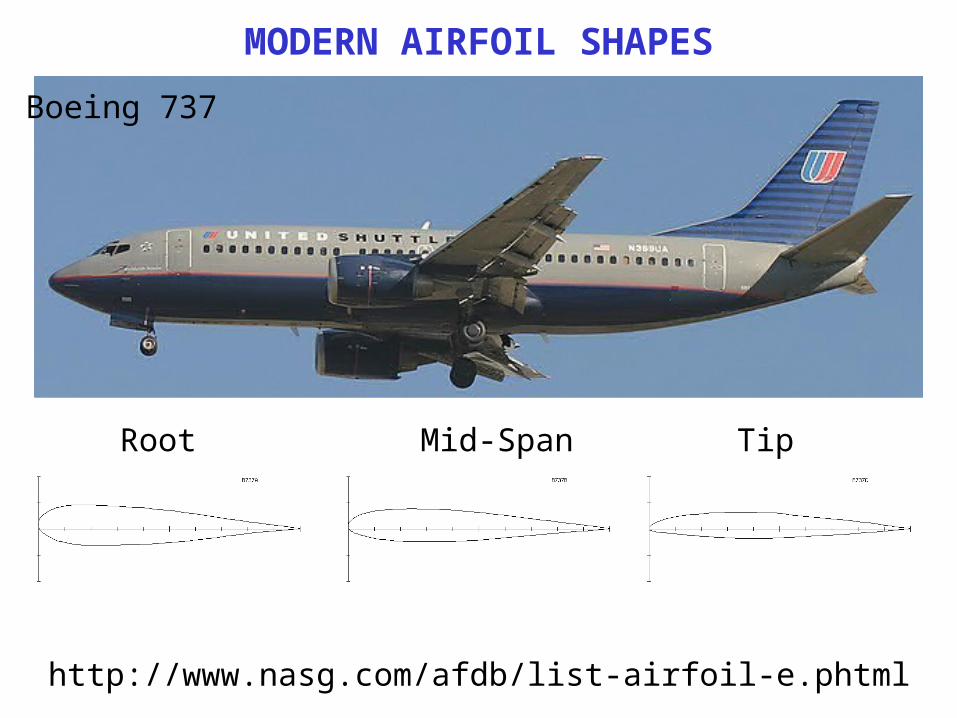
MODERN AIRFOIL SHAPES
http://www.nasg.com/afdb/list-airfoil-e.phtml
Root Mid-Span Tip
Boeing 737
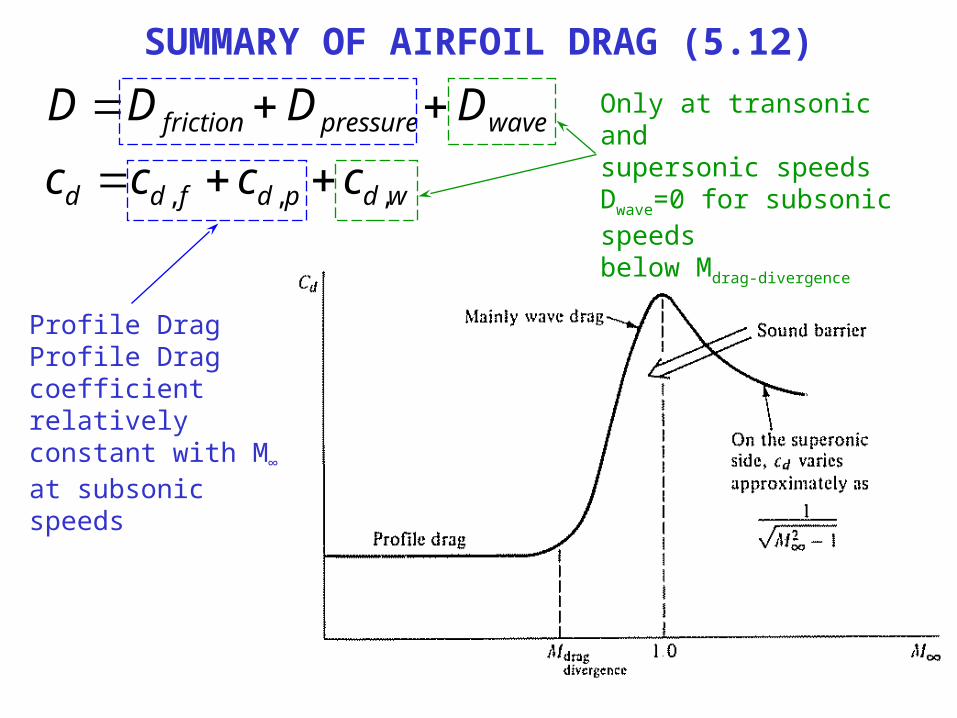
SUMMARY OF AIRFOIL DRAG (5.12)
wdpdfdd
wavepressurefriction
cccc
DDDD
,,,
Only at transonic andsupersonic speedsDwave=0 for subsonic speedsbelow Mdrag-divergence
Profile DragProfile Drag coefficient relatively constant with M∞ at subsonic speeds
FINITE WINGS
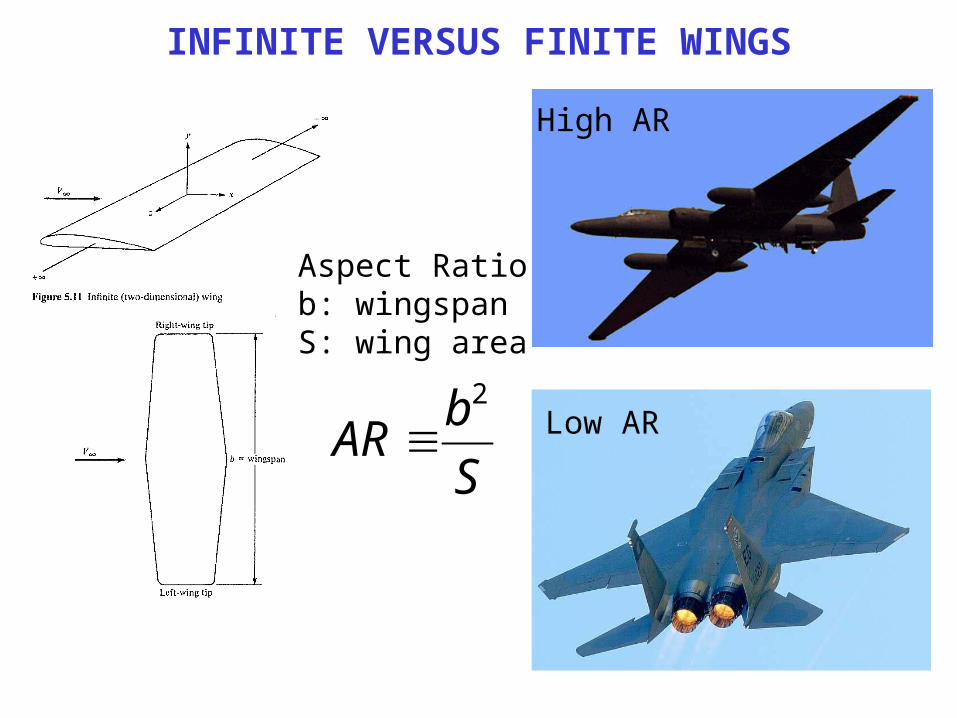
INFINITE VERSUS FINITE WINGS
S
bAR
2
Aspect Ratiob: wingspanS: wing area
High AR
Low AR
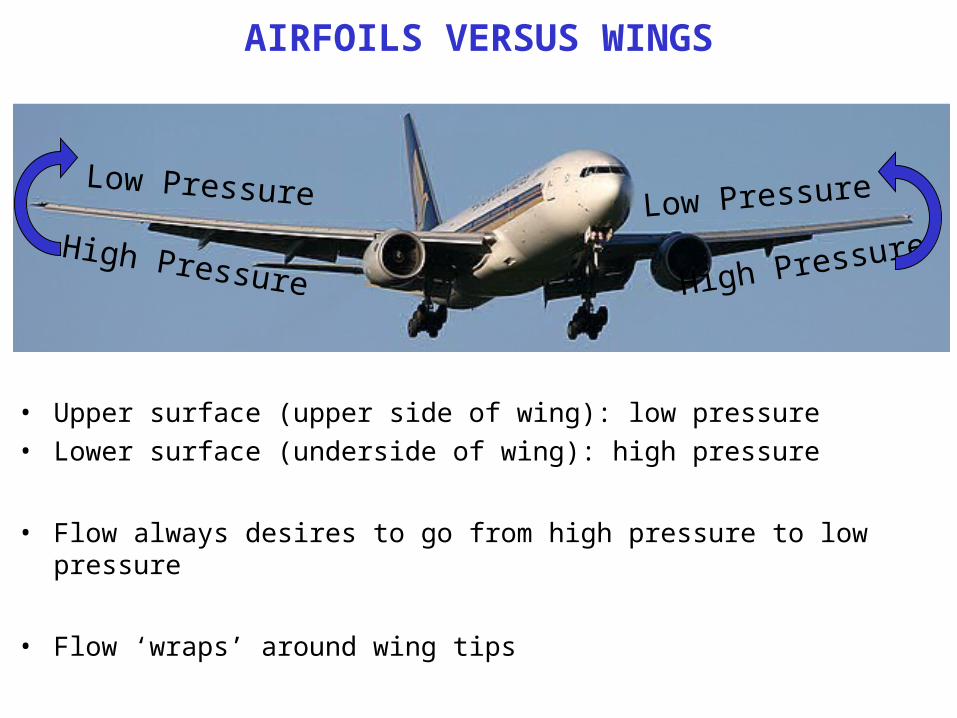
AIRFOILS VERSUS WINGS
High Pressure High Pressure
Low PressureLow Pressure
• Upper surface (upper side of wing): low pressure
• Lower surface (underside of wing): high pressure
• Flow always desires to go from high pressure to low pressure
• Flow ‘wraps’ around wing tips
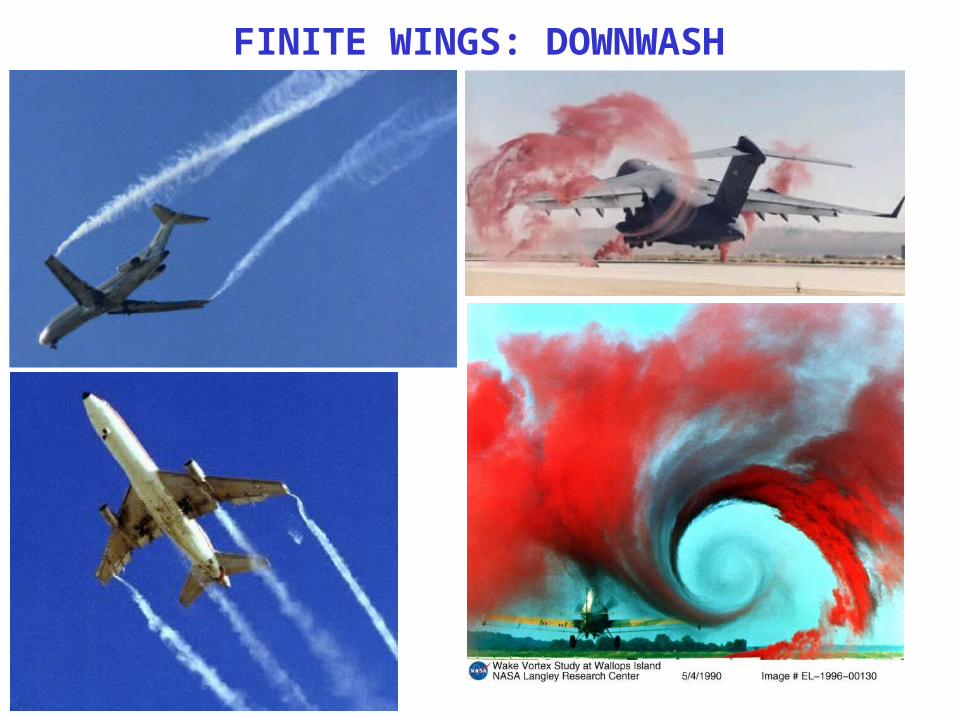
FINITE WINGS: DOWNWASH
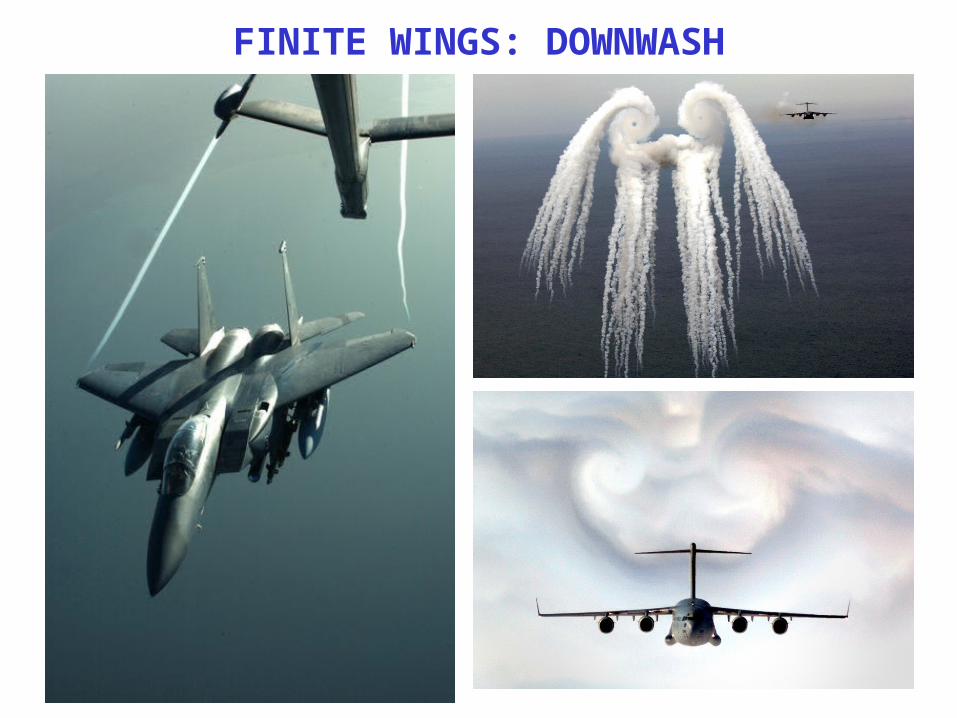
FINITE WINGS: DOWNWASH
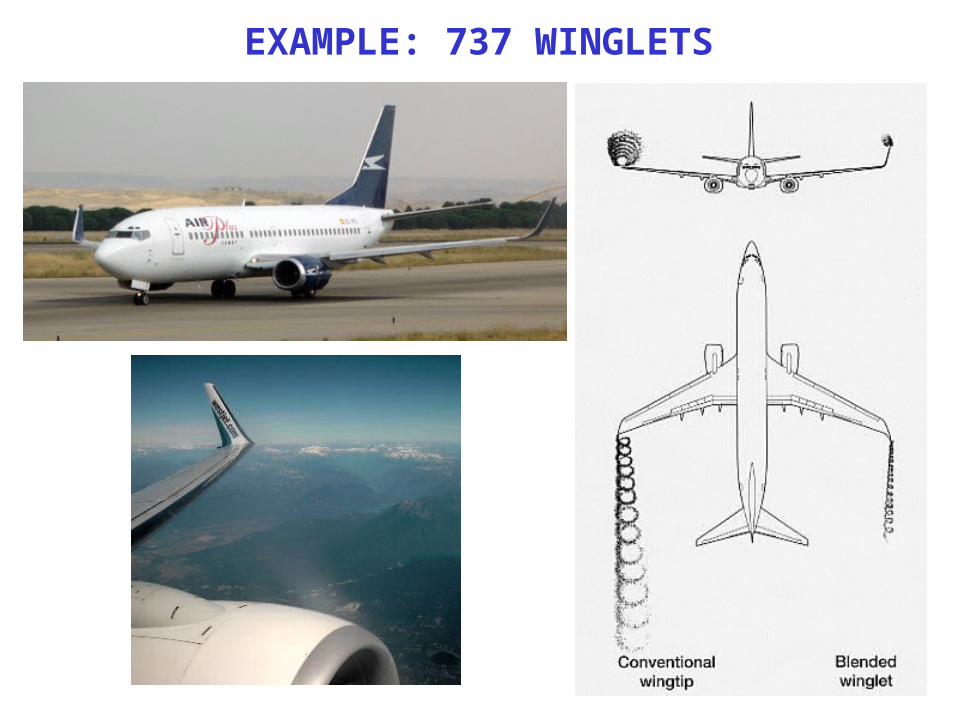
EXAMPLE: 737 WINGLETS
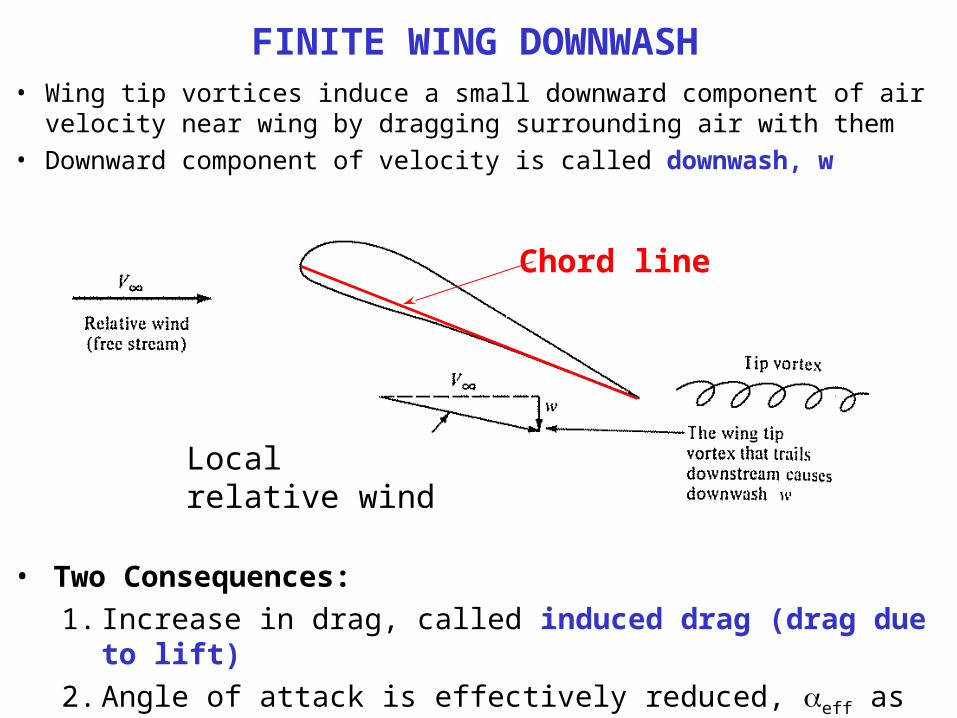
FINITE WING DOWNWASH• Wing tip vortices induce a small downward component of air velocity near
wing by dragging surrounding air with them
• Downward component of velocity is called downwash, w
Local relative wind
• Two Consequences:
1. Increase in drag, called induced drag (drag due to lift)
2. Angle of attack is effectively reduced, eff as compared with V∞
Chord line
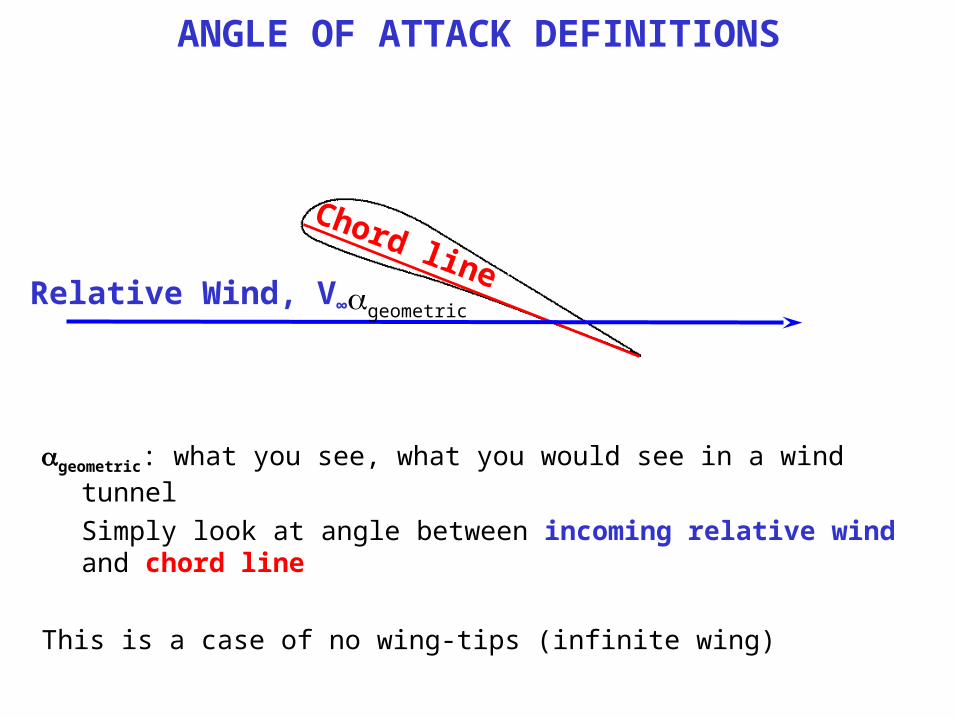
ANGLE OF ATTACK DEFINITIONS
geometric: what you see, what you would see in a wind tunnel
Simply look at angle between incoming relative wind and chord line
This is a case of no wing-tips (infinite wing)
Relative Wind, V∞
Chord linegeometric
ANGLE OF ATTACK DEFINITIONS
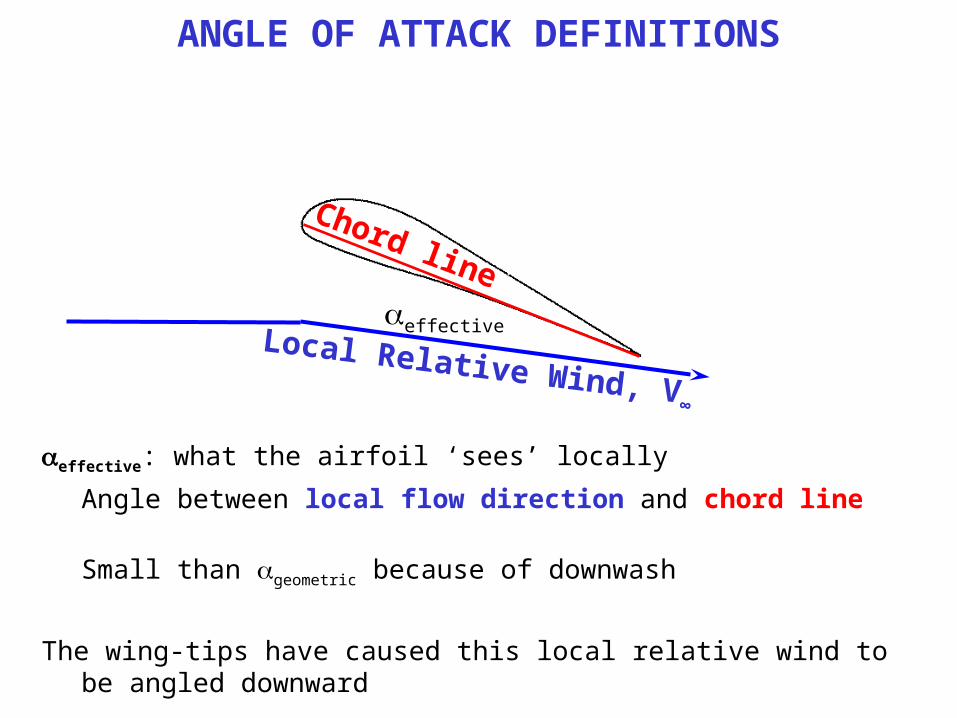
effective: what the airfoil ‘sees’ locally
Angle between local flow direction and chord line
Small than geometric because of downwash
The wing-tips have caused this local relative wind to be angled downward
Local Relative Wind, V∞
Chord line
effective
ANGLE OF ATTACK DEFINITIONS
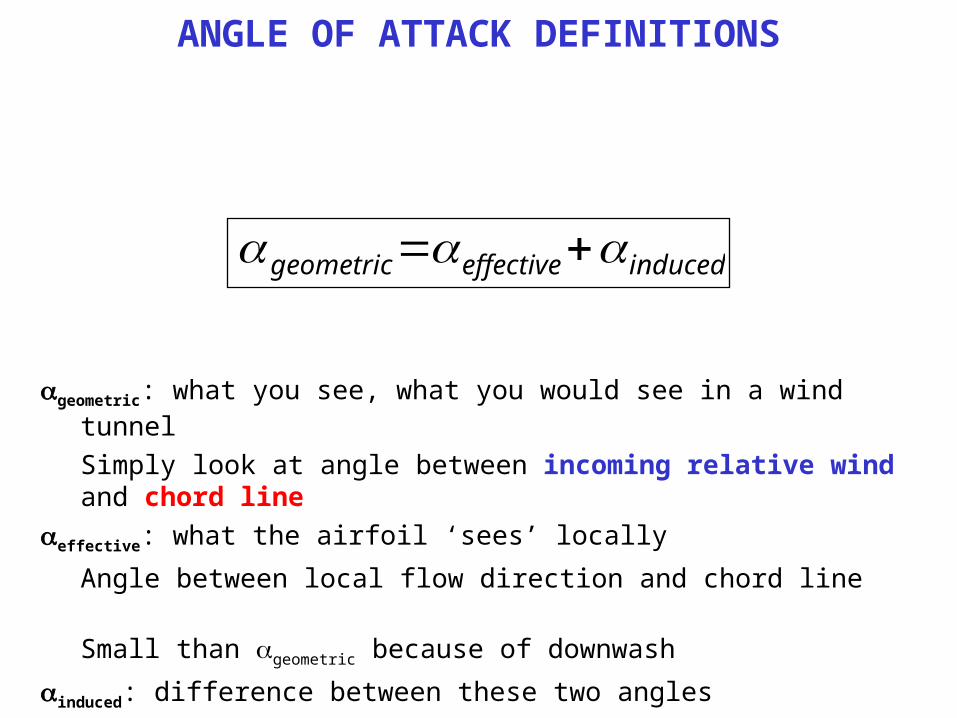
geometric: what you see, what you would see in a wind tunnel
Simply look at angle between incoming relative wind and chord line
effective: what the airfoil ‘sees’ locally
Angle between local flow direction and chord line
Small than geometric because of downwash
induced: difference between these two angles
Downwash has ‘induced’ this change in angle of attack
inducedeffectivegeometric

INFINITE WING DESCRIPTION
• LIFT is always perpendicular to the RELATIVE WIND
• All lift is balancing weight
LIFT
Relative Wind, V∞
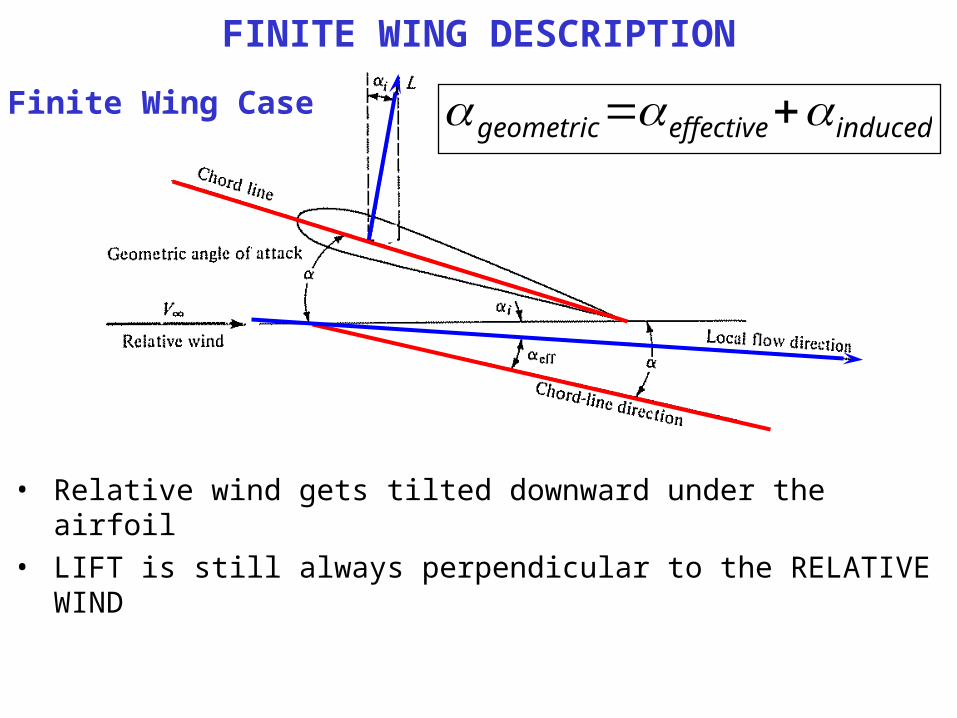
FINITE WING DESCRIPTION
• Relative wind gets tilted downward under the airfoil
• LIFT is still always perpendicular to the RELATIVE WIND
inducedeffectivegeometric Finite Wing Case
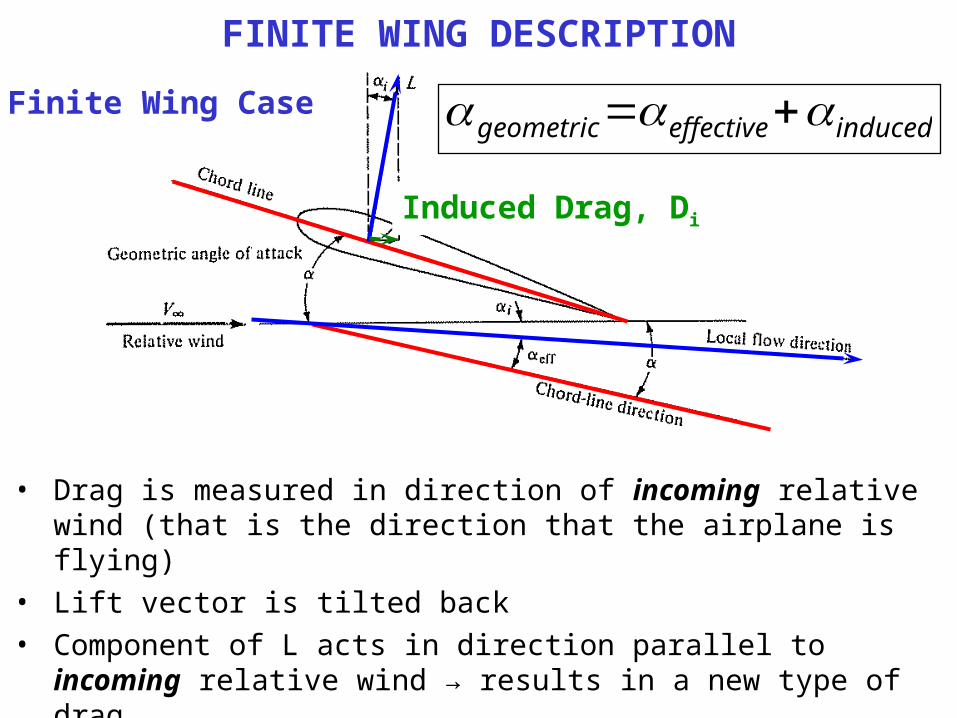
FINITE WING DESCRIPTION
• Drag is measured in direction of incoming relative wind (that is the direction that the airplane is flying)
• Lift vector is tilted back
• Component of L acts in direction parallel to incoming relative wind → results in a new type of drag
inducedeffectivegeometric Finite Wing Case
Induced Drag, Di
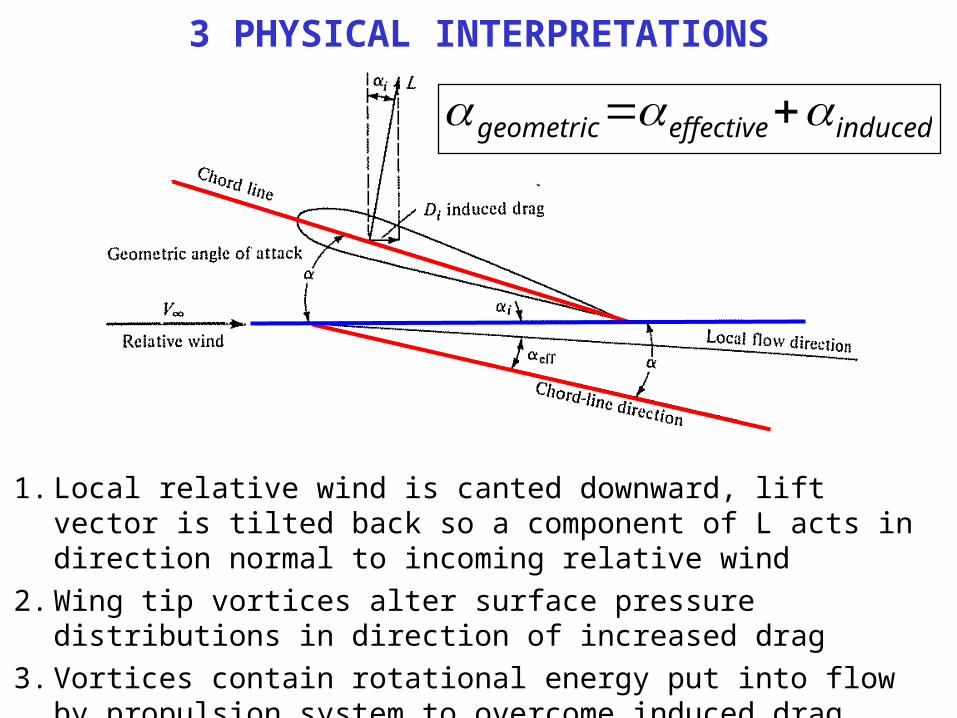
3 PHYSICAL INTERPRETATIONS
1. Local relative wind is canted downward, lift vector is tilted back so a component of L acts in direction normal to incoming relative wind
2. Wing tip vortices alter surface pressure distributions in direction of increased drag
3. Vortices contain rotational energy put into flow by propulsion system to overcome induced drag
inducedeffectivegeometric
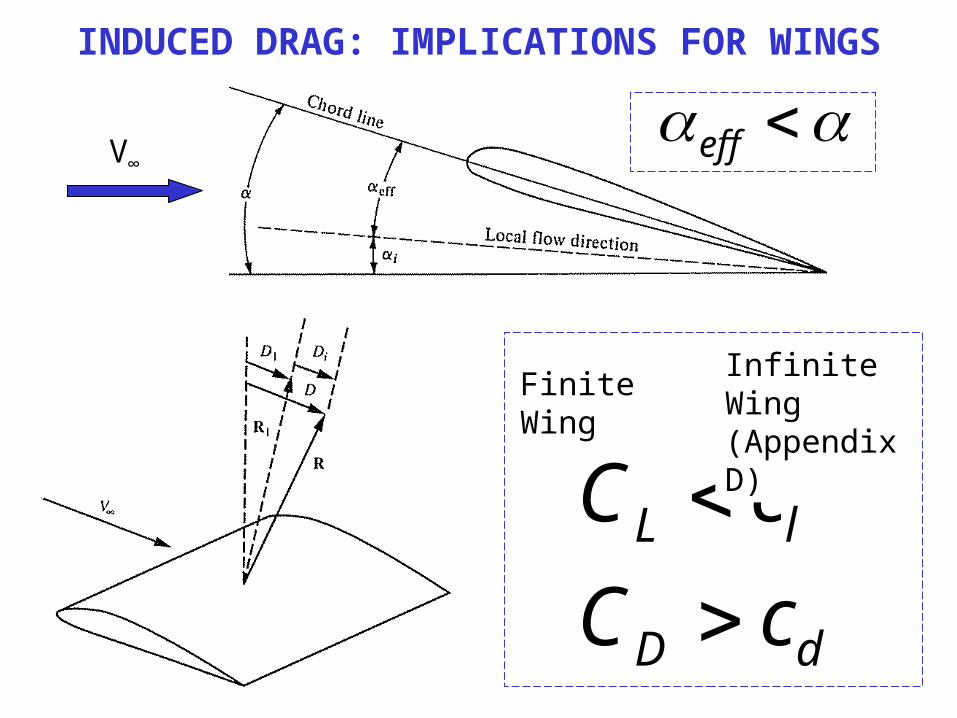
INDUCED DRAG: IMPLICATIONS FOR WINGS
dD
lL
cC
cC
Finite WingInfinite Wing(Appendix D)
V∞
eff
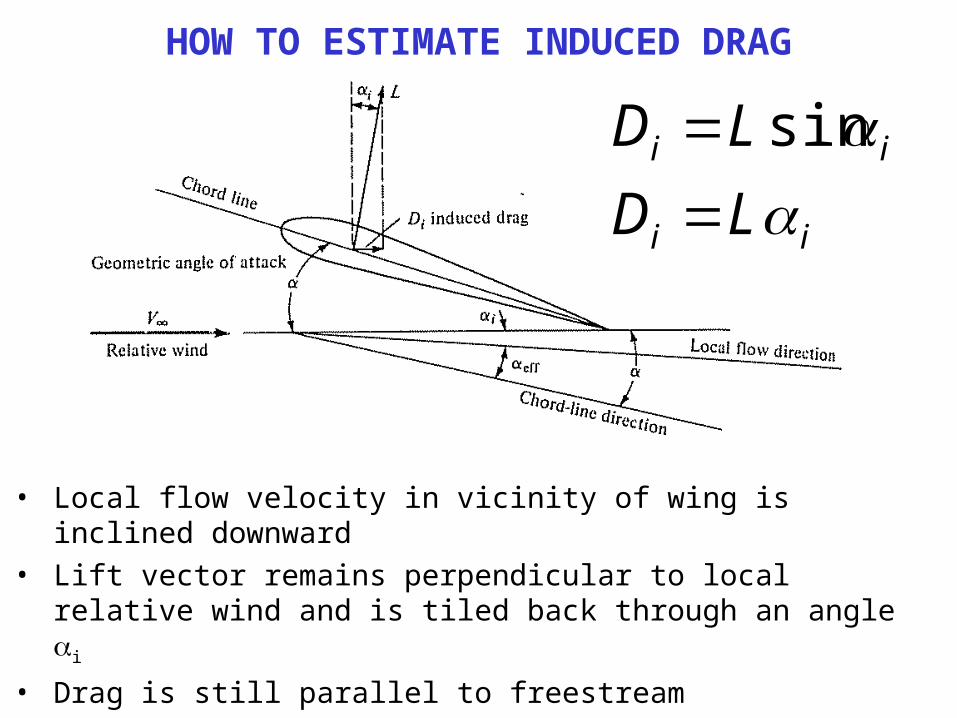
HOW TO ESTIMATE INDUCED DRAG
ii
ii
LD
LD
sin
• Local flow velocity in vicinity of wing is inclined downward
• Lift vector remains perpendicular to local relative wind and is tiled back through an angle i
• Drag is still parallel to freestream
• Tilted lift vector contributes a drag component
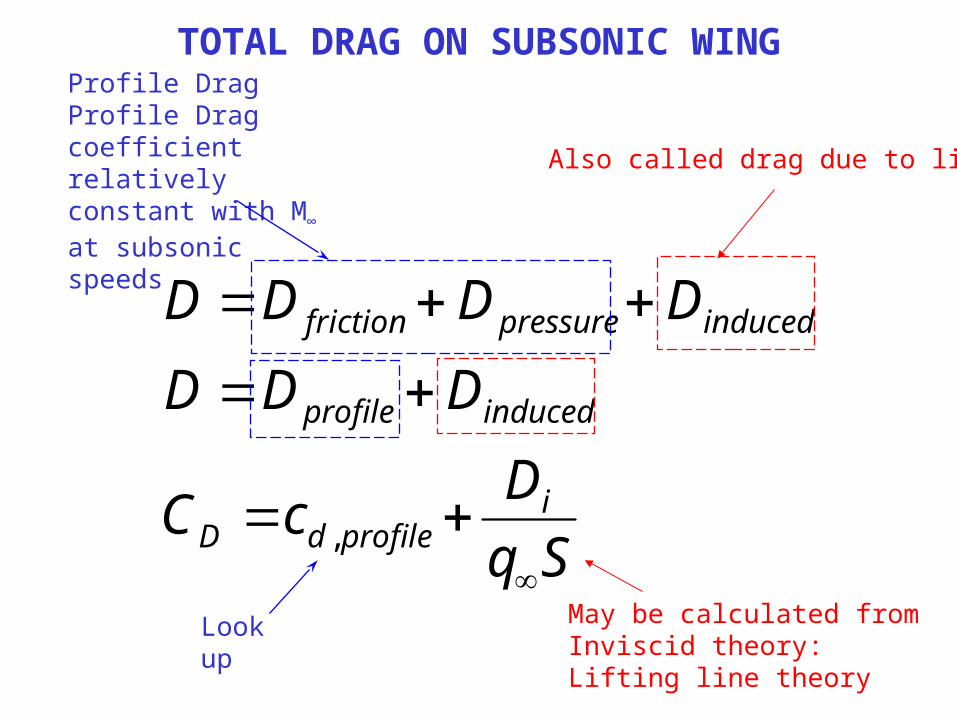
TOTAL DRAG ON SUBSONIC WING
Sq
DcC
DDD
DDDD
iprofiledD
inducedprofile
inducedpressurefriction
,
Also called drag due to lift
Profile DragProfile Drag coefficient relatively constant with M∞ at subsonic speeds
Look up May be calculated fromInviscid theory:Lifting line theory

INFINITE VERSUS FINITE WINGS
S
bAR
2
Aspect Ratiob: wingspanS: wing area
High AR
Low AR
b
HOW TO ESTIMATE INDUCED DRAG
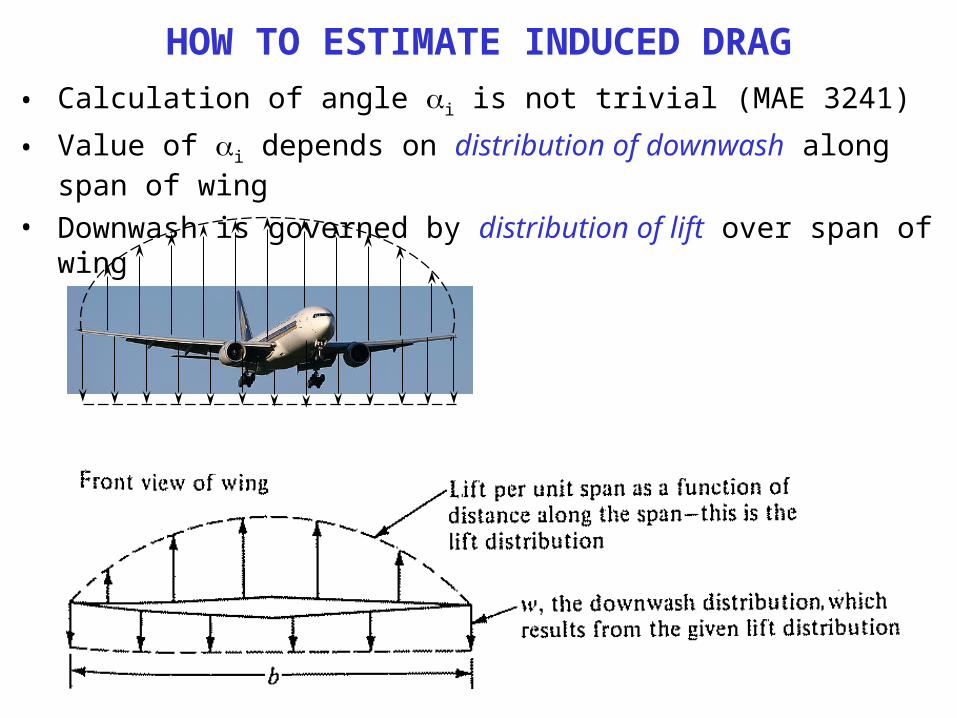
• Calculation of angle i is not trivial (MAE 3241)
• Value of i depends on distribution of downwash along span of wing
• Downwash is governed by distribution of lift over span of wing
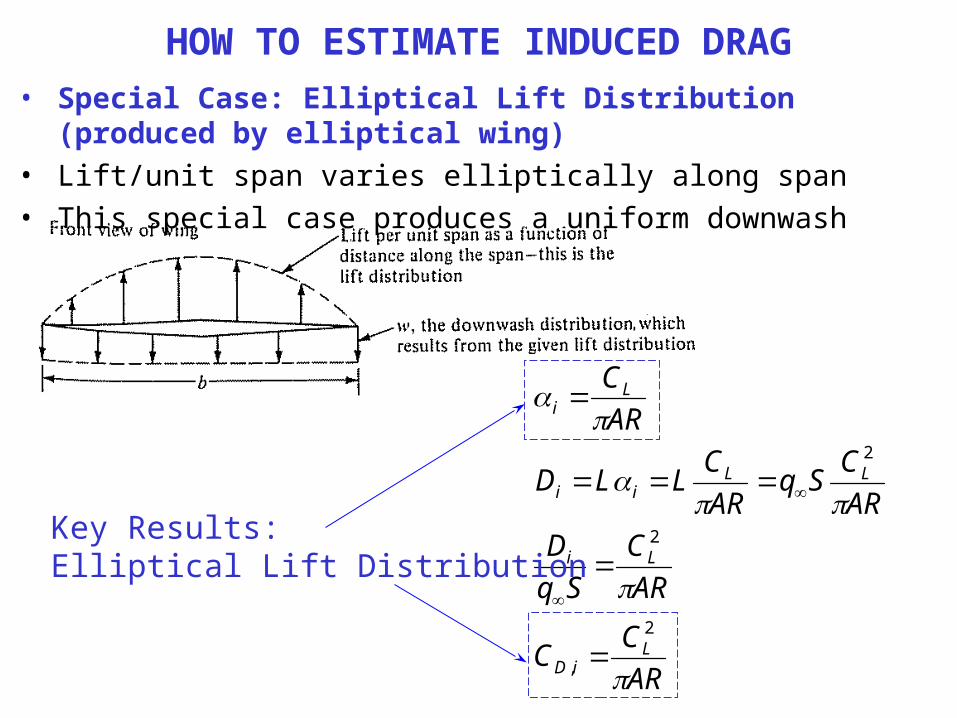
HOW TO ESTIMATE INDUCED DRAG
• Special Case: Elliptical Lift Distribution (produced by elliptical wing)
• Lift/unit span varies elliptically along span
• This special case produces a uniform downwash
AR
CC
AR
C
Sq
D
AR
CSq
AR
CLLD
AR
C
LiD
Li
LLii
Li
2
,
2
2
Key Results:Elliptical Lift Distribution
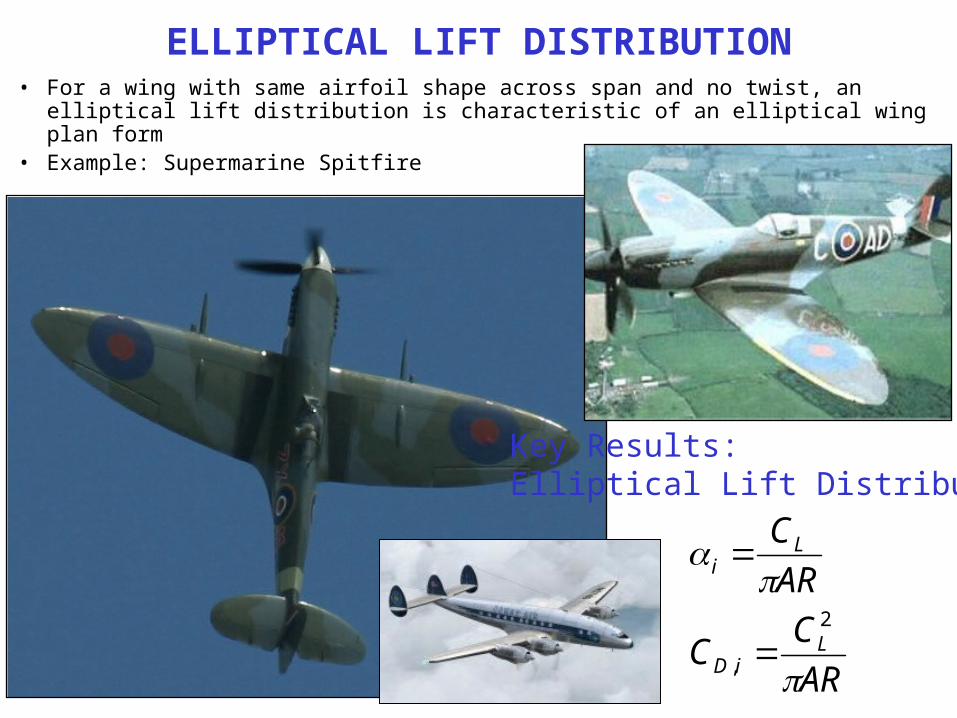
ELLIPTICAL LIFT DISTRIBUTION• For a wing with same airfoil shape across span and no twist, an elliptical lift
distribution is characteristic of an elliptical wing plan form• Example: Supermarine Spitfire
AR
CC
AR
C
LiD
Li
2
,
Key Results:Elliptical Lift Distribution
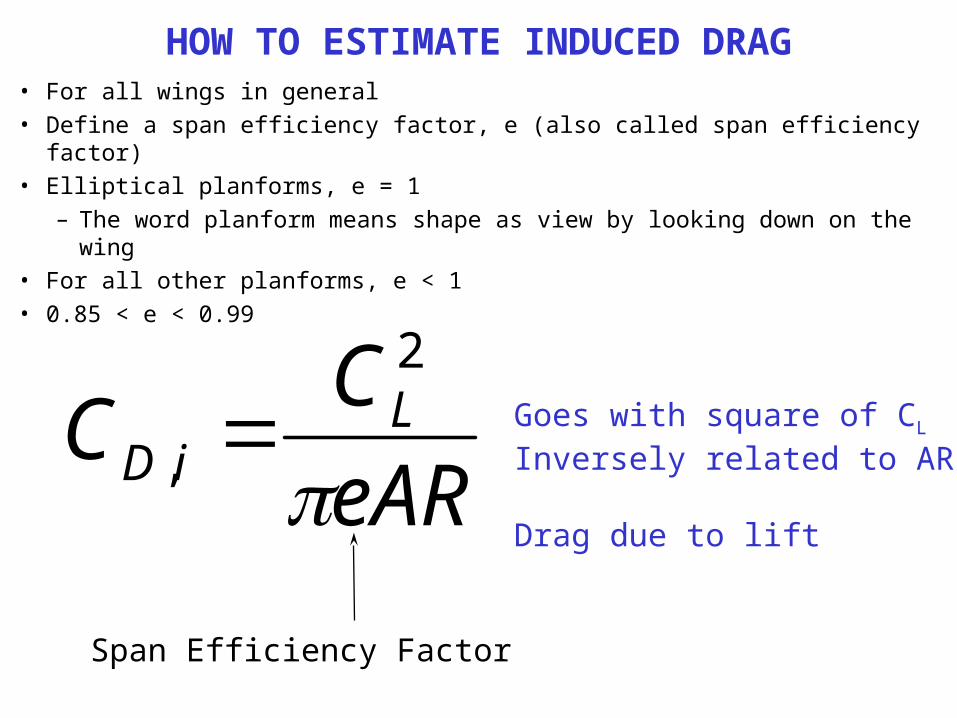
HOW TO ESTIMATE INDUCED DRAG• For all wings in general
• Define a span efficiency factor, e (also called span efficiency factor)
• Elliptical planforms, e = 1
– The word planform means shape as view by looking down on the wing
• For all other planforms, e < 1
• 0.85 < e < 0.99
eAR
CC L
iD
2
,
Span Efficiency Factor
Goes with square of CL
Inversely related to AR
Drag due to lift
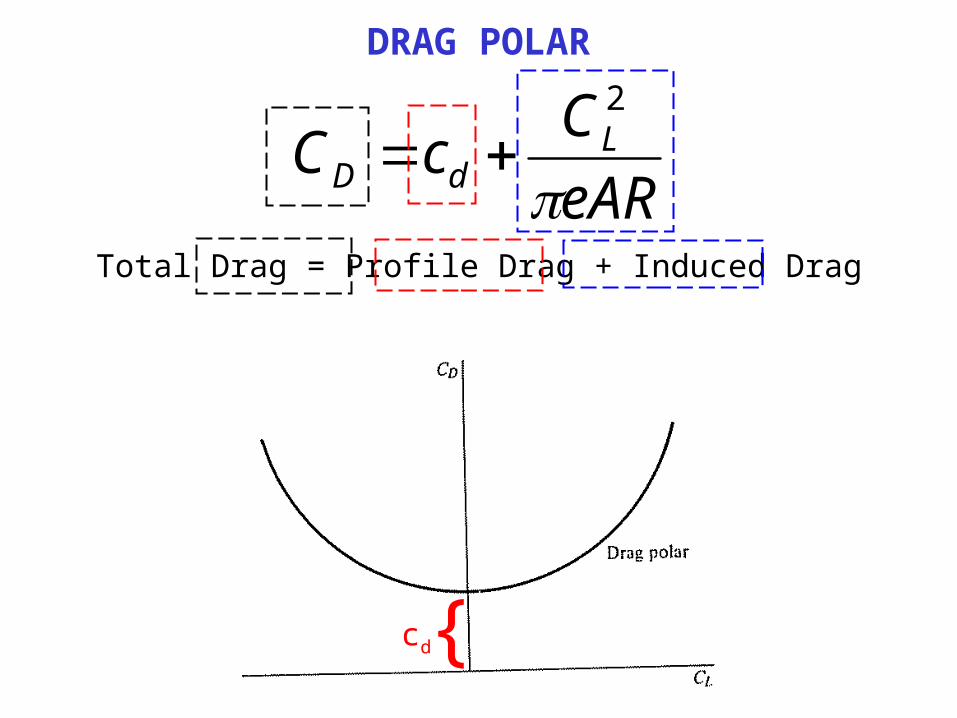
DRAG POLAR
eAR
CcC L
dD
2
Total Drag = Profile Drag + Induced Drag
{cd
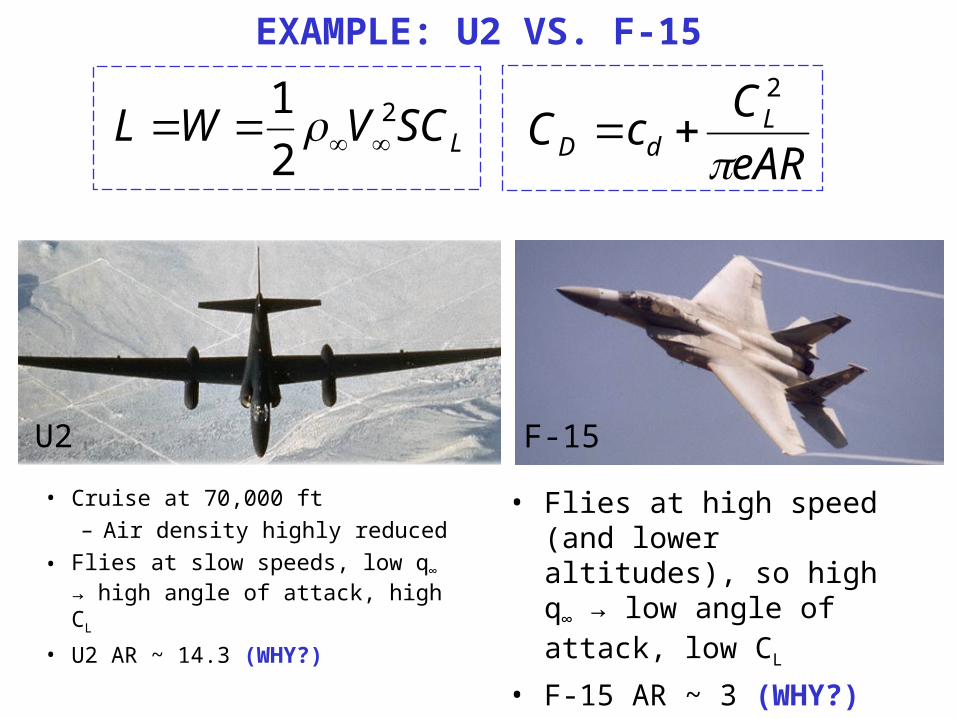
EXAMPLE: U2 VS. F-15
• Cruise at 70,000 ft
– Air density highly reduced
• Flies at slow speeds, low q∞ → high angle of attack, high CL
• U2 AR ~ 14.3 (WHY?)
eAR
CcC L
dD
2
LSCVWL 2
2
1
• Flies at high speed (and lower altitudes), so high q∞ → low angle of attack, low CL
• F-15 AR ~ 3 (WHY?)
U2 F-15
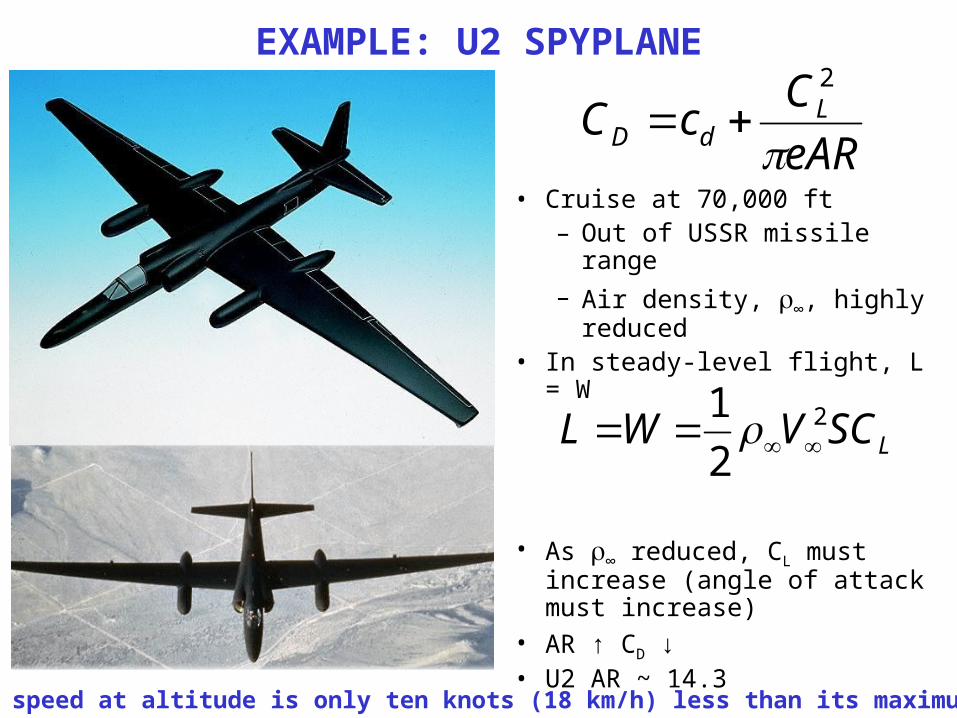
EXAMPLE: U2 SPYPLANE
• Cruise at 70,000 ft– Out of USSR missile range
– Air density, ∞, highly reduced
• In steady-level flight, L = W
• As ∞ reduced, CL must increase (angle of attack must increase)
• AR ↑ CD ↓• U2 AR ~ 14.3
eAR
CcC L
dD
2
LSCVWL 2
2
1
U2 stall speed at altitude is only ten knots (18 km/h) less than its maximum speed
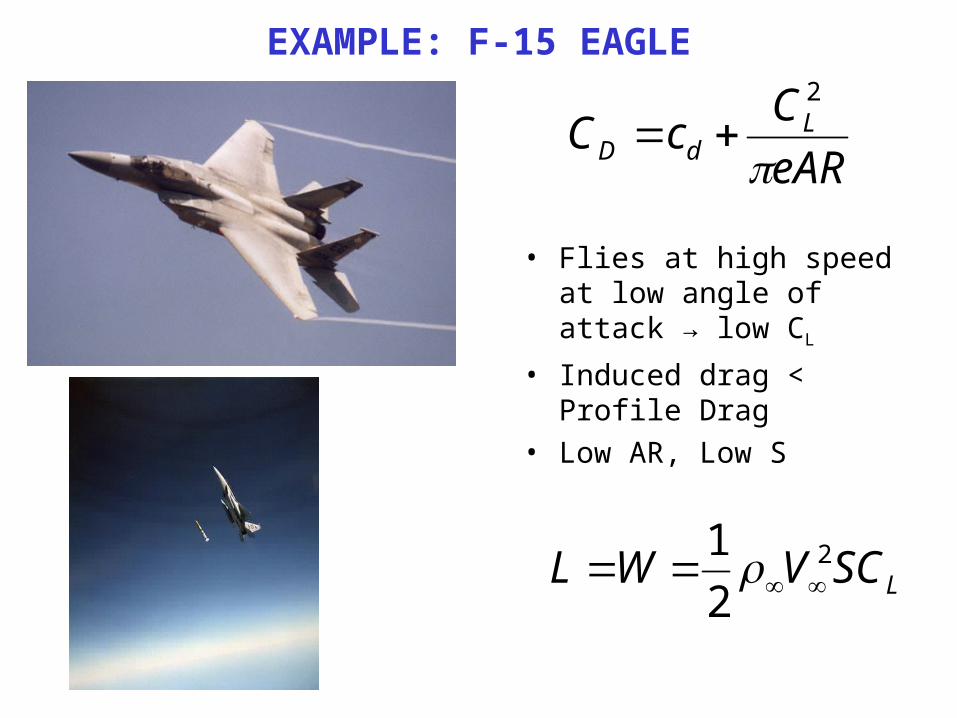
EXAMPLE: F-15 EAGLE
• Flies at high speed at low angle of attack → low CL
• Induced drag < Profile Drag
• Low AR, Low S
eAR
CcC L
dD
2
LSCVWL 2
2
1

U2 CRASH DETAILS• http://www.eisenhower.archives.gov/dl/U2Incident/u2documents.html• NASA issued a very detailed press release noting that an aircraft had “gone missing” north
of Turkey• I must tell you a secret. When I made my first report I deliberately did not say that the pilot
was alive and well… and now just look how many silly things [the Americans] have said.”
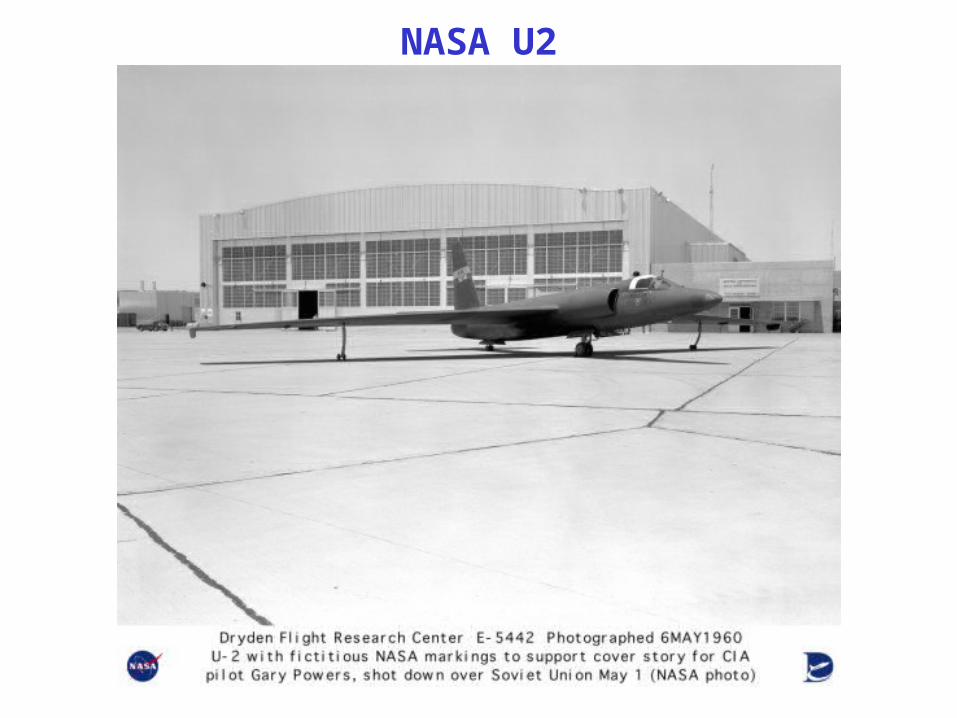
NASA U2
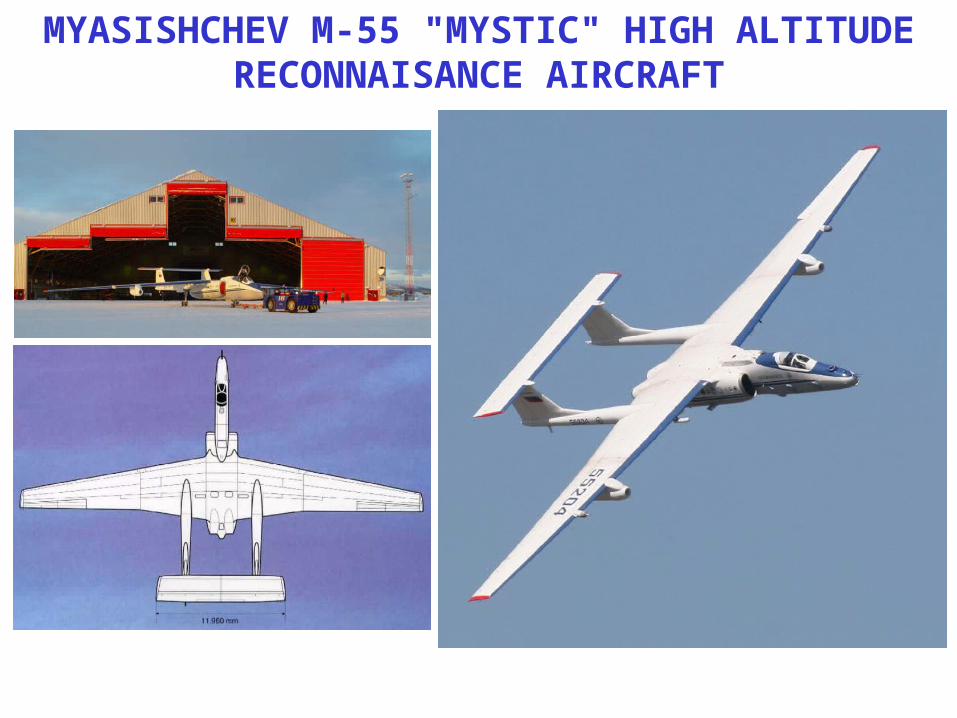
MYASISHCHEV M-55 "MYSTIC" HIGH ALTITUDE RECONNAISANCE AIRCRAFT
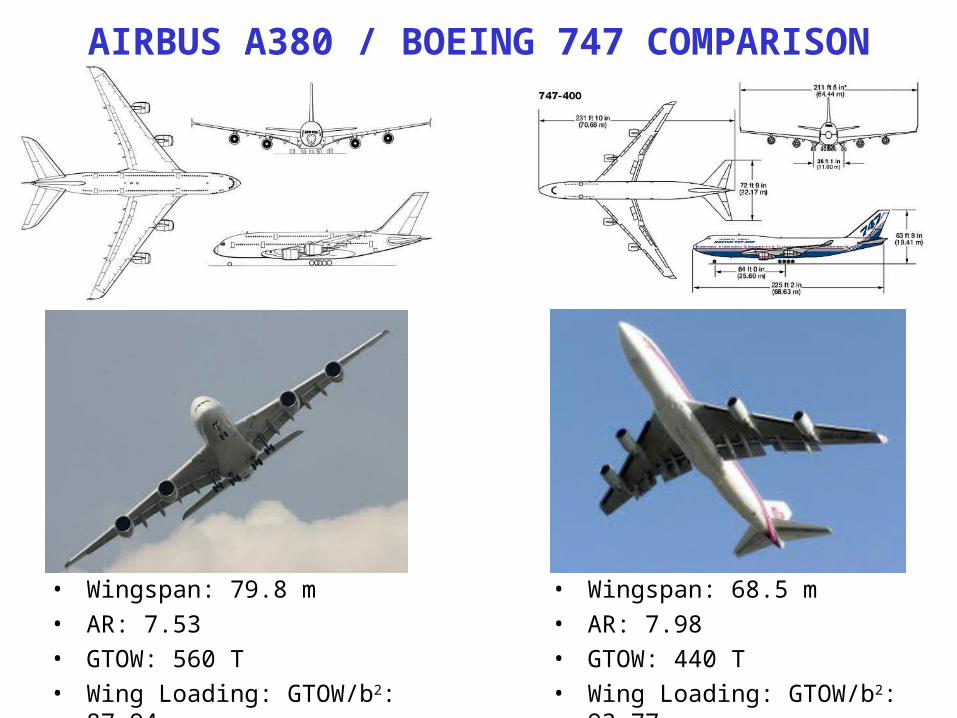
AIRBUS A380 / BOEING 747 COMPARISON
• Wingspan: 79.8 m
• AR: 7.53
• GTOW: 560 T
• Wing Loading: GTOW/b2: 87.94
• Wingspan: 68.5 m
• AR: 7.98
• GTOW: 440 T
• Wing Loading: GTOW/b2: 93.77
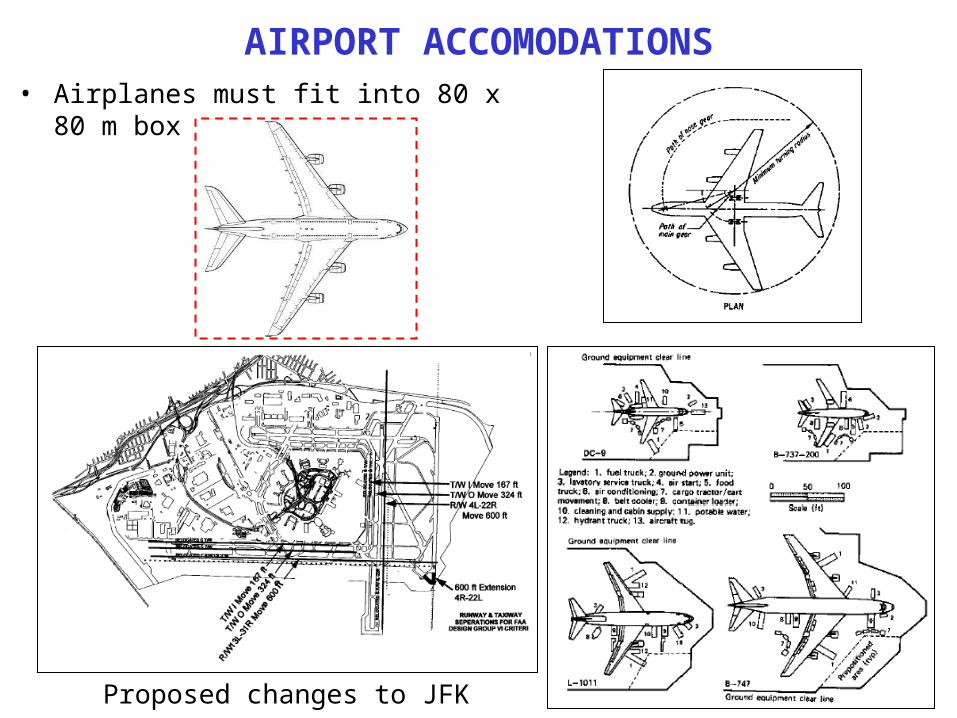
AIRPORT ACCOMODATIONS• Airplanes must fit into 80 x 80 m box
Proposed changes to JFK

WINGLETS, FENCES, OR NO WINGLETS?• Quote from ‘Airborne with the Captain’ website
– http://www.askcaptainlim.com/blog/index.php?catid=19
• “Now, to go back on your question on why the Airbus A380 did not follow the Airbus A330/340 winglet design but rather more or less imitate the old design “wingtip fences” of the Airbus A320. Basically winglets help to reduce induced drag and improve performance (also increases aspect ratio slightly). However, the Airbus A380 has very large wing area due to the large wingspan that gives it a high aspect ratio. So, it need not have to worry about aspect ratio but needs only to tackle the induced drag problem. Therefore, it does not require the winglets, but merely “wingtip fences” similar to those of the Airbus A320.”
• What do you think of this answer?
• What are other trade-offs for winglets vs. no winglets?
– Consider Boeing 777 does not have winglets
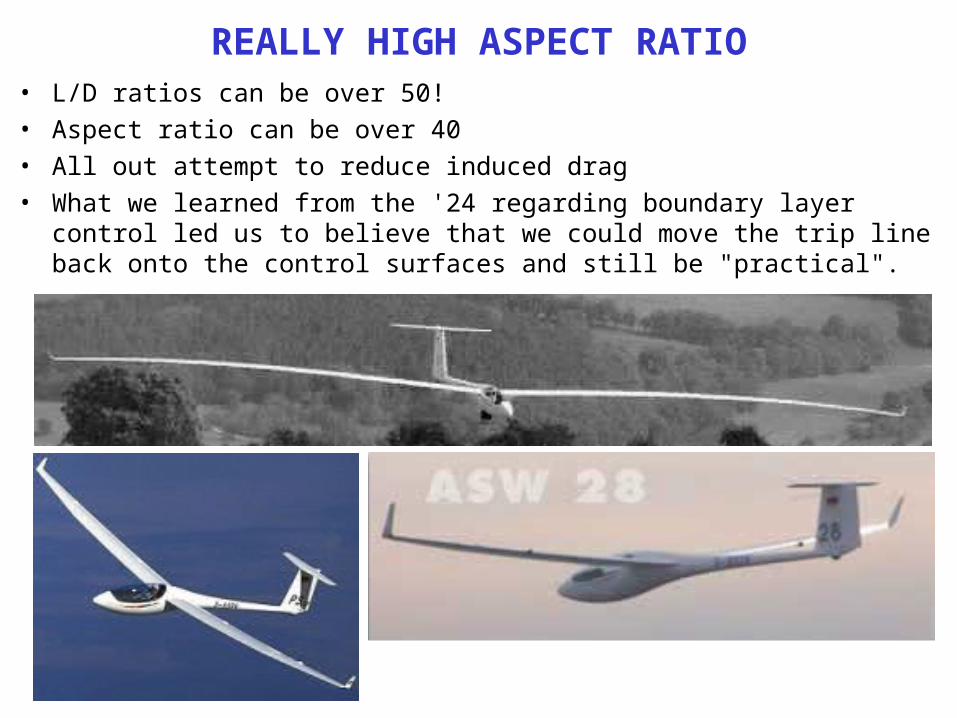
REALLY HIGH ASPECT RATIO• L/D ratios can be over 50!
• Aspect ratio can be over 40
• All out attempt to reduce induced drag
• What we learned from the '24 regarding boundary layer control led us to believe that we could move the trip line back onto the control surfaces and still be "practical".

FINITE WING CHANGE IN LIFT SLOPE• In a wind tunnel, the easiest thing to
measure is the geometric angle of attack
• For infinite wings, there is no induced angle of attack
– The angle you see = the angle the infinite wing ‘sees’
• With finite wings, there is an induced angle of attack
– The angle you see ≠ the angle the finite wing ‘sees’
ieffgeom
Infinite Wing
Finite Wing
geom= eff + i = eff
geom= eff + i

FINITE WING CHANGE IN LIFT SLOPE
• Lift curve for a finite wing has a smaller slope than corresponding curve for an infinite wing with same airfoil cross-section– Figure (a) shows infinite wing, i = 0, so
plot is CL vs. geom or eff and slope is a0
– Figure (b) shows finite wing, i ≠ 0• Plot CL vs. what we see, geom, (or
what would be easy to measure in a wind tunnel), not what wing sees, eff
1. Effect of finite wing is to reduce lift curve slope– Finite wing lift slope = = dCL/d
2. At CL = 0, i = 0, so L=0 same for infinite or finite wings
ieffgeom Infinite Wing
Finite Wing
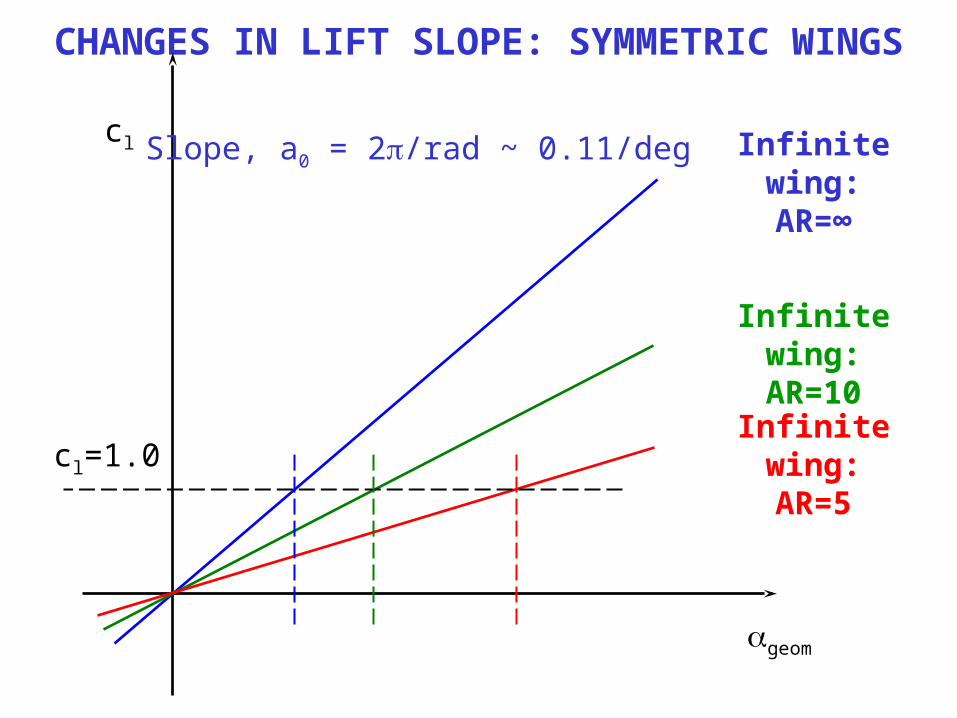
CHANGES IN LIFT SLOPE: SYMMETRIC WINGS
geom
cl Infinite wing:AR=∞
Infinite wing:AR=10
Infinite wing:AR=5cl=1.0
Slope, a0 = 2/rad ~ 0.11/deg
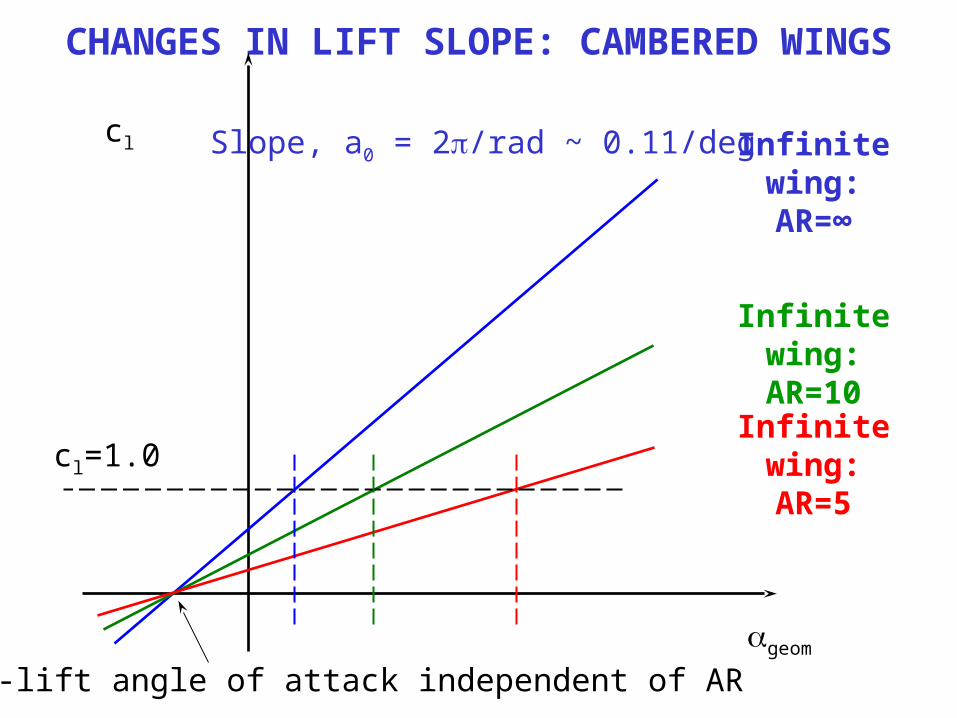
CHANGES IN LIFT SLOPE: CAMBERED WINGS
geom
cl Infinite wing:AR=∞
Infinite wing:AR=10
Infinite wing:AR=5cl=1.0
Zero-lift angle of attack independent of AR
Slope, a0 = 2/rad ~ 0.11/deg
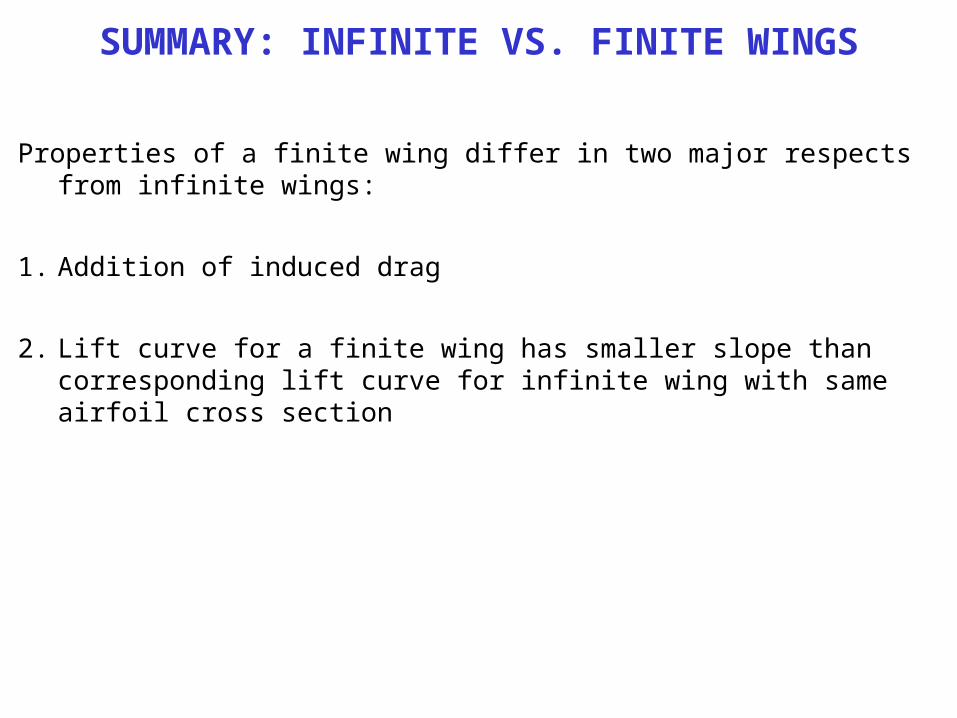
SUMMARY: INFINITE VS. FINITE WINGS
Properties of a finite wing differ in two major respects from infinite wings:
1. Addition of induced drag
2. Lift curve for a finite wing has smaller slope than corresponding lift curve for infinite wing with same airfoil cross section
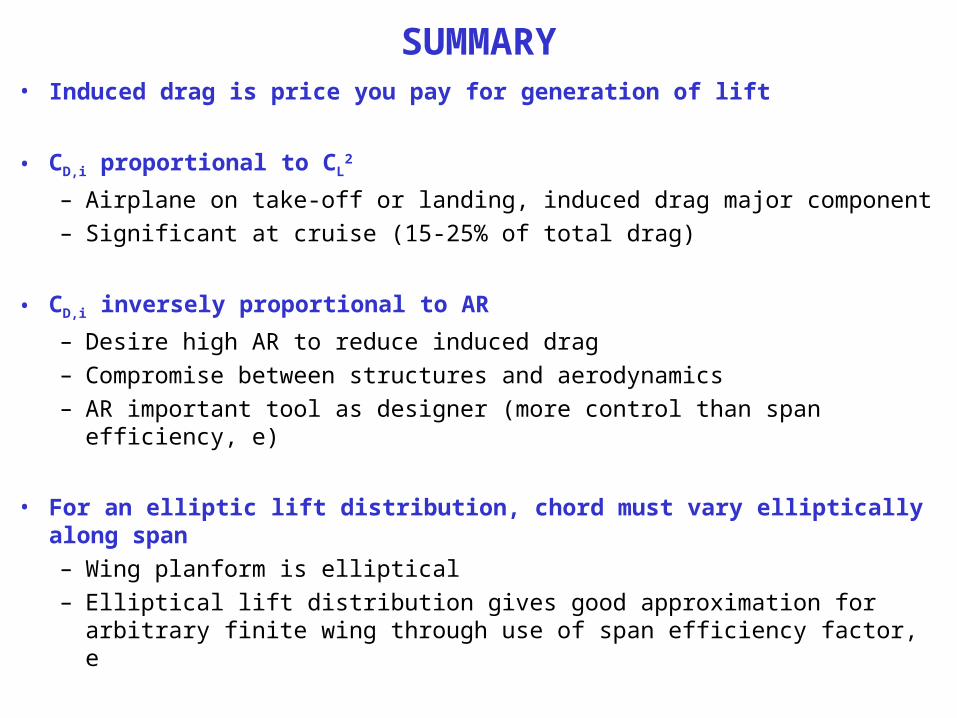
SUMMARY• Induced drag is price you pay for generation of lift
• CD,i proportional to CL2
– Airplane on take-off or landing, induced drag major component
– Significant at cruise (15-25% of total drag)
• CD,i inversely proportional to AR
– Desire high AR to reduce induced drag
– Compromise between structures and aerodynamics
– AR important tool as designer (more control than span efficiency, e)
• For an elliptic lift distribution, chord must vary elliptically along span
– Wing planform is elliptical
– Elliptical lift distribution gives good approximation for arbitrary finite wing through use of span efficiency factor, e
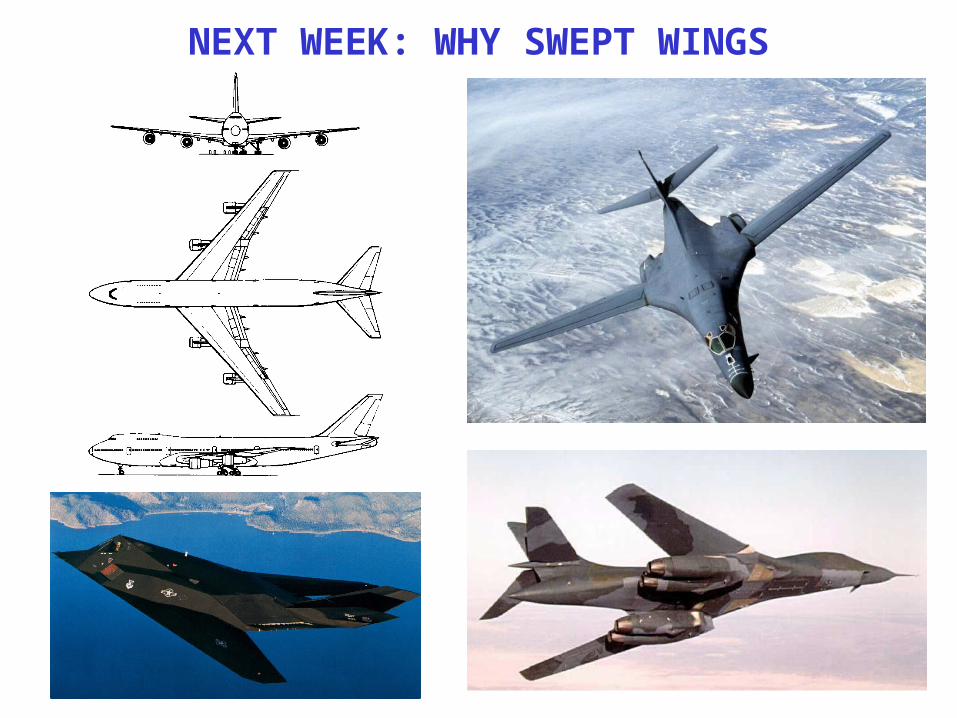
NEXT WEEK: WHY SWEPT WINGS