macroporosity of a well-drained soil under no-till and conventional tillage
TRANSCRIPT
Macroporosity of a Well-Drained Soil under No-Till and Conventional TillageG. H. Dunn* and R. E. Phillips
ABSTRACTConventional tillage and no-tillage have been shown to affect the
hydraulic properties of soil. For this reason, a field experiment wasconducted in 1987 and 1988 to determine the effect of tillage practiceand cover crop on the macroporosity of a Maury silt loam (fine,mixed, mesic Typic Paleudalf). The field used for this study hasbeen in continuous no-till and conventional-fill corn (Zea mays L.)since 1970. Ponded steady-state infiltration measurements weremade using double-ring infiltrometers; afterwards, a tension infll-trometer was used to measure water flux at —0.4, —0.9, and —1.4kPa water pressure. These negative water pressures were used tocalculate equivalent cylindrical pore diameters from the capillary-rise equation. Flux at a pressure of —0.06 kPa was determined fromregression equations for each plot. Equivalent pore diameters of 5.0,0.75,0.33, and 0.21 mm correspond to -0.06, -0.4, -0.9, and -1.4kPa, respectively. In June 1987, conventional tillage had signifi-cantly higher water flux than no-till for the 5.0- to 0.75-mm equiv-alent-diameter pore size range. In 1987, rye (Secale cereale L.) covercrop plots had significantly higher water-flux values than hairy vetch(Vicia villosa Roth.) plots for the same range of equivalent pore sizes.In June 1988, no-till plots had significantly higher water-flux valuesfor all equivalent pore size ranges. In 1987,73 and 80% of the totalwater flux at —0.06 kPa water pressure was transmitted throughpores > 0.21-mm equivalent diameter in no-till and conventional-tillage plots, respectively. The corresponding values in 1988 were 83and 73%.
THE MOVEMENT OF WATER in macropores (largepores) through soil has been documented for well
over 100 yr. Beven and Germann (1982) quoted Schu-macher in 1864 as stating that the movement of waterduring infiltration was largely controlled by big poresin which water is not held under the influence of cap-illary forces. Lawes et al. (1882) found that, duringrainfall, a large part of water in a cracked clay soil atRothamsted (Harpenden, England) moved throughopen channels to drain tiles and interacted only slight-ly with the water in the soil matrix. Subsequent drain-age was found to be more representative of water inthe soil matrix.
After these early reports, there are not many reportsin the literature until Whipkey (1967), a forest hy-drologist, who recognized the importance of watermovement through macropores in forest soils duringheavy rains. Since that time, many researchers havepointed out the importance of soil water movementin macropores, for example, Beven and Germann(1982), Ehlers (1975), Smettem and Collis-George(1985), Moore et al. (1986), Watson and Luxmoore(1986), and Wilson and Luxmoore (1988).
The development of the tension infiltrometer hasenabled researchers to quantify the effective macro-porosity and equivalent cylindrical diameter of ma-cropores (Clothier and White, 1981; Ankeny et al.,Dep. of Agronomy, Univ. of Kentucky, Lexington, KY 40545-0091.Contribution from the Kentucky Agnc. Exp. Stn. as Journal Articleno. S90-117-2. Received 14 Mar. 1990. *Corresponding author.
Published in Soil Sci. Soc. Am. J. 55:817-823 (1991).
1988; Perroux and White, 1988). With the use of ten-sion infiltrometers, it is possible to maintain bothsmall constant positive and negative pressures in orderto characterize in situ hydraulic properties of soil con-taining macropores.
Watson and Luxmoore (1986) and Wilson andLuxmoore (1988) quantified water flow in forested soilprofiles through macropores with the use of a tensioninfiltrometer. Watson and Luxmoore (1986) foundthat 73% of the ponded water flux was conductedthrough macropores > 1 mm equivalent diameter andestimated that 96% of the water flux was transmittedthrough 0.32% of the soil volume. Wilson and Lux-moore (1988) reported that 85% of the ponded fluxmoved through macropores. They also reported thatmesopore fluxes (water flux occurring at —0.2 kPa andlower) were sufficient to infiltrate rainfall rates of 17and 25 nm s~' for two watersheds without macroporescontributing to the flow. Moore et al. (1986) also quan-tified the combined effects of soil pore size and pref-erential flow through macropores of a forest soil. Theytook undisturbed cores in the field, however, and useda tension infiltrometer similar to the design reportedby Perroux and White (1988). They derived a densityfunction that was used to relate equivalent pore di-ameter to measured hydraulic conductivity.
The objective of this research was to determine theeffective macroporosity (equivalent pore diameters of5-0.75, 0.75-0.33, and 0.33-0.21 mm) of a Maury siltloam soil under two tillage systems. A secondary ob-jective was to evaluate the effective macroporosity oftwo winter cover crops, rye and vetch.
MATERIALS AND METHODSDouble-ring and tension infiltration measurements were
conducted in 1987 and 1988 on the continuous corn (since1970), long-term no-till plots at the University of Kentucky'sSpindletop research farm. Machinery traffic was not con-trolled at any time. The conventional-tillage plots were notcultivated during the time of the infiltration measurements.In 1987 and 1988, corn was seeded at 57 500 ± 750 seedsha~'. The emergence rate of corn seedlings has historicallybeen 5 to 10% less in the no-till plots than in the conven-tional-tillage plots. The soil is a Maury silt loam with a depth>2 m to limestone bedrock. Infiltration measurements weremade beginning 2 wk after the corn emerged in both years.In 1987, measurements began on June 4 and were completedby July 9. In 1988, measurements began on May 27 andwere completed by June 14. The experimental design was asplit plot with conventional tillage and no-till as the main-plot treatments and hairy vetch and rye cover crops as sub-plot treatments. Tension-infiltrometer measurements weremade on 32 of 64 plots each year (two of the four main plotreplicates).
Two sets of double-ring infiltrometers were installed ineach plot. Each set included an inner ring (272-mm diam.)and an outer ring (397-mm diam.). The inner ring was cen-tered over a row in all cases and at least one corn plant waswithin the boundary of the inner ring. Water was ponded inboth rings for 1 to 2 h depending on the dryness of the soilin the plots. In 1987, =*! h of ponding was sufficient to
817
818 SOIL SCI. SOC. AM. J., VOL. 55, MAY-JUNE 1991
achieve steady-state infiltration; however, 1988 was a muchdrier year and ponding for ss2 h was required to achievesteady-state infiltration. After steady state occurred, the in-filtration rate was determined by measuring the time it tookfor the water level in the inner ring to fall from 70 to 50mm. These measurements were repeated until consistent in-filtration measurements were achieved at least three con-secutive times. The water level in the outer ring wasmaintained at a height of «10 mm below the water level inthe inner ring.
After consistent infiltration measurements were achieved,testing sand was added to the inner ring of one set of ringsin each plot to ensure a level base and good soil contact forthe tension infiltrometer. The sand was poured into the innerring while water was still present in the inner ring. The totaldepth of the testing sand varied from ring to ring, but ingeneral 10 mm or less was adequate to create a level basefor the tension infiltrometer; however, the depth of the sandwas never >20 mm. The testing sand had an air-entry valueslightly lower than —3.0 kPa. At the same time that thetesting sand was being applied, the tension infiltrometer wasprepared for use in the ring with the testing sand.
To prepare the tension infiltrometer, a 20-L bucket wasfilled with water and the infiltrometer was placed in the buck-et. The stopper in the tension-regulating chamber was re-moved and water was poured in until the water level waseven with the top of the air-transfer tube, which connectedthe tension-regulating chamber with the water reservoir. Thetension-regulating chamber was recapped and the water res-ervoir was filled. Water was drawn into the water reservoirwith a hand suction pump. Once water filled the reservoir,the stop cock was closed and the pump removed. The infil-trometer was then carefully removed from the bucket andmoved to the inner ring of the double-ring infiltrometer.
The tension infiltrometer was placed on top of the testingsand in standing water. The stopcock for the lowest negativepressure (—0.4 kPa) was then opened. Shortly after the water
in the inner ring infiltrated completely, air began to bubblethrough the —0.4 kPa tube in the tension-regulating cham-ber. This air was released to the water reservoir through thetransfer tube as water moved out of the base of the tensioninfiltrometer and into the soil/testing sand. The amount ofwater infiltrating into the soil was measured against time byreading a measuring tape attached to the water reservoir.Measurements were repeated until infiltration measure-ments were the same for at least three consecutive readings.In most cases this was achieved within about 20 min for allnegative pressures.
After consistent infiltration was achieved for the —0.4 kPapressure, the —0.9 kPa valve was opened and the —0.4 kPavalve was closed. A lag time occurred before the —0.9 kPatube began to bubble, during which the pores between 0.75-and 0.33-mm equivalent diameter drained or stopped con-ducting water. The procedure for determining the infiltrationrate at —0.9 kPa and —1.4 kPa was the same as that de-scribed for the —0.4 kPa pressure.
The base of the tension infiltrometer is 10 mm in height,the porous membrane, which consists of nylon cloth screen40 urn in thickness with a mesh of 64 nm, has a diameter of222 mm, and the base of the infiltrometer is 254 mm. Thewater reservoir has a diameter of 50 mm. A 19.7-mm dropin water level in the reservoir column corresponds to 1.0 mmof infiltration over the area of the porous membrane. The air-bubble tube is 10 mm above the nylon-screen membrane.
The equivalent pore radius (r) corresponding to each neg-ative pressure was calculated from the capillary-rise equationgiven by:
2y cost* —0.15pgh h [1]
where 7 is the surface tension of water (MT~2), a is the wet-ting angle of the water and the pore wall (assumed to benearly zero; therefore, cosa = 1), p is the density of water
5-
4
3
2
1
5
4
3
2-
1 - •
1987Plot #26'N1R
F = 1.72 + 2.58(kPa) + 1.09(kPa)2
R = 0.999**
1988Plot #25 N1RF = 3.55 + 2.80(kPa) + 0.41 (kPa)2/R = 0.990*
-0.06 kPa
1987Plot #59 C1R
F = 0.66 + 0.87(kPa) + 0,39(kPa)2
R = 0.998**
1988Plot #17 C1R
F = 2.52 + 3.23(kPa) + 1.44(kPa)2
R = 0.999**
-1.5 -1.0 -0.5 0.0 0.5 -1.5 -1.0 -0.5 0.5 1.0
Water pressure, kPa
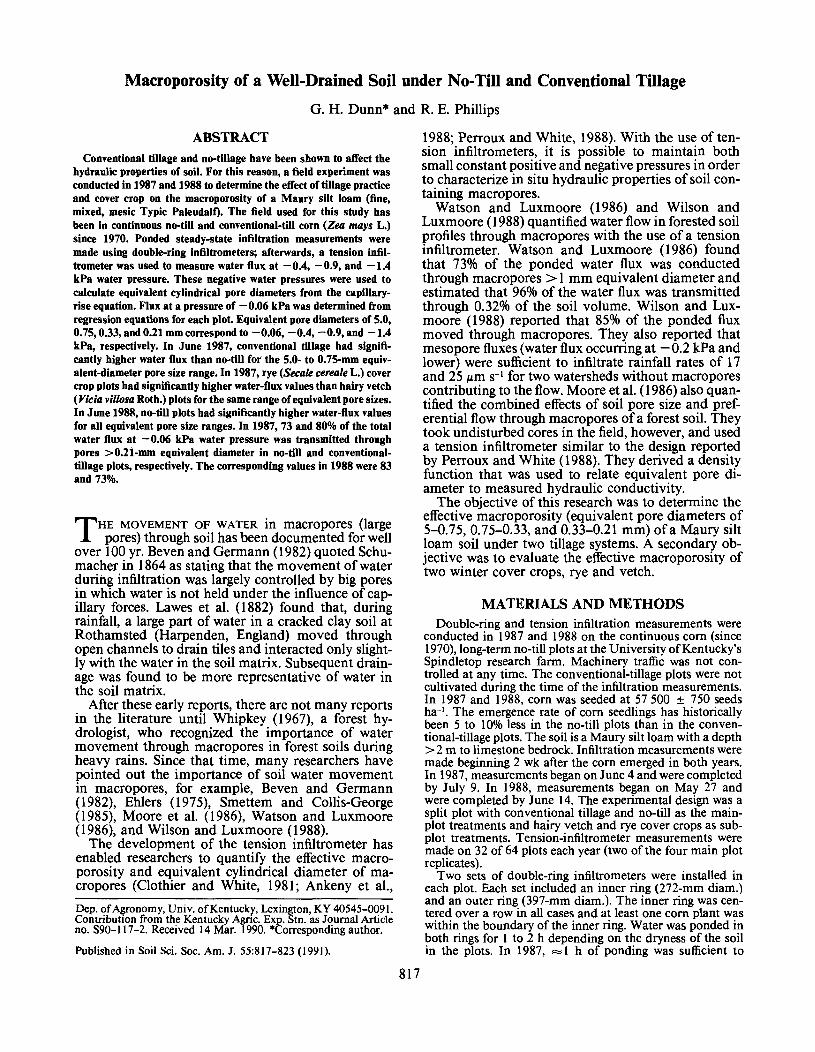
Fig. 1. Infiltration flux at all measured water pressures for two plots in 1987 and two plots in 1988. All regression coefficients were significantat either the 0.10 (t) or 0.05 (*) level of confidence in both 1987 and 1988; xs indicate flux values that were calculated at -0.06 kPa fromthe regression equation of each plot.
DUNN & PHILLIPS: MACROPOROSITY OF A WELL-DRAINED SOIL 819
(ML-3), g is acceleration due to gravity (LT-2), and h is thenegative hydraulic pressure in the tension innltrometer (L).Both ponded and negative-pressure infiltration measure-ments were done under steady-state conditions.
Water flux at —0.06 kPa was estimated by plotting theflux at the +0.6, -0.4, —0.9, and —1.4 kPa pressures. Sec-ond-order regression analysis was used to fit a line to thepoints for each plot, and flux at —0.06 kPa was calculatedfrom the regression equation for each plot. Figure 1 showsexamples of the water flux vs. pressure graphs for four plots.Each regression equation was significant at the 0.10 proba-bility level or less, indicating each line fit the points well.Macroporosity was calculated from the difference in flux (Im)between -0.06 and -0.4; -0.4 and -0.9; and -0.9 and-1.4kPa.
We use the definition of macroporosity proposed by Skopp(1981). He defined macroporosity as the space that providespreferential paths of flow so that mixing and transfer betweensuch pores and remaining pores is limited. According toSkqpp, macropores may consist of interaggregate pore space,shrink/swell cracks, root channels, or faunal tunnels. InSkopp's definition, matrix porosity is the pore space thattransmits water and solute at a rate slow enough to resultin extensive mixing and relatively rapid transfer of moleculesbetween different pores.
The number of equivalent pores per unit area (m2), N(r),in each negative pressure range, —0.06 to —0.4, —0.4 to—0.9, and —0.9 to —1.4 kPa, was estimated using the equa-tion given by Watson and Luxmoore (1986):
N(r) = [2]where /m replaces their Km and equals the difference in in-filtration flux (LT"1) of two sequential water pressures, andM is the viscosity of water (ML-1 T-1): Im is used by Wilsonand Luxmoore (1988).
Watson and Luxmoore (1986) estimated the number ofpores per unit area of soil surface by using the minimumequivalent pore radius for each range of negative water pres-sure used. This results in the maximum number of poresN(r), in each water tension range, since r4 appears in thedenominator of Eq. [2]. We modified their equation by usingthe mean-value theorem to calculate a mean pore number,N(r). The N(r) with respect to the variable r using the mean-value theorem is given by
N(r) = [*nlj/(*pg)] [ J r-4 dr/J dr] [3]a a
where a and b are pore radii of the lower and upper limitsof the integrals of each sequential negative water-pressurerange. For this research, we use the definition of equivalentpo.re radii proposed by Moore et al. (1986). According tothis definition, an equivalent pore radius is the same as thatof a hypothetical cylindrical pore of radius r, that when sat-urated will pass the same flux of water as an irregularlyshaped water-filled pore such as is commonly found in na-ture. We also assume that equivalent pores smaller than thevalue calculated from Eq. [1] are full of water and are re-sponsible for all the flux of water for a given negative waterpressure. Also, we assume that the equivalent pores largerthan the value calculated from Eq. [1] are not contributingto the water flux.
The total effective macroporosity, em, for each negativewater-pressure range was estimated from Eq. [4] (Watsonand Luxmoore, 1986):
em = N(r)irr2 [4]where r is again the minimum equivalent pore radii of eachsequential pressure range. As with the pore-number equation,the mean-value theorem was used to calculate the mean «m
Table 1. Pore radii used to calculate number of pores (N) and ma-croporosity ((„) using minimum equivalent pore radius of eachpressure range from Eq. [1] and average pore radii used to calculateN and tm respectively, in each pressure range.__________
Pore radii
Pressure rangekPa
-0.06 to -0.4-0.4 to -0.9-0.9 to -1.4
Eq. [1]
0.380.170.11
Eq. [3]
0.760.240.13
Eq. [5]
1.560.280.14
for each equivalent pore size range (2.5-0.38-, 0.38-0.17-, and0.17-0.11-mm radius). The average ira by the mean-valuetheorem is given by
b b
T f= LV(r) T I r2 dr] / dr [5]
Table 1 lists the equivalent pore radii calculated using Eq. [1],[3], and [5] for the appropriate equivalent pore size limits.
The infiltration flux (LT-1) data were analyzed with theShapiro-Wilk u statistic (Shapiro and Wilk, 1965) to deter-mine if the data represented random samples from a normaldistribution. In all cases in both years, the infiltration rateand the flux data were found to be represented by log-normaldistributions. This finding is in agreement with the findingsof other researchers studying flow-related variables (Watsonand Luxmoore, 1986; Wilson and Luxmoore, 1988; Scotteret al., 1982; Sharma et al., 1980). Analysis of variance wasconducted on the log-transformed (natural log) infiltrationflux data for each year separately.
RESULTS AND DISCUSSIONInfiltration Flux
The infiltration flux measured at each water pressureand estimated at —0.06 kPa water pressure (see Fig.1 for how flux was estimated at —0.06 kPa) are pre-sented by year in Tables 2 and 3. In 1987, infiltrationflux due to replication and tillage treatment were sta-tistically similar at all measured negative pressures;however, rye cover crop plots had higher infiltrationrates than vetch cover-crop plots at —0.06 kPa waterpressure. We have no explanation for why the rye plotswere significantly higher than the vetch plots.
Comparisons of the coefficients of variation (CV)calculated for each tillage treatment and at each neg-ative pressure in 1987 showed little differences be-tween the no-till and conventional-tillage infiltrationdata for either the arithmetic (Table 2) or the log-transformed (natural log) statistical summaries exceptfor the infiltration flux at the —1.4 kPa for the non-log-transformed summary and the —0.4 kPa log-trans-formed summary. In general, the CVs for both tillagetreatments increased as pressure decreased. In no-tillplots, the CV for infiltration rates at —1.4 kPa waterpressure was 90.0%, while the CVs for the other neg-ative pressures did not exceed 70%. The CV for con-ventional-tillage plots did not change as dramaticallywith decreasing pressure as did the no-till plots.
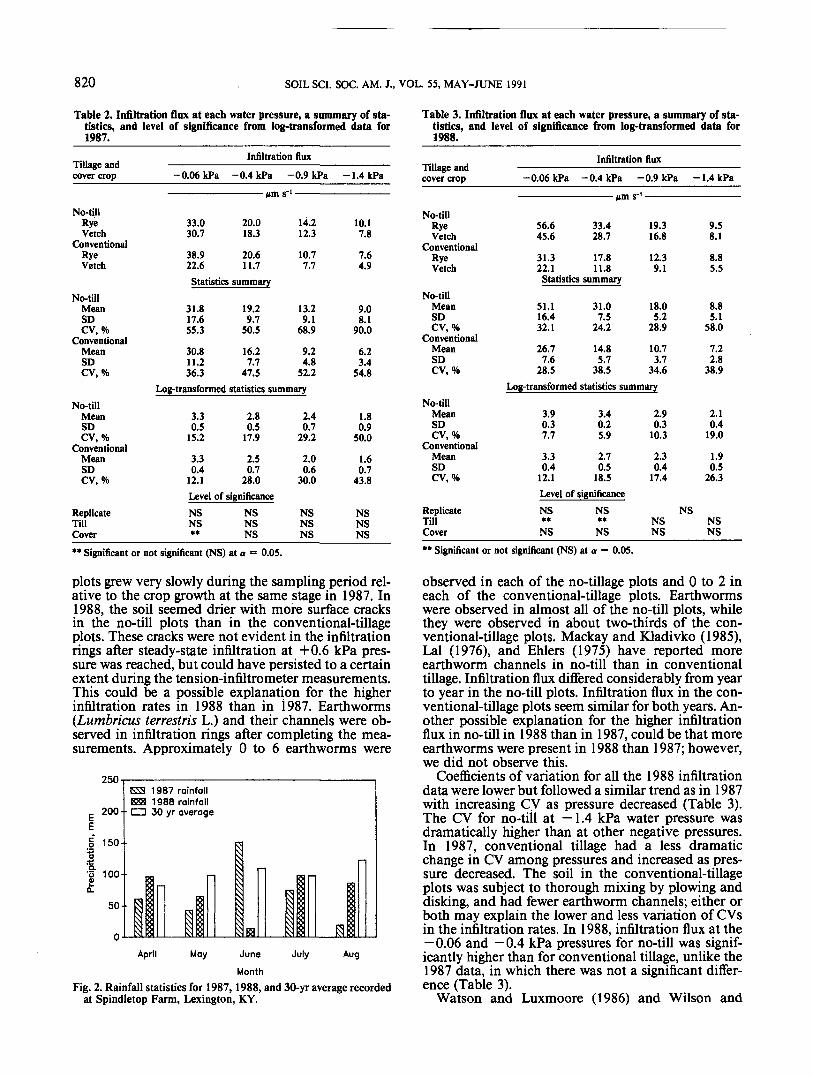
In 1988, infiltration rates were significantly higherin no-till plots at —0.06 and —0.4 kPa water pressures(Table 3). Rainfall during the 1988 growing season wasless than in 1987 (Fig. 2). In 1988, the corn in all the
820 SOIL SCI. SOC. AM. J., VOL. 55, MAY-JUNE 1991
Table 2. Infiltration flux at each water pressure, a summary of sta-tistics, and level of significance from log-transformed data for1987.
Table 3. Infiltration flux at each water pressure, a summary of sta-tistics, and level of significance from log-transformed data for1988.
Tillage andcover crop
No-tillRyeVetch
ConventionalRyeVetch
-0.06 kPa
33.030.7
38.922.6
Infiltration flux-0.4 kPa -0.9 kPa
———— Mm s~'
20.018.3
20.611.7
14.212.3
10.77.7
-1.4kPa
10.17.8
7.64.9
Statistics summaryNo-till
MeanSDCV, %
ConventionalMeanSDCV, %
31.817.655.3
30.811.236.3
19.29.7
50.5
16.27.7
47.5
13.29.1
68.9
9.24.8
52.2
9.08.1
90.0
6.23.4
54.8Log-transformed statistics summary
No-tillMeanSDCV, %
ConventionalMeanSDCV, %
3.30.5
15.2
3.30.4
12.1
2.80.5
17.9
2.50.7
28.0
2.40.7
29.2
2.00.6
30.0
1.80.9
50.0
1.60.7
43.8Level of significance
ReplicateTillCover
NSNS**
NSNSNS
NSNSNS
NSNSNS
** Significant or not significant (NS) at a = 0.05.
plots grew very slowly during the sampling period rel-ative to the crop growth at the same stage in 1987. In1988, the soil seemed drier with more surface cracksin the no-till plots than in the conventional-tillageplots. These cracks were not evident in the infiltrationrings after steady-state infiltration at +0.6 kPa pres-sure was reached, but could have persisted to a certainextent during the tensipn-infiltrometer measurements.This could be a possible explanation for the higherinfiltration rates in 1988 than in 1987. Earthworms(Lumbricus terrestris L.) and their channels were ob-served in infiltration rings after completing the mea-surements. Approximately 0 to 6 earthworms were
250
E 200E§ ISO-
'S 100-
50-
0
^ 1987 rainfallBS3 1988 rainfalldl 30 yr average
April May July AugJune
Month
Fig. 2. Rainfall statistics for 1987,1988, and 30-yr average recordedat Spindletop Farm, Lexington, KY.
Tillage andcover crop
No-tillRyeVetch
ConventionalRyeVetch
No-tillMeanSDCV, %
ConventionalMeanSDCV, %
Infiltration flux-0.06 kPa -0.4 kPa
56.6 33.445.6 28.7
31.3 17.822.1 11.8Statistics summary
51.1 31.016.4 7.532.1 24.2
26.7 14.87.6 5.7
28.5 38.5
-0.9 kPa -.,
19.316.8
12.39.1
18.05.2
28.9
10.73.7
34.6
1.4 kPa
9.58.1
8.85.5
8.85.1
58.0
7.22.8
38.9Log-transformed statistics summary
No-tillMeanSDCV, %
ConventionalMeanSDCV, %
ReplicateTillCover
3.9 3.40.3 0.27.7 5.9
3.3 2.70.4 0.5
12.1 18.5Level of significanceNS NS** **NS NS
2.90.3
10.3
2.30.4
17.4
NSNSNS
2.10.4
19.0
1.90.5
26.3
NSNS
** Significant or not significant (NS) at a = 0.05.
observed in each of the no-tillage plots and 0 to 2 ineach of the conventional-tillage plots. Earthwormswere observed in almost all of the no-till plots, whilethey were observed in about two-thirds of the con-ventional-tillage plots. Mackay and Kladivko (1985),Lal (1976), and Ehlers (1975) have reported moreearthworm channels in no-till than in conventionaltillage. Infiltration flux differed considerably from yearto year in the no-till plots. Infiltration flux in the con-ventional-tillage plots seem similar for both years. An-other possible explanation for the higher infiltrationflux in no-till in 1988 than in 1987, could be that moreearthworms were present in 1988 than 1987; however,we did not observe this.
Coefficients of variation for all the 1988 infiltrationdata were lower but followed a similar trend as in 1987with increasing CV as pressure decreased (Table 3).The CV for no-till at —1.4 kPa water pressure wasdramatically higher than at other negative pressures.In 1987, conventional tillage had a less dramaticchange in CV among pressures and increased as pres-sure decreased. The soil in the conventional-tillageplots was subject to thorough mixing by plowing anddisking, and had fewer earthworm channels; either orboth may explain the lower and less variation of CVsin the infiltration rates. In 1988, infiltration flux at the—0.06 and —0.4 kPa pressures for no-till was signif-icantly higher than for conventional tillage, unlike the1987 data, in which there was not a significant differ-ence (Table 3).
Watson and Luxmoore (1986) and Wilson and
DUNN & PHILLIPS: MACROPOROSITY OF A WELL-DRAINED SOIL 821
Luxmoore (1988) also found CVs increased as hy-draulic pressure decreased. Clothier and White (1981)found the opposite. Clothier and White (1981) statethat measuring sorptivity at a small negative pressureto remove the contribution of macropores increasesthe central tendency of field heterogeneity. We disa-gree with Clothier and White's (1981) statement. Wat-son and Luxmoore (1986) used Poiseuille's law tocalculate the number of macropores contributing tothe infiltration flux for sequential negative hydraulicpressures. The radius raised to the fourth power ap-pears in the denominator of the rearranged Poiseuille'slaw (see Eq. [3]), while the equivalent macropore ra-dius is inversely proportional to the negative pressure(see Eq. [1]).
To further clarify this, one macropore of 5-mmequivalent diameter will transmit as much flow as 16macropores of equivalent diameter of 2.5 mm, assum-ing that nonturbulent flow occurs (Poiseuille's law).One macropore of 5-mm equivalent diameter willtransmit as much water as 1975 macropores of equiv-alent diameter of 0.75 mm, assuming nonturbulentflow (these sizes of macropores correspond to —0.06and —0.4 kPa hydraulic pressures). Assuming non-turbulent flow, the ratios of the corresponding numberof equivalent-diameter macropores to transmit asmuch water at hydraulic pressures of —0.4 as com-pared with —0.9 kPa, and —0.9 as compared with—1.4 kPa, are 26 and 6, respectively. For the completerange of negative pressures of our study, —0.06 to—1.4 kPa, about 300 000 macropores of an equivalentdiameter corresponding to —1.4 kPa are required toequal the flow of one macropore corresponding to anequivalent diameter at —0.06 kPa.
The base of infiltrometers seldom exceed a diameterof 0.25 to 0.30 m or an area of 0.05 to 0.07 m2. Theprobability of an equal number or even one-half anequal number of large macropores being present ineach 0.07 m2 of soil surface is extremely low for narrowhydraulic pressures of —0.06 to —0.12 kPa, whichcorrespond to equivalent diameters of 5 and 2.5 mm.Also, Wilson and Luxmoore (1988) found that the de-crease in infiltration flux could be described by ex-ponential functions of the highest hydraulic pressuresused. Our data (not shown) could also be describedby exponential functions of the hydraulic pressuresused, namely -0.06, -0.4, -0.9, and -1.4 kPa. Theexponential functions for the 1987 data of 7mr, the rel-ative infiltration flux, were 7mr = 1.02 exp( 1.095^) and7mr = 0.93 exp( 1.209i/0 for the no-till and conven-tional-tillage treatments, respectively (^ = hydraulicpressure). The corresponding equations for the 1988data were 7mr = 1.08 exp( 1.335^) and 7mr = 0.93exp(0.944^) for the no-till and conventional tillagetreatments, respectively. All four equations were sig-nificant at the 0.05 probability level or lower. Theabove calculations and equations illustrate why ourCVs as well as those of Watson and Luxmoore (1986)and Wilson and Luxmoore (1988) increased as thenegative hydraulic pressure decreased. Also, Ankenyet al. (1990) found that the variation in infiltration dueto site was approximately an order of magnitude largerthan the variation due to rate-measurement error.They found that the CVs of infiltration rates at hy-
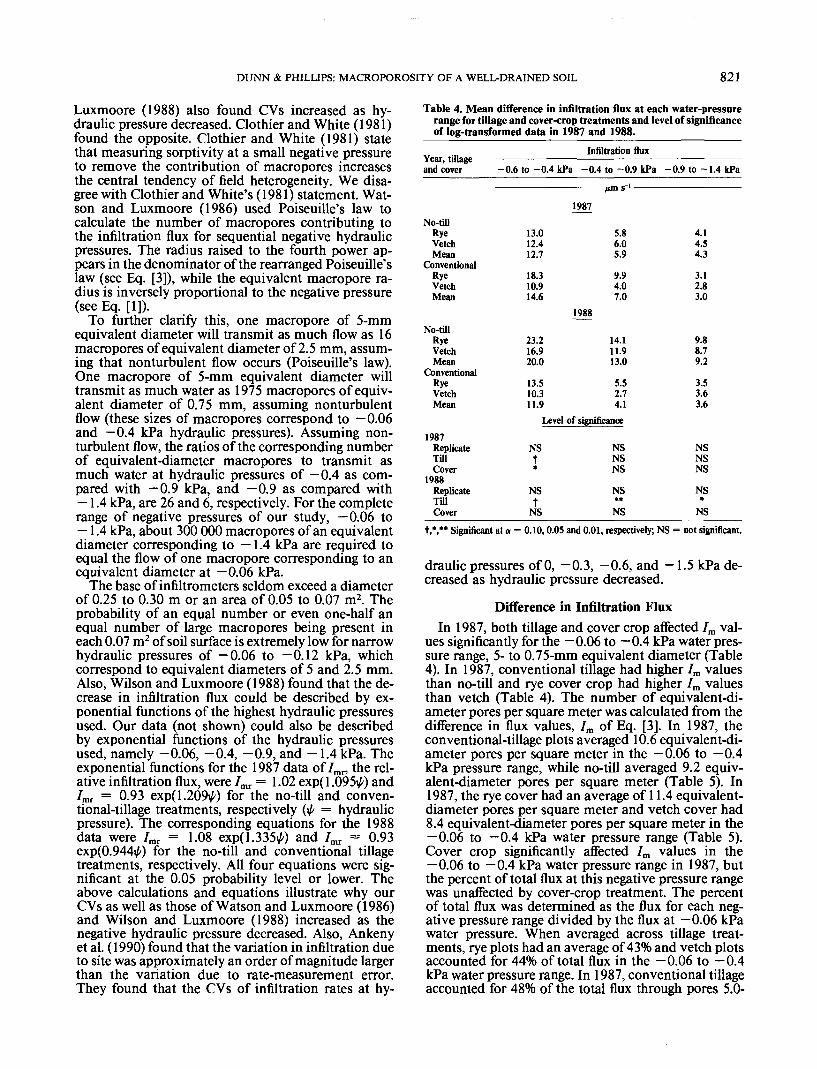
Table 4. Mean difference in infiltration flux at each water-pressurerange for tillage and cover-crop treatments and level of significanceof log-transformed data in 1987 and 1988.
Year, tillageand cover
Infiltration flux-0.6 to -0.4 kPa -0.4 to -0.9 kPa -0.9 to -1.4 kPa
1987No-till
RyeVetchMean
ConventionalRyeVetchMean
No-tillRyeVetchMean
ConventionalRyeVetchMean
13.012.412.7
18.310.914.6
23.216.920.0
13.510.311.9
1988
5.86.05.9
9.94.07.0
14.111.913.0
5.52.74.1
4.14.54.3
3.12.83.0
9.88.79.2
3.53.63.6
Level of significance1987
ReplicateTillCover
1988ReplicateTillCover
NSt*
NSt
NS
NSNSNS
NS**NS
NSNSNS
NS*
NS
t,*,** Significant at a = 0.10,0.05 and 0.01, respectively; NS = not significant.
draulic pressures of 0, —0.3, —0.6, and —1.5 kPa de-creased as hydraulic pressure decreased.
Difference in Infiltration FluxIn 1987, both tillage and cover crop affected 7m val-
ues significantly for the —0.06 to —0.4 kPa water pres-sure range, 5- to 0.75-mm equivalent diameter (Table4). In 1987, conventional tillage had higher 7m valuesthan no-till and rye cover crop had higher 7m valuesthan vetch (Table 4). The number of equivalent-di-ameter pores per square meter was calculated from thedifference in flux values, 7m of Eq. [3]. In 1987, theconventional-tillage plots averaged 10.6 equivalent-di-ameter pores per square meter in the —0.06 to —0.4kPa pressure range, while no-till averaged 9.2 equiv-alent-diameter pores per square meter (Table 5). In1987, the rye cover had an average of 11.4 equivalent-diameter pores per square meter and vetch cover had8.4 equivalent-diameter pores per square meter in the—0.06 to —0.4 kPa water pressure range (Table 5).Cover crop significantly affected 7m values in the—0.06 to —0.4 kPa water pressure range in 1987, butthe percent of total flux at this negative pressure rangewas unaffected by cover-crop treatment. The percentof total flux was determined as the flux for each neg-ative pressure range divided by the flux at —0.06 kPawater pressure. When averaged across tillage treat-ments, rye plots had an average of 43% and vetch plotsaccounted for 44% of total flux in the -0.06 to -0.4kPa water pressure range. In 1987, conventional tillageaccounted for 48% of the total flux through pores 5.0-
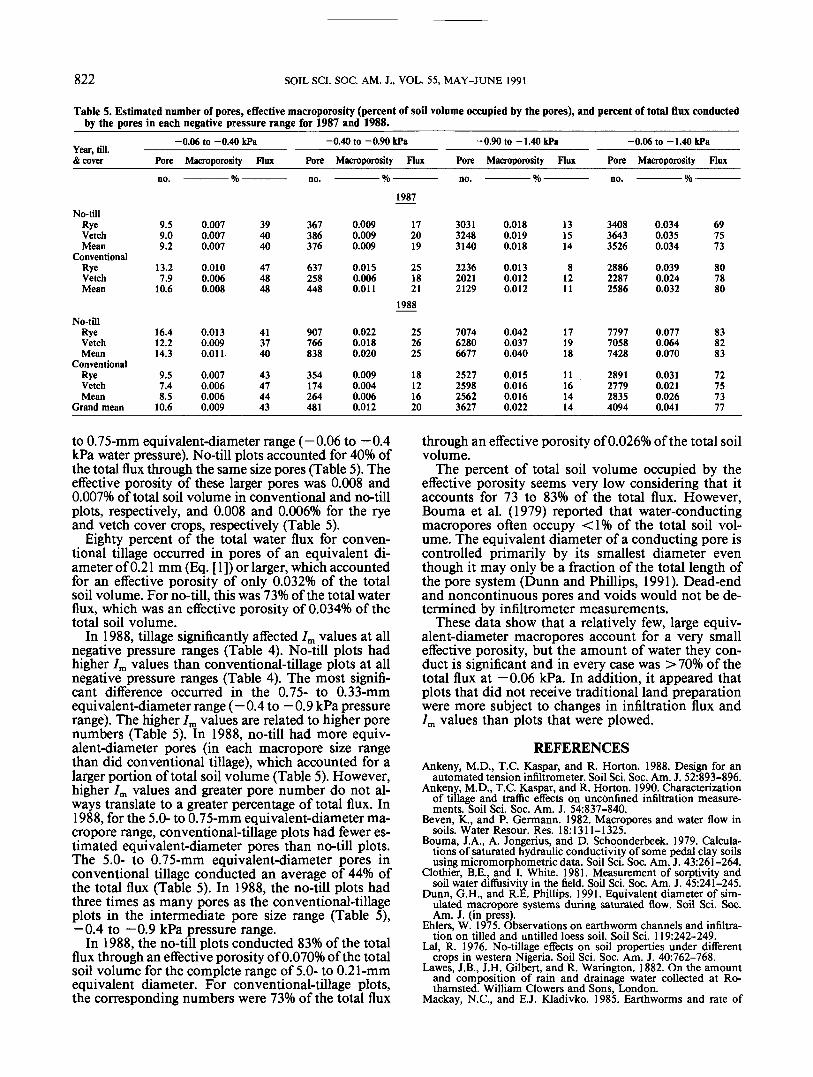
822 SOIL SCI. SOC. AM. J., VOL. 55, MAY-JUNE 1991
Table 5. Estimated number of pores, effective macroporosity (percent of soil volume occupied by the pores), and percent of total flux conductedby the pores in each negative pressure range for 1987 and 1988.
Year, till.& cover
-0.06 to -0.40 kPa -0.40 to -0.90 kPa -0.90 to-1.40 kPa -0.06 to -1.40kPaPore Macroporosity Flux Pore Macroporosity Flux Pore Macroporosity Flux Pore Macroporosity Flux
- % - -%-1987
No-tillRyeVetchMean
ConventionalRyeVetchMean
No-tillRyeVetchMean
ConventionalRyeVetchMean
Grand mean
9.59.09.2
13.27.910.6
16.412.214.3
9.57.48.510.6
0.0070.0070.007
0.0100.0060.008
0.0130.0090.011
0.0070.0060.0060.009
394040
474848
413740
43474443
367386376
637258448
907766838
354174264481
0.0090.0090.009
0.0150.0060.011
0.0220.0180.020
0.0090.0040.0060.012
172019
251821
1988
252625
18121620
303132483140
223620212129
707462806677
2527259825623627
0.0180.0190.018
0.0130.0120.012
0.0420.0370.040
0.0150.0160.0160.022
131514
81211
171918
11161414
340836433526
288622872586
779770587428
2891277928354094
0.0340.0350.034
0.0390.0240.032
0.0770.0640.070
0.0310.0210.0260.041
697573
807880
838283
72757377
to 0.75-mm equivalent-diameter range (—0.06 to —0.4kPa water pressure). No-till plots accounted for 40% ofthe total flux through the same size pores (Table 5). Theeffective porosity of these larger pores was 0.008 and0.007% of total soil volume in conventional and no-tillplots, respectively, and 0.008 and 0.006% for the ryeand vetch cover crops, respectively (Table 5).
Eighty percent of the total water flux for conven-tional tillage occurred in pores of an equivalent di-ameter of 0.21 mm (Eq. [1]) or larger, which accountedfor an effective porosity of only 0.032% of the totalsoil volume. For no-till, this was 73% of the total waterflux, which was an effective porosity of 0.034% of thetotal soil volume.
In 1988, tillage significantly affected 7m values at allnegative pressure ranges (Table 4). No-till plots hadhigher 7m values than conventional-tillage plots at allnegative pressure ranges (Table 4). The most signifi-cant difference occurred in the 0.75- to 0.33-mmequivalent-diameter range (—0.4 to —0.9 kPa pressurerange). The higher 7m values are related to higher porenumbers (Table 5). In 1988, no-till had more equiv-alent-diameter pores (in each macropore size rangethan did conventional tillage), which accounted for alarger portion of total soil volume (Table 5). However,higher 7m values and greater pore number do not al-ways translate to a greater percentage of total flux. In1988, for the 5.0- to 0.75-mm equivalent-diameter ma-cropore range, conventional-tillage plots had fewer es-timated equivalent-diameter pores than no-till plots.The 5.0- to 0.75-mm equivalent-diameter pores inconventional tillage conducted an average of 44% ofthe total flux (Table 5). In 1988, the no-till plots hadthree times as many pores as the conventional-tillageplots in the intermediate pore size range (Table 5),—0.4 to —0.9 kPa pressure range.
In 1988, the no-till plots conducted 83% of the totalflux through an effective porosity of 0.070% of the totalsoil volume for the complete range of 5.0- to 0.21-mmequivalent diameter. For conventional-tillage plots,the corresponding numbers were 73% of the total flux
through an effective porosity of 0.026% of the total soilvolume.
The percent of total soil volume occupied by theeffective porosity seems very low considering that itaccounts for 73 to 83% of the total flux. However,Bouma et al. (1979) reported that water-conductingmacropores often occupy <1% of the total soil vol-ume. The equivalent diameter of a conducting pore iscontrolled primarily by its smallest diameter eventhough it may only be a fraction of the total length ofthe pore system (Dunn and Phillips, 1991). Dead-endand noncontinuous pores and voids would not be de-termined by infiltrometer measurements.
These data show that a relatively few, large equiv-alent-diameter macropores account for a very smalleffective porosity, but the amount of water they con-duct is significant and in every case was >70% of thetotal flux at —0.06 kPa. In addition, it appeared thatplots that did not receive traditional land preparationwere more subject to changes in infiltration flux and7m values than plots that were plowed.
MUGGINS & PAN: WHEAT STUBBLE MANAGEMENT AFFECTS OF WINTER GRAIN LEGUMES 823