macrobenthic community structure over the continental margin of crete (south aegean sea, ne...
TRANSCRIPT
Progress in Oceanography 46 (2000) 401–428
Macrobenthic community structure over thecontinental margin of Crete (South Aegean Sea,
NE Mediterranean)
Anastasios Tselepides*, Konstantia-N. Papadopoulou, DimitrisPodaras, Wanda Plaiti, Drosos Koutsoubas
Institute of Marine Biology of Crete, P.O. Box 2214, 710 03 Heraklion, Crete, Greece
Abstract
Macrobenthic faunal composition, abundance, biomass and diversity together with a suiteof sedimentary environmental parameters were investigated on a seasonal basis in order todetermine factors regulating faunal distribution over the oligotrophic continental margin ofthe island of Crete (South Aegean Sea, North Eastern Mediterranean). Macrofaunal speciescomposition was similar to that of the western Mediterranean and the neighboring Atlantichaving several common dominant species. Mean benthic biomass, abundance and diversitydecreased with depth, with a major transition zone occurring at 540 m, beyond which valuesdeclined sharply. At comparable depths biomass and abundance values were considerablylower to those found in the Atlantic, high-lighting the extreme oligotrophy of the area. Thecontinental margin of Crete was characterised by a high diversity upper continental shelfenvironment (dominated by surface deposit feeding polychaetes) and a very low diversityslope and deep-basin environment (dominated by carnivorous and filter feeding polychaetes).Classification and ordination analyses revealed the existence of four principle clusters dividedby a faunal boundary between 200 and 540 m, as well as beyond 940 m depth. Significantcorrelations between macrofauna and sediment parameters led to the conclusion that besidesdepth, food availability (as manifested by the concentration of chloroplastic pigments) is theprinciple regulating factor in the system. Such being the case, the prevailing hydrographicfeatures that structure the pelagic food web and are directly responsible for the propagationof organic matter to the benthos also affect its community structure. 2000 Elsevier ScienceLtd. All rights reserved.
* Corresponding author.E-mail address:[email protected] (A. Tselepides).
0079-6611/00/$ - see front matter 2000 Elsevier Science Ltd. All rights reserved.PII: S0079 -6611(00 )00027-6
402 A. Tselepides et al. / Progress in Oceanography 46 (2000) 401–428
Contents
1. Introduction . . . . . . . . . . . . . . . . . . . . . . . . . . . . . . . . . . . . . . . . . . 402
2. Materials and methods . . . . . . . . . . . . . . . . . . . . . . . . . . . . . . . . . . . . 404
3. Results . . . . . . . . . . . . . . . . . . . . . . . . . . . . . . . . . . . . . . . . . . . . . 4053.1. Faunal composition . . . . . . . . . . . . . . . . . . . . . . . . . . . . . . . . . . . . 4053.1.1. Species number . . . . . . . . . . . . . . . . . . . . . . . . . . . . . . . . . . . . 4053.1.2. Dominant species . . . . . . . . . . . . . . . . . . . . . . . . . . . . . . . . . . . 4063.1.3. Density . . . . . . . . . . . . . . . . . . . . . . . . . . . . . . . . . . . . . . . . . 4073.1.4. Biomass . . . . . . . . . . . . . . . . . . . . . . . . . . . . . . . . . . . . . . . . . 4113.1.5. Polychaete feeding guilds . . . . . . . . . . . . . . . . . . . . . . . . . . . . . . 411
3.2. Structural analysis . . . . . . . . . . . . . . . . . . . . . . . . . . . . . . . . . . . . 4153.2.1. Diversity indices . . . . . . . . . . . . . . . . . . . . . . . . . . . . . . . . . . . 4153.2.2. Cluster analysis — ordination by multidimensional scaling . . . . . . . . . . 415
3.3. Relationships between macrofaunal community indices and sedimentaryenvironmental parameters . . . . . . . . . . . . . . . . . . . . . . . . . . . . . . . . 415
4. Discussion . . . . . . . . . . . . . . . . . . . . . . . . . . . . . . . . . . . . . . . . . . . 419
Acknowledgements . . . . . . . . . . . . . . . . . . . . . . . . . . . . . . . . . . . . . . . . . . 424
References . . . . . . . . . . . . . . . . . . . . . . . . . . . . . . . . . . . . . . . . . . . . . . . 424
1. Introduction
Although Fredj and Laubier (1985) presented a thorough review concerning quali-tative aspects of the benthic macrofauna composition of the deep Mediterranean Sea,quantitative data from this basin are generally scarce or lacking. This is mainlybecause macrobenthic organisms have been obtained by dredging and trawling sothat reliable quantitative estimates are nonexistent. In addition what estimates doexist have been the product of sieving through a 1 mm screen size and so are under-estimates.
The relationship between abundance and biomass of benthic fauna in the deep seaand enhanced carbon flux to the sediments, as well as the response elicited by thebenthic community, has been well documented in various other parts of the worldoceans (Rowe, 1971; Smith, Laver & Brown, 1983; Lampitt, 1985; Graf, 1989). Thequantity and quality of the descending organic matter that reaches the deep-sea flooris determined by a variety of factors, including primary production, phytoplanktonsinking rate, zooplankton grazing rate, water column depth, mixed layer depth andproximity to land and input sources (Pace, Glasser & Pomeroy, 1984; Wassman,1984). Benthic community biomass, therefore, reflects and integrates the processestaking place in the water column, and tends to be a conservative property, displayinglonger term trends (Rowe, 1971; Graf, Bengstsson, Diesner, Schulz & Theede, 1982).
403A. Tselepides et al. / Progress in Oceanography 46 (2000) 401–428
The Mediterranean sea, and particularly the eastern basin, is one of the most oligo-trophic areas in the world (Boetius, Scheibe, Tselepides & Thiel, 1996). During hisinvestigations in the Aegean Sea, Forbes (1844), reported that life did not existdeeper than 300 fathoms (= ca 550 m), and used the term ‘azoic zone’ to describehis finding. However, more recent investigations have described low-density andlow-diversity conditions of marine invertebrates in the Eastern Mediterranean(Peres & Picard, 1958; Fredj & Laubier, 1985; Janssen, 1989). Por and Dimentman(1989) mentioned that a safe hypothetical figure, concerning the impoverishment inthe general diversity of the marine biota in the Levantine Basin, would be 30%. Thebathyal muds of the Levantine basin have also been reported to be inhospitablehabitats or even azoic after the last ‘sapropelic event’ (Menzies, 1962; Menzies,George & Rowe, 1973; George & Menzies, 1968; Bacescu, 1985). According toPeres (1982), the basic factors responsible for the general impoverishment observedin the Mediterranean are: (i) the high prevailing temperatures (13–14°C) below 200m depth; and (ii) the scarcity of food supply. Indeed studies of the Eastern Mediter-ranean continental slope fauna revealed significant correlations between faunal (bothmeio- and macrofaunal) abundances and biomass, and factors indicating food avail-ability; all being at very low levels compared to temperate regions (Sara`, 1985;Soyer, 1985; Thiel, 1983; De Bove´e, Guidi & Soyer, 1990; Tselepides, 1992; Tselep-ides & Eleftheriou, 1992; Danovaro, Tselepides, Otegui & Della Croce, 2000a; Dano-varo et al., 2000b; Tselepides, Danovaro, Polychronaki, Akoumianaki, Dell’Anno &Marrale, 2000)
The Cretan Sea is located in the northeastern part of the Mediterranean Sea andcomprises the major portion of the South Aegean Sea, lying between the islands ofthe Cyclades plateau and the islands of the Cretan arc. It can be considered as aseparate subsystem of the Eastern Mediterranean because of its high evaporative lossand its climatic, hydrographic and geomorphological diversity and faunal make-up(Tselepides & Eleftheriou, 1992).
Until the beginning of the 1990s, despite the interest in its fauna, the Cretan Seaand the Eastern Mediterranean in general, remained one of the most poorly studiedareas of the world. Earliest records of macrobenthic organisms in the Cretan Sea arethose by Forbes (1844), Raulin (1870) and Jeffreys (1881 and 1883). During theearly 20th century research was sparse with only a few general ecological and faunalsurveys providing scattered information in the E. Mediterranean (Pe´res & Picard,1958; Ledoyer, 1969; Vamvakas 1970, 1973). However, a number of studies in the1990s (Karakassis, 1991; Tselepides 1992, 1994; Tselepides & Eleftheriou, 1992;Koutsoubas, Koukouras, Karakassis & Dounas, 1992; Fiege, Ben-Eliahu & Papado-poulou, 1994; Ben-Eliahu & Fiege, 1996; Karakassis & Eleftheriou, 1997) contrib-uted significantly to our knowledge of the macrobenthic fauna from the continentalshelf and slope of the island of Crete. Even so, our knowledge of the deep macro-benthic fauna of the Cretan Sea remains sparse and has been derived mainly frommaterial collected during the ‘POLA’ Expedition (1890–1893) in the Eastern Medit-erranean (Sturany, 1896).
Investigation of feeding types had provided useful information on the structuralcomplexity of a community as well as the surrounding environment, but few studies
404 A. Tselepides et al. / Progress in Oceanography 46 (2000) 401–428
have been concerned with this aspect and documentation of benthic macrofaunalfeeding types is very limited. Fauchald and Jumars (1979), however, produced anauthoritative manuscript on the Polychaeta. Polychaetes are generally the dominantcomponent of soft sediment macrobenthic infauna in terms of species number, abun-dance and biomass. They provide a good representation of all the sedimentary feed-ing types and therefore analysis of this group alone can be indicative of the wholecommunity. The clarification of polychaete feeding guilds by Fauchald and Jumars(1979) simplified the testing of this theory and was further promoted by Maurer andLeathem (1981) and Gaston (1987). The latter authors found sessile organisms tobe associated with deeper water in less dynamic, more stable sedimentary conditions.However, they also found (in agreement with Fauchald & Jumars, 1979) that it wouldbe unlikely for sessile groups to dominate in poor environments, because the foragingradius required for adequate nutrition at bathyal and abyssal depths exceeded thereach of most sessile individuals.
From 1994 to 1995 a multidisciplinary oceanographic study was conducted in theCretan Sea under the framework of the MTP/MAST EU research programme CINCS(Pelagic–Benthic Coupling in the Oligotrophic Cretan Sea) (Tselepides et al., 1996).One of its primary goals was to achieve a better understanding of the structure andfunction of the benthic ecosystem of the Eastern Mediterranean. The present studywas a subproject of this large programme aiming at: a) analysing in detail the spatialand temporal bathymetric changes occurring to the macrobenthic community of theCretan Sea and b) clarifying the underlying coupling mechanisms on a seasonal basisbetween food supplied to the benthos and the response elicited by the community.
2. Materials and methods
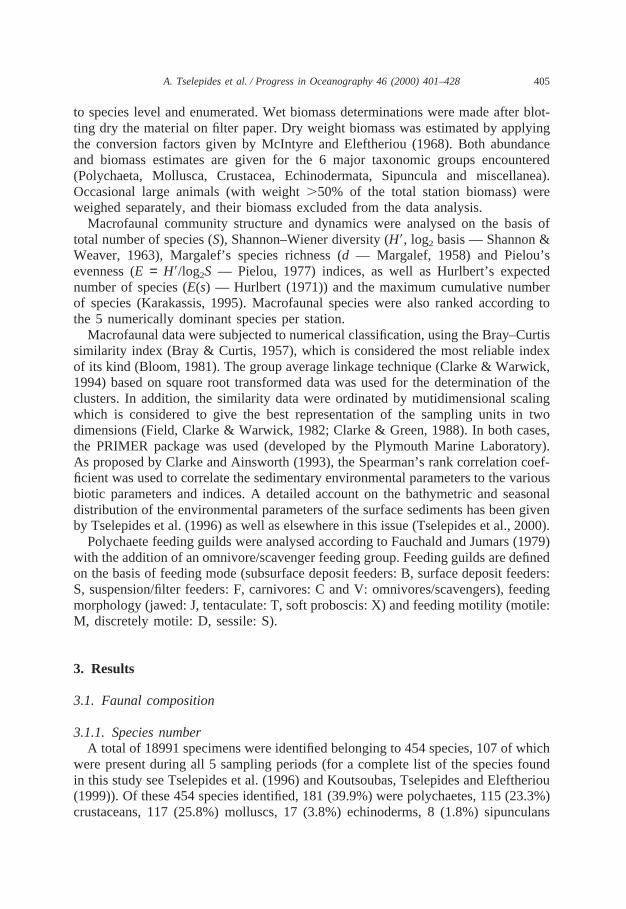
The study area (35°20900–35°35945 N and 024°40900–025°10900 E) (Fig. 1) islocated in the southern part of the Cretan Sea (South Aegean — North EasternMediterranean) north of the Island of Crete. The investigation was undertaken overa grid of 22 stations (along transects A, B, C, D, and E) which were visited once,during May 94, covering a depth range of 40 to 1570 m. Later, intensive biologicaland chemical sampling was undertaken along the main transect D, which consistedof 7 stations at bathymetric depths of 40, 100, 200, 540, 700, 940 and 1570 m. Thesestations were visited on a seasonal basis (September 94, February–March 95, May95 and September 95) with the R/VAegeao.
Quantitative benthic samples were taken with the use of a 0.1 meter square USNELbox corer. Five replicate samples were taken at each of the seven stations alongtransect D during all sampling periods. During May 94, however, only 3 replicateswere collected at the stations along transect D but single samples were collected atthe other 15 grid stations. Samples were sliced into 5 and 10 cm sediment layers(0–5, 5–10 and 10–20) down to 20 cm depth and each was sieved through a 0.5mm mesh. The organisms retained on the mesh were preserved in 4% buffered for-malin for subsequent laboratory analysis. Once in the laboratory, the sample wasstained with Rose Bengal for 24 h, prior to the organisms being sorted, identified
405A. Tselepides et al. / Progress in Oceanography 46 (2000) 401–428
to species level and enumerated. Wet biomass determinations were made after blot-ting dry the material on filter paper. Dry weight biomass was estimated by applyingthe conversion factors given by McIntyre and Eleftheriou (1968). Both abundanceand biomass estimates are given for the 6 major taxonomic groups encountered(Polychaeta, Mollusca, Crustacea, Echinodermata, Sipuncula and miscellanea).Occasional large animals (with weight.50% of the total station biomass) wereweighed separately, and their biomass excluded from the data analysis.
Macrofaunal community structure and dynamics were analysed on the basis oftotal number of species (S), Shannon–Wiener diversity (H9, log2 basis — Shannon &Weaver, 1963), Margalef’s species richness (d — Margalef, 1958) and Pielou’sevenness (E = H9/log2S — Pielou, 1977) indices, as well as Hurlbert’s expectednumber of species (E(s) — Hurlbert (1971)) and the maximum cumulative numberof species (Karakassis, 1995). Macrofaunal species were also ranked according tothe 5 numerically dominant species per station.
Macrofaunal data were subjected to numerical classification, using the Bray–Curtissimilarity index (Bray & Curtis, 1957), which is considered the most reliable indexof its kind (Bloom, 1981). The group average linkage technique (Clarke & Warwick,1994) based on square root transformed data was used for the determination of theclusters. In addition, the similarity data were ordinated by mutidimensional scalingwhich is considered to give the best representation of the sampling units in twodimensions (Field, Clarke & Warwick, 1982; Clarke & Green, 1988). In both cases,the PRIMER package was used (developed by the Plymouth Marine Laboratory).As proposed by Clarke and Ainsworth (1993), the Spearman’s rank correlation coef-ficient was used to correlate the sedimentary environmental parameters to the variousbiotic parameters and indices. A detailed account on the bathymetric and seasonaldistribution of the environmental parameters of the surface sediments has been givenby Tselepides et al. (1996) as well as elsewhere in this issue (Tselepides et al., 2000).
Polychaete feeding guilds were analysed according to Fauchald and Jumars (1979)with the addition of an omnivore/scavenger feeding group. Feeding guilds are definedon the basis of feeding mode (subsurface deposit feeders: B, surface deposit feeders:S, suspension/filter feeders: F, carnivores: C and V: omnivores/scavengers), feedingmorphology (jawed: J, tentaculate: T, soft proboscis: X) and feeding motility (motile:M, discretely motile: D, sessile: S).
3. Results
3.1. Faunal composition
3.1.1. Species numberA total of 18991 specimens were identified belonging to 454 species, 107 of which
were present during all 5 sampling periods (for a complete list of the species foundin this study see Tselepides et al. (1996) and Koutsoubas, Tselepides and Eleftheriou(1999)). Of these 454 species identified, 181 (39.9%) were polychaetes, 115 (23.3%)crustaceans, 117 (25.8%) molluscs, 17 (3.8%) echinoderms, 8 (1.8%) sipunculans
406 A. Tselepides et al. / Progress in Oceanography 46 (2000) 401–428
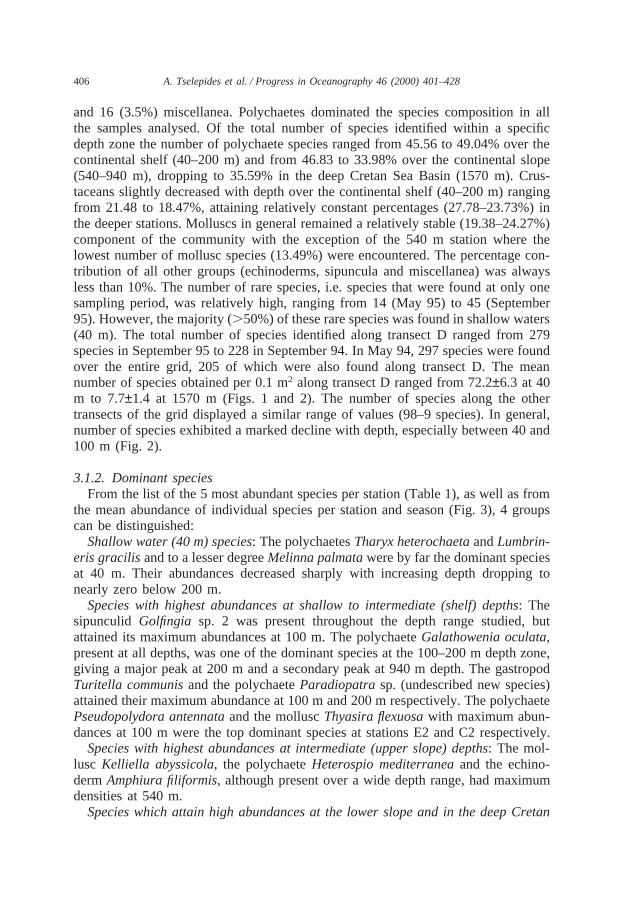
and 16 (3.5%) miscellanea. Polychaetes dominated the species composition in allthe samples analysed. Of the total number of species identified within a specificdepth zone the number of polychaete species ranged from 45.56 to 49.04% over thecontinental shelf (40–200 m) and from 46.83 to 33.98% over the continental slope(540–940 m), dropping to 35.59% in the deep Cretan Sea Basin (1570 m). Crus-taceans slightly decreased with depth over the continental shelf (40–200 m) rangingfrom 21.48 to 18.47%, attaining relatively constant percentages (27.78–23.73%) inthe deeper stations. Molluscs in general remained a relatively stable (19.38–24.27%)component of the community with the exception of the 540 m station where thelowest number of mollusc species (13.49%) were encountered. The percentage con-tribution of all other groups (echinoderms, sipuncula and miscellanea) was alwaysless than 10%. The number of rare species, i.e. species that were found at only onesampling period, was relatively high, ranging from 14 (May 95) to 45 (September95). However, the majority (.50%) of these rare species was found in shallow waters(40 m). The total number of species identified along transect D ranged from 279species in September 95 to 228 in September 94. In May 94, 297 species were foundover the entire grid, 205 of which were also found along transect D. The meannumber of species obtained per 0.1 m2 along transect D ranged from 72.2±6.3 at 40m to 7.7±1.4 at 1570 m (Figs. 1 and 2). The number of species along the othertransects of the grid displayed a similar range of values (98–9 species). In general,number of species exhibited a marked decline with depth, especially between 40 and100 m (Fig. 2).
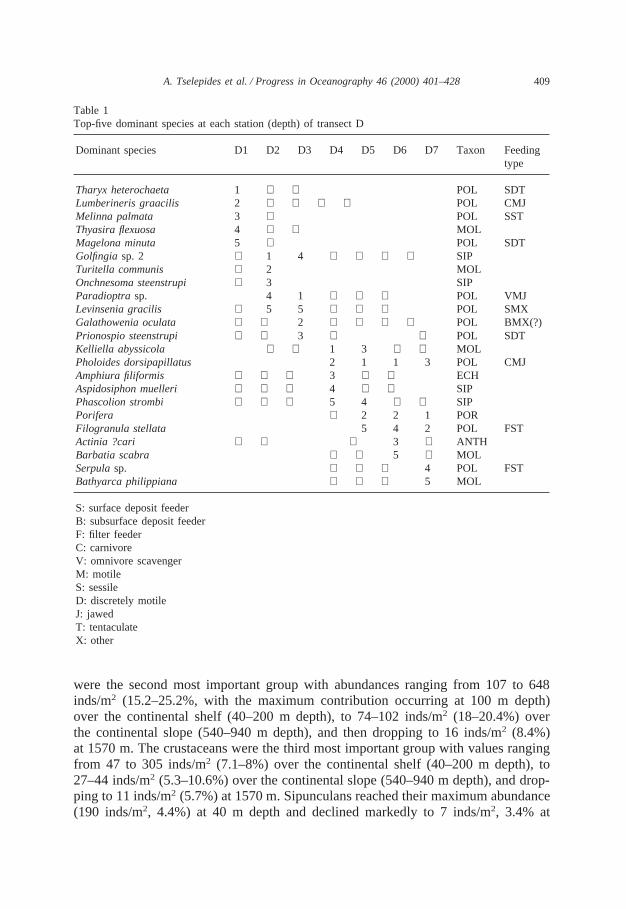
3.1.2. Dominant speciesFrom the list of the 5 most abundant species per station (Table 1), as well as from
the mean abundance of individual species per station and season (Fig. 3), 4 groupscan be distinguished:
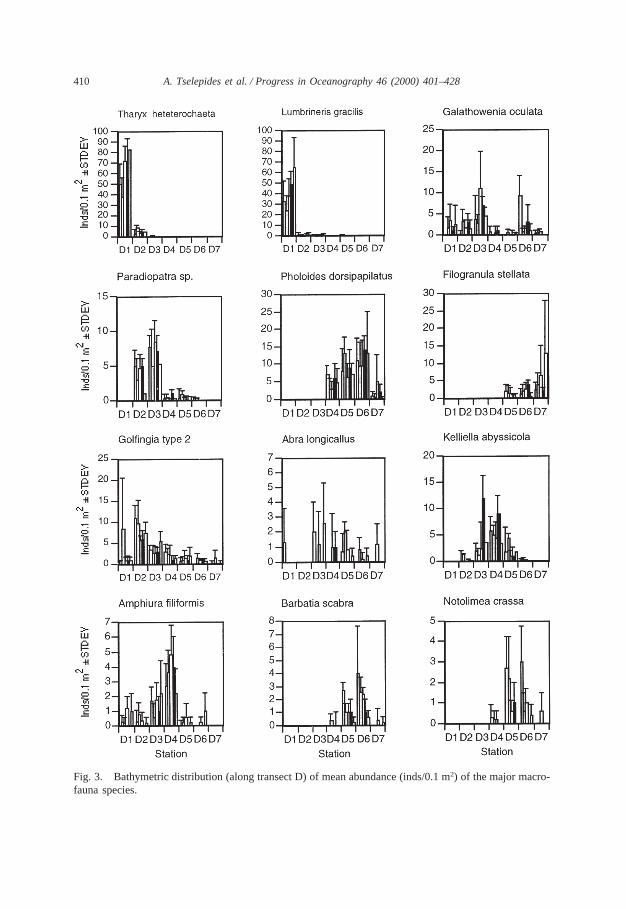
Shallow water (40 m) species: The polychaetesTharyx heterochaetaandLumbrin-eris gracilisand to a lesser degreeMelinna palmatawere by far the dominant speciesat 40 m. Their abundances decreased sharply with increasing depth dropping tonearly zero below 200 m.
Species with highest abundances at shallow to intermediate (shelf) depths: Thesipunculid Golfingia sp. 2 was present throughout the depth range studied, butattained its maximum abundances at 100 m. The polychaeteGalathowenia oculata,present at all depths, was one of the dominant species at the 100–200 m depth zone,giving a major peak at 200 m and a secondary peak at 940 m depth. The gastropodTuritella communisand the polychaeteParadiopatrasp. (undescribed new species)attained their maximum abundance at 100 m and 200 m respectively. The polychaetePseudopolydora antennataand the molluscThyasira flexuosawith maximum abun-dances at 100 m were the top dominant species at stations E2 and C2 respectively.
Species with highest abundances at intermediate (upper slope) depths: The mol-lusc Kelliella abyssicola, the polychaeteHeterospio mediterraneaand the echino-dermAmphiura filiformis, although present over a wide depth range, had maximumdensities at 540 m.
Species which attain high abundances at the lower slope and in the deep Cretan
407A. Tselepides et al. / Progress in Oceanography 46 (2000) 401–428
Fig. 1. The study area in Heraklion Bay and in the Cretan Sea (NE Mediterranean) indicating the stationsof every transect. Transect D was the main transect along which bathymetric trends were studied.
Basin (from 700 to 1570 m): The most abundant species of this group was the poly-chaetePholoides dorsipapillatuswhich dominated the fauna at these depths. ThemolluscsBarbatia scabra, Notolimea crassa, Bathyarca philippianaand B. greno-phia and a few other typical deep sea species such as the crustaceansMakrokylindrussp. andCyclaspis longicaudataexhibited the same density pattern with depth. ThepolychaeteFilogranula stellata along with Pholoides dorsipapillatusand a fewsponge species were the dominant members of the community at 1570 m depth.
3.1.3. DensityAverage total macrobenthic abundance along transect D decreased drastically with
depth ranging from 4263±724 inds/m2 at 40 m, to 191±71 inds/m2 at 1570 m (Fig.2). The sharpest decrease in density (by a factor of 4) was observed between 40 and100 m depth, while a small maximum occurred at 940 m. Densities at the other gridstations were within the same range of values observed along transect D. Polychaeteswere by far the most abundant group with abundances ranging from 395 to 2952inds/m2 (44.5–69.3% contribution) over the continental shelf (40–200 m depth), to173–220 inds/m2 (39.7–43.9%) over the continental slope (540–940 m depth), andthen dropping to 102 inds/m2 (53.4%) in the deep basin (1570 m depth). Molluscs
408 A. Tselepides et al. / Progress in Oceanography 46 (2000) 401–428
Fig. 2. Bathymetric distribution (along transect D) of mean abundance, biomass, number of species,evenness, and diversity. Bars indicate 95% confidence limits.
409A. Tselepides et al. / Progress in Oceanography 46 (2000) 401–428
Table 1Top-five dominant species at each station (depth) of transect D
Dominant species D1 D2 D3 D4 D5 D6 D7 Taxon Feedingtype
Tharyx heterochaeta 1 + + POL SDTLumberineris graacilis 2 + + + + POL CMJMelinna palmata 3 + POL SSTThyasira flexuosa 4 + + MOLMagelona minuta 5 + POL SDTGolfingia sp. 2 + 1 4 + + + + SIPTuritella communis + 2 MOLOnchnesoma steenstrupi + 3 SIPParadioptrasp. 4 1 + + + POL VMJLevinsenia gracilis + 5 5 + + + POL SMXGalathowenia oculata + + 2 + + + + POL BMX(?)Prionospio steenstrupi + + 3 + + POL SDTKelliella abyssicola + + 1 3 + + MOLPholoides dorsipapillatus 2 1 1 3 POL CMJAmphiura filiformis + + + 3 + + ECHAspidosiphon muelleri + + + 4 + + SIPPhascolion strombi + + + 5 4 + + SIPPorifera + 2 2 1 PORFilogranula stellata 5 4 2 POL FSTActinia ?cari + + + 3 + ANTHBarbatia scabra + + 5 + MOLSerpulasp. + + + 4 POL FSTBathyarca philippiana + + + 5 MOL
S: surface deposit feederB: subsurface deposit feederF: filter feederC: carnivoreV: omnivore scavengerM: motileS: sessileD: discretely motileJ: jawedT: tentaculateX: other
were the second most important group with abundances ranging from 107 to 648inds/m2 (15.2–25.2%, with the maximum contribution occurring at 100 m depth)over the continental shelf (40–200 m depth), to 74–102 inds/m2 (18–20.4%) overthe continental slope (540–940 m depth), and then dropping to 16 inds/m2 (8.4%)at 1570 m. The crustaceans were the third most important group with values rangingfrom 47 to 305 inds/m2 (7.1–8%) over the continental shelf (40–200 m depth), to27–44 inds/m2 (5.3–10.6%) over the continental slope (540–940 m depth), and drop-ping to 11 inds/m2 (5.7%) at 1570 m. Sipunculans reached their maximum abundance(190 inds/m2, 4.4%) at 40 m depth and declined markedly to 7 inds/m2, 3.4% at
410 A. Tselepides et al. / Progress in Oceanography 46 (2000) 401–428
Fig. 3. Bathymetric distribution (along transect D) of mean abundance (inds/0.1 m2) of the major macro-fauna species.
411A. Tselepides et al. / Progress in Oceanography 46 (2000) 401–428
1570 m. Their percentage contribution, however, was highest at 100 (17%) and 540(16%) m depth. The contribution of the other groups (echinoderms and miscellanea)was always,100 inds/m2 and generally,50 inds/m2. The exception to this was atstations D6 (940 m) and D7 (1570) where the percentage contribution of ‘miscel-lanea’ was 24–28% (because numerous sponges were encountered).
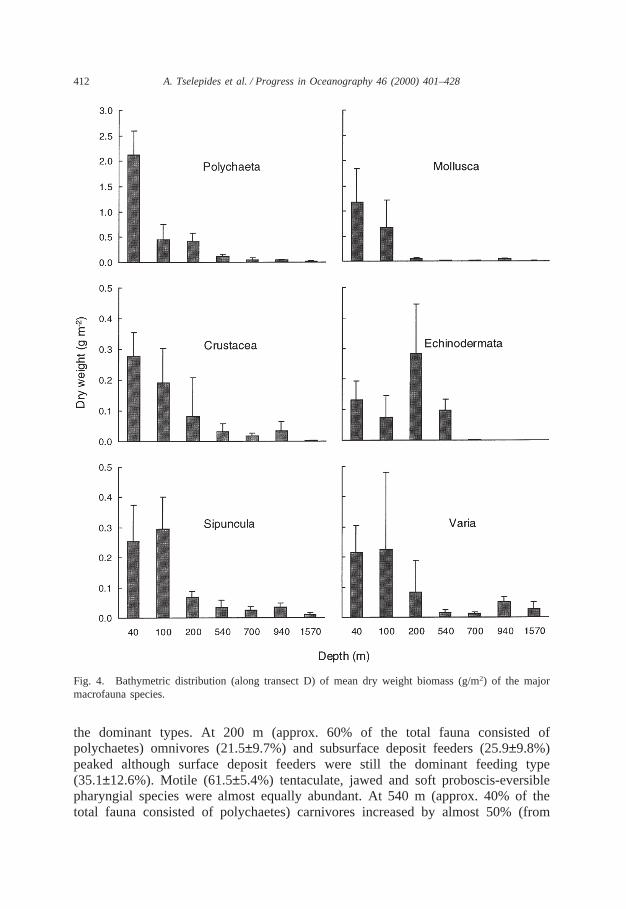
3.1.4. BiomassAverage dry weight macrobenthic biomass along transect D decreased drastically
with depth ranging from 4.169 g/m2 at 40 m to 0.060 g/m2 at 1570 m (Fig. 2).Polychaetes were the main contributor to the biomass at all depths with highestvalues and percentages attained over the continental shelf (0.4–2.1 g/m2, 23.9–60%)and slope (0.04–0.1 g/m2, 19–43%), and lowest in the deep basin (0.01 g/ m2, 25.2%).The Mollusca were the second most important group with highest biomass values(0.7–1.17 g/m2, 28–35% contribution) attained over the upper continental shelf (40–100 m) and lowest (0.008–0.037 g/m2, 2.6–3.8%) over the outer shelf and upperslope (200–540 m) while over the lower slope and deep basin (700–1570 m) values,once again, increased (0.006–0.04 g/m2, 10–21%). Crustacea gradually decreasedwith depth, displaying a weak maximum at 940 m. Highest values (0.08–0.27 g/m2,6.6–10%) were attained over the continental shelf (40–200 m), relatively high values(0.01–0.03 g/m2, 11–17%) over the continental slope (540–940 m) and very lowvalues (0.002 g/m2, 4%) in the deepest station (1570 m depth). Echinoderms peaked(0.28 g/m2, 29%) at 200 m and practically disappeared beyond 700 m depth. Sipuncu-lans reached their maximal biomass (0.25–0.29 g/m2, 6–15.5%) over the upper conti-nental shelf (40–100 m), retained a relatively stable contribution (0.02–0.06 g/m2,7–20%) over the outer shelf and slope, attaining their lowest biomass (0.009 g/m2,15.5%) at 1570 m. With the exception of station D7 (1570 m depth) the miscellanea(varia) had a very similar distribution to the Sipuncula, exhibiting an increase at 100m which was followed by a general decrease with depth and two minor peaks at940 and 1570 m (Fig. 4). In general, dry weight macrofaunal biomass displayed anexponential decrease with depth. Thus, the shallow continental shelf stations (40–200 m) exhibited much higher biomass values (0.9–4.1 g/m2) as well as variability,compared to the deeper continental slope stations (0.11–0.30 g/m2) and the deepbasin stations (0.06 g/m2) (Fig. 4).
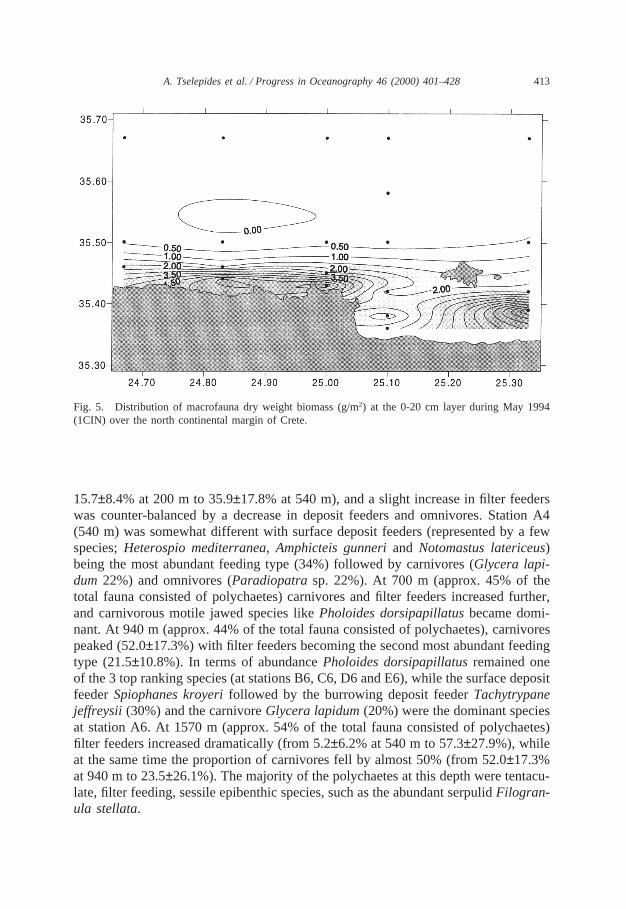
The horizontal distribution of macrofaunal biomass over the study area (Fig. 5)displayed highest biomass values (2–4 g/m2) along the coastline and at a distanceof 3–5 nm from the coast.
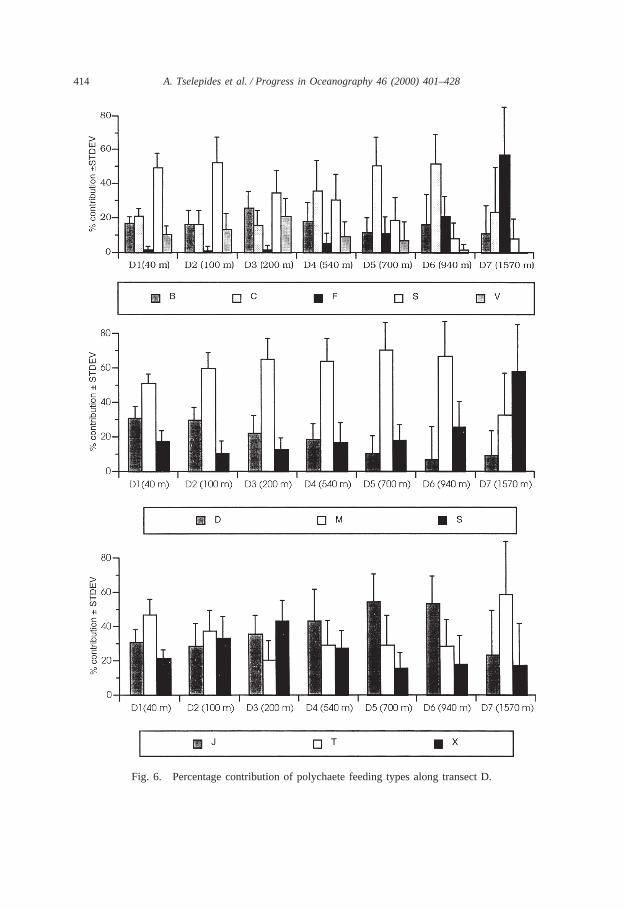
3.1.5. Polychaete feeding guildsAt 40 m (approx. 70% of the total fauna consisted of polychaetes) the dominant
feeding type was deposit feeders (surface deposit feeders: 49.7±8.4% and subsurfacedeposit feeders: 16.8±4.1%) followed by carnivores (21.3±4.1%) (Fig. 6). Motile andtentaculate forms were dominant with regard to feeding motility and morphology.At 100 m (approx. 45% of the total fauna consisted of polychaetes) the distributionwas similar with a slight increase in surface deposit feeders andomnivores/scavengers. Tentaculate and soft proboscis species were morphologically
412 A. Tselepides et al. / Progress in Oceanography 46 (2000) 401–428
Fig. 4. Bathymetric distribution (along transect D) of mean dry weight biomass (g/m2) of the majormacrofauna species.
the dominant types. At 200 m (approx. 60% of the total fauna consisted ofpolychaetes) omnivores (21.5±9.7%) and subsurface deposit feeders (25.9±9.8%)peaked although surface deposit feeders were still the dominant feeding type(35.1±12.6%). Motile (61.5±5.4%) tentaculate, jawed and soft proboscis-eversiblepharyngial species were almost equally abundant. At 540 m (approx. 40% of thetotal fauna consisted of polychaetes) carnivores increased by almost 50% (from
413A. Tselepides et al. / Progress in Oceanography 46 (2000) 401–428
Fig. 5. Distribution of macrofauna dry weight biomass (g/m2) at the 0-20 cm layer during May 1994(1CIN) over the north continental margin of Crete.
15.7±8.4% at 200 m to 35.9±17.8% at 540 m), and a slight increase in filter feederswas counter-balanced by a decrease in deposit feeders and omnivores. Station A4(540 m) was somewhat different with surface deposit feeders (represented by a fewspecies;Heterospio mediterranea, Amphicteis gunneriand Notomastus latericeus)being the most abundant feeding type (34%) followed by carnivores (Glycera lapi-dum 22%) and omnivores (Paradiopatrasp. 22%). At 700 m (approx. 45% of thetotal fauna consisted of polychaetes) carnivores and filter feeders increased further,and carnivorous motile jawed species likePholoides dorsipapillatusbecame domi-nant. At 940 m (approx. 44% of the total fauna consisted of polychaetes), carnivorespeaked (52.0±17.3%) with filter feeders becoming the second most abundant feedingtype (21.5±10.8%). In terms of abundancePholoides dorsipapillatusremained oneof the 3 top ranking species (at stations B6, C6, D6 and E6), while the surface depositfeederSpiophanes kroyerifollowed by the burrowing deposit feederTachytrypanejeffreysii (30%) and the carnivoreGlycera lapidum(20%) were the dominant speciesat station A6. At 1570 m (approx. 54% of the total fauna consisted of polychaetes)filter feeders increased dramatically (from 5.2±6.2% at 540 m to 57.3±27.9%), whileat the same time the proportion of carnivores fell by almost 50% (from 52.0±17.3%at 940 m to 23.5±26.1%). The majority of the polychaetes at this depth were tentacu-late, filter feeding, sessile epibenthic species, such as the abundant serpulidFilogran-ula stellata.
414 A. Tselepides et al. / Progress in Oceanography 46 (2000) 401–428
Fig. 6. Percentage contribution of polychaete feeding types along transect D.
415A. Tselepides et al. / Progress in Oceanography 46 (2000) 401–428
3.2. Structural analysis
3.2.1. Diversity indicesThe Shannon–Wiener (H9) and Margalef indices decreased with increasing depth
especially between 40 and 100 m depth, and between 940 and 1570 m depth.H9values ranged from 5.0±0.1 at 40 m to 2.4±0.3 at 1570 m and Margalef’s speciesrichness index ranged from 8.2±0.5 at 40 m to 1.7±0.2 at 1570 m (Fig. 2). Evennessinitially increased with depth down to 540 m then declined at 940 m and increasedagain at 1570 m (Fig. 2). The lower values found at the 40 and 940 m stations werethe result of the strong dominance of the polychaete speciesTharyx heterochaetaand Lumbrineris gracilisat 40 m andPholoides dorsipapillatusat 940 m.
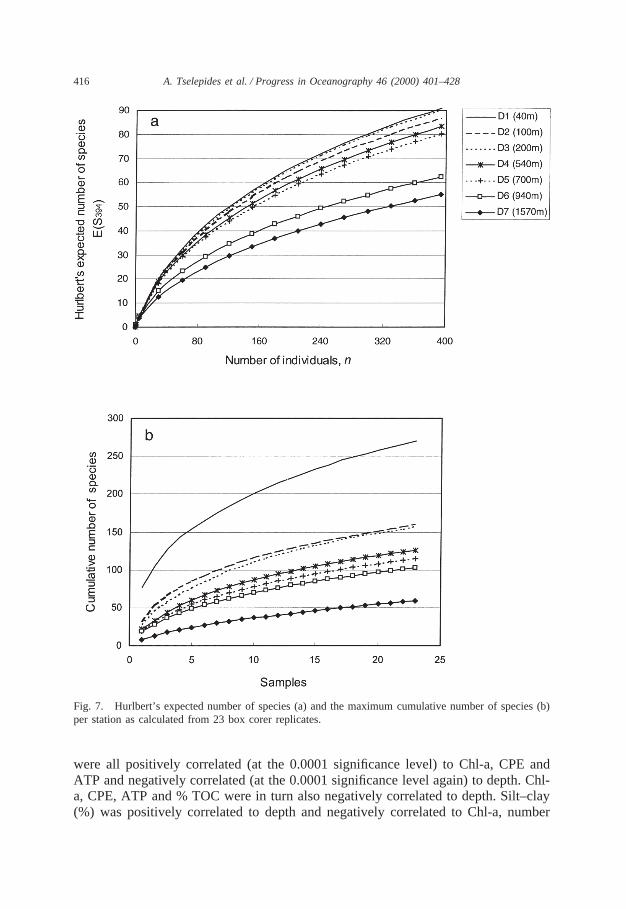
Hurlbert’s expected number of species per station at the level of 394 individualsdecreased with increasing depth especially beyond 700 m depth (Fig. 7). Two clustersof stations are clearly evident, one consisting of the shelf and upper slope stations(40–700 m depth) with expected number of species ranging from 80 to 90, and theother consisting of the outer slope and deep basin stations (940–1570 m depth) withexpected number of species ranging from 55 to 62. The maximum cumulative num-ber of species per station for 23 replicates (Fig. 7) displayed a somewhat differentpattern consisting of four discrete clusters. The 40 m station displayed the highestcumulative number of species (270). The 100 and 200 m stations formed a clusteron their own with cumulative number of species ranging from 157 to 160. The 540,700 and 940 m stations formed a third cluster with cumulative number of speciesranging from 103 to 126, while the 1570 m station was classified separately attainingthe lowest cumulative number of species (59).
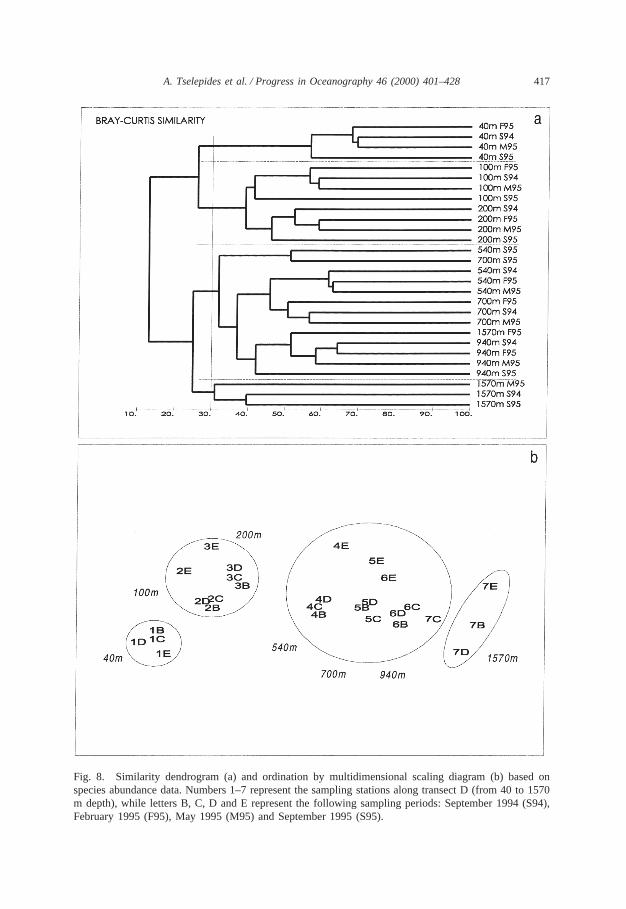
3.2.2. Cluster analysis — ordination by multidimensional scalingThe cluster analysis similarity dendrogram (Fig. 8a) took into account all stations
along transect D by pooling the data (5 replicates pooled together into one sample)acquired during the 4 sampling periods (September 94 — B, March 95 — C, May95 — D and September 95 — E). At the 30% similarity level 4 groups were clearlydistinguished: 40, 100–200, 540–700–940 and 1570 m. In general, samples taken atthe same depth were clustered together irrespective of season. Ordination by multidi-mensional scaling (MDS), based on the same similarity matrix, displayed a similarpattern (Fig. 8b), i.e. the same 4 principal groups were identified with a prominentfaunal boundary clearly marked at 540 m. Considering the seasonal arrangement ofsamples the September 95 samples (E) were clearly separated from the samples takenduring the other periods (B, C and D).
3.3. Relationships between macrofaunal community indices and sedimentaryenvironmental parameters
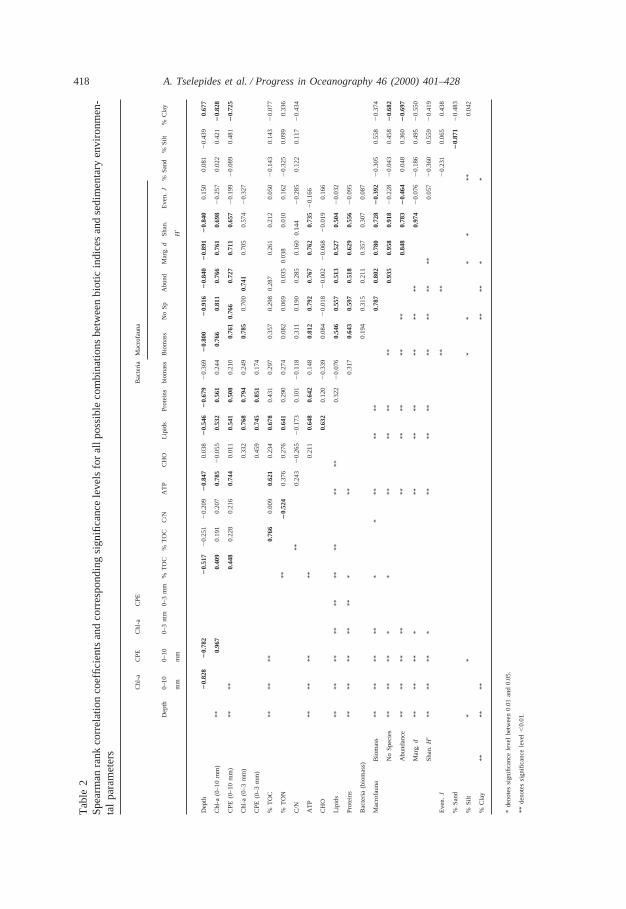
Table 2 lists the Spearman rank correlation coefficients and the correspondingsignificance levels for all possible combinations between macrofaunal biotic indicesand a suite of environmental parameters. Number of species, biomass, abundance,ShannonH9 diversity index, evennessJ and Margalef’s species richness indexd
416 A. Tselepides et al. / Progress in Oceanography 46 (2000) 401–428
Fig. 7. Hurlbert’s expected number of species (a) and the maximum cumulative number of species (b)per station as calculated from 23 box corer replicates.
were all positively correlated (at the 0.0001 significance level) to Chl-a, CPE andATP and negatively correlated (at the 0.0001 significance level again) to depth. Chl-a, CPE, ATP and % TOC were in turn also negatively correlated to depth. Silt–clay(%) was positively correlated to depth and negatively correlated to Chl-a, number
417A. Tselepides et al. / Progress in Oceanography 46 (2000) 401–428
Fig. 8. Similarity dendrogram (a) and ordination by multidimensional scaling diagram (b) based onspecies abundance data. Numbers 1–7 represent the sampling stations along transect D (from 40 to 1570m depth), while letters B, C, D and E represent the following sampling periods: September 1994 (S94),February 1995 (F95), May 1995 (M95) and September 1995 (S95).
418 A. Tselepides et al. / Progress in Oceanography 46 (2000) 401–428T
able
2S
pear
man
rank
corr
elat
ion
coef
ficie
nts
and
corr
espo
ndin
gsi
gnifi
canc
ele
vels
for
allp
ossi
ble
com
bina
tions
betw
een
biot
icin
dice
san
dse
dim
enta
ryen
viro
nmen
-ta
lpa
ram
eter
s
Chl
-aC
PE
Chl
-aC
PE
Bac
teria
Mac
rofa
una
Dep
th0–
100–
100–
3m
m0–
3m
m%
TO
C%
TO
CC
/NA
TP
CH
OLi
pids
Pro
tein
sbi
omas
sB
iom
ass
No
Sp
Abu
ndM
arg.
dS
han.
Eve
n.J
%S
and
%S
ilt%
Cla
y
mm
mm
H9
Dep
th2
0.82
82
0.78
22
0.51
72
0.25
12
0.20
92
0.84
70.
038
20.
546
20.
679
20.
369
20.
800
20.
916
20.
840
20.
891
20.
840
0.15
00.
081
20.
439
0.67
7
Chl
-a(0
–10
mm
)**
0.96
70.
409
0.19
10.
207
0.78
52
0.05
50.
532
0.56
10.
244
0.76
60.
811
0.76
60.
761
0.69
820.
257
0.02
20.
421
20.
828
CP
E(0
–10
mm
)**
**0.
448
0.22
80.
216
0.74
40.
011
0.54
10.
508
0.21
00.
761
0.76
60.
727
0.71
10.
6572
0.19
92
0.08
90.
481
20.
725
Chl
-a(0
–3m
m)
0.33
20.
768
0.79
40.
249
0.78
50.
700
0.74
10.
705
0.57
42
0.32
7
CP
E(0
–3m
m)
0.45
90.
745
0.85
10.
174
%T
OC
****
**0.
766
0.00
90.
621
0.23
40.
678
0.43
10.
297
0.35
70.
298
0.28
70.
261
0.21
20.
05020.
143
0.14
32
0.07
7
%T
ON
**2
0.52
40.
376
0.27
60.
641
0.29
00.
274
0.08
20.
069
0.03
50.
038
0.01
00.
16220.
325
0.09
90.
336
C/N
**0.
243
20.
265
20.
173
0.10
12
0.11
80.
311
0.19
00.
285
0.16
00.
144
20.
285
0.12
20.
117
20.
434
AT
P**
****
**0.
211
0.64
80.
642
0.14
80.
812
0.79
20.
767
0.76
20.
7352
0.16
6
CH
O0.
632
0.12
02
0.33
90.
084
20.
018
20.
002
20.
068
20.
019
0.16
6
Lipi
ds**
****
****
****
****
0.32
22
0.07
60.
546
0.55
70.
513
0.52
70.
5042
0.03
2
Pro
tein
s**
****
****
***
0.31
70.
643
0.59
70.
518
0.62
90.
5562
0.09
5
Bac
teria
(bio
mas
s)0.
194
0.31
50.
211
0.35
70.
307
0.08
7
Mac
rofa
una
Bio
mas
s**
****
***
***
****
0.78
70.
802
0.78
00.
728
20.
392
20.
305
0.55
82
0.37
4
No
Spe
cies
****
***
***
****
**0.
935
0.95
80.
918
20.
228
20.
043
0.45
82
0.68
2
Abu
ndan
ce**
****
****
****
****
0.84
80.
783
20.
464
0.04
80.
360
20.
697
Mar
g.d
****
***
****
****
****
0.97
42
0.07
62
0.18
60.
495
20.
550
Sha
n.H
9**
****
***
****
****
****
0.05
72
0.36
00.
559
20.
419
Eve
n.J
****
20.
231
0.06
50.
438
%S
and
20.
871
20.
483
%S
ilt*
**
**
***
0.04
2
%C
lay
****
****
***
*
*de
note
ssi
gnifi
canc
ele
vel
betw
een
0.01
and
0.05
.
**de
note
ssi
gnifi
canc
ele
vel,
0.01
.
419A. Tselepides et al. / Progress in Oceanography 46 (2000) 401–428
of species and macrobenthic biomass. Some parameters were also significantly corre-lated to each other but this was not surprising since they are considered to be intrinsi-cally linked (ShannonH9, Margalef and abundance with number of species; biomassand Chl-a with CPE). Carbohydrates (CHO) were not significantly correlated to Chl-a, CPE and the various biotic indices, while lipids and proteins displayed the oppositetrend being significantly correlated to all the fore-mentioned parameters.
4. Discussion
The macrofaunal composition of the continental margin of the island of Crete israther similar to that of the western Mediterranean, the neighboring Atlantic and theNorth Sea, in having several dominant species in common. The observed speciescomposition basically conforms to a shallow terrigenous mud assemblage (sensuPeres, 1982) characterized by the polychaetesNepthys assimilis, Tharyx heterochaetaandLumbrineris gracilis, numerous live individuals of the gastropod speciesTurit-ella communisand dead shells of the same species inhabited by the sipunculanAspi-dosiphon muelleriand various species of hermit crabs. AnAmphiura filiformis–Nuc-ula sulcataassemblage is found at 100–200 m similar to that recorded off the Catalancoast of Spain (Guille, 1970; Desbruye`res, Guille & Ramos, 1972) and in the NorthAegean Sea (Strymonikos Gulf; Dounas & Koukouras, 1992). In the deeper stationsthe observed species composition conforms in general to the bathyal mudAbra long-icallus assemblage, and is very similar to that of other areas of the Mediterraneanand the neighboring NE Atlantic (Vamvakas, 1970; Di Geronimo, 1974; Janssen,1989). The difference lies in the low abundance and biomass, the small individualsize and the occurrence of rare species.
It is difficult to compare quantitatively the investigation of the Cretan shelf toother Mediterranean studies, primarily because very few similar studies exist thathave employed similar sampling techniques. Even recent studies in the eastern Medi-terranean (Janssen, 1989) have not always used quantitative grab samplers nor the0.5 mm sieves that are now considered standard. However, comparisons can be madewith the neighboring Atlantic Ocean.
In contrast to classic studies in the NW Atlantic, which show an increase withdepth in the diversity of a variety of macrofaunal taxa from the shelf to upper-rise depths (Sanders, 1968; Rex, 1981), this study revealed a decreasing pattern ofmacrofaunal diversity, as well as abundance and biomass. The large difference inthe maximum cumulative number of species between the 40 and 1570 m stations(270 and 59, respectively) clearly reflects the extreme environmental differencesencountered over the continental margin of Crete (within a distance of 25 nm only).The latter is characterised by a high diversity upper continental shelf environmentthat soon gives way to a very low diversity slope and deep-basin. This realizationalone has important implications regarding the sensitivity of the coastal environmentto anthropogenic disturbances, thus touching upon issues of biodiversity conservationand sustainable management of coastal and offshore ecosystems.
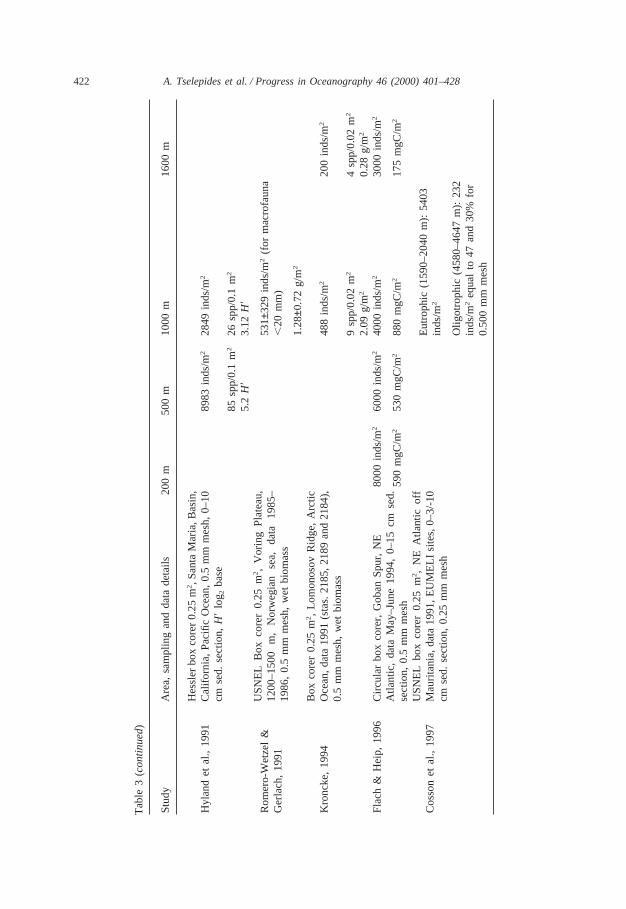
In a comparable study (covering a depth range of 90–565 m and using box corer
420 A. Tselepides et al. / Progress in Oceanography 46 (2000) 401–428
samples and a 0.5 mm mesh) conducted by Hyland, Baptiste, Campbell, Kennedy,Kropp and Williams (1991), over the outer continental shelf of Santa Maria, Califor-nia, species diversity values (H9, 3.12–5.6), macrofaunal densities (2849–19,590 indsper m2) and numbers of species (26–138 spp. per 0.1 m2) were considerably higherthan those encountered in the present study (4.0–4.3H9, 435–907 inds/m2, 22–33spp./m2 at a depth range of 100–540 m) (Table 3). This was also the case whencomparing the present study to the George’s Bank (densities of 2500–55,000 per m2
andH9 values of 1.1–5.7 (Neff, Bothner, Maciolek & Grassle, 1989)), and areas ofthe North Sea that were unaffected by oil-platform discharges (densities of 13,000–20,000 per m2 and H9 values of 4.3–5.8 (Kingston, 1987)). Macrofaunal densitiesfrom the continental slope and deep basin of the Cretan Sea (from 540 to 1570 mdepth) were 10–15 times lower than those reported by Flach and Heip (1996) fromthe Goban Spur area in the NE Atlantic. Density and biomass values reported forthe Voring Plateau in the Norwegian Sea (using boxcore and 0.5 mm mesh over adepth range of 1200–1500 m (Romero-Wetzel & Gerlach, 1991)) were 2.5 and 4times higher, respectively, compared to those found at 1570 m in the present study.Even at the EUMELI oligotrophic site (in the tropical NE Atlantic, off Mauritania—Cosson, Sibuet & Galeron, 1997) samples from 4500 m depth gave values that wereonly half those reported in the Cretan Sea at 1570 m. Kro¨ncke (1994) in her studyof the Lomonosov Ridge in the Arctic Ocean reported macrofaunal community struc-ture as being similar to that described by Tselepides and Eleftheriou (1992) for theCretan Sea and Rowe et al. (1991) for the Atlantic Ocean. Kro¨ncke’s (1994) densityand biomass values at 1000 and 1600 m depth were very similar to those found inthis study while values given by Tselepides and Eleftheriou (1992), were lower prob-ably because they were obtained with a 0.1 m2 Smith–McIntyre grab sampler.Biomass and density values from 200 m depth obtained previously using grab sam-plers (Tselepides & Eleftheriou, 1992; Eleftheriou, Smith & Tselepides, 1996) gavevalues 2.3 and 1.2 times lower than those recorded in this study (obtained from 0.1m2 boxcore samples) (Table 3). The differences between values extrapolated fromgrab and boxcore samples become larger with depth: biomass and density valuesgiven by Tselepides and Eleftheriou (1992) for stations D4 and D6 (540 and 940 mdepth) are 2.6–3.3 and 1.9–2.8 times lower than those given in this study. The grabsampler is evidently less efficient and so the extrapolated density and biomass valuesare underestimates (at 200 m grabs capture 86% of the equivalent boxcore densityand 43% of the biomass, while at 940 m the equivalent figures are 36 and 30%).
Dry biomass estimates (3.957±0.900 g/m2 at 40 m to 0.056±0.026 g/m2 at 1570m) of this study are in agreement with the findings of Tchukhtchin (1964) from theTyrrhenean Sea, who reported that biomass values between 200 and 1000 m neverexceeded 0.4 g/m2 and stressed the extreme poverty observed in the bathyal zone.The decrease in biomass in our study is much more pronounced compared to thedecrease in numbers of individuals, possibly because of the small average size ofMediterranean species in the eastern part of the basin (Pe´res, 1982). This latter con-clusion alone indicates that food availability is the main environmental variable gov-erning the structure of the ecosystem.
The high biomass values encountered along the upper shelf could be the result of
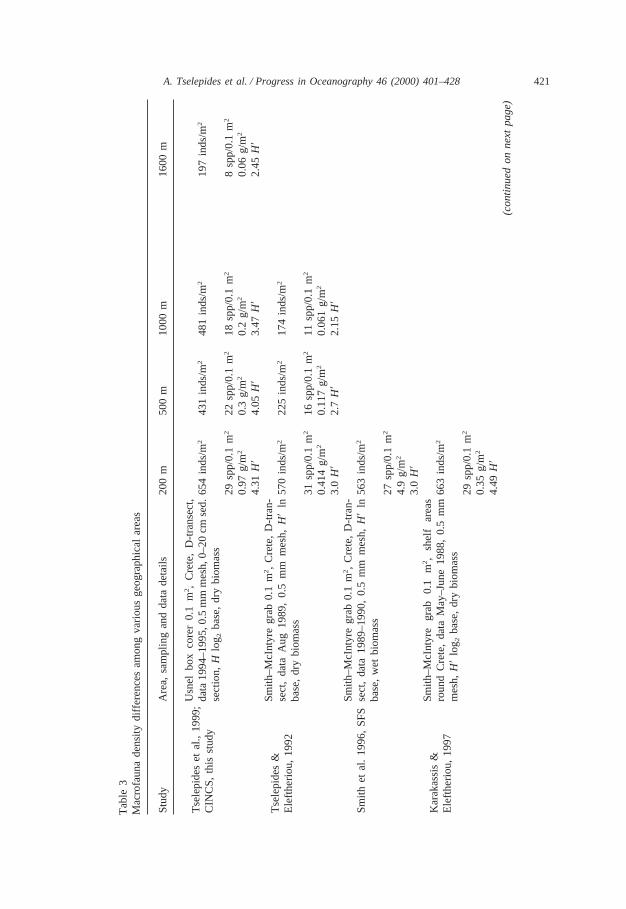
421A. Tselepides et al. / Progress in Oceanography 46 (2000) 401–428
Tab
le3
Mac
rofa
una
dens
itydi
ffere
nces
amon
gva
rious
geog
raph
ical
area
s
Stu
dyA
rea,
sam
plin
gan
dda
tade
tails
200
m50
0m
1000
m16
00m
Usn
elbo
xco
rer
0.1
m2,
Cre
te,
D-t
rans
ect,
Tse
lepi
des
etal
.,19
99; da
ta19
94–1
995,
0.5
mm
mes
h,0–
20cm
sed.
654
inds
/m2
431
inds
/m2
481
inds
/m2
197
inds
/m2
CIN
CS
,th
isst
udy
sect
ion,
Hlo
g 2ba
se,
dry
biom
ass
29sp
p/0.
1m2
22sp
p/0.
1m2
18sp
p/0.
1m2
8sp
p/0.
1m2
0.97
g/m2
0.3
g/m
20.
2g/
m2
0.06
g/m2
4.31
H9
4.05
H9
3.47
H9
2.45
H9
Sm
ith–M
cInt
yre
grab
0.1
m2,
Cre
te,
D-t
ran-
Tse
lepi
des
&se
ct,
data
Aug
1989
,0.
5m
mm
esh,H
9ln
570
inds
/m2
225
inds
/m2
174
inds
/m2
Ele
fther
iou,
1992
base
,dr
ybi
omas
s31
spp/
0.1
m216
spp/
0.1
m211
spp/
0.1
m2
0.41
4g/
m20.
117
g/m2
0.06
1g/
m2
3.0
H9
2.7
H9
2.15
H9
Sm
ith–M
cInt
yre
grab
0.1
m2,
Cre
te,
D-t
ran-
Sm
ithet
al.
1996
,S
FS
sect
,da
ta19
89–1
990,
0.5
mm
mes
h,H
9ln
563
inds
/m2
base
,w
etbi
omas
s27
spp/
0.1
m2
4.9
g/m
2
3.0
H9
Sm
ith–M
cInt
yre
grab
0.1
m2,
shel
far
eas
Kar
akas
sis
&ro
und
Cre
te,
data
May
–Jun
e19
88,
0.5
mm
663
inds
/m2
Ele
fther
iou,
1997
mes
h,H
9lo
g 2ba
se,
dry
biom
ass
29sp
p/0.
1m2
0.35
g/m2
4.49
H9
(co
ntin
ue
do
nn
ext
pa
ge
)
422 A. Tselepides et al. / Progress in Oceanography 46 (2000) 401–428
Tab
le3
(con
tinu
ed)
Stu
dyA
rea,
sam
plin
gan
dda
tade
tails
200
m50
0m
1000
m16
00m
Hes
sler
box
core
r0.
25m2,S
anta
Mar
ia,B
asin
,H
ylan
det
al.,
1991
Cal
iforn
ia,
Pac
ific
Oce
an,
0.5
mm
mes
h,0–
1089
83in
ds/m
228
49in
ds/m
2
cmse
d.se
ctio
n,H9
log 2
base
85sp
p/0.
1m2
26sp
p/0.
1m2
5.2
H9
3.12
H9
US
NE
LB
oxco
rer
0.25
m2,
Vor
ing
Pla
teau
,R
omer
o-W
etze
l&
531±
329
inds
/m2
(for
mac
rofa
una
1200
–150
0m
,N
orw
egia
nse
a,da
ta19
85–
Ger
lach
,19
91,
20m
m)
1986
,0.
5m
mm
esh,
wet
biom
ass
1.28
±0.7
2g/
m2
Box
core
r0.
25m2
,Lo
mon
osov
Rid
ge,
Arc
ticK
ronc
ke,
1994
Oce
an,
data
1991
(sta
s.21
85,
2189
and
2184
),48
8in
ds/m
220
0in
ds/m
2
0.5
mm
mes
h,w
etbi
omas
s9
spp/
0.02
m24
spp/
0.02
m2
2.09
g/m2
0.28
g/m2
Fla
ch&
Hei
p,19
96C
ircul
arbo
xco
rer,
Gob
anS
pur,
NE
8000
inds
/m2
6000
inds
/m2
4000
inds
/m2
3000
inds
/m2
Atla
ntic
,da
taM
ay–J
une
1994
,0–
15cm
sed. 59
0m
gC/m
253
0m
gC/m
288
0m
gC/m
217
5m
gC/m
2
sect
ion,
0.5
mm
mes
hU
SN
EL
box
core
r0.
25m2,
NE
Atla
ntic
off
Eut
roph
ic(1
590–
2040
m):
5403
Cos
son
etal
.,19
97M
aurit
ania
,da
ta19
91,
EU
ME
LIsi
tes,
0–3/
-10
inds
/m2
cmse
d.se
ctio
n,0.
25m
mm
esh
Olig
otro
phic
(458
0–46
47m
):23
2in
ds/m
2eq
ual
to47
and
30%
for
0.50
0m
mm
esh
423A. Tselepides et al. / Progress in Oceanography 46 (2000) 401–428
a combination of factors influencing productivity, such as: a) localised terrestrialrunoff and upwelling, b) bottom topography, c) intrusion of ground waters rich insoil nutrients and d) nutrient rich deep waters which are transported onto the shelfand into the euphotic zone.
Spearman’s rank correlation coefficient values revealed a strong affinity betweenbenthic biomass and environmental variables such as Chl-a, CPE and ATP. Com-munity changes have often been correlated to depth, but in shallow marine environ-ments sedimentary or other physical as well as biological variables which are depth-related are more likely to be the controlling factors than depth itself (Gray, 1981;Tsutsumi, Fukunaga, Fujita & Sumida, 1990). Therefore, despite the fact that depthdisplays a strong correlation to most environmental and biological parameters, it isfood availability that appears to be the limiting factor. Chloroplastic pigments arein general good indicators of the food energy that is readily available to the variousbenthic organisms (Giere, 1993). Organic carbon may serve the same purpose butsince it contains an unknown refractile proportion it does not display as strong acorrelation. Coastal benthic communities are fueled by a heterogeneous pool oforganic detritus, derived from various sources, such as phytoplankton blooms, vascu-lar plant debris, winter blooms of seaweeds and in situ microalgal production. Coastalsediments of the oligotrophic Cretan continental shelf receive limited amounts ofplant derived detritus. Phytoplankton production in such an area does not displaystrong seasonality compared to temperate waters and is dominated by the nano- andpico-size fractions (Fenchel, 1988). It is likely, therefore, that most of this productionwill be recycled in the water column rather than deposited onto the coastal seabed,a fact supported by the low amounts of Chl-a and phaeopigments measured in thesediments during this study (Tselepides et al., 2000). The structure of the macro-benthic community, therefore, reflects the prevailing environmental conditions.Despite the difficulties inherent in the sampling process and the unavoidable patchi-ness it is a more ‘conservative’ manifestation displaying longer term fluctuations inits components. On the other hand, ATP, organic carbon and Chl-a values are sub-jected to more dramatic fluctuations in space and time. As a result, seasonality wasonly evident when either the microbiota or certain environmental parameters weretaken into consideration.
The bathymetric distribution of polychaete feeding types is directly related to theamount of organic matter available in the sediments, with surface deposit feedersstrongly dominating the continental shelf. The most noticeable trends with depthwere: a) the increase in the carnivore component (as a result of the presence ofPholoides dorsipapillatus) down to 940 m depth (which was compensated for by aproportional decrease in the deposit feeding component) and b) the gradual increasein the filter feeding component (as a result of the presence ofFilogranula stellata)from 40 to 1570 m. All feeding types were well represented at the 540 m station,which seems to be a transition area between the coastal and offshore environment.There was little evidence of seasonality in any of the feeding categories. Gaston(1987) also found that surface deposit feeders dominated in most areas on the MiddleAtlantic Bight continental shelf. High numbers of this group of polychaetes wererelated to recently sedimented food in a food-limited area. In the continental margin
424 A. Tselepides et al. / Progress in Oceanography 46 (2000) 401–428
of Crete the presence of this group of polychaetes declines towards deeper stations,but still remains the dominant type down to a depth of 540 m, beyond which carni-vores takeover. Scavengers being surface mobile species were found to increase withdepth. Such a trend is considered advantageous in a nutrient limited environment,since increased mobility is required in deeper waters to locate scarce food resources.
The proportion of sessile organisms on the Cretan shelf increased with depth butthe proportions of motile and discretely motile polychaetes were found to be domi-nant at most depths down to 940 m. The sessile polychaete component included anumber of deposit feeders (such as the terebellids, the ampharetids and themaldanids) and filter feeders (such as the sabellids and and serpulids). Tentaculateforms including both filter feeders and surface deposit feeders decreased down to940 m increasing again at 1570 m depth as sessile tentaculate filter feeders.
Both classification and ordination analysis of the macrobenthic communityrevealed that species, from shallow to deep water, are organised in discrete clusters,with sharp boundaries occurring when environmental factors change dramatically(between 40 and 100 m, and beyond 540 and 1570 m depth). The vertical zonationproposed by Lagarde`re (1977) fits well the observed species composition of thisstudy. It consists of: i) a transitional belt (200–400 m); ii) a first critical depth at400 m corresponding to pronounced renewal in mysids and decapods; and iii) asecond critical depth with larger changes in faunistic composition occurring at about1000 m,.
From the multivariate analyses applied it became evident that seasonality was nota major factor in the macrobenthic community structure. September 1995 seemed tobe the exception due to the observed shift in its species composition and clusters.A plausible explanation to this unique trend is the response of the system to longterm environmental forcing. Indeed, most of the environmental variables displayedelevated values compared to older historical data sets.
Acknowledgements
The authors would like to thank the officers and crew of the R/VAegaeoandPhilia for their assistance during the fieldwork, and Dr C. Dounas for the decapodidentifications. This work was supported by the Commission of the European Com-munities (Directorate-General XII) through the MAST II Mediterranean TargetedProject ‘Pelagic–Benthic Coupling in the Oligotrophic Cretan Sea’ (CINCS, contractMAS2-CT94-0092), as well as the Greek Ministry of Development (General Sec-retariat of Research and Technology).
References
Bacescu, M. (1985). The effects of the geological and physiological factors on the distribution of marineplants and animals in the Mediterranean. In M. Moraitou-Apostolopoulou, & V. Kiortsis,Mediter-ranean marine ecosystems(pp. 195–212). New York: Plenum Press.
425A. Tselepides et al. / Progress in Oceanography 46 (2000) 401–428
Ben-Eliahu, M. N., & Fiege, D. (1996). Serpulid tube worms (Annelida: Polychaeta) of the Central andEastern Mediterranean with particular attention to the Levant Sea, Sencken.Maritime, 28, 1–52.
Bloom, S. A. (1981). Similarity indices in community studies: potential pitfalls.Marine Ecology ProgressSeries, 5, 125–128.
Boetius, A., Scheibe, S., Tselepides, A., & Thiel, H. (1996). Microbial biomass and activities in deep-sea sediments of the Eastern Mediterranean: trenches and benthic hotspots.Deep-Sea Research, 43,1439–1460.
De Bovee, F., Guidi, L. D., & Soyer, J. (1990). Quantitative distribution of deep-sea meiobenthos in thenortwestern Mediterranean (Gulf of Lions).Continental Shelf Research, 10, 1123–1145.
Bray, R. J., & Curtis, J. T. (1957). An ordination of the unplant forest communities of southern Wisconsin.Ecological Monography, 27, 325–349.
Clarke, K. R., & Green, R. H. (1988). Statistical design and analysis for a ‘biological effects’ study.Marine Ecology Progress Series, 46, 213–226.
Clarke, K. R., & Ainsworth, M. (1993). A method of linking multivariate community structure to environ-mental variables.Marine Ecology Progress Series, 92, 205–219.
Clarke, K. R., & Warwick, R. M. (1994).Change in marine communities: an approach to statisticalanalysis and interpretation.Plymouth: Natural Environment Research Council, Plymouth Marine Lab-oratory, 144 pp.
Cosson, N., Sibuet, M., & Galeron, J. (1997). Community structure and spatial heterogeneity of the deepsea macrofauna at three contrasting stations in the tropical northeast Atlantic.Deep-Sea Research, 44,247–269.
Danovaro, R., Tselepides, A., Otegui, A., & Della Croce, N. (2000a). Dynamics of meiofaunal assem-blages on the continental shelf, and deep-sea sediments of the Cretan Sea (NE Mediterranean): relation-ships with seasonal changes in food supply.Progress in Oceanography, 46, 367–400.
Danovaro, R., Dell’Anno, A., Pusceddu, A., Marrale, D., Della Croce, N., Faubiano, M., & Tselepides,A. (2000b). Biogeochemical composition of pico-, nano- and micro-particulate organic matter andbacterioplankton biomass in the oligotrophic Cretan Sea (NE Mediterranean).Progress in Oceanogra-phy, 46, 279–310.
Desbruye`res, D., Guille, A., & Ramos, J. (1972). Bionomie benthique du plateau continental de la coˆteCatalane Espangnole.Vie Milieu, 23, 335–363.
Di Geronimo, I. (1974). Molluschi bentonici in sedimenti recenti batiali e abissali dello Jonio.Conchiglie,10, 133–172.
Dounas, C., & Koukouras, A. (1992). Circalittoral macrobenthic assemblages of Strymonikos Gulf (NAegean Sea).P.S.Z.N.I: Marine Ecology, 13, 85–99.
Eleftheriou, A., Smith, C. J., & Tselepides, A. (1996).Food chains in the Aegean Sea. NATO SFSFISHECO Project, Final Report 134 pp.
Fauchald, K., & Jumars, P. A. (1979). The diet of worms: a study of polychaete feeding guilds.Ocean-ography and Marine Biology Annual Review, 17, 193–284.
Fenchel, T. M. (1988). Marine plankton food chains.Annual Revue Ecology Systems, 19, 19–38.Fiege, D., Ben-Eliahu, M. N., Papadopoulou, K.-N. (1994). Polychaeta of the Central and Eastern Mediter-
ranean deep sea.7th deep sea biology symposium, Hersonissos, Crete, 29 Sept–4 Oct 1994, abstr. p. 9.Field, J. G., Clarke, K. R., & Warwick, R. M. (1982). A practical strategy for analysing multispecies
distribution patterns.Marine Ecology Progress Series, 68, 37–52.Flach, E., & Heip, C. (1996). Vertical distribution of macrozoobenthos within the sediment on the conti-
nental slope of the Goban Spur area (NE Atlantic).Marine Ecology Progress Series, 141, 55–66.Forbes, E. (1844). Report on the Mollusca and Radiata of the Aegean Sea, and on their distribution,
considered as bearing on geology.Report of the 13th British Association for the Advancement ofScience, London, 13, 130–193.
Fredj, G., & Laubier, L. (1985). The deep Mediterranean benthos. In M. Moraitou-Apostolopoulou, &V. Kiortsis, Mediterranean marine ecosystems(pp. 109–145). New York: Plenum Press.
Gaston, R. G. (1987). Benthic Polycheata of the Middle Atlantic Bight: feeding and distribution.MarineEcology Progress Series, 36, 251–262.
George, R. Y., & Menzies, R. J. (1968). Further evidence for seasonal breeding cycles in the deep-sea.Nature, London, 220, 80–81.
426 A. Tselepides et al. / Progress in Oceanography 46 (2000) 401–428
Giere, O. (1993).Meiobenthology: the microscopic fauna in aquatic sediments.Berlin: Springer-Verlag,328 pp.
Graf, G. (1989). Benthic–pelagic coupling in a deep-sea benthic community.Nature, London, 341,437–439.
Graf, G., Bengstsson, W., Diesner, U., Schulz, R., & Theede, H. (1982). Benthic response to sedimentationof a spring phytoplankton bloom: process and budget.Marine Biology, 67, 201–208.
Gray, J. S. (1981). The ecology of marine sediments. An introduction to the structure and function ofbenthic communities. In Cambridge Studies in Modern Biology: 1.Cambridge University Press,185 pp.
Guille, A. (1970). Bionomie benthique du plateau continental de la coˆte catalane fransaise. II.Les commu-nautes de la macrofaune. Vie Milieu, 21, 149–280.
Hurlbert, S. H. (1971). The non-concept of species diversity: a critique and alternative parameters.Ecol-ogy, 52, 577–586.
Hyland, J., Baptiste, E., Campbell, J., Kennedy, J., Kropp, R., & Williams, S. (1991). Macroinfaunalcommunities of the Santa Maria Basin on the California outer continental shelf and slope.MarineEcology Progress Series, 78, 147–161.
Janssen, R. (1989). Benthic molluscs from the deepwater of the Eastern Mediterranaean Sea, collectedduring ‘Meteor’ cruise 5 (1987).Senckenbergiana maritima, 20, 265–276.
Jeffreys, J. G. (1881). On the mollusca procured during the ‘Lightning’ and ‘Porcupine’ expeditions,1868-70.Part III. Proceedings Zoological Society of London, 25, 693–724.
Jeffreys, J. G. (1883). Mediterranean Mollusca, No 3, and other Invertebrata.Annales Magazine NaturalHistory, 5, 393–401.
Karakassis, J. (1991).Contribution to the study of the benthic ecosystem of the continental shelf of Crete.Ph.D. thesis, University of Crete, 195 pp. (in Greek).
Karakassis, J. (1995). S: a new method for calculating macrobenthic species richness.Marine EcologyProgress Series, 120, 299–303.
Karakassis, J., & Eleftheriou, A. (1997). The continental shelf of Crete: structure of macrobenthic com-munities.Marine Ecology Progress Series, 160, 185–196.
Kingston, P. F. (1987). Field effects of platform discharges on benthic macrofauna. In: Environmentaleffects of North Sea oil and gas developments, J.P. Hartley and R.B. Clark editors.PhilosophicalTransactions Royal Society London, Series B., 316, 545–565.
Koutsoubas, D., Koukouras, A., Karakassis, I., & Dounas, C. (1992). Contribution to the knowledge ofGastropoda and Bivalvia (Mollusca) of Crete island (S. Aegean Sea).Bolletino Malacologico, 28,69–82.
Koutsoubas, D., Tselepides, A., & Eleftheriou, A. (1999). Deep sea molluscan fauna of the Cretan Sea(Eastern Mediterranean): faunal.Ecological and Zoogeographical Remarks. Senckenbergiana mari-tima, 30, 1–12.
Kroncke, I. (1994). Macrobenthos composition, abundance and biomass in the Arctic Ocean along atransect between Svalbard and the Makarov Basin.Polar Biology, 14, 519–529.
Lagardere, J. P. (1977). Resherches sur la distribution verticale et sur l’alimentation des Crustace´s Deca-podes benthiques de la pente continentale du Golfe de Gascogne. Analyse des groupements carcino-logiques.Bulletin Centre Etude Resherches Scientifique, Biarritz, 11, 367–440.
Lampitt, R. S. (1985). Evidence for the seasonal deposition of detritus to the deep-sea floor and itssubsequent resuspension.Deep-Sea Research, 32, 885–897.
Ledoyer, M. (1969). Aperc¸u sur la faune vagile de quelques biotopes de substrat dur de Me´diterraneeorientale comparaison avec les meˆmes biotopes en Me´diterranee occidentale.Tethys, 1, 281–290.
Margalef, R. (1958). Information theory in ecology.General Systematics, 3, 36–71.Maurer, D., & Leathem, W. (1981). Polychaete feeding guilds from Georges Bank.USA. Marine Biology,
62, 161–171.McIntyre, A. D., & Eleftheriou, A. (1968). The bottom fauna of a flatfish nursery ground.Journal of the
Marine Biological Association of the United Kingdom, 48, 113–142.Menzies, R. J. (1962). On the food and feeding habits of abyssal organisms as exemplified by the Isopoda.
International Revue gesampten Hydrobiology, 47, 339–358.
427A. Tselepides et al. / Progress in Oceanography 46 (2000) 401–428
Menzies, R. J., George, R. Y., & Rowe, G. T. (1973).Abyssal Environment and Ecology of the WorldOceans.New York: Wiley–Interscience, 488 pp.
Neff, J. M., Bothner, M. H., Maciolek, N. J., & Grassle, J. F. (1989). Impacts of exploratory drilling foroil and gas on the benthic environment of George Bank.Marine Environmental Research, 27, 77–114.
Pace, M. L., Glasser, J. E., & Pomeroy, L. R. (1984). A simulation analysis of continental shelf foodwebs.Marine Biology, 82, 47–63.
Peres, J. M. (1982). Zonations: General features of organismic assemblages in pelagial and benthal. InO. Kinne, Marine ecology, vol. 1 (pp. 9–66). Chichester: John Wiley.
Peres, J. M., & Picard, J. (1958). Recherches sur les peuplements benthiques de la Mediterrane´e Nord-Orientale.Annales de l’Institute Oce´anographie Paris, 34, 213–281.
Pielou, E. C. (1977).Mathematical ecology.New York: J. Wiley & Sons, 385 pp.Por, F. D., & Dimentman, C. (1989).The legacy of Tethys. An aguatic biogeography of the Levant.
Netherlands: Kluwer Academic Publishers, 214 pp.Raulin, V. (1870). Description physique de l’ ıˆle de Crete.Actes Societe Linnee Bordeaux, 24, 353–770.Rex, M. A. (1981). Community structure in the deep-sea benthos.Annual Review of Ecology and System-
atics, 12, 331–353.Romero-Wetzel, M., & Gerlach, S. A. (1991). Abundance, size-distribution and bioturbation potential of
deep-sea macrozoobenthos on the Vøring Plateau (1200–1500 m, Norwegian Sea).Meeresforschungen,33, 247–265.
Rowe, G. T. (1971). Benthic biomass and surface productivity. In J. D. Costlow,Fertility in the sea, vol.2 (pp. 441–454). New York: Gordon and Breach Science Publisher.
Rowe, G. T., Sibuet, M., Deming, J., Khripounoff, A., Tietjen, N. J., Macko, S., & Thetoux, R. (1991).Total sediment biomass and preliminary estimates of organic carbon residence time in deep-sea ben-thos.Marine Ecology Progress Series, 114, 79–99.
Sanders, H. L. (1968). Marine benthic diversity: a comparative study.American Naturalist, 102, 243–282.Sara, M. (1985). Ecological factors and their biogeographic consequences in the Mediterranean ecosys-
tems. In M. Moraitou-Apostolopoulou, & V. Kiortsis,Mediterranean marine ecosystems, NATO con-ference series, vol. 8 (pp. 1–17). New York: Plenum Press.
Shannon, C. E., & Weaver, N. (1963).The mathematical theory of communication.Urbana, Universityof Illinois Press, 117 pp.
Smith, K. L., Laver, M. B., & Brown, N. O. (1983). Sediment community oxygen consumption andnutrient exchange in the central and eastern North Pacific.Limnology and Oceanography, 28, 882–898.
Soyer, M. (1985). Mediterranean Sea Meiobenthos. In M. Moraitou-Apostolopoulou, & V. Kiortsis,Medit-erranean marine ecosystems, NATO conference series, vol. 8 (pp. 85–108). New York: Plenum Press.
Sturany, R. (1896). Zoologische Ergebnisse. VII. Mollusken I (Prosobranchier und Opisthobranchier,Scaphopoden. Lamellibranchier) gesammelt von S.M. Schiff ‘Pola’ 1890-1894.Denkschre K.K. Akade-mie Wiss Mathematich Naturw Wien, 63, 1–36.
Tchukhtchin, V. D. (1964). Quantitative data on benthos of the Tyrrhenean Sea.Trudy Sevastopol Biologi-cal Station, 17, 48–50.
Thiel, H. (1983). Meiobenthos and Nanobenthos of the deep sea. In G. Rowe,Deep-sea biology(pp.167–230). New York: Wiley Interscience.
Tselepides, A. (1992).Ecological study of the bathyal ecosystem of the Aegean Sea. Ph.D. thesis, Univer-sity of Crete, 266 pp. (in Greek).
Tselepides, A., & Eleftheriou, A. (1992). South Aegean (Eastern Mediterranean) continental slope benthos:macroinfaunal - environmental relationships. In G. T. Rowe, & V. Pariente,Deep-sea food chainsand the global carbon cycle(pp. 139–156). Dordecht: Kluwer Academic Publications.
Tselepides, A., Papadopoulou, K. N., & Polychronaki, T. (Eds). (1996). CINCS: pelagic–benthic couplingin the oligotrophic Cretan Sea.Final report, DG XII, MAST II, Mediterranean targeted project, MAS-2-CT94-0092, 227 pp.
Tselepides, A., Danovaro, R., Polychronaki, T., Akoumianaki, I., Dell’Anno, A., & Marrale, D. (2000).Organic matter composition of the continental shelf and bathyal sediments of the Cretan Sea (NEMediterranean).Progress in Oceanography, 46, 311–344.
Tselepides, A. (1994). Macrobenthic communities of the coninental slope of the Aegean Sea.7th deepsea biology symposium, Hersonissos, Crete, 29 Sept–4 Oct 1994, abstract, p. 30.
428 A. Tselepides et al. / Progress in Oceanography 46 (2000) 401–428
Tsutsumi, H., Fukunaga, S., Fujita, N., & Sumida, M. (1990). Relationship between growth of Capitellasp. and organic enrichment of the sediment.Marine Ecology Progress Series, 63, 157–162.
Vamvakas, C. (1970). Peuplements benthiques des substrats meubles du sud de la Mer Ege´e. Tethys, 2,89–129.
Vamvakas, C. (1973). Aperc¸u critique de la biocenose de vase profonde. Rapport et Proce`s-Verbaux deReunions Commission Internationale pour l’exploration scientifique de la mer Me´diteranee, 22, 119.
Wassman, P. (1984). Sedimentation and benthic mineralisation of organic detritus in a Norwegian fjord.Marine Biology, 83, 83–94.