machine learning for data-driven smart grid...
TRANSCRIPT
Machine Learning for Data-Driven Smart Grid Applications
Patrick Glauner, Jorge Augusto Meira and Radu State Interdisciplinary Centre for Security, Reliability and Trust,
University of Luxembourg
1
May 22, 2018
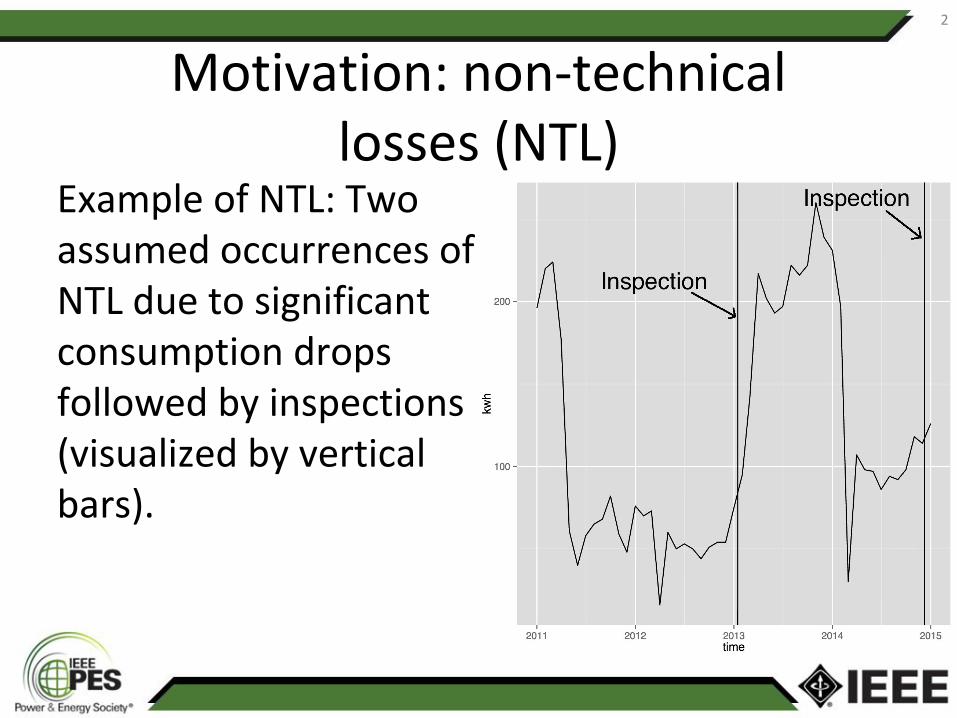
Motivation: non-technicallosses (NTL)
2
Example of NTL: Two assumed occurrences of NTL due to significant consumption drops followed by inspections (visualized by vertical bars).
About us
• We work on real-world machine learning problems together with industry partners
• Recent research includes detection of electricity theft/non-technical losses, correction of biases in data and augmented reality
3
Goals of this tutorial
• Providing an introduction to machine learning
• Understanding the three pillars of machine learning
• Knowing when to use which model
4
Contents
• Introduction• Supervised learning• Unsupervised learning• Reinforcement learning• Deep Learning
• Conclusions
5
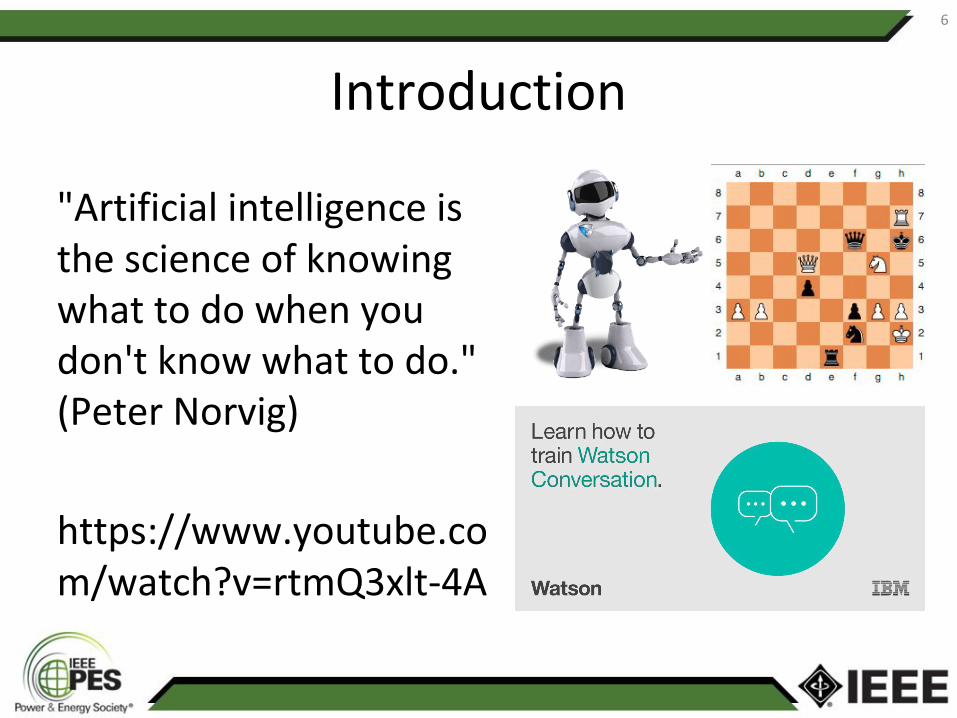
Introduction
6
"Artificial intelligence is the science of knowing what to do when you don't know what to do." (Peter Norvig)
https://www.youtube.com/watch?v=rtmQ3xlt-4A
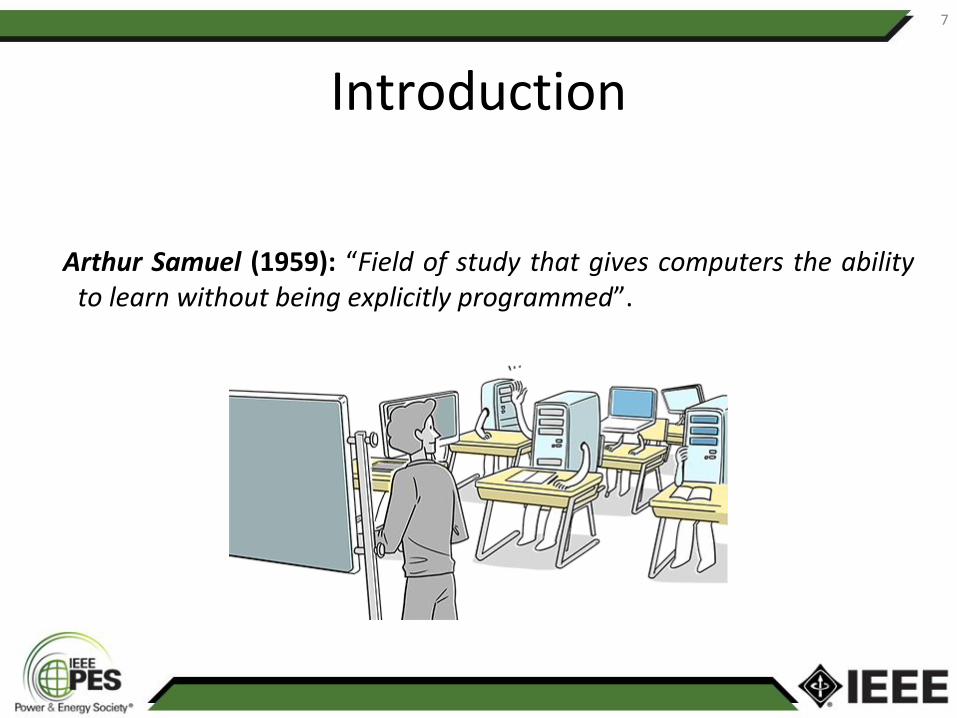
Introduction
7
Arthur Samuel (1959): “Field of study that gives computers the ability to learn without being explicitly programmed”.

Introduction
8
Introduction
9
Introduction
10
Introduction
11
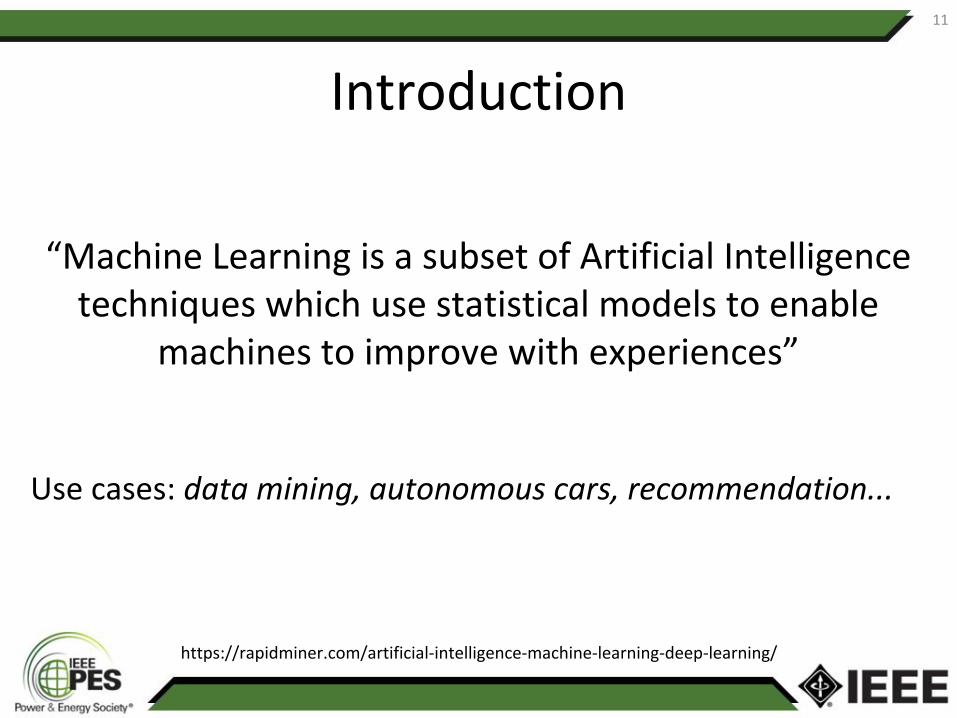
“Machine Learning is a subset of Artificial Intelligence techniques which use statistical models to enable
machines to improve with experiences”
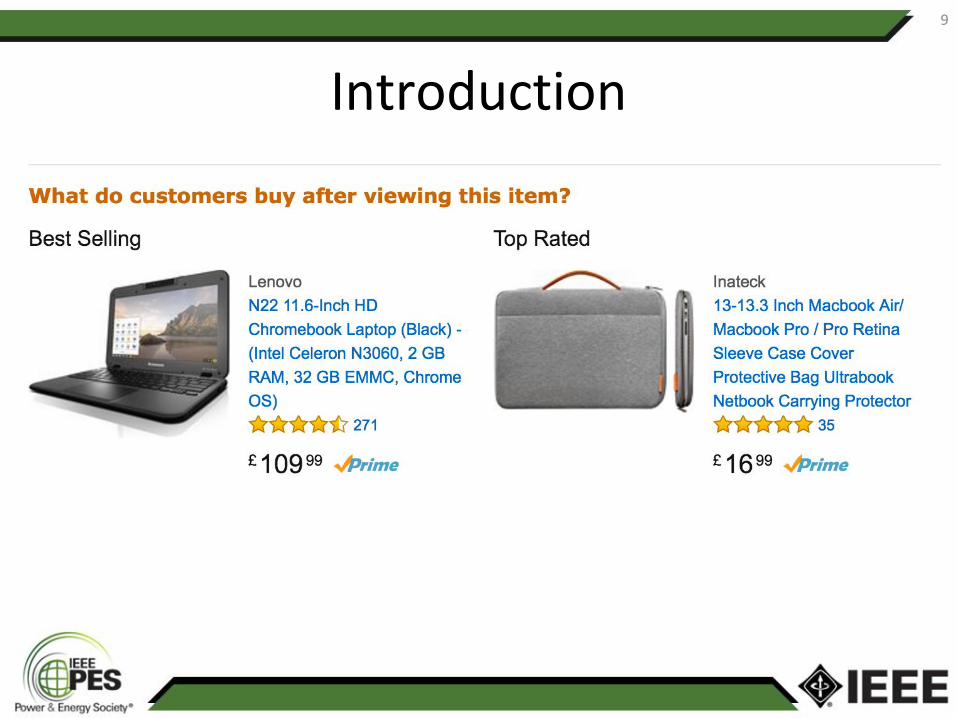
Use cases: data mining, autonomous cars, recommendation...
https://rapidminer.com/artificial-intelligence-machine-learning-deep-learning/
Introduction
12
Tom Mitchell (1998): "A computer program is said to learn from experience E with respect to some class of tasks T and performance measure P if its performance at tasks in T, as measured by P, improves with experience E."
Introduction
13
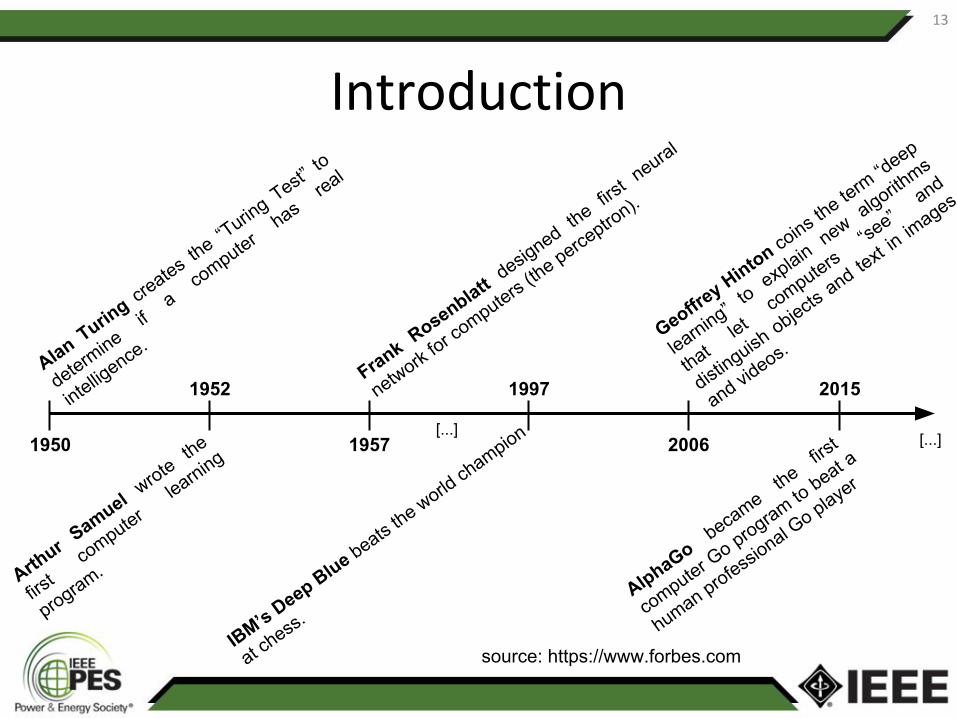
source: https://www.forbes.com
Alan Turing cr
eates the “T
uring Test” to
determine
if a
computer has
real
intelligence.
1950
1952
1957
1997
2006
2015
Arthur Samuel wrote the
first
computer learning
program.
Frank Rosenblatt desig
ned the first neural
network for co
mputers (the perce
ptron).
IBM’s Deep Blue beats the world ch
ampion
at chess.
Geoffrey Hinton co
ins the te
rm “d
eep
learning” to explain new algorithms
that let
computers “se
e” and
distinguish
objects and te
xt in im
ages
and videos.
AlphaGo became the first
computer Go program to
beat a
human professional G
o player
[...][...]
Introduction: three pillars of machine learning
14
● Supervised learning: induce a function that maps from input to output.
● Unsupervised learning: find hidden structure in data.
● Reinforced learning: reward-based learning.
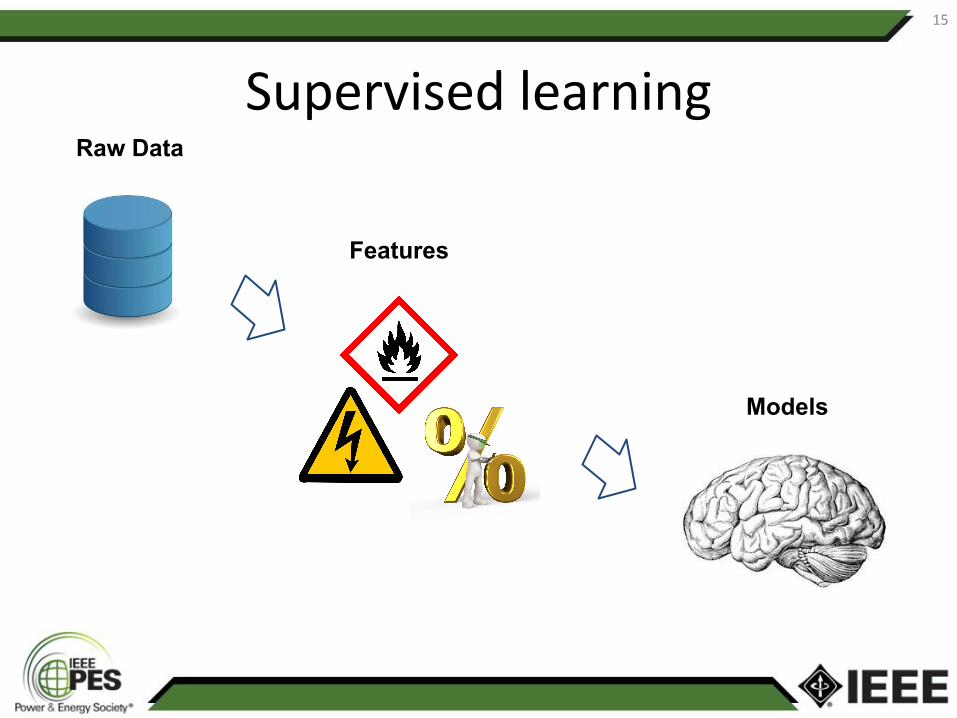
Supervised learning
15
Raw Data
Features
Models
Supervised learning
16
Regression Classification
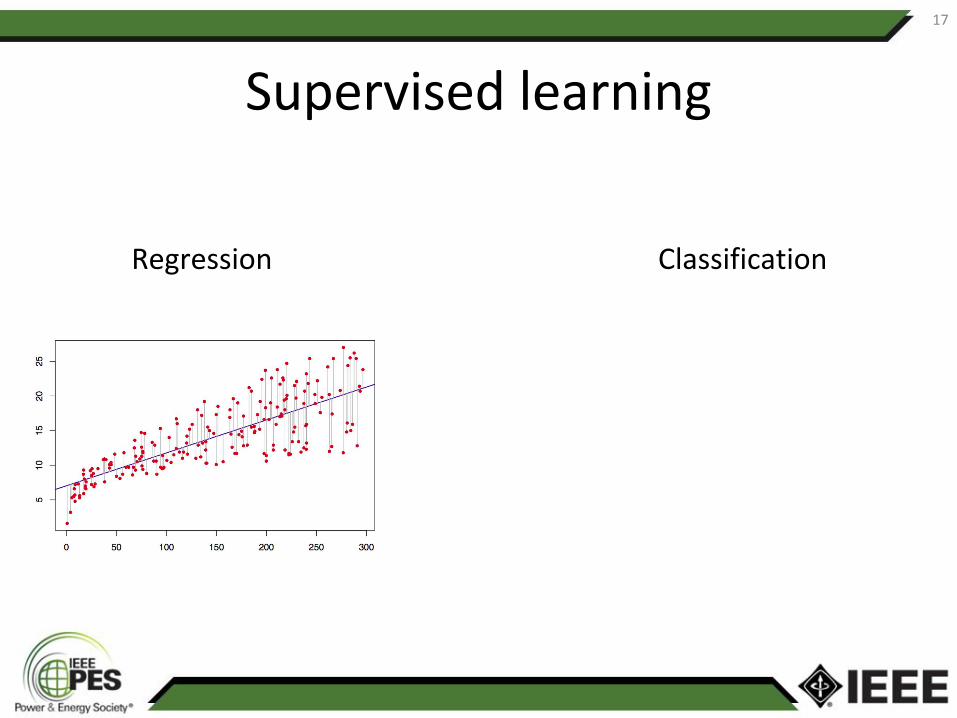
Supervised learning
17
Regression Classification
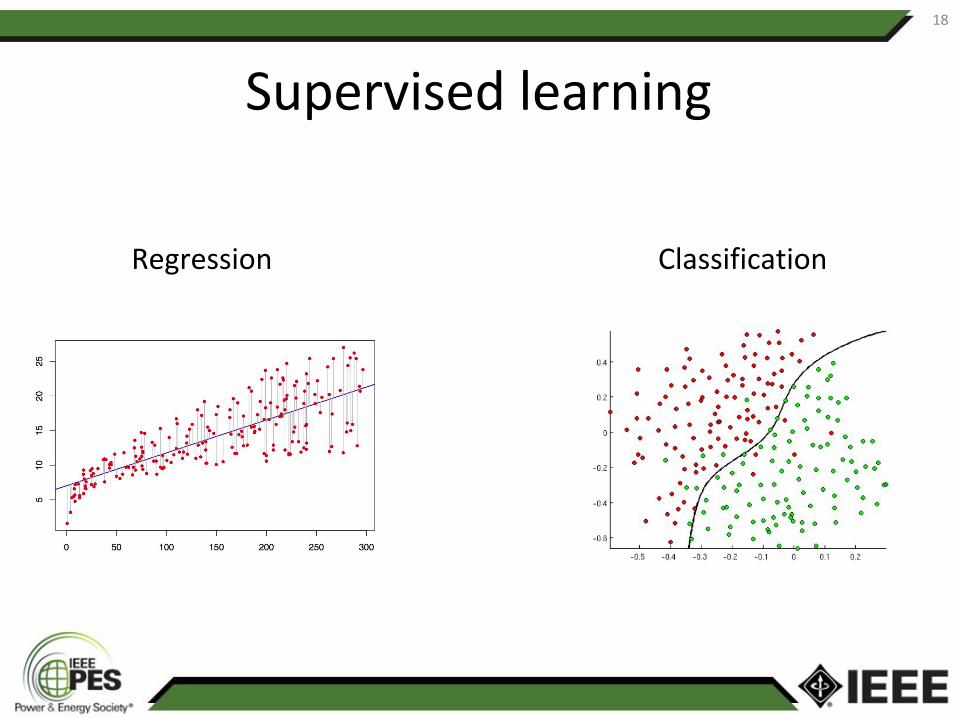
Supervised learning
18
Regression Classification
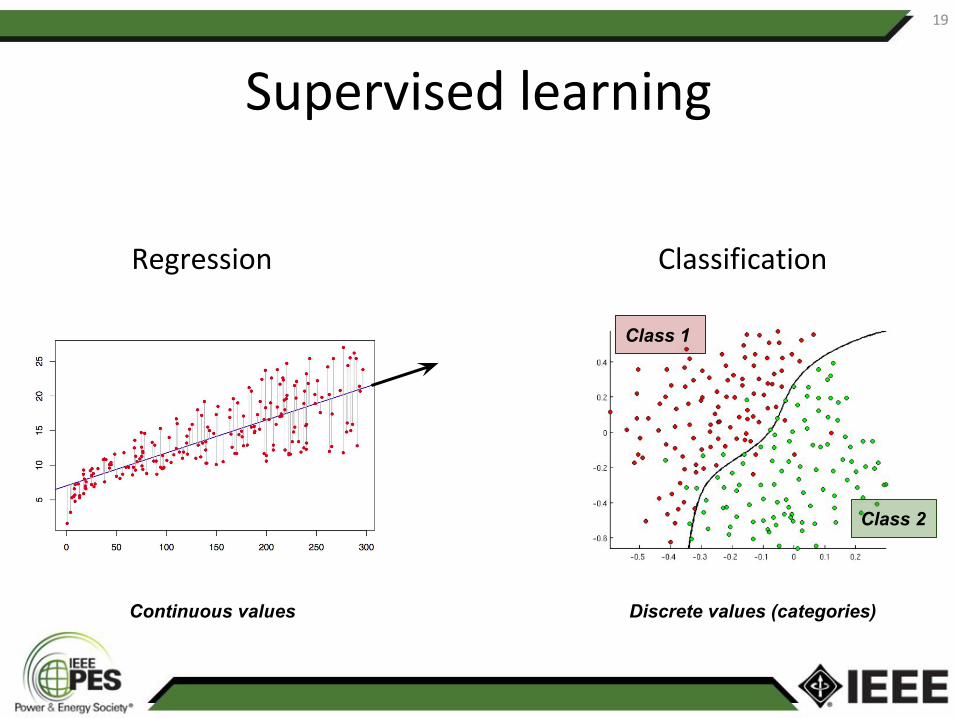
Supervised learning
19
Regression Classification
Continuous values Discrete values (categories)
Class 1
Class 2
Supervised learning: use cases
20
• Detection of anomalies
• Forecasting
• Medical diagnosis
• ...
Supervised learning: models
21
• Linear/logistic regression
• Decision tree, random forest
• Support vector machine
• ...
• Neural networks, Deep Learning
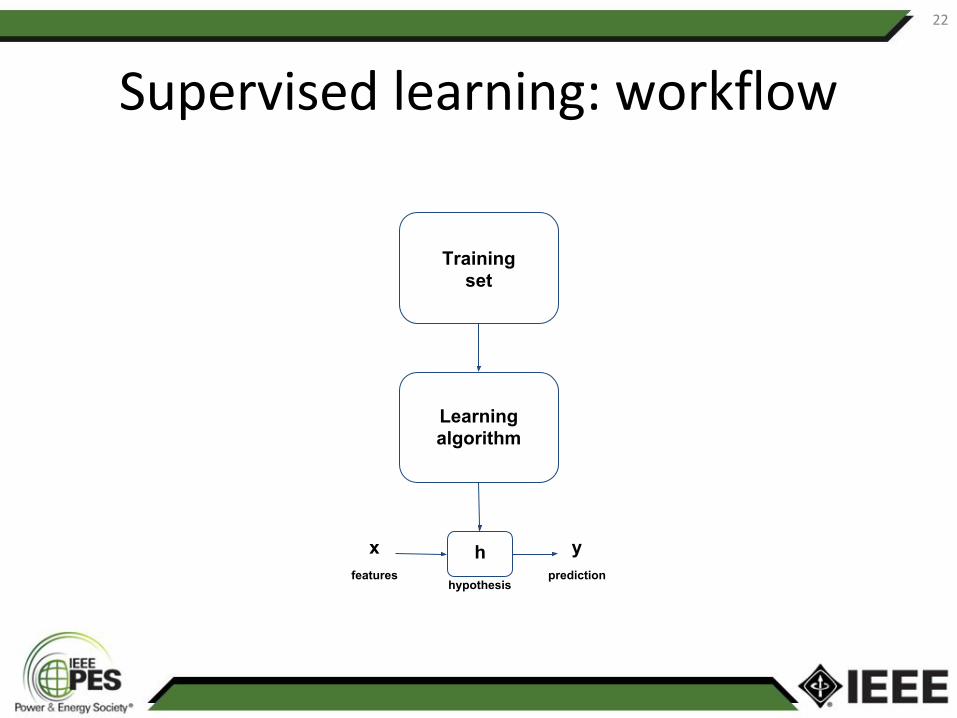
Supervised learning: workflow
22
x y
Training set
Learningalgorithm
features predictionh
hypothesis
23
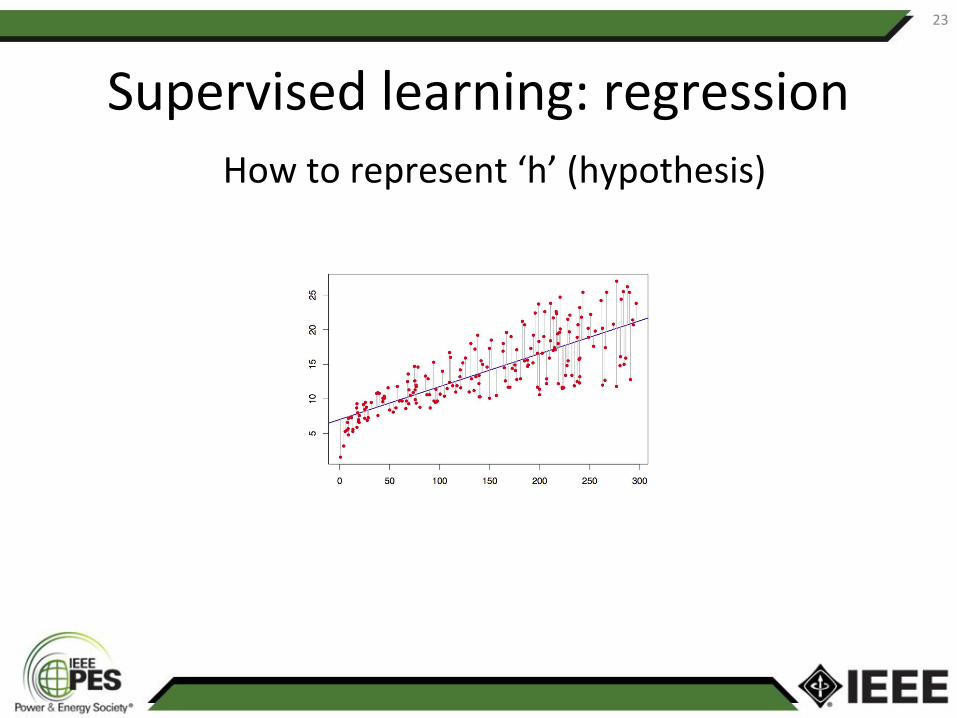
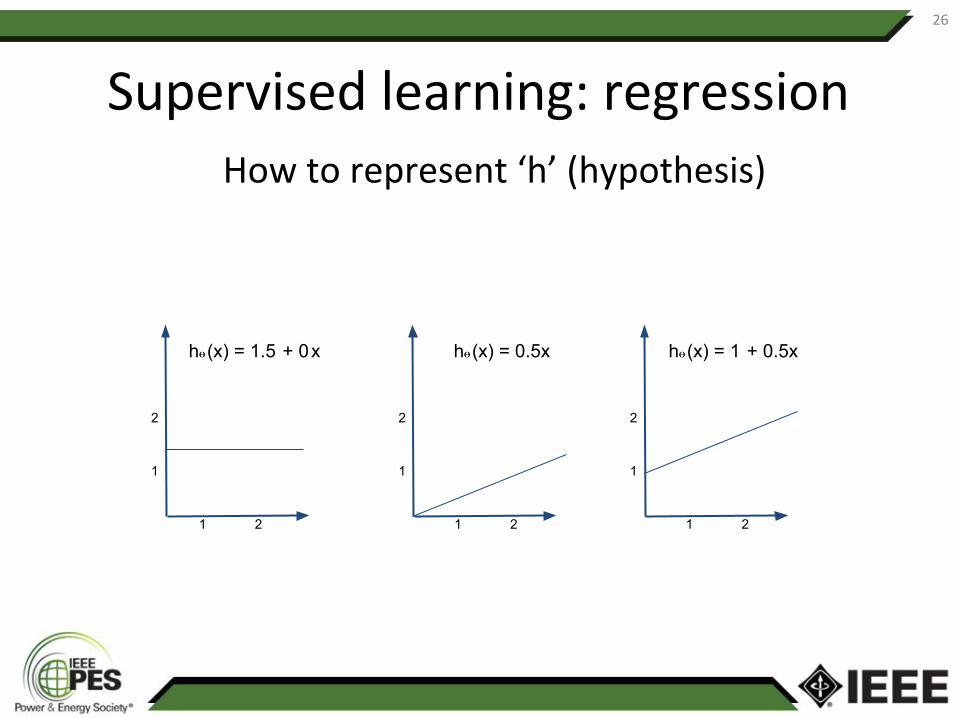
How to represent ‘h’ (hypothesis)
Supervised learning: regression
24
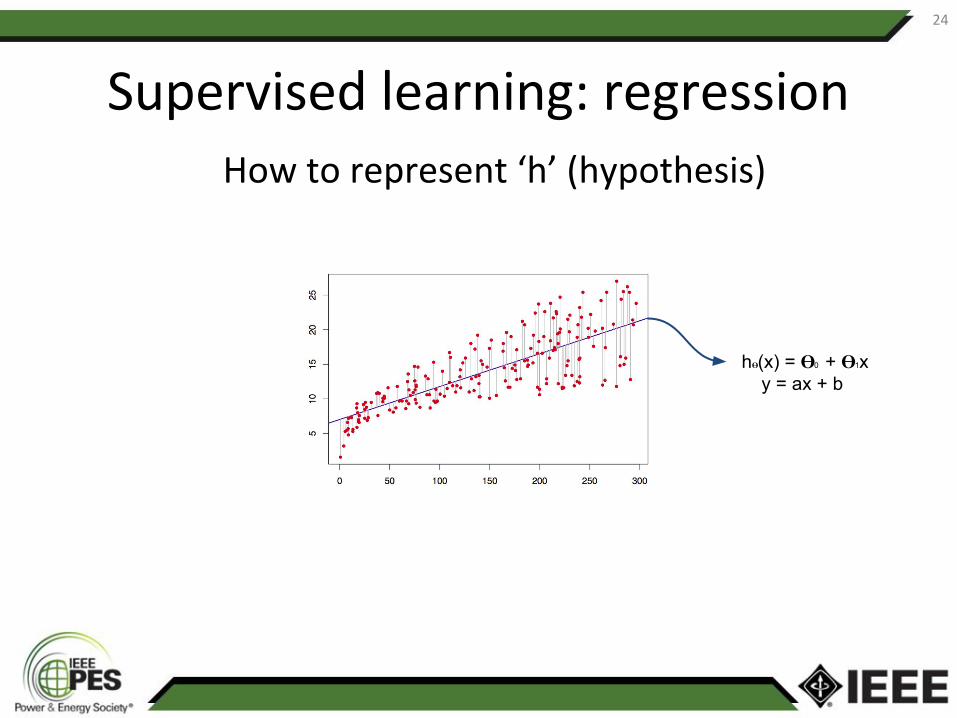
How to represent ‘h’ (hypothesis)
Supervised learning: regression
h (x) = 0 + 1xy = ax + b
25
h (x) = 0 + 1xy = ax + b
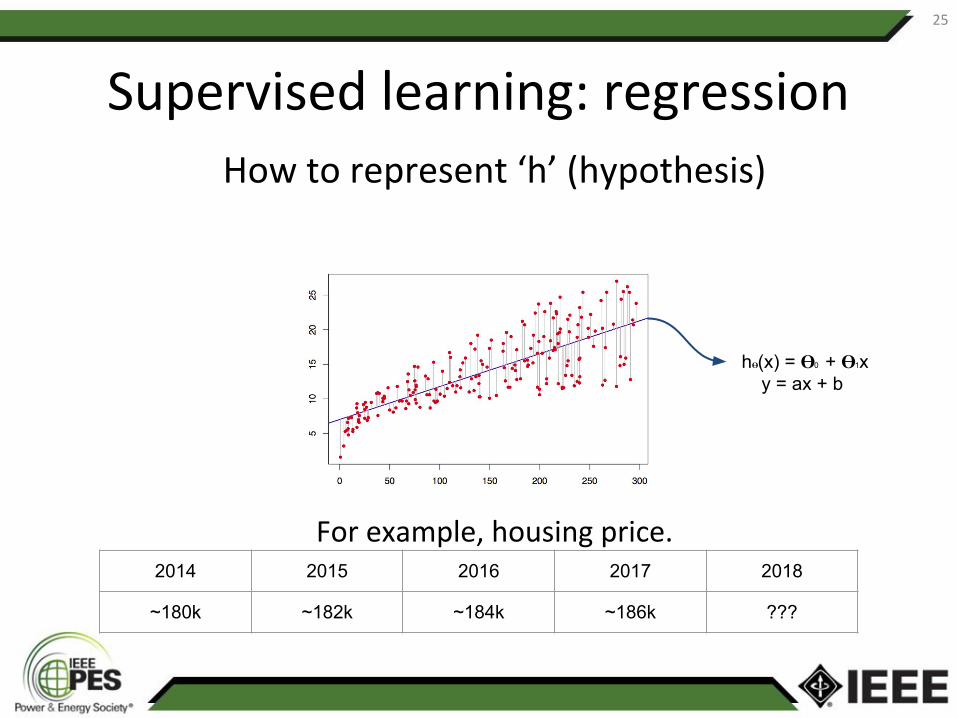
How to represent ‘h’ (hypothesis)
Supervised learning: regression
For example, housing price.2014 2015 2016 2017 2018
~180k ~182k ~184k ~186k ???
26
h (x) = 1.5 + 0 x h (x) = 0.5x h (x) = 1 + 0.5x
1
2
1
2
1
2
1 2 1 21 2
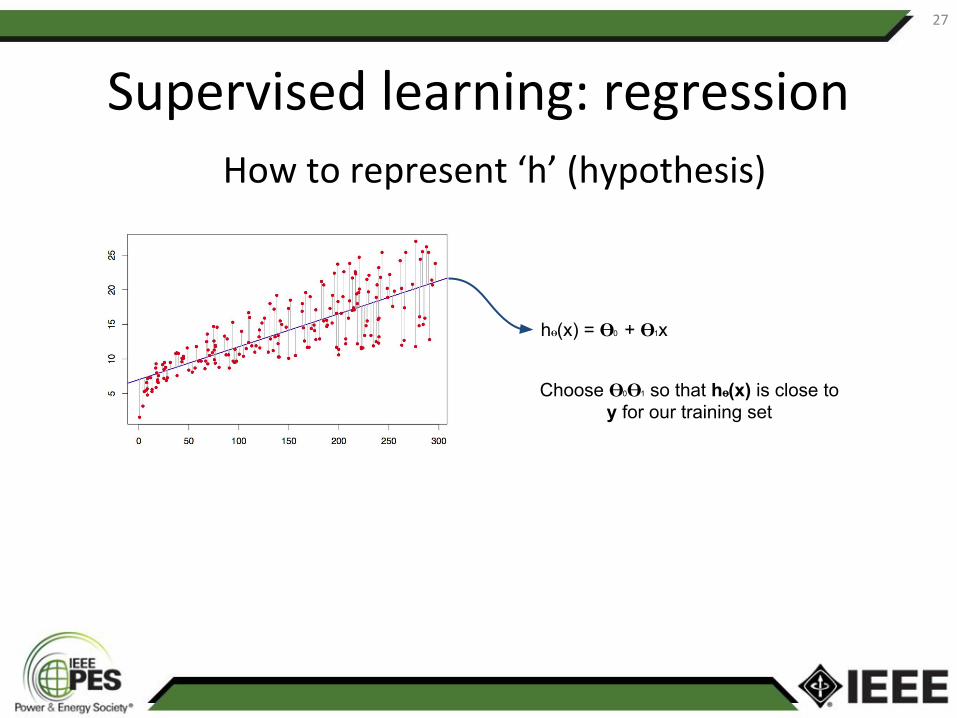
How to represent ‘h’ (hypothesis)
Supervised learning: regression
27
Choose 0 1 so that h (x) is close to y for our training set
h (x) = 0 + 1x
How to represent ‘h’ (hypothesis)
Supervised learning: regression
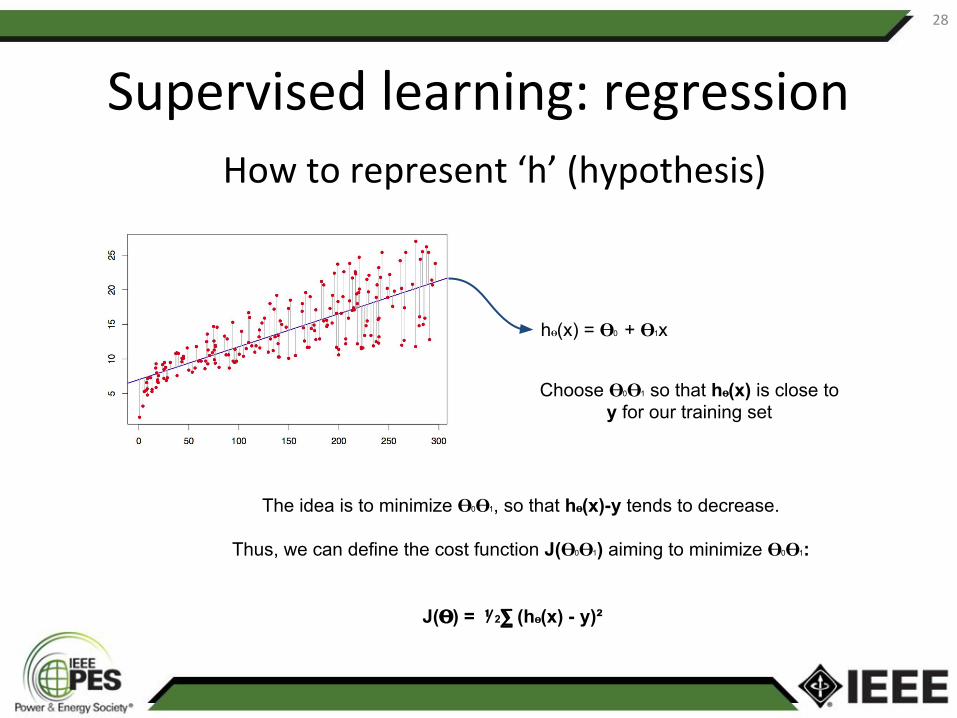
28
The idea is to minimize 0 1, so that h (x)-y tends to decrease.
Thus, we can define the cost function J( 0 1) aiming to minimize 0 1:
J( ) = ⅟2⅀ (h (x) - y)²
Choose 0 1 so that h (x) is close to y for our training set
h (x) = 0 + 1x
How to represent ‘h’ (hypothesis)
Supervised learning: regression
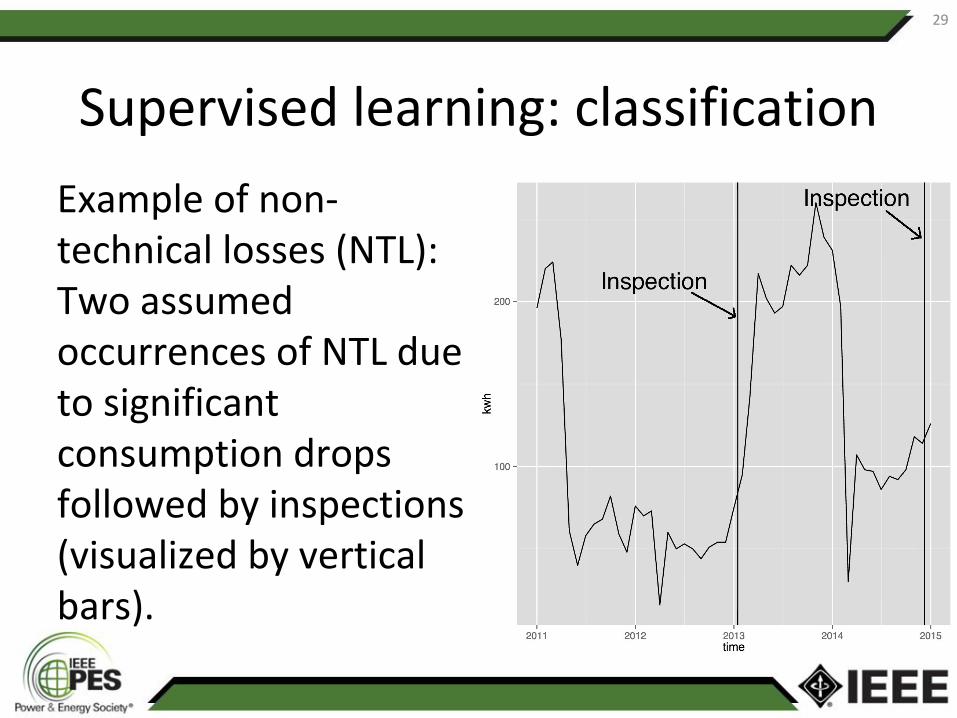
Supervised learning: classification
29
Example of non- technical losses (NTL): Two assumed occurrences of NTL due to significant consumption drops followed by inspections (visualized by vertical bars).
30
Weather
Supervised learning: decision tree
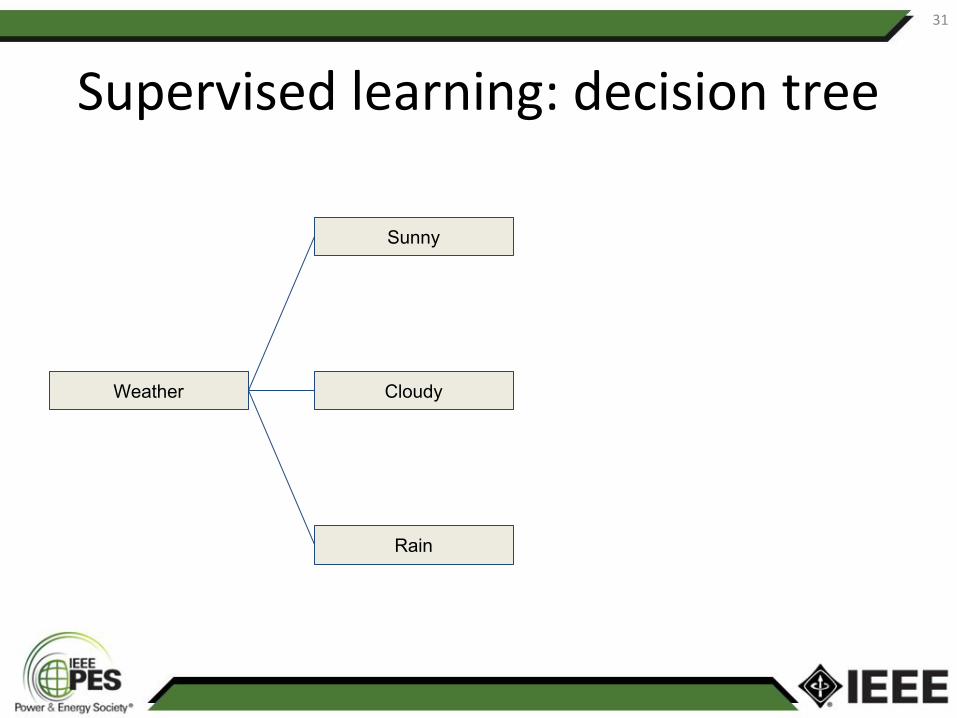
31
Weather
Sunny
Rain
Cloudy
Supervised learning: decision tree
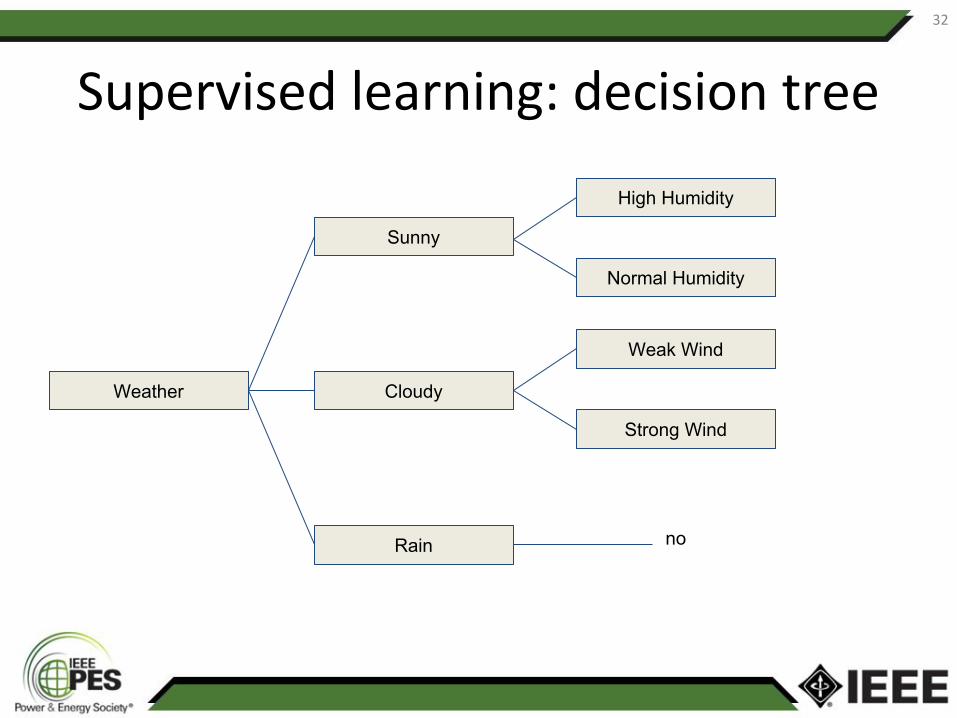
32
Weather
Sunny
Rain
Cloudy
no
Strong Wind
Weak Wind
Normal Humidity
High Humidity
Supervised learning: decision tree
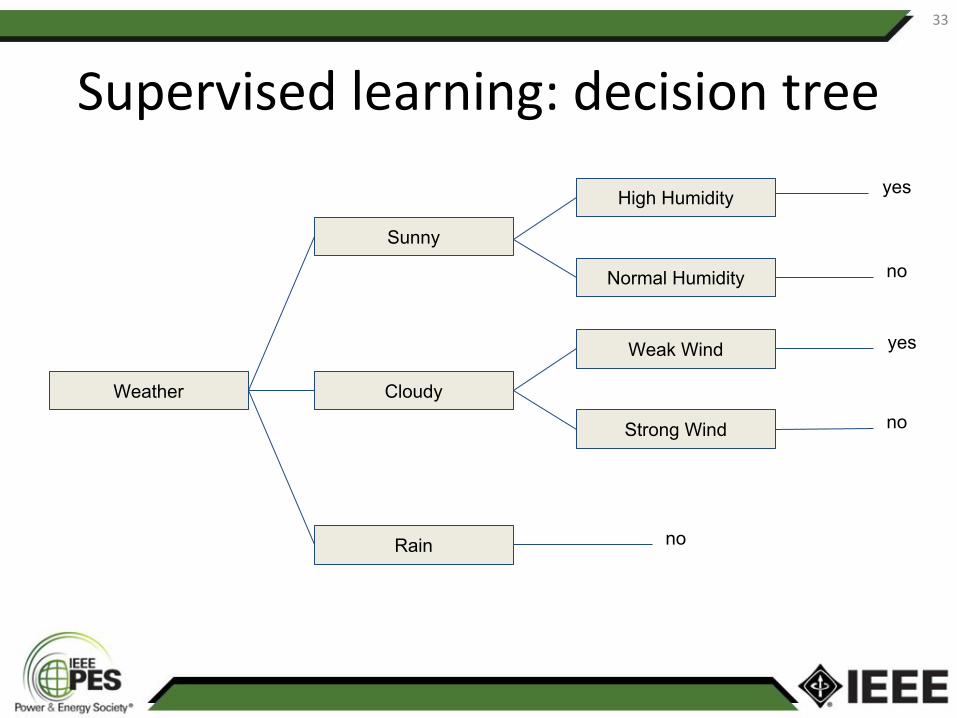
33
Weather
Sunny
Rain
Cloudy
no
Strong Wind
Weak Wind
Normal Humidity
High Humidity
no
yes
no
yes
Supervised learning: decision tree
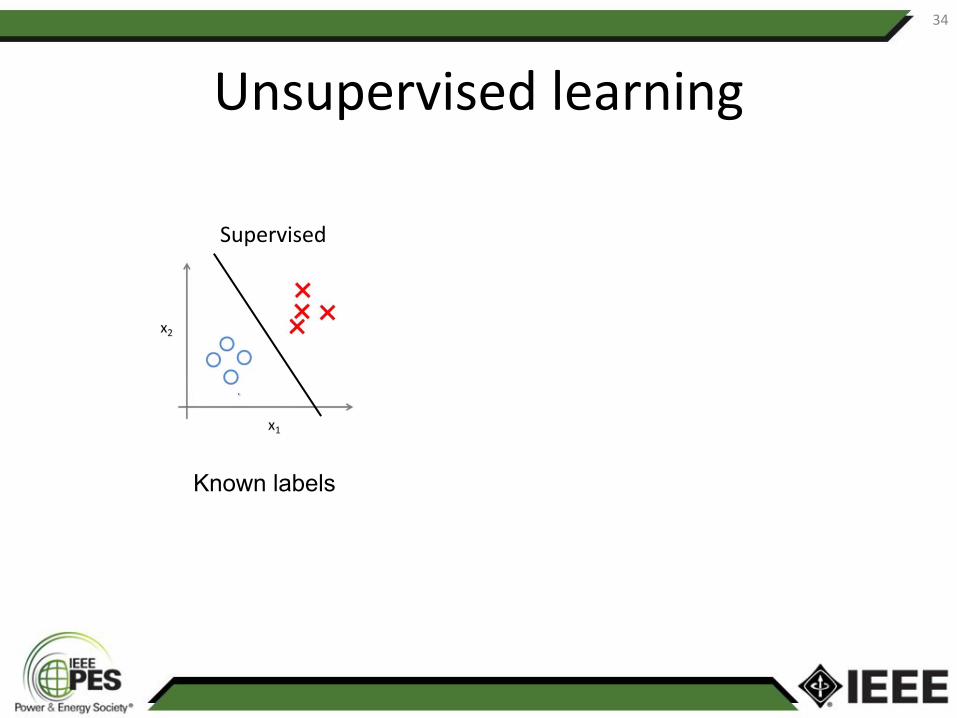
Unsupervised learning
34
Supervised
Known labels
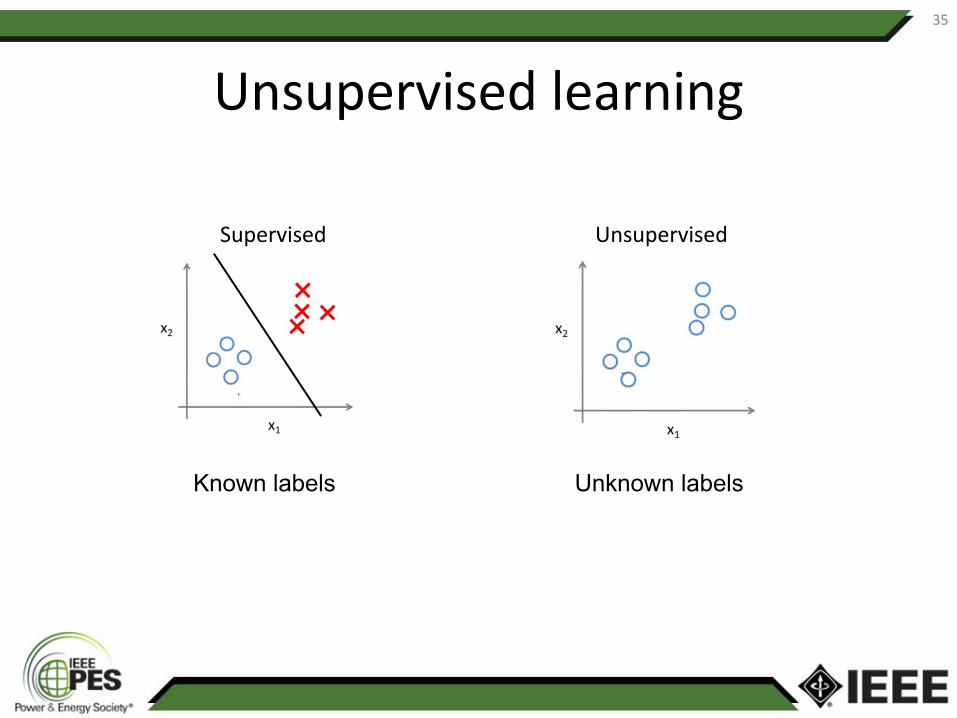
Unsupervised learning
35
Unknown labels
Supervised Unsupervised
Known labels
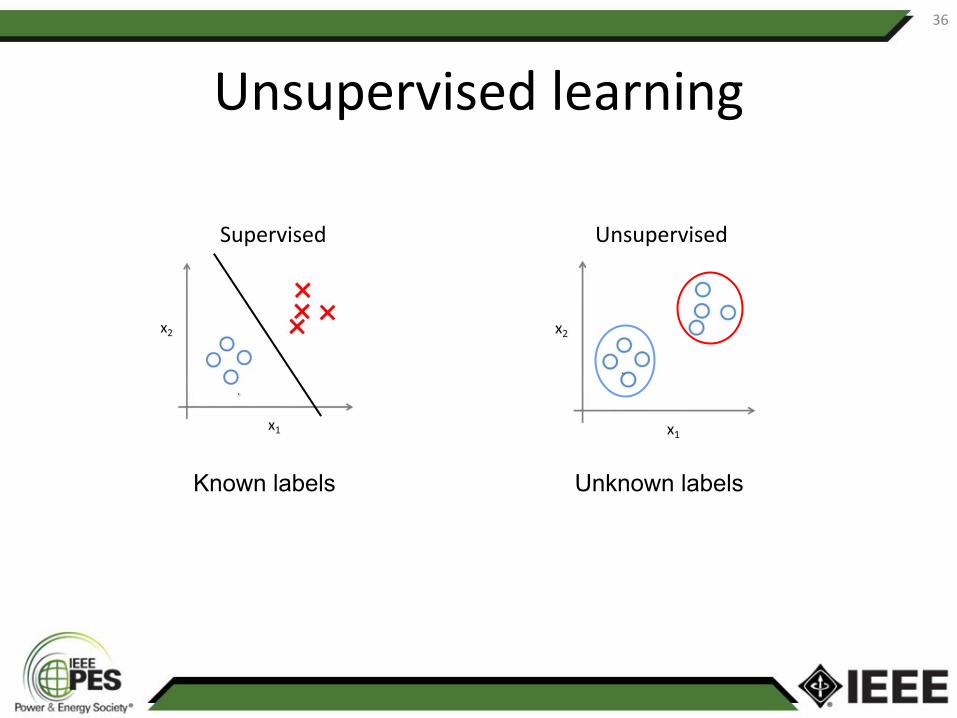
Unsupervised learning
36
Supervised Unsupervised
Unknown labelsKnown labels
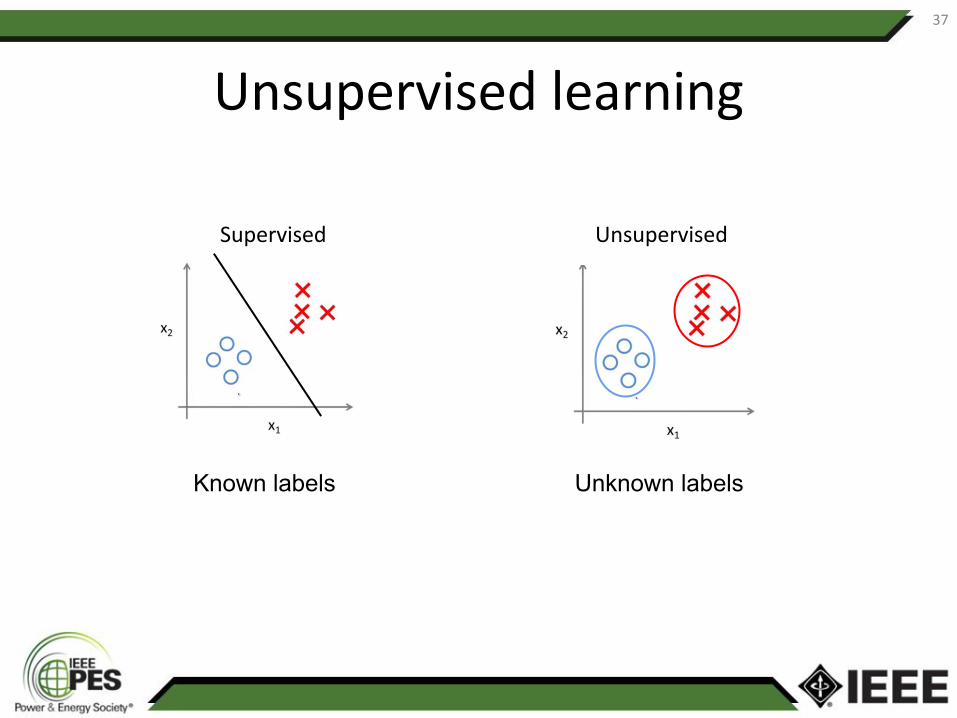
Unsupervised learning
37
Supervised Unsupervised
Unknown labelsKnown labels
Unsupervised learning: clustering
38
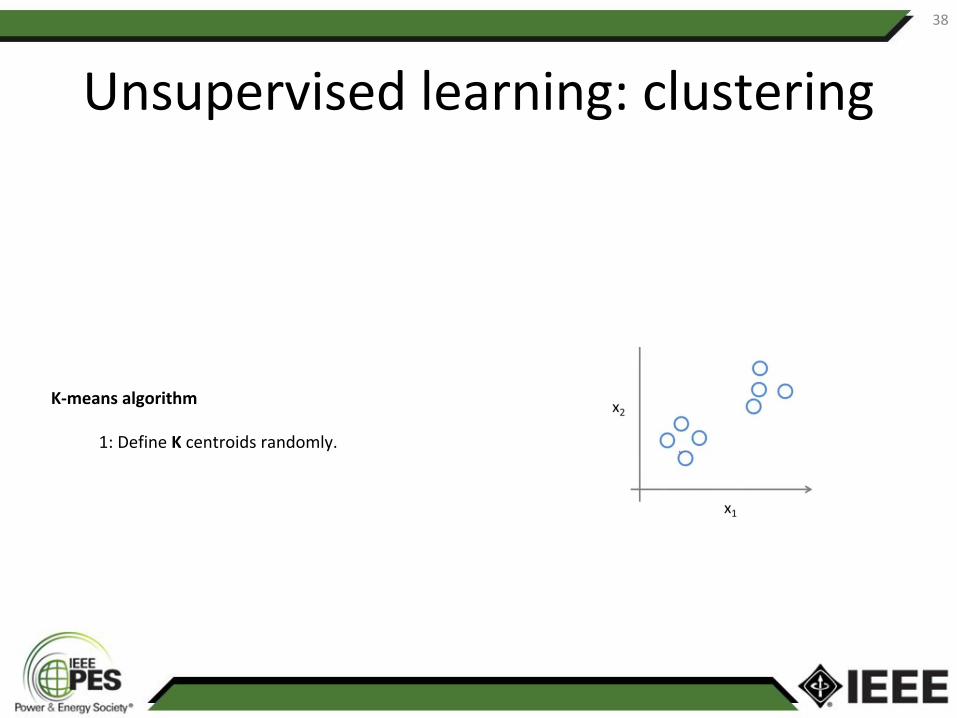
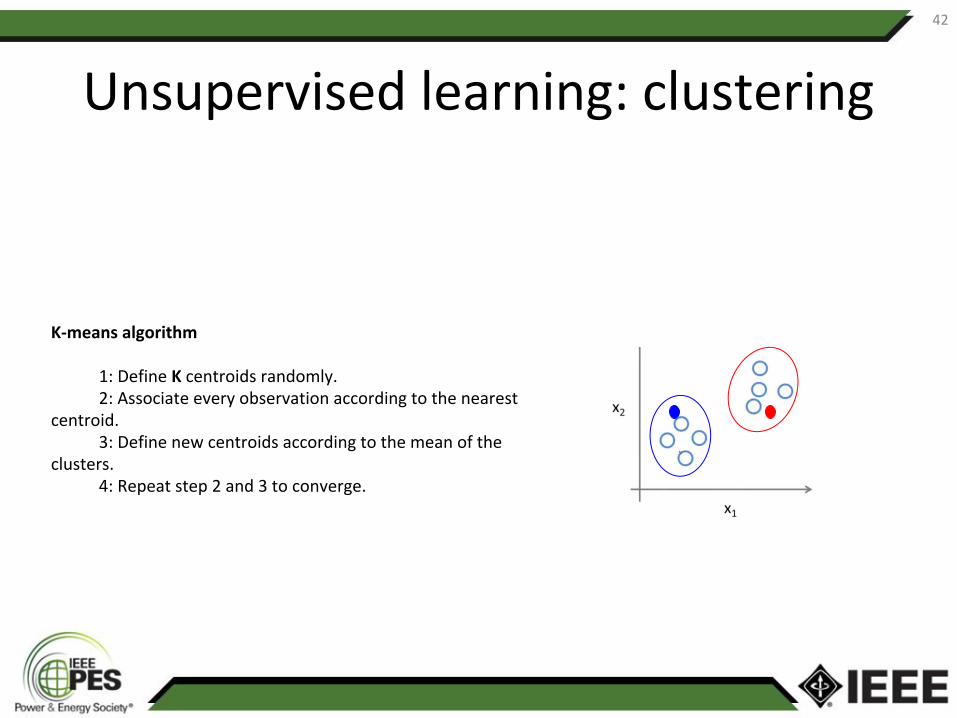
K-means algorithm
1: Define K centroids randomly.
Unsupervised learning: clustering
39
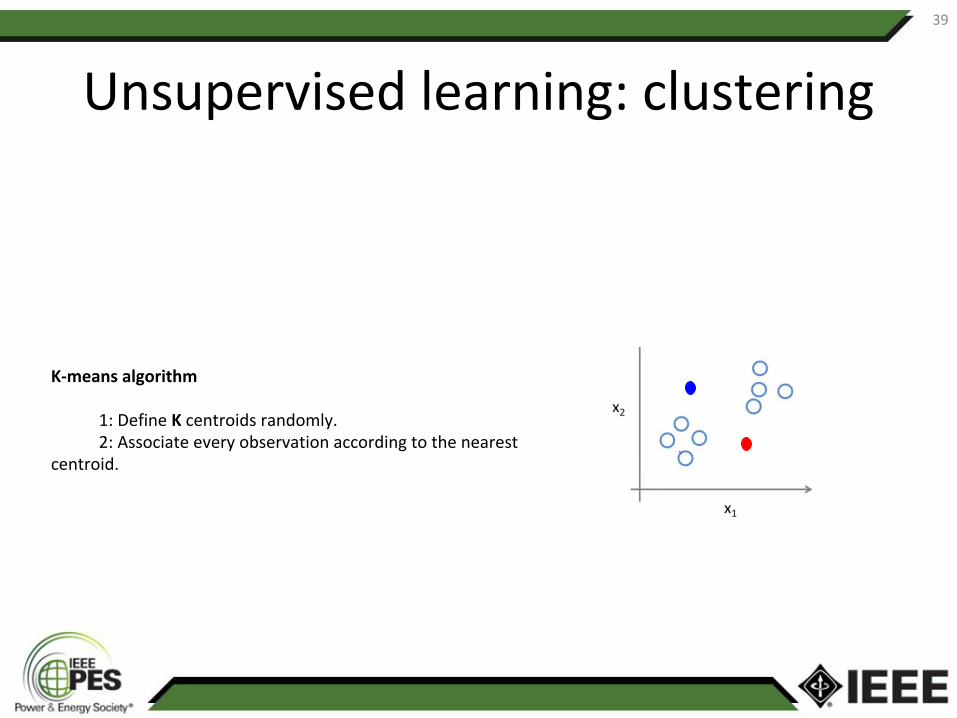
K-means algorithm
1: Define K centroids randomly.2: Associate every observation according to the nearest
centroid.
40
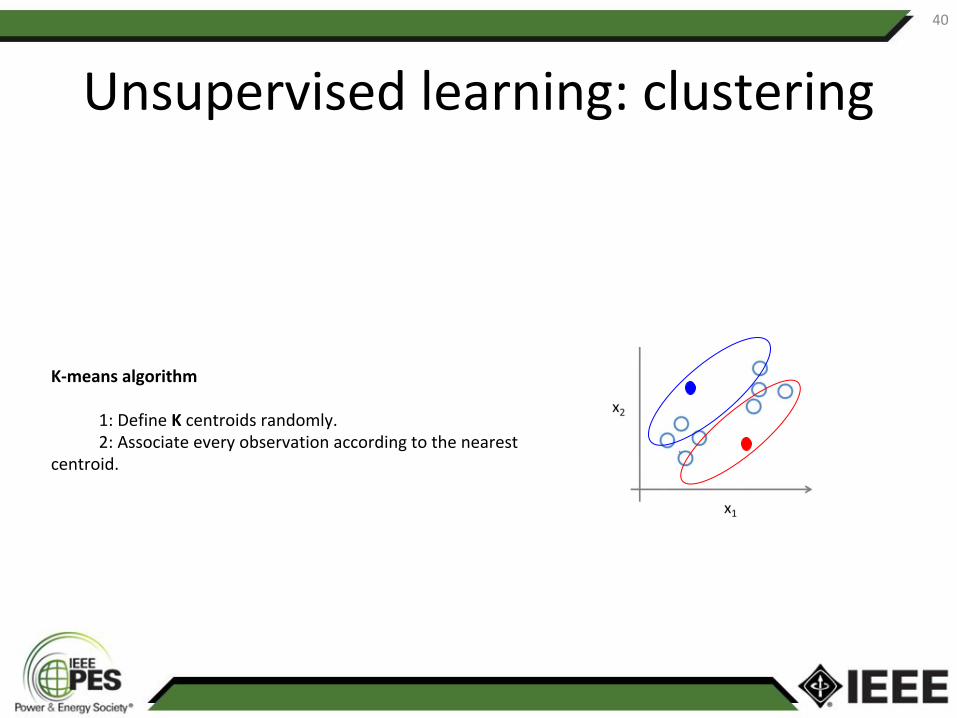
K-means algorithm
1: Define K centroids randomly.2: Associate every observation according to the nearest
centroid.
Unsupervised learning: clustering
41
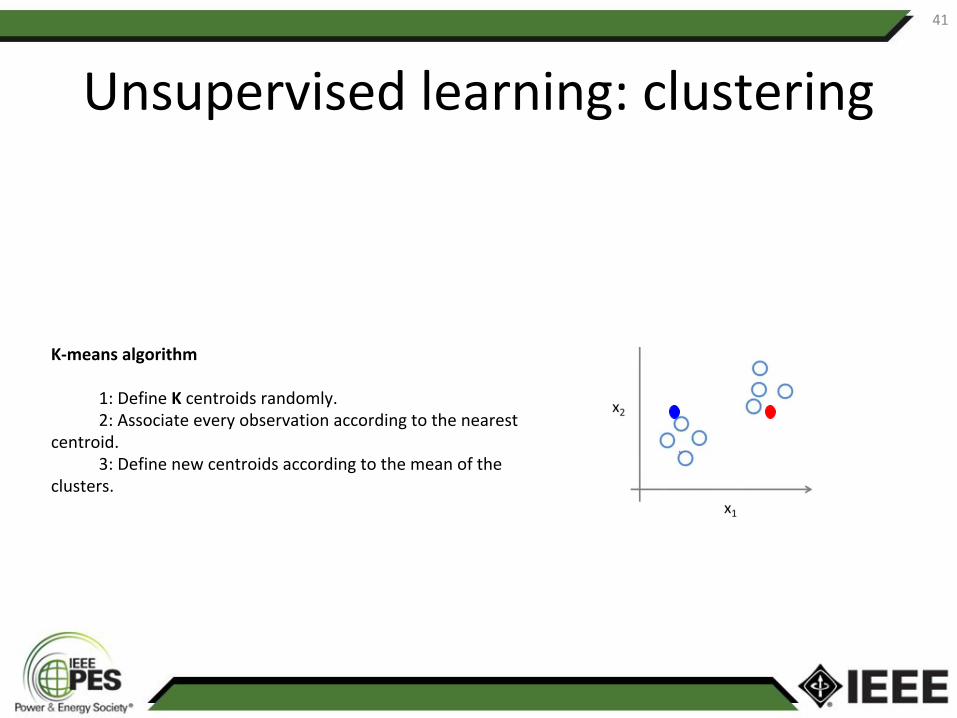
K-means algorithm
1: Define K centroids randomly.2: Associate every observation according to the nearest
centroid.3: Define new centroids according to the mean of the
clusters.
Unsupervised learning: clustering
42
K-means algorithm
1: Define K centroids randomly.2: Associate every observation according to the nearest
centroid.3: Define new centroids according to the mean of the
clusters.4: Repeat step 2 and 3 to converge.
Unsupervised learning: clustering
Unsupervised learning: use cases
43
• Market segmentation
• Clustering of customers, news, etc.
• Dimensionality reduction of data
Unsupervised learning: models
44
• k-means clustering
• Expectation-maximization clustering
• Principal component analysis
• ...
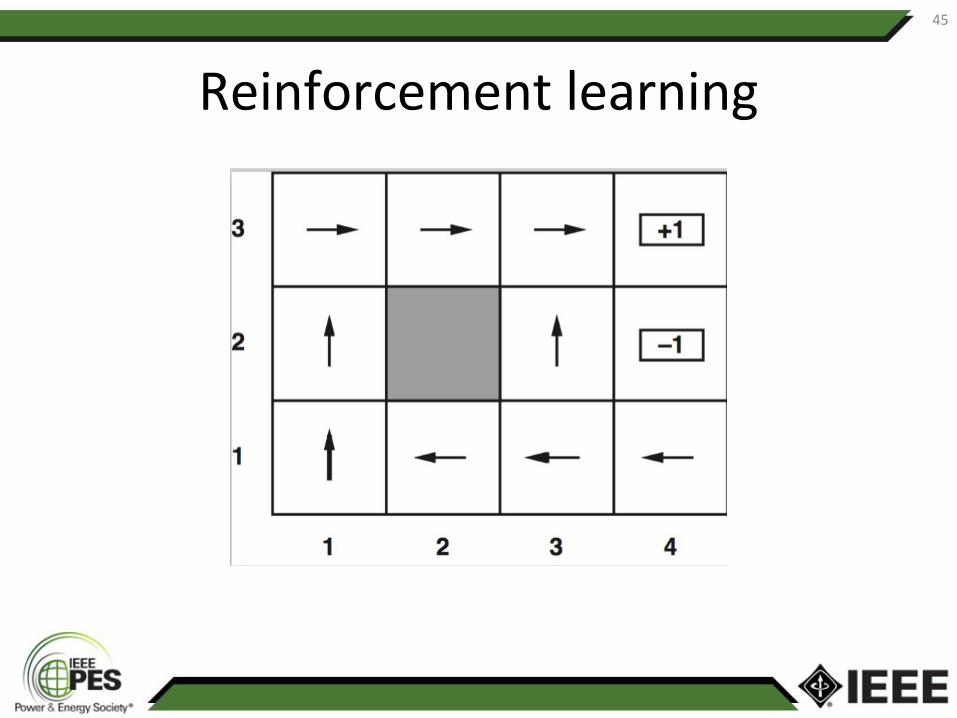
Reinforcement learning
45
Reinforcement learning: use cases
46
• Planning
• Playing games, e.g. the game of Go
• ...
Reinforcement learning: models
47
• Value/policy iteration
• Q-learning
• Deep reinforcement learning
• ...
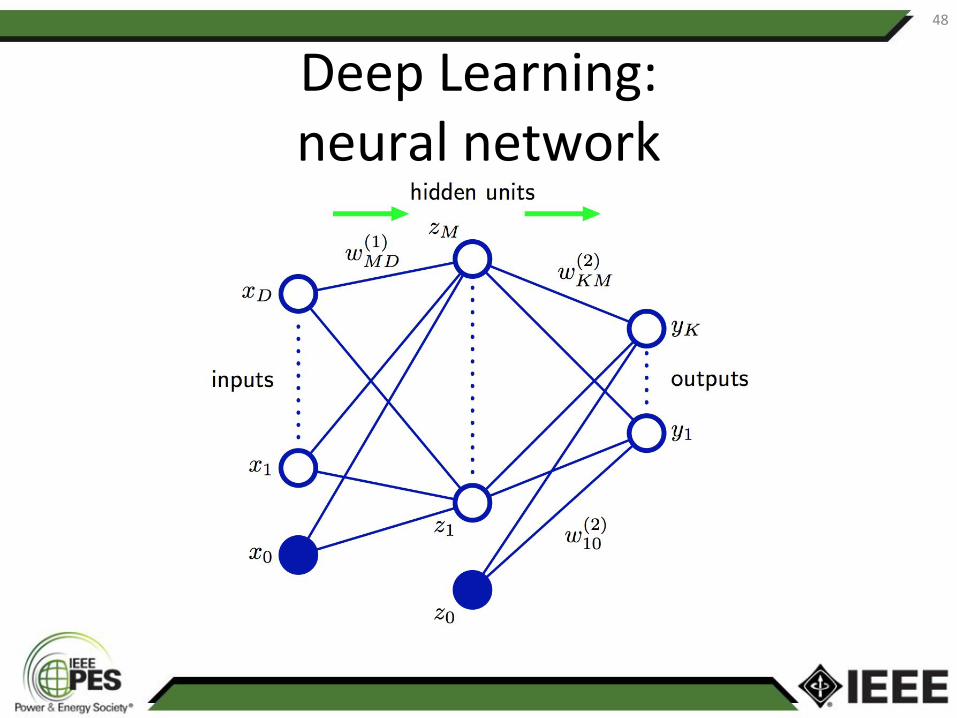
48
Deep Learning:neural network
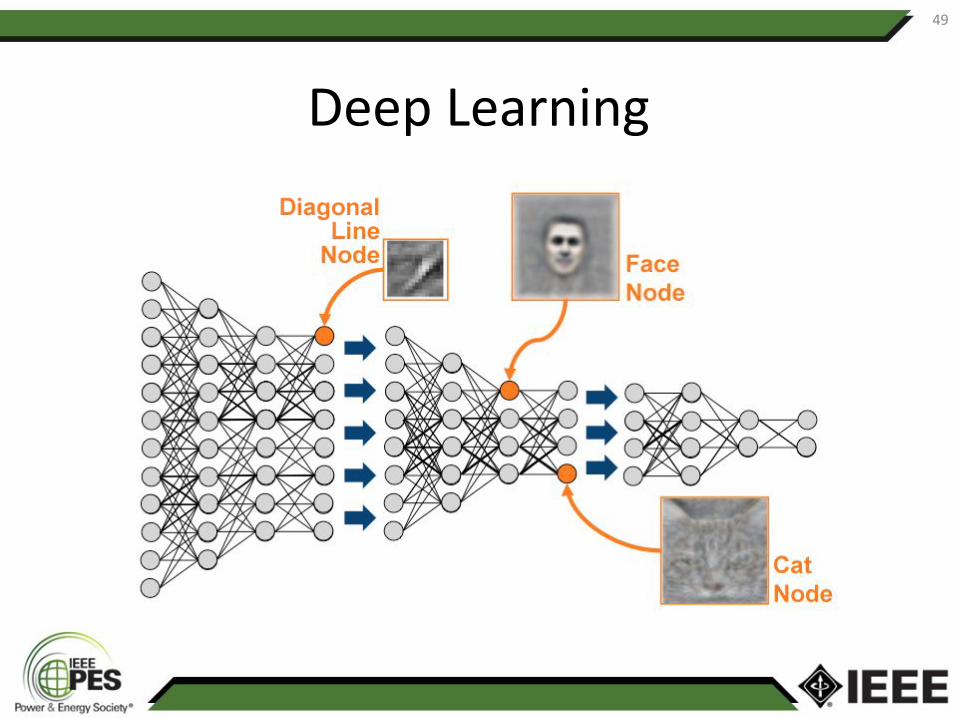
49
Deep Learning
Conclusions
• Machine Learning allows to learn complex statistical patterns from data
• Not much domain knowledge required• Many applications in daily life• Tell us more about your workflows so that we
can figure out how Machine Learning can help you!
50
References
[1] T. Mitchell, "Machine learning", McGraw Hill, 1997.[2] C. Bishop, "Pattern recognition and machine learning", Springer, 2006.[3] P. Glauner, et al., "The Top 10 Topics in Machine Learning Revisited: A Quantitative Meta-Study", Proceedings of the 25th European Symposium on Artificial Neural Networks, Computational Intelligence and Machine Learning (ESANN 2017), Bruges, Belgium, 2017. [4] P. Glauner, et al., "Impact of Biases in Big Data", Proceedings of the 26th European Symposium on Artificial Neural Networks, Computational Intelligence and Machine Learning (ESANN 2018), Bruges, Belgium, 2018.
51