lytic to temperate switching of viral communities · lytic to temperate switching of viral...
TRANSCRIPT
4 6 6 | N A T U R E | V O L 5 3 1 | 2 4 M A R C H 2 0 1 6
ARTICLEdoi:10.1038/nature17193
Lytic to temperate switching of viral communitiesB. Knowles1*, C. B. Silveira1,2*, B. A. Bailey3, K. Barott4, V. A. Cantu5, A. G. Cobián-Güemes1, F. H. Coutinho2,6, E. A. Dinsdale1,7, B. Felts3, K. A. Furby8, E. E. George1, K. T. Green1, G. B. Gregoracci9, A. F. Haas1, J. M. Haggerty1, E. R. Hester1, N. Hisakawa1, L. W. Kelly1, Y. W. Lim1, M. Little1, A. Luque3,5,7, T. McDole-Somera8, K. McNair5, L. S. de Oliveira2, S. D. Quistad1, N. L. Robinett1, E. Sala10, P. Salamon3,7, S. E. Sanchez1, S. Sandin8, G. G. Z. Silva5, J. Smith8, C. Sullivan11, C. Thompson2, M. J. A. Vermeij12,13, M. Youle14, C. Young15, B. Zgliczynski8, R. Brainard15, R. A. Edwards5,7,16, J. Nulton3, F. Thompson2 & F. Rohwer1,7
Microbial viruses infect about 1023 cells per second in the world’s oceans and the majority of microbial cells are infected at any given time1,2. What determines the proportion of lytic versus lysogenic infec-tions is not well understood, despite the known importance of lytic/lysogenic fate in driving ecological and biogeochemical outcomes1,3–6. Kill-the-Winner (KtW) models of lytic infection predict that den-sity- and frequency-dependent viral predation suppresses blooms of rapidly growing hosts, increasing host diversity6–9. A number of studies provide empirical support for these predictions7,10–13. In contrast, temperate viral dynamics in the environment are much less studied, and the relationship between lysogeny and host density is unclear. Provirus induction studies indicate that lysogeny is more frequent with low host density14–16. As such, it was established that viral communities transition from lysogeny to lytic dominance as host densities rise4,10,12,14,15,17.
Coral reefs offer a unique opportunity to probe the relationship between microbial host densities and the relative frequency of lytic versus temperate viral life cycles. Anthropogenic stressors can shunt these ecosystems into degradative regimes that result in changes in viral and microbial community composition, and rising microbial energy demand and densities, a state described as microbialized18–23. On heavily microbialized reefs, microbial abundances increase five- to tenfold, which increases predicted virus–host encounter rates18,24. Density-dependent lytic KtW models predict that reef microbializa-tion should therefore correlate with increased lytic viral predation, resulting in a predicted increased virus to microbe ratio. Here we use
four independent analyses—direct counts, literature meta-analyses, experiments, and viral community metagenomics—to show that increased host density is instead accompanied by a transition from lytic to temperate dynamics. On this basis we propose an extension of the KtW models, the Piggyback-the-Winner (PtW) model, which reflects the increased contribution of temperate viruses in ecosystems with high host abundance, yielding ‘more microbes, fewer viruses’.
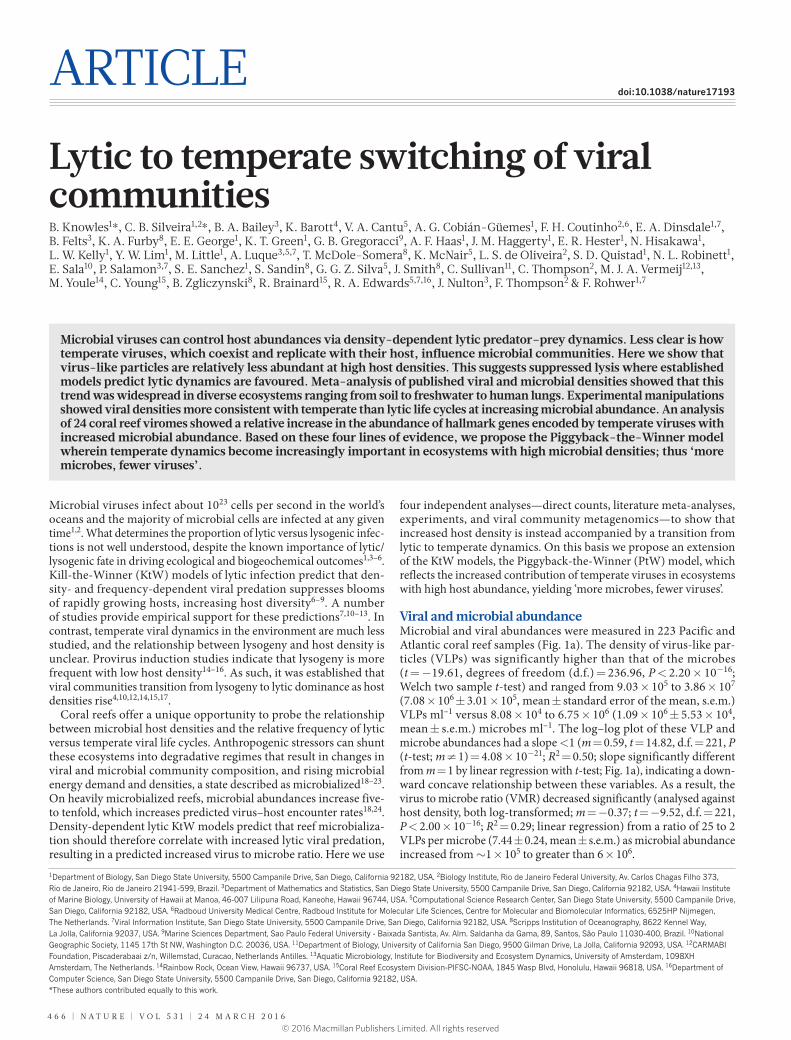
Viral and microbial abundanceMicrobial and viral abundances were measured in 223 Pacific and Atlantic coral reef samples (Fig. 1a). The density of virus-like par-ticles (VLPs) was significantly higher than that of the microbes (t = −19.61, degrees of freedom (d.f.) = 236.96, P < 2.20 × 10⁻¹⁶; Welch two sample t-test) and ranged from 9.03 × 10⁵ to 3.86 × 10⁷ (7.08 × 10⁶ ± 3.01 × 10⁵, mean ± standard error of the mean, s.e.m.) VLPs ml–1 versus 8.08 × 10⁴ to 6.75 × 10⁶ (1.09 × 10⁶ ± 5.53 × 10⁴, mean ± s.e.m.) microbes ml–1. The log–log plot of these VLP and microbe abundances had a slope <1 (m = 0.59, t = 14.82, d.f. = 221, P (t-test; m ≠ 1) = 4.08 × 10⁻²¹; R2 = 0.50; slope significantly different from m = 1 by linear regression with t-test; Fig. 1a), indicating a down-ward concave relationship between these variables. As a result, the virus to microbe ratio (VMR) decreased significantly (analysed against host density, both log-transformed; m = −0.37; t = −9.52, d.f. = 221, P < 2.00 × 10⁻¹⁶; R2 = 0.29; linear regression) from a ratio of 25 to 2 VLPs per microbe (7.44 ± 0.24, mean ± s.e.m.) as microbial abundance increased from ~1 × 10⁵ to greater than 6 × 10⁶.
Microbial viruses can control host abundances via density-dependent lytic predator–prey dynamics. Less clear is how temperate viruses, which coexist and replicate with their host, influence microbial communities. Here we show that virus-like particles are relatively less abundant at high host densities. This suggests suppressed lysis where established models predict lytic dynamics are favoured. Meta-analysis of published viral and microbial densities showed that this trend was widespread in diverse ecosystems ranging from soil to freshwater to human lungs. Experimental manipulations showed viral densities more consistent with temperate than lytic life cycles at increasing microbial abundance. An analysis of 24 coral reef viromes showed a relative increase in the abundance of hallmark genes encoded by temperate viruses with increased microbial abundance. Based on these four lines of evidence, we propose the Piggyback-the-Winner model wherein temperate dynamics become increasingly important in ecosystems with high microbial densities; thus ‘more microbes, fewer viruses’.
1Department of Biology, San Diego State University, 5500 Campanile Drive, San Diego, California 92182, USA. 2Biology Institute, Rio de Janeiro Federal University, Av. Carlos Chagas Filho 373, Rio de Janeiro, Rio de Janeiro 21941-599, Brazil. 3Department of Mathematics and Statistics, San Diego State University, 5500 Campanile Drive, San Diego, California 92182, USA. 4Hawaii Institute of Marine Biology, University of Hawaii at Manoa, 46-007 Lilipuna Road, Kaneohe, Hawaii 96744, USA. 5Computational Science Research Center, San Diego State University, 5500 Campanile Drive, San Diego, California 92182, USA. 6Radboud University Medical Centre, Radboud Institute for Molecular Life Sciences, Centre for Molecular and Biomolecular Informatics, 6525HP Nijmegen, The Netherlands. 7Viral Information Institute, San Diego State University, 5500 Campanile Drive, San Diego, California 92182, USA. 8Scripps Institution of Oceanography, 8622 Kennel Way, La Jolla, California 92037, USA. 9Marine Sciences Department, Sao Paulo Federal University - Baixada Santista, Av. Alm. Saldanha da Gama, 89, Santos, São Paulo 11030-400, Brazil. 10National Geographic Society, 1145 17th St NW, Washington D.C. 20036, USA. 11Department of Biology, University of California San Diego, 9500 Gilman Drive, La Jolla, California 92093, USA. 12CARMABI Foundation, Piscaderabaai z/n, Willemstad, Curacao, Netherlands Antilles. 13Aquatic Microbiology, Institute for Biodiversity and Ecosystem Dynamics, University of Amsterdam, 1098XH Amsterdam, The Netherlands. 14Rainbow Rock, Ocean View, Hawaii 96737, USA. 15Coral Reef Ecosystem Division-PIFSC-NOAA, 1845 Wasp Blvd, Honolulu, Hawaii 96818, USA. 16Department of Computer Science, San Diego State University, 5500 Campanile Drive, San Diego, California 92182, USA.*These authors contributed equally to this work.
© 2016 Macmillan Publishers Limited. All rights reserved
2 4 M A R C H 2 0 1 6 | V O L 5 3 1 | N A T U R E | 4 6 7
ARTICLE RESEARCH
Recent models were used to contrast our counts with predicted viral–host relationships8,9. Weitz and Dushoff (2008)8, in which burst size is proportional to density-dependent microbial growth rate, pre-dicts a negative relationship between viral and host density as viral predation causes declining host density with rising density-dependent host growth rate (Fig. 1b; details of steady state solution in Materials and Methods). The KtW-like model by Thingstad et al. (2014)9, that incorporates terms for nested resistance to viral infection amongst multiple host strains9,13, predicts an approximately downward concave relationship between viral and host abundances with the increasing dominance of slow growing, resistant hosts suppressing lytic dynam-ics as host density rises (Fig. 1b). The Piggyback-the-Winner (PtW) model introduced here predicts a relationship between VLP and host densities similar to Thingstad et al. (2014)9, but lytic dynamics are sup-pressed at high host density and density-dependent growth rate owing to the increased prevalence of lysogeny (modelled as lower specific viral production rates per infection) and super-infection exclusion rather than resistance.
Diversity and functional composition of microbial communitiesViral predation is thought to stimulate species-level host diversity through lineage-specific predation targeting dominant lineages, pro-moting community evenness5,25. However, when microbial diversity in 66 microbiomes from across the Pacific was probed, a weak and
significantly negative relationship between host density and taxonomic diversity was observed (Fig. 1c; microbial abundance log-transformed; m = −0.29, t = −2.60, d.f. = 64, P = 0.01; R2 = 0.09; linear regression). This also indicates that lytic dynamics are suppressed when both density-dependent (that is, total encounter rates) and frequency- dependent (that is, the relative density of a given host) would both favour lytic activity.
A recent model suggests that elevated host densities lead to an increase in host resistance to viral infection9. However, investigation of 66 Pacific microbiomes yielded weak relationships and no sup-port for increased host resistance via CRISPRs or potential horizon-tal transfer of resistance (per cent competence genes) in the mixed microbial community metagenomes (CRISPRs: Fig. 1d; m = −26.17, t = −1.44, d.f. = 64, P = 0.15; R2 = 0.03; per cent competence genes: Extended Data Fig. 1a; m = −0.25, t = −2.40, d.f. = 64, P = 0.02; R2 = 0.08; microbial abundance log-transformed and linear regres-sions in both analyses). These data indicate that immunity to viral infection does not change with host density as predicted by Thingstad et al. (2014)9, and is not promoted by horizontal transfer of resist-ance genes as predicted in King-of-the-Mountain dynamics9,26. Rather than host-mediated resistance to viral infection, the observed decrease in VMR with increasing microbial abundance may be driven by an alternative strain-level diversification mechanism, such as increasing resistance via lysogeny. Lysogeny, with its implicit super-infection immunity dynamic, would yield similar predictions to Thingstad et al. (2014)9, albeit through a different mechanism, and could complement the nested infection design of the Thingstad et al. (2014)9 model in future studies of resistance/growth trade-offs.
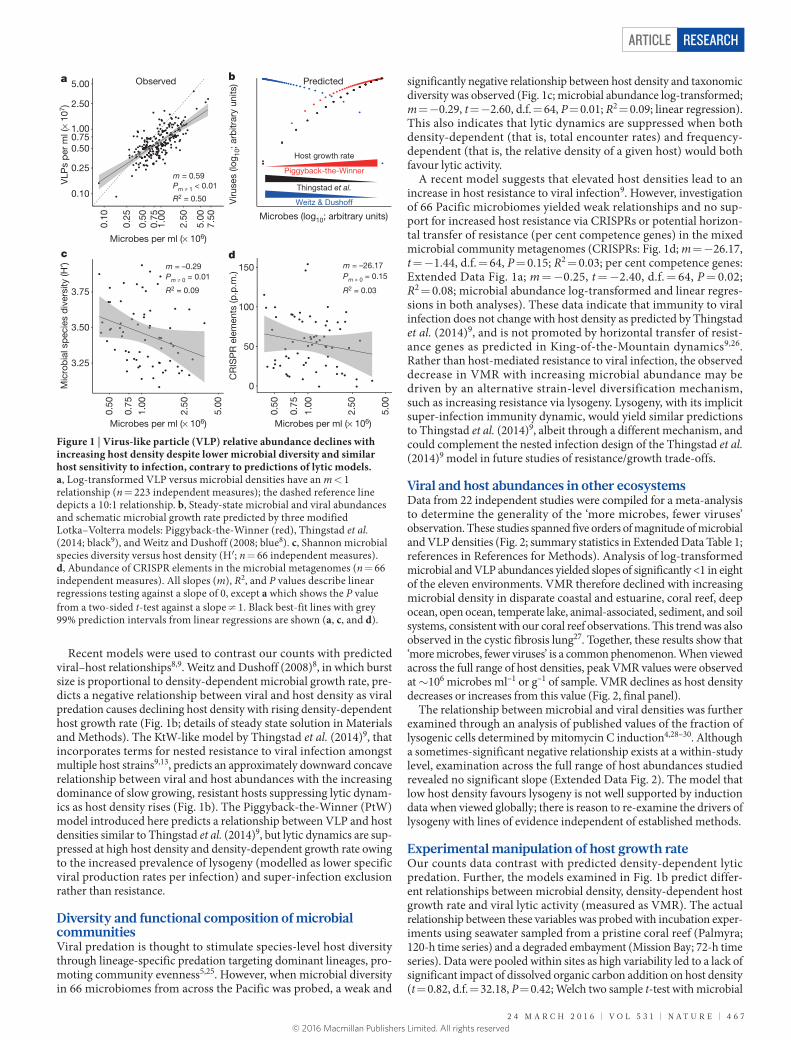
Viral and host abundances in other ecosystemsData from 22 independent studies were compiled for a meta- analysis to determine the generality of the ‘more microbes, fewer viruses’ observation. These studies spanned five orders of magnitude of microbial and VLP densities (Fig. 2; summary statistics in Extended Data Table 1; references in References for Methods). Analysis of log-transformed microbial and VLP abundances yielded slopes of significantly <1 in eight of the eleven environments. VMR therefore declined with increasing microbial density in disparate coastal and estuarine, coral reef, deep ocean, open ocean, temperate lake, animal-associated, sediment, and soil systems, consistent with our coral reef observations. This trend was also observed in the cystic fibrosis lung27. Together, these results show that ‘more microbes, fewer viruses’ is a common phenomenon. When viewed across the full range of host densities, peak VMR values were observed at ~106 microbes ml–1 or g–1 of sample. VMR declines as host density decreases or increases from this value (Fig. 2, final panel).
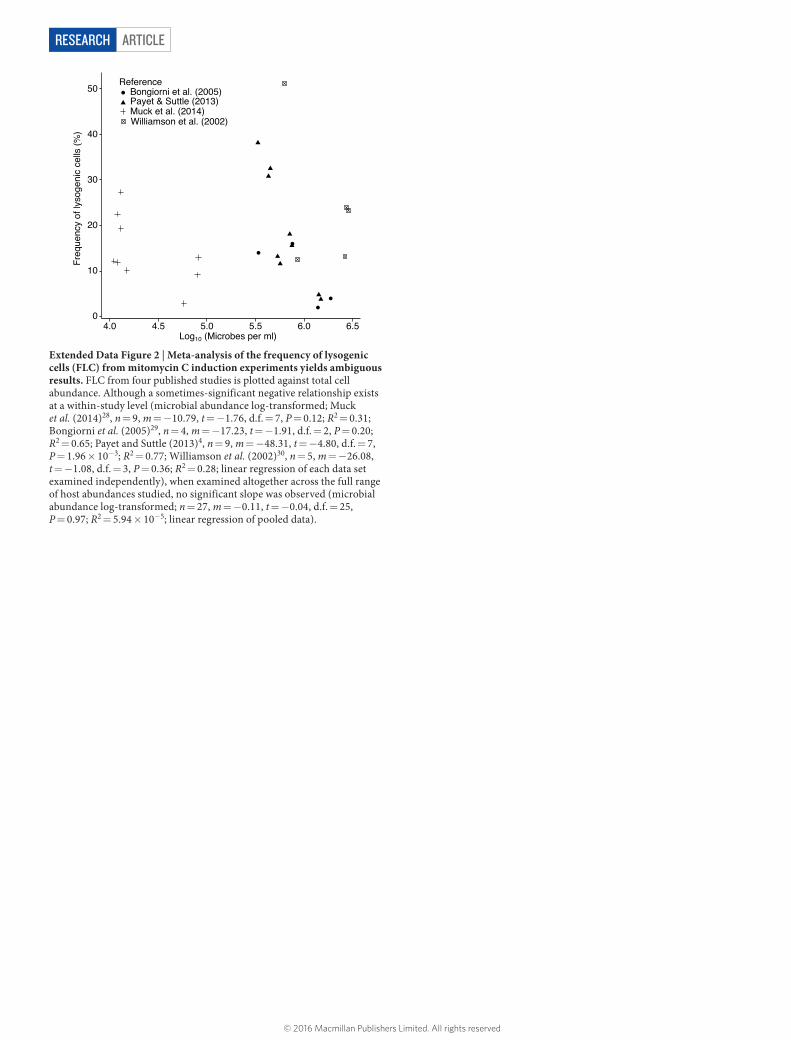
The relationship between microbial and viral densities was further examined through an analysis of published values of the fraction of lysogenic cells determined by mitomycin C induction4,28–30. Although a sometimes-significant negative relationship exists at a within-study level, examination across the full range of host abundances studied revealed no significant slope (Extended Data Fig. 2). The model that low host density favours lysogeny is not well supported by induction data when viewed globally; there is reason to re-examine the drivers of lysogeny with lines of evidence independent of established methods.
Experimental manipulation of host growth rateOur counts data contrast with predicted density-dependent lytic predation. Further, the models examined in Fig. 1b predict differ-ent relationships between microbial density, density-dependent host growth rate and viral lytic activity (measured as VMR). The actual relationship between these variables was probed with incubation exper-iments using seawater sampled from a pristine coral reef (Palmyra; 120-h time series) and a degraded embayment (Mission Bay; 72-h time series). Data were pooled within sites as high variability led to a lack of significant impact of dissolved organic carbon addition on host density (t = 0.82, d.f. = 32.18, P = 0.42; Welch two sample t-test with microbial
0.10
0.25
0.500.751.00
2.50
5.00
VLP
s p
er m
l (×
107 )
a
0.25
0.50
0.75
1.00
2.50
5.00
7.50
0.10
Microbes per ml (× 106)
Microbes per ml (× 106) Microbes per ml (× 106)
b
Viru
ses
(log 10
; arb
itrar
y un
its)
Microbes (log10; arbitrary units)
m = 0.59Pm ≠ 1 < 0.01
R2 = 0.50
Observed Predicted
m = –0.29
R2 = 0.09
Pm ≠ 0 = 0.01
Host growth rate
Piggyback-the-Winner
Thingstad et al.
Weitz & Dushoff
m = –26.17 Pm ≠ 0 = 0.15
R2 = 0.03
d150
100
50
0
CR
ISP
R e
lem
ents
(p.p
.m.)
0.50
0.75
1.00
2.50
5.00
0.50
0.75
1.00
2.50
5.00
c
Mic
rob
ial s
pec
ies
div
ersi
ty (H
′)
3.25
3.50
3.75
Figure 1 | Virus-like particle (VLP) relative abundance declines with increasing host density despite lower microbial diversity and similar host sensitivity to infection, contrary to predictions of lytic models. a, Log-transformed VLP versus microbial densities have an m < 1 relationship (n = 223 independent measures); the dashed reference line depicts a 10:1 relationship. b, Steady-state microbial and viral abundances and schematic microbial growth rate predicted by three modified Lotka–Volterra models: Piggyback-the-Winner (red), Thingstad et al. (2014; black9), and Weitz and Dushoff (2008; blue8). c, Shannon microbial species diversity versus host density (H′; n = 66 independent measures). d, Abundance of CRISPR elements in the microbial metagenomes (n = 66 independent measures). All slopes (m), R2, and P values describe linear regressions testing against a slope of 0, except a which shows the P value from a two-sided t-test against a slope ≠ 1. Black best-fit lines with grey 99% prediction intervals from linear regressions are shown (a, c, and d).
© 2016 Macmillan Publishers Limited. All rights reserved
4 6 8 | N A T U R E | V O L 5 3 1 | 2 4 M A R C H 2 0 1 6
ARTICLERESEARCH
abundance log-transformed; Extended Data Fig. 3a) or VMR (t = 0.17, d.f. = 27.70, P = 0.87; Welch two sample t-test).
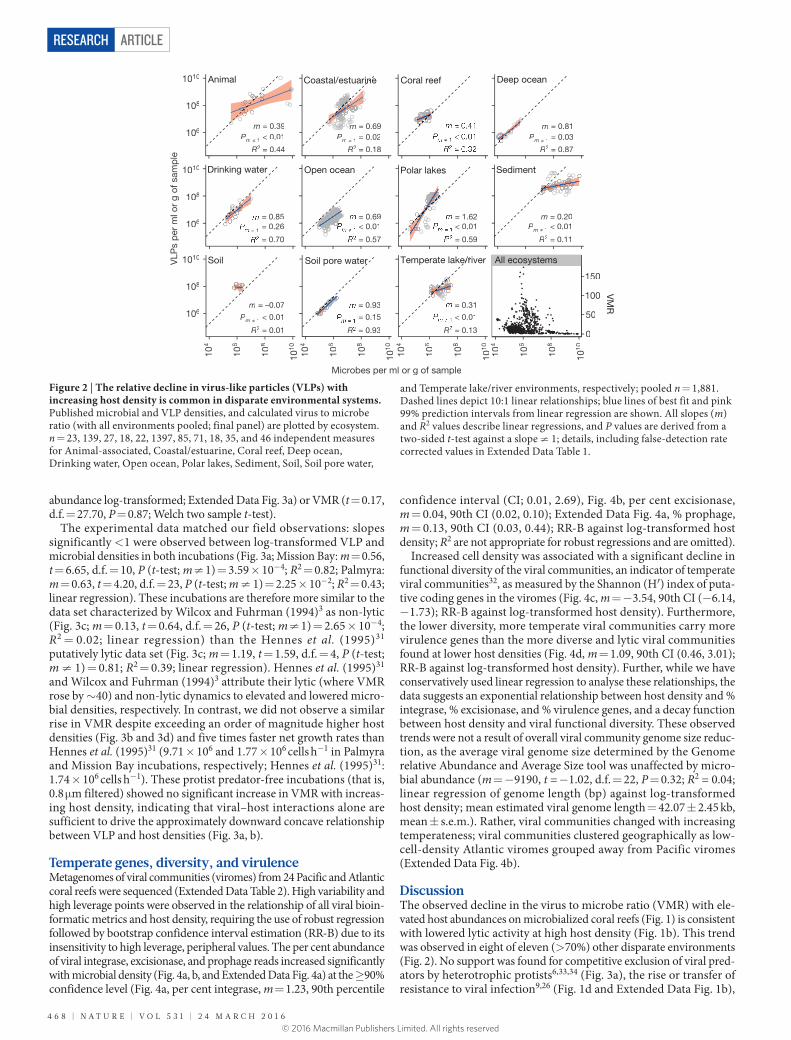
The experimental data matched our field observations: slopes significantly <1 were observed between log-transformed VLP and microbial densities in both incubations (Fig. 3a; Mission Bay: m = 0.56, t = 6.65, d.f. = 10, P (t-test; m ≠ 1) = 3.59 × 10⁻⁴; R2 = 0.82; Palmyra: m = 0.63, t = 4.20, d.f. = 23, P (t-test; m ≠ 1) = 2.25 × 10⁻²; R2 = 0.43; linear regression). These incubations are therefore more similar to the data set characterized by Wilcox and Fuhrman (1994)3 as non-lytic (Fig. 3c; m = 0.13, t = 0.64, d.f. = 26, P (t-test; m ≠ 1) = 2.65 × 10⁻⁴; R2 = 0.02; linear regression) than the Hennes et al. (1995)31 putatively lytic data set (Fig. 3c; m = 1.19, t = 1.59, d.f. = 4, P (t-test; m ≠ 1) = 0.81; R2 = 0.39; linear regression). Hennes et al. (1995)31 and Wilcox and Fuhrman (1994)3 attribute their lytic (where VMR rose by ~40) and non-lytic dynamics to elevated and lowered micro-bial densities, respectively. In contrast, we did not observe a similar rise in VMR despite exceeding an order of magnitude higher host densities (Fig. 3b and 3d) and five times faster net growth rates than Hennes et al. (1995)31 (9.71 × 10⁶ and 1.77 × 10⁶ cells h−1 in Palmyra and Mission Bay incubations, respectively; Hennes et al. (1995)31: 1.74 × 10⁶ cells h−1). These protist predator-free incubations (that is, 0.8 μm filtered) showed no significant increase in VMR with increas-ing host density, indicating that viral–host interactions alone are sufficient to drive the approximately downward concave relationship between VLP and host densities (Fig. 3a, b).
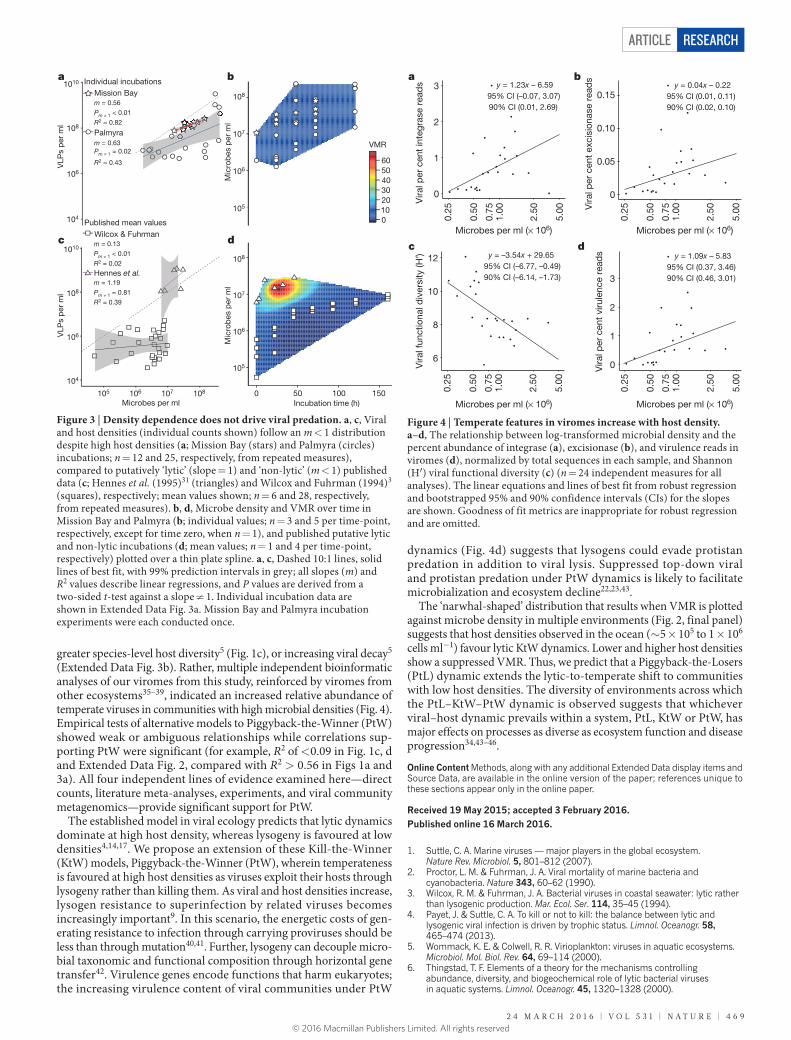
Temperate genes, diversity, and virulenceMetagenomes of viral communities (viromes) from 24 Pacific and Atlantic coral reefs were sequenced (Extended Data Table 2). High variability and high leverage points were observed in the relationship of all viral bioin-formatic metrics and host density, requiring the use of robust regression followed by bootstrap confidence interval estimation (RR-B) due to its insensitivity to high leverage, peripheral values. The per cent abundance of viral integrase, excisionase, and prophage reads increased significantly with microbial density (Fig. 4a, b, and Extended Data Fig. 4a) at the ≥90% confidence level (Fig. 4a, per cent integrase, m = 1.23, 90th percentile
confidence interval (CI; 0.01, 2.69), Fig. 4b, per cent excisionase, m = 0.04, 90th CI (0.02, 0.10); Extended Data Fig. 4a, % prophage, m = 0.13, 90th CI (0.03, 0.44); RR-B against log- transformed host density; R2 are not appropriate for robust regressions and are omitted).
Increased cell density was associated with a significant decline in functional diversity of the viral communities, an indicator of temperate viral communities32, as measured by the Shannon (H′) index of puta-tive coding genes in the viromes (Fig. 4c, m = −3.54, 90th CI (−6.14, −1.73); RR-B against log-transformed host density). Furthermore, the lower diversity, more temperate viral communities carry more virulence genes than the more diverse and lytic viral communities found at lower host densities (Fig. 4d, m = 1.09, 90th CI (0.46, 3.01); RR-B against log-transformed host density). Further, while we have conservatively used linear regression to analyse these relationships, the data suggests an exponential relationship between host density and % integrase, % excisionase, and % virulence genes, and a decay function between host density and viral functional diversity. These observed trends were not a result of overall viral community genome size reduc-tion, as the average viral genome size determined by the Genome relative Abundance and Average Size tool was unaffected by micro-bial abundance (m = −9190, t = −1.02, d.f. = 22, P = 0.32; R2 = 0.04; linear regression of genome length (bp) against log-transformed host density; mean estimated viral genome length = 42.07 ± 2.45 kb, mean ± s.e.m.). Rather, viral communities changed with increasing temperateness; viral communities clustered geographically as low-cell-density Atlantic viromes grouped away from Pacific viromes (Extended Data Fig. 4b).
DiscussionThe observed decline in the virus to microbe ratio (VMR) with ele-vated host abundances on microbialized coral reefs (Fig. 1) is consistent with lowered lytic activity at high host density (Fig. 1b). This trend was observed in eight of eleven (>70%) other disparate environments (Fig. 2). No support was found for competitive exclusion of viral pred-ators by heterotrophic protists6,33,34 (Fig. 3a), the rise or transfer of resistance to viral infection9,26 (Fig. 1d and Extended Data Fig. 1b),
Microbes per ml or g of sample
VLP
s p
er m
l or
g of
sam
ple
1010
108
106
1010
108
106
1010
108
106
104
106
108
1010
104
106
108
1010
104
106
108
1010
104
106
108
1010
Soil
m = –0.07
PmP ≠ 1 < 0.01
R2 = 0.01
= 0.31
< 0.01
R = 0.13
Temperate lake/river
= 0.93
= 0.15
R = 0.93
Soil pore water
Animal
m = 0.39PmP ≠ 1 < 0.01
R2 = 0.44
mm = 0.69PmP ≠ 1 = 0.02
R2 = 0.18
Coastal/estuarine Deep ocean
m = 0.81PmP ≠ 1 = 0.03
R2 = 0.87
Coral reef
0
50
100
150
VM
R
m = 0.20PmP ≠ 1 < 0.01
R2 = 0.11
SedimentDrinking water
= 0.85= 0.26
= 0.70
Open ocean
= 0.69 < 0.01
= 0.57
= 1.62 < 0.01
= 0.59
Polar lakes
All ecosystems
Figure 2 | The relative decline in virus-like particles (VLPs) with increasing host density is common in disparate environmental systems. Published microbial and VLP densities, and calculated virus to microbe ratio (with all environments pooled; final panel) are plotted by ecosystem. n = 23, 139, 27, 18, 22, 1397, 85, 71, 18, 35, and 46 independent measures for Animal-associated, Coastal/estuarine, Coral reef, Deep ocean, Drinking water, Open ocean, Polar lakes, Sediment, Soil, Soil pore water,
and Temperate lake/river environments, respectively; pooled n = 1,881. Dashed lines depict 10:1 linear relationships; blue lines of best fit and pink 99% prediction intervals from linear regression are shown. All slopes (m) and R2 values describe linear regressions, and P values are derived from a two-sided t-test against a slope ≠ 1; details, including false-detection rate corrected values in Extended Data Table 1.
© 2016 Macmillan Publishers Limited. All rights reserved
2 4 M A R C H 2 0 1 6 | V O L 5 3 1 | N A T U R E | 4 6 9
ARTICLE RESEARCH
greater species-level host diversity5 (Fig. 1c), or increasing viral decay5 (Extended Data Fig. 3b). Rather, multiple independent bioinformatic analyses of our viromes from this study, reinforced by viromes from other ecosystems35–39, indicated an increased relative abundance of temperate viruses in communities with high microbial densities (Fig. 4). Empirical tests of alternative models to Piggyback-the-Winner (PtW) showed weak or ambiguous relationships while correlations sup-porting PtW were significant (for example, R2 of <0.09 in Fig. 1c, d and Extended Data Fig. 2, compared with R2 > 0.56 in Figs 1a and 3a). All four independent lines of evidence examined here—direct counts, literature meta-analyses, experiments, and viral community metagenomics—provide significant support for PtW.
The established model in viral ecology predicts that lytic dynamics dominate at high host density, whereas lysogeny is favoured at low densities4,14,17. We propose an extension of these Kill-the-Winner (KtW) models, Piggyback-the-Winner (PtW), wherein temperateness is favoured at high host densities as viruses exploit their hosts through lysogeny rather than killing them. As viral and host densities increase, lysogen resistance to superinfection by related viruses becomes increasingly important9. In this scenario, the energetic costs of gen-erating resistance to infection through carrying proviruses should be less than through mutation40,41. Further, lysogeny can decouple micro-bial taxonomic and functional composition through horizontal gene transfer42. Virulence genes encode functions that harm eukaryotes; the increasing virulence content of viral communities under PtW
dynamics (Fig. 4d) suggests that lysogens could evade protistan predation in addition to viral lysis. Suppressed top-down viral and protistan predation under PtW dynamics is likely to facilitate microbialization and ecosystem decline22,23,43.
The ‘narwhal-shaped’ distribution that results when VMR is plotted against microbe density in multiple environments (Fig. 2, final panel) suggests that host densities observed in the ocean (~5 × 10⁵ to 1 × 10⁶ cells ml−1) favour lytic KtW dynamics. Lower and higher host densities show a suppressed VMR. Thus, we predict that a Piggyback-the-Losers (PtL) dynamic extends the lytic-to-temperate shift to communities with low host densities. The diversity of environments across which the PtL–KtW–PtW dynamic is observed suggests that whichever viral–host dynamic prevails within a system, PtL, KtW or PtW, has major effects on processes as diverse as ecosystem function and disease progression34,43–46.
Online Content Methods, along with any additional Extended Data display items and Source Data, are available in the online version of the paper; references unique to these sections appear only in the online paper.
Received 19 May 2015; accepted 3 February 2016.
Published online 16 March 2016.
1. Suttle, C. A. Marine viruses — major players in the global ecosystem. Nature Rev. Microbiol. 5, 801–812 (2007).
2. Proctor, L. M. & Fuhrman, J. A. Viral mortality of marine bacteria and cyanobacteria. Nature 343, 60–62 (1990).
3. Wilcox, R. M. & Fuhrman, J. A. Bacterial viruses in coastal seawater: lytic rather than lysogenic production. Mar. Ecol. Ser. 114, 35–45 (1994).
4. Payet, J. & Suttle, C. A. To kill or not to kill: the balance between lytic and lysogenic viral infection is driven by trophic status. Limnol. Oceanogr. 58, 465–474 (2013).
5. Wommack, K. E. & Colwell, R. R. Virioplankton: viruses in aquatic ecosystems. Microbiol. Mol. Biol. Rev. 64, 69–114 (2000).
6. Thingstad, T. F. Elements of a theory for the mechanisms controlling abundance, diversity, and biogeochemical role of lytic bacterial viruses in aquatic systems. Limnol. Oceanogr. 45, 1320–1328 (2000).
a
VLP
s p
er m
lV
LPs
per
ml
1010
108
108
107
106
105
108
107
106
105
106
104
1010
108
106
104
105 106 107 108
Microbes per ml
c
b
VMR
50403020100
60
Mic
rob
es p
er m
l
0 50 100 150Incubation time (h)
Mic
rob
es p
er m
l
d
Palmyram = 0.63Pm ≠ 1 = 0.02
R2 = 0.43
m = 0.56
Pm ≠ 1 < 0.01
R2 = 0.82
Mission BayIndividual incubations
m = 0.13
Pm ≠ 1 < 0.01
R2 = 0.02
Wilcox & FuhrmanPublished mean values
m = 1.19
Pm ≠ 1 = 0.81
R2 = 0.39
Hennes et al.
Figure 3 | Density dependence does not drive viral predation. a, c, Viral and host densities (individual counts shown) follow an m < 1 distribution despite high host densities (a; Mission Bay (stars) and Palmyra (circles) incubations; n = 12 and 25, respectively, from repeated measures), compared to putatively ‘lytic’ (slope = 1) and ‘non-lytic’ (m < 1) published data (c; Hennes et al. (1995)31 (triangles) and Wilcox and Fuhrman (1994)3 (squares), respectively; mean values shown; n = 6 and 28, respectively, from repeated measures). b, d, Microbe density and VMR over time in Mission Bay and Palmyra (b; individual values; n = 3 and 5 per time-point, respectively, except for time zero, when n = 1), and published putative lytic and non-lytic incubations (d; mean values; n = 1 and 4 per time-point, respectively) plotted over a thin plate spline. a, c, Dashed 10:1 lines, solid lines of best fit, with 99% prediction intervals in grey; all slopes (m) and R2 values describe linear regressions, and P values are derived from a two-sided t-test against a slope ≠ 1. Individual incubation data are shown in Extended Data Fig. 3a. Mission Bay and Palmyra incubation experiments were each conducted once.
a
c d
Microbes per ml (× 106) Microbes per ml (× 106)
Microbes per ml (× 106) Microbes per ml (× 106)
0.50
1.00
0.25
2.50
5.00
0.75
2
0
3
1
Vira
l per
cen
t in
tegr
ase
read
s y = 1.23x – 6.5995% CI (–0.07, 3.07)90% CI (0.01, 2.69)
0.50
1.00
0.25
2.50
5.00
0.75
0.05
0.10
0
0.15
Vira
l per
cen
t ex
cisi
onas
e re
ads
y = 0.04x – 0.2295% CI (0.01, 0.11)90% CI (0.02, 0.10)
0.50
1.00
0.25
2.50
5.00
0.75
8
10
6
12
Vira
l fun
ctio
nal d
iver
sity
(H′) y = –3.54x + 29.65
95% CI (–6.77, –0.49)90% CI (–6.14, –1.73)
0.50
1.00
0.25
2.50
5.00
0.75
2
0
3
1
Vira
l per
cen
t vi
rule
nce
read
s y = 1.09x – 5.8395% CI (0.37, 3.46)90% CI (0.46, 3.01)
b
Figure 4 | Temperate features in viromes increase with host density. a–d, The relationship between log-transformed microbial density and the percent abundance of integrase (a), excisionase (b), and virulence reads in viromes (d), normalized by total sequences in each sample, and Shannon (H′) viral functional diversity (c) (n = 24 independent measures for all analyses). The linear equations and lines of best fit from robust regression and bootstrapped 95% and 90% confidence intervals (CIs) for the slopes are shown. Goodness of fit metrics are inappropriate for robust regression and are omitted.
© 2016 Macmillan Publishers Limited. All rights reserved
4 7 0 | N A T U R E | V O L 5 3 1 | 2 4 M A R C H 2 0 1 6
ARTICLERESEARCH
7. Rodriguez-Brito, B. et al. Viral and microbial community dynamics in four aquatic environments. ISME J. 4, 739–751 (2010).
8. Weitz, J. S. & Dushoff, J. Alternative stable states in host–phage dynamics. Theor. Ecol. 1, 13–19 (2008).
9. Thingstad, T. F., Våge, S., Storesund, J. E., Sandaa, R.-A. & Giske, J. A theoretical analysis of how strain-specific viruses can control microbial species diversity. Proc. Natl Acad. Sci. USA 111, 7813–7818 (2014).
10. Weinbauer, M. G. & Höfle, M. G. Significance of viral lysis and flagellate grazing as factors controlling bacterioplankton production in a eutrophic lake. Appl. Environ. Microbiol. 64, 431–438 (1998).
11. Bratbak, G., Egge, J. K. & Heldal, M. Viral mortality of the marine alga Emiliania huxleyi (Haptophyceae) and termination of algal blooms. Mar. Ecol. Prog. Ser. 93, 39–48 (1993).
12. Evans, C. & Brussaard, C. P. D. Viral lysis and microzooplankton grazing of phytoplankton throughout the Southern Ocean. Limnol. Oceanogr. 57, 1826–1837 (2012).
13. Needham, D. M. et al. Short-term observations of marine bacterial and viral communities: patterns, connections and resilience. ISME J. 7, 1274–1285 (2013).
14. Jiang, S. C. & Paul, J. H. Significance of lysogeny in the marine environment: studies with isolates and a model of lysogenic phage production. Microb. Ecol. 35, 235–243 (1998).
15. Paul, J. H. Prophages in marine bacteria: dangerous molecular time bombs or the key to survival in the seas? ISME J. 2, 579–589 (2008).
16. Paul, J. H. & Weinbauer, M. Detection of lysogeny in marine environments. Man. Aquat. Viral Ecol. 4, 30–33 (2010).
17. Maurice, C. F., Bouvier, C., de Wit, R. & Bouvier, T. Linking the lytic and lysogenic bacteriophage cycles to environmental conditions, host physiology and their variability in coastal lagoons. Environ. Microbiol. 15, 2463–2475 (2013).
18. Dinsdale, E. A. et al. Microbial ecology of four coral atolls in the Northern Line Islands. PLoS One 3, e1584 (2008).
19. Smith, J. E. et al. Indirect effects of algae on coral: algae-mediated, microbe-induced coral mortality. Ecol. Lett. 9, 835–845 (2006).
20. Thurber, R. V. et al. Metagenomic analysis of stressed coral holobionts. Environ. Microbiol. 11, 2148–2163 (2009).
21. Kelly, L. W. et al. Black reefs: iron-induced phase shifts on coral reefs. ISME J. 6, 638–649 (2012).
22. McDole, T. et al. Assessing coral reefs on a Pacific-wide scale using the microbialization score. PLoS One 7, e43233 (2012).
23. Barott, K. L. & Rohwer, F. L. Unseen players shape benthic competition on coral reefs. Trends Microbiol. 20, 621–628 (2012).
24. Alongi, D. M. et al. Phytoplankton, bacterioplankton and virioplankton structure and function across the southern Great Barrier Reef shelf. J. Mar. Syst. 142, 25–39 (2015).
25. Thingstad, T. F. & Lignell, R. Theoretical models for the control of bacterial growth rate, abundance, diversity and carbon demand. Aquat. Microb. Ecol. 13, 19–27 (1997).
26. Giovannoni, S., Temperton, B. & Zhao, Y. Giovannoni et al. reply. Nature 499, E4–E5 (2013).
27. James, C. E. et al. Lytic activity by temperate phages of Pseudomonas aeruginosa in long-term cystic fibrosis chronic lung infections. ISME J. 9, 1391–1398 (2015).
28. Muck, S. et al. Fracture zones in the Mid Atlantic Ridge lead to alterations in prokaryotic and viral parameters in deep-water masses. Front. Microbiol. 5, 264 (2014).
29. Bongiorni, L., Magagnini, M., Armeni, M., Noble, R. & Danovaro, R. Viral production, decay rates, and life strategies along a trophic gradient in the North Adriatic Sea. Appl. Environ. Microbiol. 71, 6644–6650 (2005).
30. Williamson, S. J., Houchin, L. A., McDaniel, L. & Paul, J. H. Seasonal variation in lysogeny as depicted by prophage induction in Tampa Bay, Florida. Appl. Environ. Microbiol. 68, 4307–4314 (2002).
31. Hennes, K. P., Suttle, C. A. & Chan, A. M. Fluorescently labeled virus probes show that natural virus populations can control the structure of marine microbial communities. Appl. Environ. Microbiol. 61, 3623–3627 (1995).
32. McDaniel, L. D., Rosario, K., Breitbart, M. & Paul, J. H. Comparative metagenomics: natural populations of induced prophages demonstrate highly unique, lower diversity viral sequences. Environ. Microbiol. 16, 570–585 (2014).
33. Fuhrman, J. A. Microbial community structure and its functional implications. Nature 459, 193–199 (2009).
34. Weitz, J. S. et al. A multitrophic model to quantify the effects of marine viruses on microbial food webs and ecosystem processes. ISME J. 9, 1352–1364 (2015).
35. Breitbart, M. et al. Metagenomic analyses of an uncultured viral community from human feces. J. Bacteriol. 185, 6220–6223 (2003).
36. Reyes, A. et al. Viruses in the faecal microbiota of monozygotic twins and their mothers. Nature 466, 334–338 (2010).
37. Angly, F. E. et al. The marine viromes of four oceanic regions. PLoS Biol. 4, e368 (2006).
38. Breitbart, M. et al. Diversity and population structure of a near-shore marine-sediment viral community. Proc. R. Soc. Lond. B 271, 565–574 (2004).
39. Brum, J. R., Hurwitz, B. L., Schofield, O., Ducklow, H. W. & Sullivan, M. B. Seasonal time bombs: dominant temperate viruses affect Southern Ocean microbial dynamics. ISME J. 10, 437–449 (2015).
40. Våge, S., Storesund, J. E. & Thingstad, T. F. Adding a cost of resistance description extends the ability of virus-host model to explain observed patterns in structure and function of pelagic microbial communities. Environ. Microbiol. 15, 1842–1852 (2013).
41. Avrani, S. & Lindell, D. Convergent evolution toward an improved growth rate and a reduced resistance range in Prochlorococcus strains resistant to phage. Proc. Natl Acad. Sci. USA 112, E2191–E2200 (2015).
42. Kelly, L. W. et al. Local genomic adaptation of coral reef-associated microbiomes to gradients of natural variability and anthropogenic stressors. Proc. Natl Acad. Sci. USA 111, 10227–10232 (2014).
43. Silveira, C. B. et al. Microbial and sponge loops modify fish production in phase-shifting coral reefs. Environ. Microbiol. 17, 3832–3846 (2015).
44. Barr, J. J. et al. Bacteriophage adhering to mucus provide a non-host-derived immunity. Proc. Natl Acad. Sci. USA 110, 10771–10776 (2013).
45. Whiteson, K. L. et al. The upper respiratory tract as a microbial source for pulmonary infections in cystic fibrosis. Parallels from island biogeography. Am. J. Respir. Crit. Care Med. 189, 1309–1315 (2014).
46. Willner, D. et al. Metagenomic analysis of respiratory tract DNA viral communities in cystic fibrosis and non-cystic fibrosis individuals. PLoS One 4, e7370 (2009).
Acknowledgements This paper is dedicated to the memory of Mike Furlan, mentor, friend, and colleague. We are grateful to the National Oceanographic and Atmospheric Administration Coral Reef Ecosystem Division for supporting this research, and to the captains and crews of the NOAA ship Hi’ialakai and the Hanse Explorer. Thanks to J. Payet for providing viral and microbial abundance data. Sampling was carried out under research permits from the US Fish and Wildlife Service, Palmyra Atoll National Wildlife Refuge, the Environment and Conservation Division of the Republic of Kiribati (n. 021/13) and ICMBio, Brazil (n. 27147-2). This work was funded by the Canadian Institute for Advanced Research Integrated Microbial Biodiversity Program Fellowship Award 141679 (to F.R.) and National Science Foundation grants OISE-1243541 and DEB-1046413 (to F.R.), CNS-1305112 and MCB-1330800 (to R.A.E.), DUE-1323809 (to E.A.D.), Gordon and Betty Moore Foundation Investigator Award GBMF-3781 (to F.R.), and the Brazilian National Research Council (CNPq; to F.T.) and Brazilian National Research Council Science Without Borders Program (CNPq/CAPES; to C.B.S.).
Author Contributions F.R., B.K., C.B.S., and F.T. conceptualized the project; B.K., F.R., C.B.S., and M.Y. wrote the manuscript; B.K., C.B.S., V.A.C., A.G.C.-G., K.T.G, K.M., G.G.Z.S., S.D.Q., Y.W.L., S.E.S., F.H.C., E.R.H. , N.L.R., B.A.B., B.F., A.L., P.S., J.N., C.Y., E.E.G., M.L., K.A.F., L.S.O., T.M.-S., J.M.H., B.Z., A.F.H., M.J.A.V., K.B., C.S., R.A.E., and F.R. performed sample collection, processing, experiments, and analysis; N.H. provided graphics and GIS analysis; E.A.D., L.W.K., S.S., J.S., R.B., C.T., G.B.G., J.N., E.S., R.A.E., F.T., and F.R. provided intellectual guidance and funding during the development of the research.
Author Information The viromes and microbiomes used in this paper are accessible at MG-RAST (http://metagenomics.anl.gov/) under the Piggyback-the-Winner project. Virome accession numbers: 4683670.3, 4683674.3, 4683677.3, 4683680.3, 4683683.3, 4683684.3, 4683686.3, 4683690.3, 4683702.3, 4683703.3, 4683704.3, 4683706.3, 4683712.3, 4683720.3, 4683739.3, 4683744.3, 4683745.3, 4683746.3, 4683747.3, 4683731.3, 4683733.3, 4683734.3, 4683718.3, 4684617.3. Microbiome accession numbers: 4683666.3, 4683667.3, 4683668.3, 4683669.3, 4683671.3, 4683672.3, 4683673.3, 4683675.3, 4683676.3, 4683678.3, 4683679.3, 4683681.3, 4683682.3, 4683685.3, 4683687.3, 4683688.3, 4683689.3, 4683691.3, 4683692.3, 4683693.3, 4683694.3, 4683695.3, 4683696.3, 4683697.3, 4683698.3, 4683699.3, 4683700.3, 4683701.3, 4683705.3, 4683707.3, 4683708.3, 4683709.3, 4683710.3, 4683711.3, 4683713.3, 4683714.3, 4683715.3, 4683716.3, 4683717.3, 4683719.3, 4683721.3, 4683722.3, 4683723.3, 4683724.3, 4683725.3, 4683726.3, 4683727.3, 4683728.3, 4683729.3, 4683732.3, 4683735.3, 4683736.3, 4683737.3, 4683738.3, 4683740.3, 4683741.3, 4683742.3, 4683743.3, 4683748.3, 4683749.3, 4683750.3, 4683751.3, 4683752.3, 4683753.3, 4683754.3, 4684616.3. Reprints and permissions information is available at www.nature.com/reprints. The authors declare no competing financial interests. Readers are welcome to comment on the online version of the paper. Correspondence and requests for materials should be addressed to F.R. ([email protected]) or B.K. ([email protected]).
© 2016 Macmillan Publishers Limited. All rights reserved

ARTICLE RESEARCH
METHODSViral and microbial counts. Seawater was collected in 2-l diver-deployed Niskin bottles at approximately 10 m depth within 30 cm of the benthos on coral reefs across the Pacific and Atlantic Oceans47. Samples were fixed with 2% final concen-tration paraformaldehyde within four hours of collection. Pacific Ocean samples were filtered and stained with SYBR Gold (Life Technologies, USA), mounted on slides and analysed by epifluorescence microscopy47. Atlantic Ocean samples were flash frozen and stored in liquid nitrogen until analysis on a BD FACSCalibur flow cytometer48. Investigators were blinded when conducting all counts in this study (environmental or experimental), with sites or incubation samples imaged and analysed in a random order and identified only after analysis.Predator–prey modelling. Steady state solutions to the dynamic model of Weitz and Dushoff (2007)8 were calculated under varying carrying capacities (K). The chemostat model of Thingstad et al. (2014)9 was run for varying K, and the final point in the evolution of the system plotted.
A standard lytic model49 that incorporates a logistic or trophic-state dependence for the microbe growth rate r is given by the equations
δN/δt = r • (1− N/K) • N − (d • N) − (φ • N • V)
δV/δt = (β • φ • N/K • N • V) − (m • V)
where d and m are, respectively, the trophic-independent death rates for microbes and phage, N and V are, respectively, microbial host and viral abundances, β is the burst size, and φ is the adsorption coefficient. This corresponds to the Weitz–Dushoff model8 with their parameter a (the fractional reduction of lysis at carrying capacity term) set equal to 0.
In this case the specific viral production rate per microbe is given by the product β • φ. In the new PtW model of viral–host interactions proposed here we replace this product with the quantity β • φ • N/K, suppressing viral production as the system moves away from K (that is, N/K becomes smaller) to simulate augmenta-tion of lysogeny in eutrophic conditions. In this case β • φ has the interpretation as the maximum value for the specific viral production rate per microbe. Steady state solutions of host and viral densities in the PtW model generated herein were calculated across a range of K (Fig. 1b). All models are available as Matlab scripts from https://github.com/benjaminwilliamknowles/Piggyback-the-Winner.Meta-analysis of cell and viral abundances. The relationships between published VLP and cell abundances from disparate environments were probed from 22 studies17,28,44,50–68. When abundances were not available, we used the WebPlotDigitizer tool to recover data from graphs (http://arohatgi.info/WebPlotDigitizer/app/). Samples were grouped by habitat: animal-associated, polar lakes, coastal/estuarine, coral reefs, deep ocean, drinking water, open ocean, sediment, soil, soil water and temperate lake/river. We similarly extracted data from published studies and tested the relationship between cell abundance and the fre-quency of lysogenic cells as studied by mitomycin C induction in previous studies from the Adriatic Basin, Arctic Shelf, Mid Atlantic Ridge and Tampa Bay4,28–30.Metaviromic sampling and processing. Viral metagenomic samples were col-lected at 24 reefs (Extended Data Table 2), a subset of sites sampled for counts as previously described47. Pacific viral concentrates were treated with 250 μl of chloroform per 50 ml of concentrate to destroy microbes and purified using CsCl step gradient ultracentrifugation47. Viral DNA was extracted using the formamide/phenol/chloroform isoamyl alcohol technique47 and amplified using the Linker Amplified Sequencing Library approach69 and sequenced on an Illumina MySeq platform (Illumina, USA). Atlantic viral concentrates were passed through a 0.22 μm filter and 250 μl of chloroform per 50 ml of concentrate was added to remove microbes, followed by ultracentrifugation for further concentration. DNA from Atlantic sites was extracted by the phenol/chloroform/isoamyl alcohol tech-nique, amplified using multiple displacement amplification20 and sequenced on an Ion Torrent sequencer (Life Sciences, USA). Microbial metagenomes were prepared by DNA extraction from the >0.22 μm fraction of the microbial community using Nucleospin Tissue Extraction kits (Macherey Nagel, Germany)47 and sequencing on an Illumina MySeq platform (Illumina, USA).Bioinformatics. Sequences less than 100 bp and with mean quality scores less than 25 were removed using PrinSeq70. Acceptable sequences were then derepli-cated with TagCleaner71 and potential contaminants matching lambda or human DNA sequences removed with DeconSeq72. Focusing on microbial reads, micro-bial metagenomes were taxonomically annotated based on k-mer similarity using FOCUS73. Rank-abundance tables were then used to calculate microbial species-level Shannon (base e) taxonomic diversity. For the virome analysis, protein sequences of all integrase, excisionase, and competence gene sequences on the NCBI RefSeq database (http://www.ncbi.nlm.nih.gov/refseq/) were downloaded and made into BLAST databases (makeblastdb command; BLAST version 2.2.29+,
ftp://ftp.ncbi.nlm.nih.gov/blast/executables/blast+/LATEST/). The Virulence Factors of Pathogenic Bacteria Database (http://www.mgc.ac.cn/VFs/main.htm) was used as a protein database for virulence genes. The percentage of each sequence library composed of integrase, excisionase, competence, or virulence genes was computed as the number of sequences with >60 bp match at a 40% identity to database sequences identified using BLASTx, normalized by the total number of sequences in the virome. CRISPRs were identified in microbiomes using the CRISPR Recognition Tool (https://github.com/ajmazurie/CRT) and hits normalized to parts per million (p.p.m.) against total reads. The fraction of known prophage-like reads in the viromes, normalized by total sequences, was assessed by a stringent (e-value 10−10) BLAST against known prophages in cultured bacteria downloaded from NCBI (hosts (number of prophage): Escherichia coli (36), Shigella flexneri (31), Salmonella enterica (16), Staphylococcus aureus (14), Xylella fastidiosa (12), Yersinia pseudotuberculosis (11), Yersinia pestis (9), Shewanella baltica (8), Streptococcus pyogenes (7), Pseudomonas syringae (7), Salmonella typhimurium (6), Xanthomonas campestris (5), Mycobacterium tuberculosis (4), Yersinia enter-ocolitica (3), Streptococcus agalactiae (3), Stenotrophomonas maltophilia (3), Pseudomonas putida (3), Staphylococcus haemolyticus (2), Streptomyces avermitilis (1), Streptococcus uberis (1), Listeria monocytogenes (1), Caulobacter sp. (1)). For functional diversity analysis, reads of each virome were assembled using MIRA74 followed by ORF calling using FragGenScan75 and ORF clustering at 85% identity using CD-HIT76 to build protein cluster databases. We then performed BLASTx of reads against clusters databases to assess the number of reads assigned to each protein cluster. An OTU-like table was built using each cluster as a rank unit and read counts as abundance. Shannon (base e) indexes were calculated using the VEGAN package in R (http://cran.r-project.org/web/packages/vegan/index.html). Average viral genome size estimates were performed using GAAS77 and virome clustering was performed using crAss78.Bioinformatic code availability. The following codes and parameters were used for each step of the viral functional diversity analysis:Assembly parameters used in Mira:minimum overlap = 30 and minimum relative score = 90. FragGeneScan code: ./run_FragGeneScan.pl -genome=[seq_file_name] -out= [output_file_name] -complete=0 -train=illumina_10. CD-HIT code: cd-hit –i [input fastafilename.faa] -o [outputfilename]_85 -c 0.85 -n 5 CD-HIT output was used as database for BLASTx with virome reads, and output format 6 was parsed with the following python script to create rank-abundance tables: f="BlastOutput.txt" myfile=open(f) h={};temp="" for line in myfile: line=line.split() if temp!=line[0]: if line[1] not in h: h[line[1]]=0 h[line[1]]+=1 temp=line[0]myfile.close()Incubation experiments. Water samples were collected at Palmyra Atoll, a pristine coral reef in the central Pacific, and Mission Bay, a degraded embayment in San Diego, CA. Samples were twice filtered through 0.8 μm pre-combusted GF/F filters to remove protists. Palmyra water was subsampled in 100-ml aliquots and distrib-uted in 12 Whirl-Pak bags (Cole-Parmer, IL, USA), divided into two experimental groups and one control, each one containing four randomly chosen replicate bags. For the two experimental groups we added a DOC cocktail containing 48 different labile carbon sources79 at the final concentration of 500 μM or 60 μM (+DOC treatment; Extended Data Fig. 3a), while no DOC was added to the control group (−DOC treatment; Extended Data Fig. 3a). Viral decay in microbe-free incubation bags was monitored as an additional control with 0.22 μm double-filtered water samples (Extended Data Fig. 3b). 1 ml samples were taken at times 0 h, 24 h, 48 h, 72 h, and 120 h from each bag for cell and viral counts. Mission Bay water was filtered and separated in three groups as above. 250 ml aliquots were distributed in each bag and incubated with 0 μM, 1 μM or 100 μM final concentrations by DOC addition. Samples were taken at times 12 h, 24 h, 48 h, and 72 h for counts. All incubations were performed in the dark at 25 °C. Samples were fixed and analysed by epifluorescence microscopy as described above.Statistical analysis. No statistical methods were used to predetermine sample size. Significance was determined using an alpha of 0.05 when direct counts data were compared, and using an alpha of 0.1 when analysing counts versus bioinfor-matic analyses to account for the disparate nature of these data sets (although 95% prediction intervals are also shown). The relationship between microbial density and microbial diversity, CRISPR sequences, and competence genes were tested
© 2016 Macmillan Publishers Limited. All rights reserved

ARTICLERESEARCH
for significant deviation from a slope of 0 by linear regression. The relationship between VLP and microbial densities in Figs 1a, 2 (all except the final panel show-ing VMR), and 3a, c were tested for slopes significantly different to 1 by t-tests that tested the null hypothesis that the slope is not equal to 1 against the two-sided alternative; the corresponding P value is given for this test. The fdrtool package in R was used to provide false discovery rate-corrected (FDR) P values for the multiple comparisons conducted in Fig. 2 (Extended Data Table 1). Conclusions were similar between FDR and uncorrected analyses. Experimental data in Fig. 3 was complemented by average counts taken from previous studies3,31 using the WebPlotDigitizer tool. Data was taken from the nutrient added treatment of Hennes et al. (1995)31 as it was described as showing ‘lytic’ dynamics (Fig. 3c, d). Data from the ‘non-lytic’ 30%, 20%, 10%, and 3% dilutions by Wilcox and Fuhrman (1994)3 were used as they had encounter rates (the product of viral and host densities) ~1012 or less at the beginning of the incubations, described as the cutoff below which lytic dynamics were not sustained. A thin plate spline was applied to experimental and literature values for visualization and interpretation (Fig. 3b, d). While some data sets used to examine alternatives to PtW and published values in Figs 1c, d, 2, 3c, d, Extended Data Fig. 1a, and Extended Data Fig. 2, violated the assumptions of linear regression, this analysis was used for comparability. Robust regressions were used in Fig. 4 and Extended Data Fig. 4a analyses in order to accommodate high-leverage samples on parametric statistical models, allowing all samples to be retained in the analysis. Results are presented for robust regression estimation using Tukey’s biweight and corresponding bootstrapped 90th percentile and 95th percentile confidence intervals (90% and 95% CIs) for the slope using 1,000 bootstrap replications. It should be noted for Fig. 4a that even though 95% CI covers 0, the 90% CI does not cover 0 indicating that there is evidence at the 0.1 confidence level that the slope is positive. For subsequent analyses in Fig. 4, 95% CIs do not straddle 0, showing that there is evidence at the 0.05 confidence level that the slope is negative (Fig. 4c) or positive (Fig. 4b, d). To account for error in the y axis we also performed Model II regression analyses with data shown in Figs 1, 2 and 4 using the package lmodel2 in R (Extended Data Table 3). It should be noted, however, that these results should be treated with caution, as error variance and goodness of fit metrics are not obtainable for this analysis.
47. Haas, A. F. et al. Unraveling the unseen players in the ocean - a field guide to water chemistry and marine microbiology. J. Vis. Exp. 93, e52131 (2014).
48. Brussaard, C. P. D., Payet, J. P., Winter, C. & Weinbauer, M. G. Quantification of aquatic viruses by flow cytometry. Man. Aquat. Viral Ecol. 11, 102–109 (2010).
49. Murray, J. D. Mathematical biology: I. an introduction. (Springer, 2002).50. Amossé, J. et al. The flows of nitrogen, bacteria and viruses from the soil to
water compartments are influenced by earthworm activity and organic fertilization (compost vs. vermicompost). Soil Biol. Biochem. 66, 197–203 (2013).
51. Bettarel, Y., Bouvy, M., Dumont, C. & Sime-Ngando, T. Virus-bacterium interactions in water and sediment of West African inland aquatic systems. Appl. Environ. Microbiol. 72, 5274–5282 (2006).
52. Bouvier, T. & Maurice, C. F. A single-cell analysis of virioplankton adsorption, infection, and intracellular abundance in different bacterioplankton physiologic categories. Microb. Ecol. 62, 669–678 (2011).
53. Glud, R. N. & Middelboe, M. Virus and bacteria dynamics of a coastal sediment: implication for benthic carbon cycling. Limnol. Oceanogr. 49, 2073–2081 (2004).
54. Furlan, M. Viral and microbial dynamics in the human respiratory tract. (San Diego State Univ., 2009).
55. Hewson, I., O’Neil, J. M., Fuhrman, J. A. & Dennison, W. C. Virus-like particle distribution and abundance in sediments and overlying waters along eutrophication gradients in two subtropical estuaries. Limnol. Oceanogr. 46, 1734–1746 (2001).
56. Kim, M.-S., Park, E.-J., Roh, S. W. & Bae, J.-W. Diversity and abundance of single-stranded DNA viruses in human feces. Appl. Environ. Microbiol. 77, 8062–8070 (2011).
57. Lisle, J. T. & Priscu, J. C. The occurrence of lysogenic bacteria and microbial aggregates in the lakes of the McMurdo Dry Valleys, Antarctica. Microb. Ecol. 47, 427–439 (2004).
58. Laybourn-Parry, J., Marshall, W. A. & Madan, N. J. Viral dynamics and patterns of lysogeny in saline Antarctic lakes. Polar Biol. 30, 351–358 (2006).
59. Madan, N. J., Marshall, W. a. & Laybourn-Parry, J. Virus and microbial loop dynamics over an annual cycle in three contrasting Antarctic lakes. Freshw. Biol. 50, 1291–1300 (2005).
60. Maurice, C. F., Bouvier, T., Comte, J., Guillemette, F. & Del Giorgio, P. A. Seasonal variations of phage life strategies and bacterial physiological states in three northern temperate lakes. Environ. Microbiol. 12, 628–641 (2010).
61. Maurice, C. F. et al. Disentangling the relative influence of bacterioplankton phylogeny and metabolism on lysogeny in reservoirs and lagoons. ISME J. 5, 831–842 (2011).
62. Mei, M. L. & Danovaro, R. Virus production and life strategies in aquatic sediments. Limnol. Oceanogr. 49, 459–470 (2004).
63. Parsons, R. J., Breitbart, M., Lomas, M. W. & Carlson, C. A. Ocean time-series reveals recurring seasonal patterns of virioplankton dynamics in the northwestern Sargasso Sea. ISME J. 6, 273–284 (2012).
64. Parsons, R. J. et al. Marine bacterioplankton community turnover within seasonally hypoxic waters of a subtropical sound: Devil’s Hole, Bermuda. Environ. Microbiol. 17, 3481–3499 (2015).
65. Rinta-Kanto, J. M., Lehtola, M. J., Vartiainen, T. & Martikainen, P. J. Rapid enumeration of virus-like particles in drinking water samples using SYBR green I-staining. Water Res. 38, 2614–2618 (2004).
66. Schapira, M. et al. Distribution of heterotrophic bacteria and virus-like particles along a salinity gradient in a hypersaline coastal lagoon. Aquat. Microb. Ecol. 54, 171–183 (2009).
67. Payet, J. P., McMinds, R., Burkepile, D. E. & Vega Thurber, R. L. Unprecedented evidence for high viral abundance and lytic activity in coral reef waters of the South Pacific Ocean. Front. Microbiol. 5, 493 (2014).
68. Patten, N. L., Harrison, P. L. & Mitchell, J. G. Prevalence of virus-like particles within a staghorn scleractinian coral (Acropora muricata) from the Great Barrier Reef. Coral Reefs 27, 569–580 (2008).
69. Duhaime, M. B., Deng, L., Poulos, B. T. & Sullivan, M. B. Towards quantitative metagenomics of wild viruses and other ultra-low concentration DNA samples: a rigorous assessment and optimization of the linker amplification method. Environ. Microbiol. 14, 2526–2537 (2012).
70. Schmieder, R. & Edwards, R. Quality control and preprocessing of metagenomic datasets. Bioinformatics 27, 863–864 (2011).
71. Schmieder, R., Lim, Y. W., Rohwer, F. & Edwards, R. TagCleaner: Identification and removal of tag sequences from genomic and metagenomic datasets. BMC Bioinformatics 11, 341 (2010).
72. Schmieder, R. & Edwards, R. Fast identification and removal of sequence contamination from genomic and metagenomic datasets. PLoS One 6, e17288 (2011).
73. Silva, G. G. Z., Cuevas, D. A., Dutilh, B. E. & Edwards, R. A. FOCUS: an alignment-free model to identify organisms in metagenomes using non-negative least squares. PeerJ 2, e425 (2014).
74. Chevreux, B., Wetter, T. & Suhai, S. Genome sequence assembly using trace signals and additional sequence information. in German conference on bioinformatics 45–56 (1999).
75. Rho, M., Tang, H. & Ye, Y. FragGeneScan: predicting genes in short and error-prone reads. Nucleic Acids Res. 38, e191 (2010).
76. Fu, L., Niu, B., Zhu, Z., Wu, S. & Li, W. CD-HIT: accelerated for clustering the next-generation sequencing data. Bioinformatics 28, 3150–3152 (2012).
77. Angly, F. E. et al. The GAAS metagenomic tool and its estimations of viral and microbial average genome size in four major biomes. PLOS Comput. Biol. 5, e1000593 (2009).
78. Dutilh, B. E. et al. Reference-independent comparative metagenomics using cross-assembly: crAss. Bioinformatics 28, 3225–3231 (2012).
79. Sanchez, S. E. et al. Phage Phenomics: physiological approaches to characterize novel viral proteins. J. Vis. Exp. 100, e52854 (2015).
© 2016 Macmillan Publishers Limited. All rights reserved

ARTICLE RESEARCH
Extended Data Figure 1 | The observed decline in virus to microbe ratio with increasing host density is not supported by horizontal transfer (for example, of resistance genes) under conditions where strain diversity is predicted to rise. a, Host competence gene composition likely does not facilitate the expected rise in resistance to viral infection
(n = 66; m = −0.25, t = −2.40, d.f. = 64, P = 0.02; R2 = 0.08; microbial abundance log-transformed; linear regression). b, Lysogeny may provide strain diversification similar to the co-evolutionary diversification predicted by Thingstad et al. (2014)9 nested-infection chemostat model.
© 2016 Macmillan Publishers Limited. All rights reserved
ARTICLERESEARCH
Extended Data Figure 2 | Meta-analysis of the frequency of lysogenic cells (FLC) from mitomycin C induction experiments yields ambiguous results. FLC from four published studies is plotted against total cell abundance. Although a sometimes-significant negative relationship exists at a within-study level (microbial abundance log-transformed; Muck et al. (2014)28, n = 9, m = −10.79, t = −1.76, d.f. = 7, P = 0.12; R2 = 0.31; Bongiorni et al. (2005)29, n = 4, m = −17.23, t = −1.91, d.f. = 2, P = 0.20; R2 = 0.65; Payet and Suttle (2013)4, n = 9, m = −48.31, t = −4.80, d.f. = 7, P = 1.96 × 10⁻³; R2 = 0.77; Williamson et al. (2002)30, n = 5, m = −26.08, t = −1.08, d.f. = 3, P = 0.36; R2 = 0.28; linear regression of each data set examined independently), when examined altogether across the full range of host abundances studied, no significant slope was observed (microbial abundance log-transformed; n = 27, m = −0.11, t = −0.04, d.f. = 25, P = 0.97; R2 = 5.94 × 10⁻⁵; linear regression of pooled data).
© 2016 Macmillan Publishers Limited. All rights reserved
ARTICLE RESEARCH
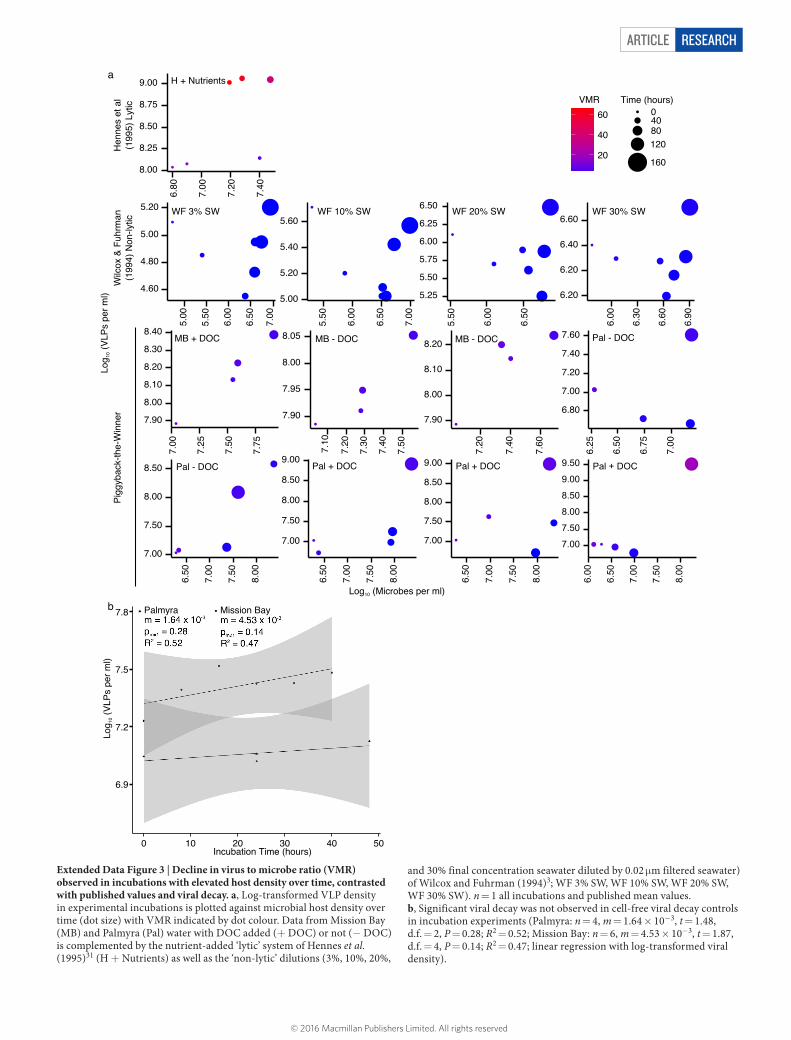
Extended Data Figure 3 | Decline in virus to microbe ratio (VMR) observed in incubations with elevated host density over time, contrasted with published values and viral decay. a, Log-transformed VLP density in experimental incubations is plotted against microbial host density over time (dot size) with VMR indicated by dot colour. Data from Mission Bay (MB) and Palmyra (Pal) water with DOC added (+ DOC) or not (− DOC) is complemented by the nutrient-added ‘lytic’ system of Hennes et al. (1995)31 (H + Nutrients) as well as the ‘non-lytic’ dilutions (3%, 10%, 20%,
and 30% final concentration seawater diluted by 0.02 μm filtered seawater) of Wilcox and Fuhrman (1994)3; WF 3% SW, WF 10% SW, WF 20% SW, WF 30% SW). n = 1 all incubations and published mean values. b, Significant viral decay was not observed in cell-free viral decay controls in incubation experiments (Palmyra: n = 4, m = 1.64 × 10⁻³, t = 1.48, d.f. = 2, P = 0.28; R2 = 0.52; Mission Bay: n = 6, m = 4.53 × 10⁻³, t = 1.87, d.f. = 4, P = 0.14; R2 = 0.47; linear regression with log-transformed viral density).
© 2016 Macmillan Publishers Limited. All rights reserved
ARTICLERESEARCH
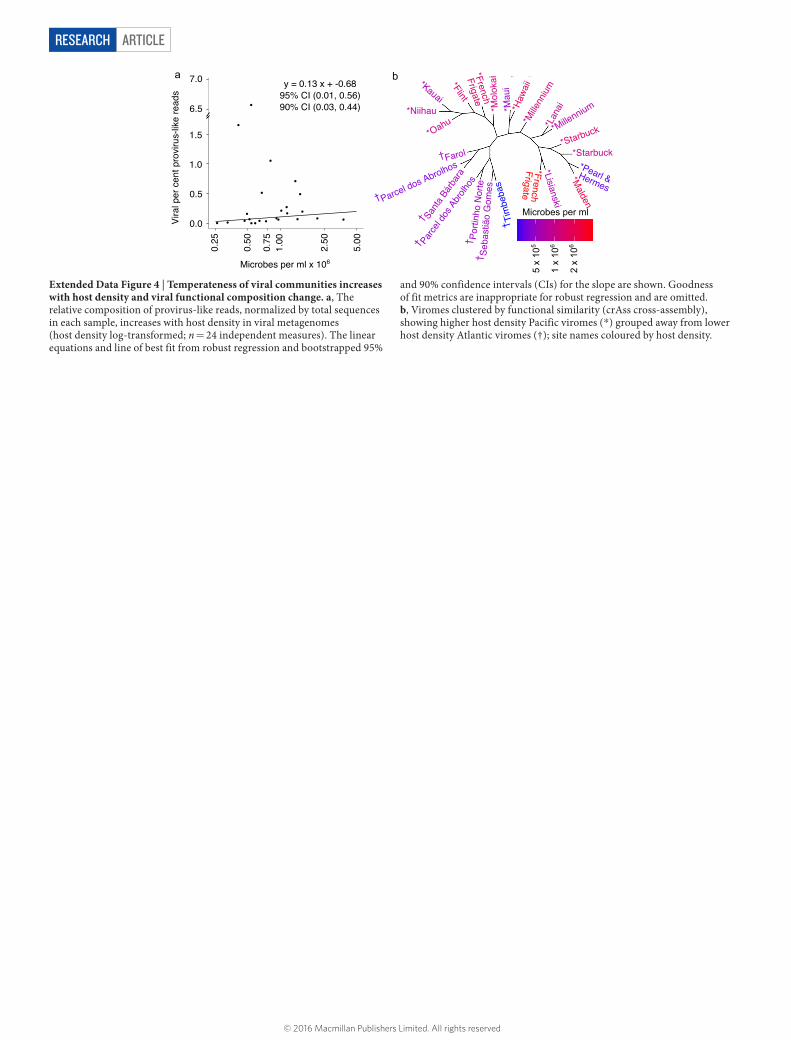
Extended Data Figure 4 | Temperateness of viral communities increases with host density and viral functional composition change. a, The relative composition of provirus-like reads, normalized by total sequences in each sample, increases with host density in viral metagenomes (host density log-transformed; n = 24 independent measures). The linear equations and line of best fit from robust regression and bootstrapped 95%
and 90% confidence intervals (CIs) for the slope are shown. Goodness of fit metrics are inappropriate for robust regression and are omitted. b, Viromes clustered by functional similarity (crAss cross-assembly), showing higher host density Pacific viromes (*) grouped away from lower host density Atlantic viromes (†); site names coloured by host density.
© 2016 Macmillan Publishers Limited. All rights reserved
ARTICLE RESEARCH
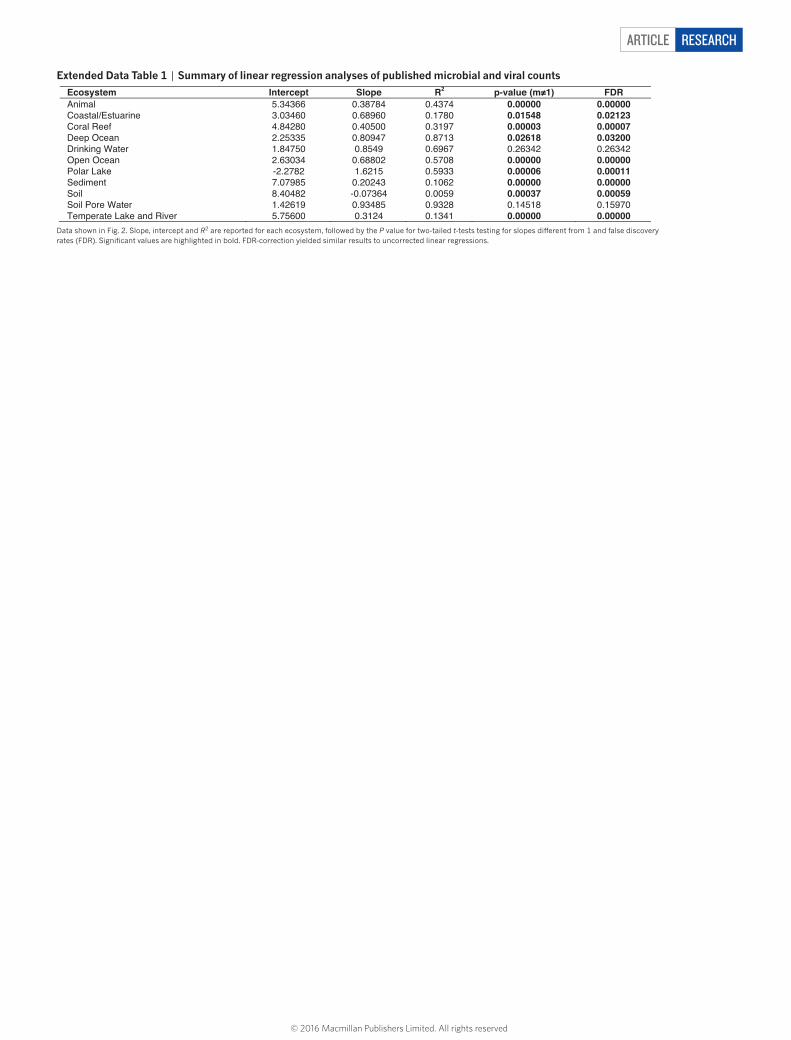
Extended Data Table 1 | Summary of linear regression analyses of published microbial and viral counts
Data shown in Fig. 2. Slope, intercept and R2 are reported for each ecosystem, followed by the P value for two-tailed t-tests testing for slopes different from 1 and false discovery rates (FDR). Significant values are highlighted in bold. FDR-correction yielded similar results to uncorrected linear regressions.
© 2016 Macmillan Publishers Limited. All rights reserved
ARTICLERESEARCH
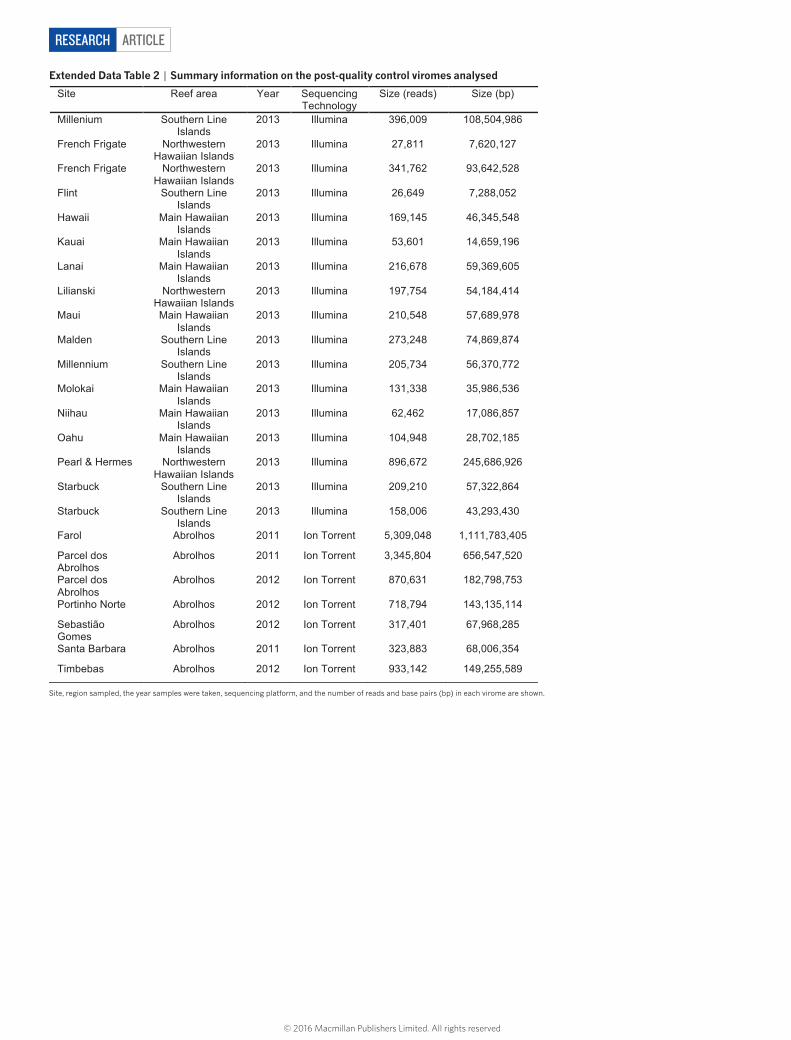
Extended Data Table 2 | Summary information on the post-quality control viromes analysed
Site, region sampled, the year samples were taken, sequencing platform, and the number of reads and base pairs (bp) in each virome are shown.
© 2016 Macmillan Publishers Limited. All rights reserved

ARTICLE RESEARCH
Extended Data Table 3 | Summary of model II OLS, MA, and SMA regression analyses
The first column indicates the variables tested and the corresponding figures in the main text. Slopes, intercepts, confidence intervals and P values are shown. Rows with confidence intervals not covering 1 for Figs 1a and 2, or not covering 0 for Figs 1c, d, and 4, are significant.
© 2016 Macmillan Publishers Limited. All rights reserved