lunar roving vehicle - nasahistory.nasa.gov/alsj/19740003321_1974003321.pdf · lunar roving vehicle...
TRANSCRIPT

NASA TECHNICAL NOTE NASA TN 0-7469 -
o* *o
LUNAR ROVING VEHICLE NAVIGATION SYSTEM PERFORMANCE REVIEW
by Eurnest C. Smith und William C. Mustin
George C. Marshall Spuce Flight Center Murshull Space Flight Center, Ala. 35812
N A T I O N A L AERONAUTICS A N D SPACE A D M I N I S T R A T I O N W A S H I N G T O N , D. C. 0 NOVEMBER 1973

PERFORMlNG ORGANIZATION CODE
George C. Marshall Space Flight Center Marshall Space Flight Center, Alabama 358 12 I 11. CONTRACT OR GRANT NO.
13. TYPE OF REPORS' & PERIOD COVEREI
Technical Note 12. SPONSORING AGENCY NAME AND ADDRESS
National Aeronautics and Space Administration Washington, D.C. 20546
1.3. SPONSORING AGENCY CODE
I
15. SUPPLEMENTARY NOTES
Prepared by Astrionics Laboratory, Science and Engineering
16. ABSTRACT
The design and operation of the Lunar Roving Vehicle (LRV) navigation system are briefly described. The basis for the premission LRV navigation error analysis is explained and an example included. The real-time mission support operations philosophy is presented. The LRV navigation sys- tem operation and accuracy during the lunar missions are evaluated.
17. KEY WORDS
Navigation Lunar Dead Reckoning Sortie Performance
19. SECURITY CLASSIF. (of this rePat) 20. SECURITY CLA! Domestic, $3.50
61 Foreign, $6.00 Unclassified Unclassified
MSFC - Form 3 2 9 2 (Rev December 1 9 7 2 ) For sale by National Technical Information Service, Springfield, Virginia 221 51
18. DISTRIBUTION STATEMENT
121. NO. OF PAGES 122. PRICE IF. (of this page)
J

TABLE OF CONTENTS
Page
SUMMARY . . . . . . . . . . . . . . . . . . . . . . . . . . . . . 1
INTRODUCTION . . . . . . . . . . . . . . . . . . . . . . . . . 1
SYSTEM DESCRIPTION . . . . . . . . . . . . . . . . . . . . . . 1 Requirements and Specifications . . . . . . . . . . . . . . . . 1
2 Component Description . . . . . . . . . . . . . . . . . . . . System Operation . . . . . . . . . . . . . . . . . . . . . . 6 Field Test . . . . . . . . . . . . . . . . . . . . . . . . . 13
PREFLIGHT SYSTEM ERROR ANALYSIS . . . . . . . . . . . . . . . 16
REAL-TIME OPERATIONS SUPPORT . . . . . . . . . . . . . . . . . 16
POSTFLIGHT EVALUATIONS . . . . . . . . . . . . . . . . . . . . 19
APOLLO 1 5 LRV NAVIGATION SYSTEM EVALUATION . . . . . . . . . 19
APOLLO 16 LRV NAVIGATION SYSTEM EVALUATION . . . . . . . . . 28 . . . . . . . . . . . . . . . . . . . . . . . . . 28 Traverse I . . . . . . . . . . . . . . . . . . . . . . . . . 28 Traverse I1
Traverse I11 . . . . . . . . . . . . . . . . . . . . . . . . . 29 Evaluation . . . . . . . . . . . . . . . . . . . . . . . . . 29
APOLLO 1 7 LRV NAVIGATION SYSTEM EVALUATION . . . . . . . . . 41 Traverse I . . . . . . . . . . . . . . . . . . . . . . . . . 41 Traverse I1 . . . . . . . . . . . . . . . . . . . . . . . . . 41 Traverse I11 . . . . . . . . . . . . . . . . . . . . . . . . . 41 Evaluation . . . . . . . . . . . . . . . . . . . . . . . . . 41
CONCLUSION . . . . . . . . . . . . . . . . . . . . . . . . . . 53
REFERENCES . . . . . . . . . . . . . . . . . . . . . . . . . . 5 5
iii
a

LIST OF ILLUSTRATIONS
Figure
1 .
2 .
3 .
4 .
5 .
6 .
7 .
8 .
9 .
10 .
11 .
12 .
13 .
14 .
15 .
16 .
17 .
18 .
19 .
20 .
Title
Navigation system block diagram . . . . . . . . .
Page
. . . . . 4
Outline drawing for directional gyro . . . . . . . . . . . . . . 5
Display electronics . . . . . . . . . . . . . . . . . . . . . 6
Outline drawing for signal processing unit . . .
Analog functions . SPU . . . . . . . . . .
Digital functions . SPU . . . . . . . . . .
Range error versus distance . . . . . . . . .
Bearing error versus distance . . . . . . . .
Position error versus map distance . . . . . .
TV display for real-time LRV heading alignment
TV display for real-time traverse analysis
Apollo 15, Traverse I plot
Apollo 15, Traverse I1 plot . . . . . . . . .
Apollo 15. Traverse I11 plot
Apollo 16. Traverse I plot
Apollo 16. Traverse I1 plot . . . . . . . . .
. . .
. . . . . . . . .
. . . . . . . .
. . . . . . . . .
. . . . . . . . . 7
. . . . . . . . . 9
. . . . . . . . . 11
. . . . . . . . . 14
. . . . . . . . . 15
. . . . . . . . . 18
. . . . . . . . . 19
. . . . . . . . . 19
. . . . . . . . . 25
. . . . . . . . . 26
. . . . . . . . . 27
. . . . . . . . . 38
. . . . . . . . . 39
Apollo 16. Traverse I11 plot . . . . . . . . . . . . . . . . . 40
Apollo 17. Traverse I plot . . . . . . . . . . . . . . . . . . 50
Apollo 17. Traverse I1 plot . . . . . . . . . . . . . . . . . . 5 1
Apollo 17. Traverse I11 plot . . . . . . . . . . . . . . . . . 52
iv
a

LIST OF TABLES
Table Title Page
1 .
2 .
3 .
4 .
5 .
6 .
7 .
8 .
9 .
10 .
11 .
12 .
13 .
14 .
15 .
16 .
17 .
18 .
LRV Navigation System Requirements . . . . . . . . . . . . . 3
Traverse Position Errors . . . . . . . . . . . . . . . . . . . 17
Apollo 15 LRV Navigation System Performance . . . . . . . . . 20
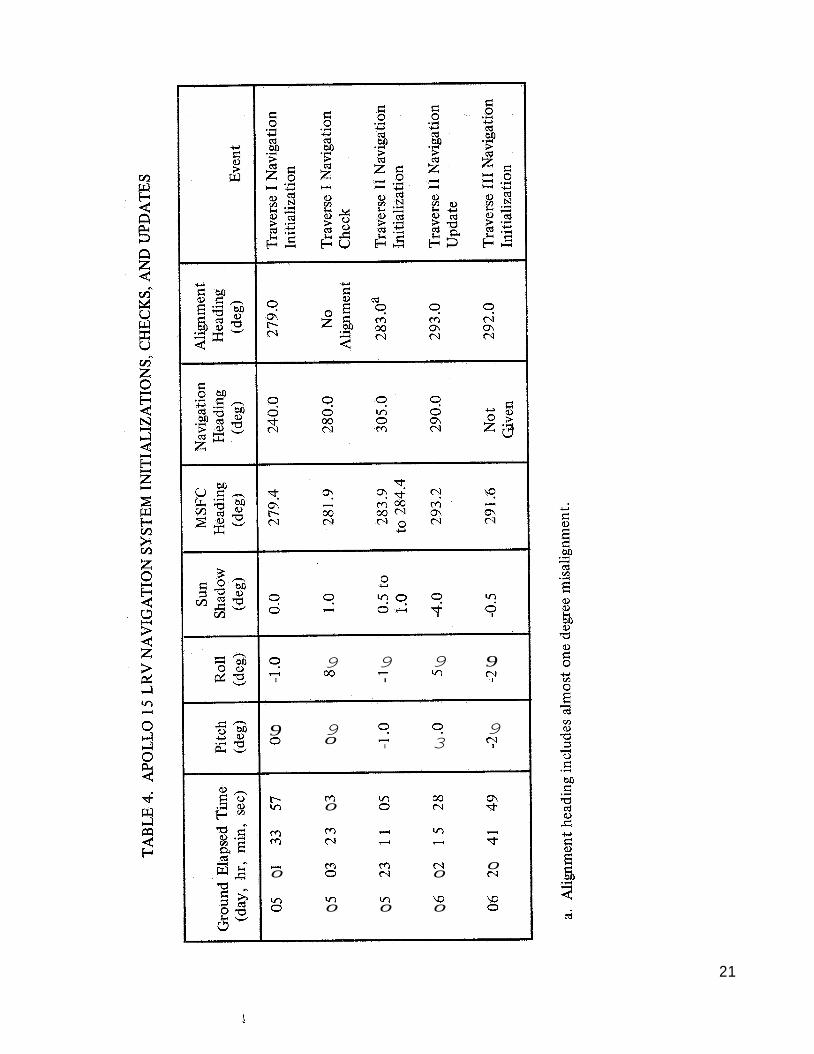
Apollo 15 LRV Navigation System Initializations. Checks. and Updates . 2 1
Apollo 15. Traverse I Bearing and Range Readouts . . . . . . . . 22
Apollo 15. Traverse I1 Bearing and Range Readouts . . . . . . . . 23
Apollo 15. Traverse I11 Bearing and Range Readouts . . . . . . . 24
Apollo 16 LRV Navigation System Performance . . . . . . . . . 30
Apollo 16 LRV Navigation System Initializations. Checks and Updates . 3 1
Apollo 16. Traverse I Bearing and Range Readouts . . . . . . . . 32
Apollo 16. Traverse I1 Bearing and Range Readouts . . . . . . . . 34
Apollo 16. Traverse 111 Bearing and Range Readouts . . . . . . . 36
Apollo 17 LRV Navigation System Performance . . . . . . . . . 42
Apollo 17 LRV Navigation System Initializations. Checks. and Updates . 43
Apollo 17. Traverse I Bearing and Range Readouts . . . . . . . . 44
Apollo 17. Traverse I1 Bearing and Range Readouts . . . . . . . . 45
Apollo 17. Traverse I11 Bearing and Range Readouts . . . . . . . 48 . 3
Apollo 15. 16. and 17 LRV Navigation System Performance Summary . . . . . . . . . . . . . . . . . . . . . . . . . 54

LUNAR ROVING VEHICLE NAVIGATION SYSTEM PERFORMANCE REVIEW
SUMMARY
The Lunar Roving Vehicle (LRV) navigation system consists of a directional gyro, a set of incremental odometers, and a hybrid analog-digital signal processor plus appropriate controls and readouts. The system was tested in the laboratory and in the field and found to be adequate. It performed successfully on the lunar surface during Apollo Missions 15, 16, and 17, operating well within specifications.
INTRODUCTION
The reliable performance of the LRV navigation system justified the dissemination of a description and review of operational characteristics for possible application to other projects. The selection of the type system used was a result of several years of study and investigation. Approaches studied covered the range from simple direction finders to sophisticated systems using satellite navigation aids. The system selected had to meet the requirements of accuracy, simplicity, reliability, ruggedness, light weight, and low power consumption. Added requirements were minimum crew time needed for operation, retention of navigation readouts with power loss, and capability of fabrication using existing technology.
The system chosen by MSFC to best fit these requirements was one consisting of a directional gyro, four odometers, a hybrid signal processor, and vehicle attitude, position, and speed indicating devices. Gyro heading initialization was accomplished by means of an extremely simple sun shadow device and vehicle attitude indicators. A prototype system [ 11 containing the essentials for evaluating operation was designed and fabricated in the Astrionics Laboratory at Marshall Space Flight Center (MSFC). Tests at MSFC and at Flagstaff, Arizona, [2] proved that a system of this type would meet the requirements of the Apollo missions. Error analyses and computer simulations carried on simultaneously with the hardware work led to the same conclusions.
SYSTEM DESCRIPTION
Requirements and Specifications [3]
The functions of the navigation system were to provide to the LRV crew the information necessary to return by the shortest route to the Lunar Module (LM), determine total distance traveled, determine vehicle speed, and navigate to a predetermined site. To

perform these functions, it was required that the system provide the capability for the crew to align the directional gyro unit (DGU) to lunar north to a display resolution of +1 deg using externally supplied ephemeris data, to display vehicle heading relative to lunar north, to utilize odometer pulses from four wheels to determine and display total distance traveled and vehicle speed, and to operate upon the DGU output and odometer pulses to determine and display range to the LM and bearing to the LM with respect to lunar north. It was required that the system be capable of operating from 0 to +45 deg in combined pitch and roll, at all yaw attitudes, and with steering rate inputs not in excess of 50 deg per second.
The system requirements are listed in Table 1. The thermal ranges for system components are:
Operating Nonoperating
Directional Gyro Unit
Signal Processing Unit
Display Electronics
-54°C to +71"C -62°C to +93"C (-65°F to +160"F) (-80" F to +200"F)
+I 0°C to +54"C (+50"F to +130"F)
-54°C to +185"C (-65°F to +185"F)
-32°C to +54"C (-25" F to +130"F)
-54°C to +85"C (-65°F to +185"F)
Vibration and acceleration ranges will not be listed here because of their length but may be found in the referenced document.
Component Description
A block diagram of the navigation system may be seen in Figure 1. The batteries and wheel pulse generators are not considered as part of the system proper, but provide indispensable inputs to it. The DGU is a Lear Seigler, Model 9010, two-degree-of-freedom gyro. It weighs 2.4 kg (5.5 lb) and has the dimensions shown in Figure 2. Power required is 1 15 V rms, single phase, 400 Hz, with consumption approximately 30 watts when starting and 15 watts when running. Direction information is provided by a synchro transmitter with a three-wire output. Drift was required to be less than 5 deg per hour under laboratory conditions, and less than 10 deg per hour during lunar operation.
The integrated position indicator (IPI) is manufactured by Abrams Instrument Corporation and is shown on the left portion of the display electronics, Figure 3. The heading indicator portion of the IPI consists of a compass rose with 2-deg divisions driven by an analog synchro follower excited from the synchro transmitter in the DGU. The bearing, distance, and range indicators are pulse driven up-down counters controlled by the
2

TABLE 1. LRV NAVIGATION SYSTEM REQUIREMENTS
Data Displayed
Headin$
Bearing to LM
Range to LM
Total Distance Traveled
Velocity
Roll Attitude
Pitch Attitudeb
Sun Shadow Device
System 3a Accuracy
+4.5 deg
k4.6 deg
+420 m at 5 km
+1%
+ 1.5 km/hr
+2 degrss
+3 deg rss
+2 deg rss
Display Range
0 - 360 deg
0 - 360 deg
0 - 3 0 k m
0-99km
0 - 19 km/hr
+25 deg
+25 deg
rt15 deg
Display Resolution
1 deg
1 deg
0.1 km
0.1 km
1 km/hr
+1 deg
+3 deg
+1 deg
Vehicle Accuracy
+6 deg
+600 m at 5 km
+2%
a. Marked in 2-deg increments. b. Marked in 5-deg increments.
signal processing unit (SPU). The IPI weight is nominally 1.25 kg (2.7 lb), has front dimensions 9.65 cm (3.8 in.) by 9.65 cm (3.8 in.), and is 13.34 cm (5.25 in.) deep. Power required by the IPI consists of 1 15 V rms, single phase, 400 Hz (1 0.0 V-A when slewing, 2.0 V-A static) for the heading indicator, and 28 Vdc for the counters.
The SPU has the dimension shown in Figure 4 and weighs 5.33 kg (1 1.75 lb). The flight units were designed and produced by The Boeing Company. The SPU selects the distance increment detected by the third fastest wheel and resolves this increment into northings and eastings (in meters) using the heading input from the DGU synchro transmitter. These resolved increments are accumulated to yield Cartesian coordinates of the vehicle position with respect to the starting point. A Cartesian to polar coordinate transformation is then effected which produces the range and bearing of the vehicle with respect to its starting point. The voltage input to the SPU is 36 +4 Vdc and power used is approximately 90 watts for the first 3 min after atarting and approximately 40 watts thereafter. This includes the power required by the DGU and the IPI, as the voltages required for their operation are derived from the 36 Vdc in the SPU.
3

I
I I I I I I I I I I I I I I I
1 W A
- I)-- -
-
I I
-1 I I I I I I I I I I I I I I I
% s 0 E Q) c.'
5

14.61 cm M A X
11.43 cn
MA^ -
14.73 cm MAX I
I 11.43 em
M A X ,~~
I
--I-- -
I I I I I 1 I t I
I ' I I I 1 , : ! j '
t 4.09 cm
P k O . 6 4 c m MAX
CONNECTOR \ \ E \ A R I Z I N G
Figure 2. Outline drawing for directional gyro.
The attitude indicator is hinged to left side of the display electronics (Fig. 3). It is a one-axis, pendulous device which indicates vehicle roll when in the position shown and pitch when folded back against the side of the panel.

Figure 3. Display electronics.
The sun shadow device (SSD) is located in the center of the display electronics panel (Fig. 3). It is hinged at the top and has a needle at the free end which fits into the front panel when in the stowed position. In operation, the vehicle is parked down-sun and the SSD is rotated about the hinge line until the shadow of the needle falls across the scale. The deviation of the vehicle heading from the sun’s azimuth plus 180 deg is then read directly from the scale at that point.
The speed indicator is a 200-pamp meter scaled to read in kilometers per hour.
System Operation E41
To begin operation, the vehicle is parked down-sun and the SSD and roll and pitch angles are read. The vehicle heading with respect to lunar north is then determined by the following equation :
vehicle heading, a = (sun azimuth * 180 deg) - (*SSD) + (roll correction)
+ (pitch correction)
The roll and pitch corrections are required because of the geometry of the SSD. They are determined by the following equations:
Y sin P roll correction (deg) = - 0.065
6
a

IT Isd f X
9
7

where p is the roll angle (+ for right side up), y = 3.36 sinq , and q is the sun elevation;
pitch correction (deg) = SSD deg [ 1 - 0.88 (q - 26 deg) + 0.46 sinp]
where p is the pitch angle (+ for nose down) and q is the sun elevation.
The sun’s azimuth and elevation are obtained from the ephemeris. During lunar operation the astronauts read the SSD and attitude angles and reported them to the ground where the true heading was then obtained in a very short time from a computer. The DGU can be torqued to the true heading 3 min after power is applied to the navigation system. The reset switch is then activated momentarily to reset all internal registers and the range, distance, and bearing indicators to zero. The system is then ready for operation.
The analog functions of the SPU are shown in Figure 5. The heading information from the DGU synchro output is available on three wires as
S, = AEr sin a
S2 = AEr sin (a + 120 deg)
S3 = AEr sin (a + 240 deg) 7
where E, is the single phase, 400 Hz synchro excitation voltage and a is the heading angle. The Scott “T” function is accomplished by applying the AEr sin a signal to an operational amplifier with a gain of one. To a second operational amplifier input is applied - (S, + S2>,
1 2
and the feadback resistor is selected such that the output is
= 1.164AE 1 + cos a sin 120 deg
= AE, cos (11
8

,/I: 4
a
r“’
u w K
I
9

S3 is grounded through a resistor for balanced synchro loading. Thus, the three-wire synchro information is converted to the sine and cosine of the heading angle. These signals are then demodulated and filtered so that dc levels result. They are converted to digital quantities on command from the digital programmer using sample-hold circuits, an analog duplex switch, and a ramp and counter analog-to-digital converter. The pulses from the right rear wheel are filtered and the resulting dc current drives a meter to indicate speed. There is nine-pulse-per-wheel resolution, each pulse representing a distance traveled of 0.245 m. The pulse repetition rate is thus directly proportional to vehicle speed.
The digital functions of the SPU (Fig. 6) are to process the digitized sine and cosine of heading and the wheel pulses to indicate range and bearing to the LM and total distance traveled. The wheel selection logic contains four channels of divide-by-3 counters to yield a A S (distance increment) of 0.735 m. This increment is signaled when the third fastest wheel has produced three pulses, the logic is reset, and the counting starts again. The slowest wheel must then produce an extra pulse before its count continues. This is done so that a disabled or dragging wheel will not stop operation and so that a spinning wheel will not cause erroneous distance calculations.
The A S pulses are counted by a divide-by-136 counter to convert them to a resolution of approximately 0.1 km. The output of this counter then drives the distance indicator. The counter output pulse weight is actually 99.96 m, giving a -0.04 percent error in the conversion.
The A S pulse from the wheel selection logic also initiates the process of converting the cosine a and sine a voltages to digital form, accumulating them and performing the vectoring operation. The process of accumulating the values of the sine and cosine of the heading angle at distance-traveled increments is equivalent to the multiplication
north increment = A S cos a
east increment = A S sin a
and the addition
north coordinate = A S cos a
east coordinate = A S sin a
These Cartesian coordinates are stored in the north and east registers shown in Figure 6.
10

r-- --- -- I
I
t
n I
1 I
I " Q I
I
- !
11
i
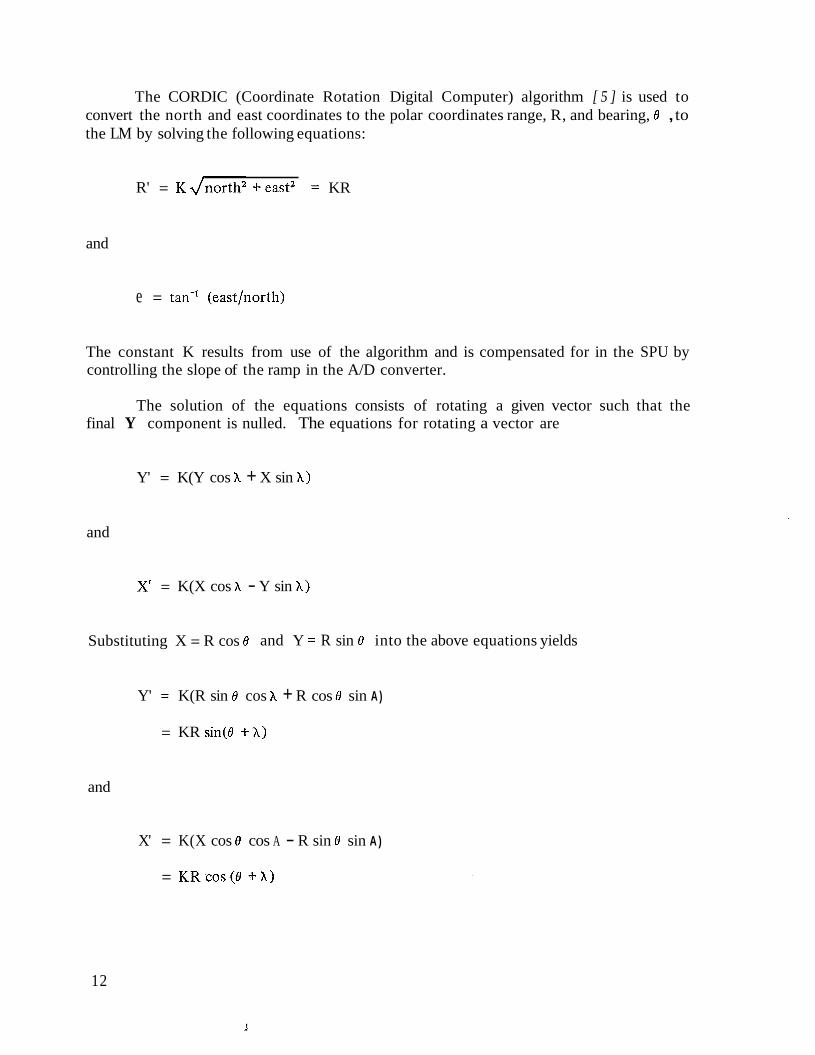
The CORDIC (Coordinate Rotation Digital Computer) algorithm [ 5 ] is used to convert the north and east coordinates to the polar coordinates range, R, and bearing, 0 , to the LM by solving the following equations:
R' = KJnorth2 +eastZ = KR
and
e = tan-' (east/north)
The constant K results from use of the algorithm and is compensated for in the SPU by controlling the slope of the ramp in the A/D converter.
The solution of the equations consists of rotating a given vector such that the final Y component is nulled. The equations for rotating a vector are
Y' = K(Y cos X + X sin A)
and
X' = K(X cos h - Y sin A )
Substituting X = R cos 0 and Y = R sin 0 into the above equations yields
Y' = K(R sin 0 cos h + R cos 0 sin A )
= KR sin(0 + A )
and
X' = K(X cos 0 cos A - R sin 0 sin A )
= K R C O S ( ~ + A )
12

Letting X = - e ,
Y’ = 0
and
X’ = KR
The SPU performs a series of successively smaller rotations through fixed angles, chosen so as to be easily implemented digitally, until the Y register is nulled. The X register then contains the range. The sum of the angular rotations, properly scaled, is the bearing angle. At the end of each update period, the new computed quantities ?re compared to the quantities in image registers. Where required, the range and bearing indicators are updated and the image registers are filled with the new numbers.
Field Test 161
The navigation system underwent extensive tests and evaluations during design and manufacturing acceptance and environmental testing. It was felt that additional testing under field conditions with vehicle motion and variable wheel slip would add to confidence in its proper operation.
The system was mounted in a Travelall which had magnets fixed to the wheels to activate switches. The signals from these switches satisfactorily simulated the wheel pulses from the LRV wheels.
The test site was the Merrium Crater area near Flagstaff, Arizona. Maps and surveying and communications support were provided by the United States Geological Survey Facility there. The range and bearing of checkpoints with respect to a starting point (“LM Site”) were thus accurately determined so that a meaningful evaluation of the navigation system could be made.
Gyro heading initializations and updates were accomplished using a sun shadow device and an ephemeris printout. The earth’s rotation compensation was provided by applying a constant voltage to the gyro torquer.
Five sorties of 17.6 km, one of 19.7 km, and one of 20.0 km were made. The range and bearing errors as a function of distance traveled are shown in Figures 7 and 8. It can be seen that these errors are well within specifications.
13
d

14
a, M c 2
d

15

PREFLIGHT SYSTEM ERROR ANALYSIS
Prior to each mission, a system error analysis was performed with simulated inputs. These simulations provided data on the amount of position error to be expected from the system as a function of gyro drift and gyro misalignment correction frequency. The analyses were based on mission Traverse Data Packages supplied by NASA-Johnson Space Center (JSC). The data packages contained the following information:
Elevation Profile
Segment Azimuth
Slope (Cross Azimuth)
Lurain Type
Timeline
Operational parameters used in the analysis are listed below:
Constant Velocity : 8 .O km/hr
Wheel Slip: 1.85 percent
Yaw Misalignment: k3.0 deg
Yaw Drift Rate: k 1 .O deg/hr and k5.0 deg/hr
Wander Factor: 1.1
Examples of position error results from some of the Traverse Data Packages are given in Table 2 and illustrated in Figure 9.
REAL-TIME OPERATIONS SUPPORT
Operational support in real-time consisted of computing the LRV heading for azimuth initialization and update of performing traverse analyses with the information relayed to earth by the astronauts. Alignment of the LRV navigation system was accomplished by first having the crew measure the vehicle pitch and roll using the attitude indicator, and the orientation with respect to the sun using the sun shadow device. This information was relayed to the ground where, using it and the sun’s azimuth and elevation obtained from the ephemeric table as input data, the vehicle’s heading with respect to lunar north was calculated.
16
a

n
E 2 2 i3
E E
W
0
n
W
.H 5 X
$3
3
17

500.
400.
300.
200.
100.
0.
STA 11 (UPDATE)
1 5.0°/hr DRIFT RATE 3.0" MISALIGNMENT
l.OO/hr DRIFT RATE 3.0' MISALIGNMENT LM
I
0.0 1.0 2.0 3.0 4.0 5.0 6.0 7.0 8.0 9.0 10.0 11.0 12.0 13.0
MAP DISTANCE TRAVELED (km)
Figure 9. Position error versus map distance.
To illustrate this operation, assume the data available were those shown below:
Crew Readout
SSD: 3 deg left (-3 deg)
Pitch: 6 deg down (-6 deg)
Roll: 6 deg right (+6 deg)
Time
Year, Month, Day, Hour, Minute, Second
Ephemeris Table (Landing Site, Time)
Sun Azimuth: 87 deg (A deg = 87 deg)
Sun Elevation: 30 deg (E deg = 30 deg)
These data would be input to the computer and the vehicle heading displayed on a CRT as shown in Figure 10.
The computer was used during the lunar operations because of the importance of speed and accuracy. For other applications, the azimuth initialization could be accomplished using tables prepared for a time and site of operation.
Real-time traverse analysis was done using the computer program. The CRT display for this program is shown in Figure 1 1.
18

LRV HEADING ALIGNMENT
INPUT:
SSD ROLL PITCH ELE AZ
OUTPUT:
NEW HEADING 273.000000
-3.000000 6.000000
30.000000 87.000000
-6.000000
REAL-TIME TRAVERSE ANALYSIS
INPUT: NO. LEGS =
RNAV BNAV HNAV HTRU
RGZ BZ
MIS
OUTPUT:
LEG NO. =
RG B
PT L V W S
POSSIBLE COMBINATIONS COMBINATION OF- REALIGNMENT AT LEGS MAX POSITION ERROR AT PT- WAS - AVERAGE POSITION ERROR IS FINAL POSITION ERROR IS
Figure 10. TV display for real-time Figure 1 1. TV Display for real-time LRV heading alignment. traverse analysis.
POSTFLIGHT EVALUATIONS
The operation of the LRV navigation system was evaluated after each flight. The system readouts and performance parameters were tabulated and the sortie routes as determined from readouts were plotted and compared to positions determined by the lunar geology investigation team.
APOLLO 15 LRV NAVIGATION SYSTEM EVALUATION
The LRV navigation system stayed well within the 600 meter position error specification on all three traverses. Gyro drift, gyro misalignment, case torquing, and wheel slippage were all contributors to position error; however, it is impossible to determine each quantitatively because of insufficient data. It is evident though that all errors were small and that the LRV navigation system performed very well. Data resulting from the evaluation are given in Tables 3 through 7 and Figures 12 through 14.
19
d

TABLE 3. MOLL0 15 LRV NAVIGATION SYSTEM PERFORMANCE
Odometer Distance Map Distancea
Ride Timeb
Park Time Total Time of Traverse Average Velocityc
Mobility Rated
Number of Navigation Checks Number of Navigation Updates Navigation Closure Errore
Maximum Position Error Gyro Drift Rate Gyro Misalignment Percent Wanderf
Traverse I
10.3 km 9.0 km -62 min -74 min -136 min 10.0 km/hr 8.7 km/hr 1 0 <200 m <300 m Little or None Small 14%
Traverse I1
12.5 km 11.7 km -83 min - 154 min -237 min 9.0 km/hr 8.46 km/hr 1 1 <200 m <350 m Little or None Small 7%
Traverse 111
5.1 km g 4.5 km -35 min -82 min -1 17 min 8.7 km/hr 7.54 km/hr 0 0 <200 m <250 m Little or None Small 16%
a. Map distance traveled, neglecting deviations around small craters b. The time spent riding, including minor stops, from departure to arrival at the LM. c. The odometer reading at the end of the traverse divided by the ride time. d. The map distance divided by the ride time. e. The position error in the navigation system at the end of the traverse
f. %wander = x 100%
g. Had the navigation system been initialized at the LM instead of the ALSEP site, the
speed - mobility rate mobility rate
odometer reading would be 5.2 km.
20
9 9 I I c;'
9 9 m 3 9 00 d
9 9 9 I 3 ? .3
9 0
9 0
m rn 00 m d-
P m 0 0 ht
m 4 m 4
m ht d 3 * m
3 m m ht 0 0 0 ht 0 ht
m rn \o \o 0
m 0 0 0 0
21
I

TABLE 5. APOLLO 15, TRAVERSE I BEARING AND RANGE READOUTS
Ground Elapsed Time (day, hr, min, sec)
05 01 33 57
05 01 44 55
05 01 52 54
05 01 57 14
05 02 03 51
05 02 10 33
05 02 29 05
05 02 34 55
05 03 26 02
05 03 33 04
05 03 42 50
05 03 47 08
05 03 49 35
05 03 55 20
05 03 58 15
05 04 00 46
Navigation Bearing (deg)
0
0
39
36
18
11
11
17
17
11
13
18
34
59
Navigation Range
0
0
1100
1700
2300
3200
3200
3900
3900
3300
1600
700
200
100
Event
Navigation System Initialization
Departure from the LM
Arrive at Station 1 (Elbow)
Leave Station 1
Arrive at Station 2
Leave Station 2
Stop Near Rhysling Crater
Start
Arrive at the LM
22

TABLE 6. APOLLO 15, TRAVERSE I1 BEARING AND RANGE READOUTS
Ground Elapsed Time (day, hr, min, see)
05 23 11 05
05 23 11 13
05 23 21 55
05 23 28 21
05 23 35 17
05 23 37 30
05 23 43 01
05 23 43 34
05 23 45 45
05 23 47 40
05 23 49 53
05 23 53 02
06 00 58 29
06 01 01 11
06 01 22 40
06 01 25 46
06 02 16 09
06 02 20 33
06 02 28 59
06 02 45 44
06 02 47 16
06 02 56 09
06 02 59 07
06 03 04 27
06 03 08 32
Navigation Bearing (del31
0
0
339
3 38
348
348
347
347
348
347
346
343
343
347
347
349
349
3 50
347
347
3 50
347
340
352
18
Navigation Range (m)
0
0
1300
2200
3000
3300
3900
4000
4300
4400
4700
5000
5000
5000
5000
4700
4700
4300
3400
3400
3300
2000
1500
700
200
Event
Navigation System Initialization
Departure from the LM
Spur Crater at 3 O’clock
Stop on the Front
Start
Stop on the Front
Start
Stop at Spur Crater
Update and Leave Spur Crater
On Tracks
Arrive at Station 4 (Dune Crater)
Leave Station 4
On Tracks
Arrive at the LM
23

TABLE 7. APOLLO 15, TRAVERSE I11 BEARING AND RANGE READOUTS
Ground Elapsed Time (day, hr, min, sec)
06 20 41 49
06 20 48 28
06 20 49 59
06 20 52 42
06 20 56 15
06 20 59 17
06 21 00 10
06 21 00 44
06 21 01 59
06 21 16 50
06 21 19 26
06 22 14 25
06 22 16 45
06 22 28 49
06 22 45 45
Navigation Bearing (deg)
0
0
110
113
101
89
87
88
88
88
88
88
93
93
32
Navigation Range (deg)
0
0
200
600
1000
1400
1500
1600
1600
1600
1800
1800
2000
2000
0
a. Apollo Lunar Surface Experiment Package
Event
Navigation Initialization at ALSEP~ Site
Departure from the ALSEP Site
Arrive at Scarp Crater
Stop at Scarp Crater
Leave Scarp Crater
Arrive at Station 9
Leave Station 9
Arrive at Station 10
Leave Station 10
Arrive at the LM
24

Fimre 12. Apollo 15, Traverse I plot.
25
f

26
J

Figure 14. Apollo 15, Traverse I11 plot.
27
J

APOLLO 16 LRV NAVIGATION SYSTEM EVALUATION
Traverse I
During Traverse I, the navigation system stayed well within the 100 m position error specification. A navigation system update was not required, and the navigation system closure was 0.0 m.
Traverse II
During Traverse 11, the navigation system operated normally up to Station 9 where the crew changed the power switches configuration. From Station 9 to the end of the traverse there was no change in range, bearing, and distance indications.
There was no telemetry on the LRV so evaluation of the reasons for this lack of navigation system updates had to be done using the crew voice recordings, postflight crew briefings, and a knowledge of the system. The rationale used in explaining this condition follows:
1. There was a switch configuration change at Station 9 to place all loads on Battery 1. From this point to the ALSEP site (Station lo) there was no change in range, bearing, and distance indications.
2. At the ALSEP site the navigation reset was activated and all indicators reset to zero, indicating that power was available at the counters and that they were not mechanically bound.
3. Heading and speed indicators operated normally during the drive from Station 9 to the ALSEP, indicating that power was on in the navigation subsystem, pulses were being received from the RR wheel, the 400 Hz inverter was operating, and the * 16 Vdc power supply was operative.
4. The only failures within the navigation subsystem which would result in the conditions experienced, causing lack of update of both distance, bearing, and range, would be a malfunction in the third-fastest-wheel selection logic or the 5 volt power supply.
5. These symptoms would be caused by the lack of wheel pulses from two wheels.
6. At the beginning of EVA 111, the power switches were returned to the nominal configuration and the navigation system operated normally throughout the entire EVA.
7. This indicates that there was no failure in the navigation subsystem or that it had “fixed” itself, which appears highly unlikely.
28

8. The temperature was higher on EVA I11 than on EVA 11, precluding the possibility that the problem was due to temperature.
9. A temporary power loss to the navigation subsystem results in indicator reset to zero or to “random” numbers, after which further operation adds to or subtracts from these numbers in a normal manner, indicating that power was not removed from the system.
10. Noise into the system might result in incorrect readings, but due to the circuitry and operation of the system would not cause the system to “lock up.”
11. It must be concluded that the failure of the range, distance, and bearing indicators to update was due to lack of wheel pulses from two wheels (excluding the RR wheel, as the speed indicator was working, and its input is pulses from the RR wheel).
12. Wheel pulses would not be received from the two front wheels if drive power was removed from them. It should be noted that, upon arrival at the ALSEP site, the front wheel temperatures were off scale low and the rear wheel temperatures were 99°C (21 0” F).
13. The above statements were corroborated by extensive tests both on the qualification vehicle and on a subsystem breadboard in the laboratory.
14. It was concluded that during the drive power configuration change at Station 9 the front wheels were powered down, thus removing two wheel pulse inputs from the navigation system.
Traverse I I I
At the beginning of Traverse 111, the power switches were returned to the nominal configuration and the navigation system operated normally throughout the entire traverse. The navigation system stayed well within the 100 m position error specification. A navigation system update was not required, and the navigation system closure error was 0.0 m.
Evaluation
The navigation system stayed well within the 100 m position error specification on all three traverses. The navigation system did not require an update during the lunar operation. Gyro drift, gyro misalignment, case torquing, and wheel slippage were all contributors to position error; however, it is impossible to determine each quantitatively because of insufficient data. It is evident, though, that all errors were small and that the LRV navigation system performed very well.
Data resulting from the evaluation are given in Tables 8 through 12 and Figures 15 through 17.
29
a

-- TAB L: 8. AYWLLW 16 LKV N A V l t i A l l U N Y Y S1EM YEKJ?UKM--I’
Odometer Distance Map Distancea
Total Ride Timeb
Ride TimeC
Park Time Total Time of Traverse Average Velocityd
Mobility Ratee
Number of Navigation Checks Number of Navigation Updates Navigation Closure Errorf
Maximum Position Error Gyro Drift Rate Gyro Misalignment Percent Wanderg
Traverse I
4.2 km 3.0 km -49 min -43 min -219 min -268 min 5.87 km/hr 4.17 km/hr 0 0 0 .m 100 m None Small 40%
Traverse I1
11.3 km 9.0 km
- 83 rnin -236 min -319 min 8.19 km/hr 6.52 km/hr 1 0
100 m None Small 26%
*
Lfi
Traverse I11
11.1 km 10.0 km
-73 mhi - 146 min -219 min 9.1 km/hr 8.3 km/hr 0 0 Om 100 m None Small 12%
a. Map distance traveled, neglecting deviations around small craters. b. The time spent riding, including minor stops, Grand Prix Runs, from departure to
arrival at the LM. c. Total ride time minus Grand Prix and minor stops. d. The odometer reading at the end of the traverse divided by the ride time. e. The map distance divided by the ride time. f. The position error in the navigation system at the end of the traverse.
speed - mobility rate mobility rate
g. %wander = x 100%.
30

+ c
W $
co 0 d- \o e \o N c.l N
I
- M 0 0 &s 9 3 m 9 - ?
0
M 00 e 00 d- N 0 0
0 M 0 N 0 N 0 N
m m \o \o 0 0 0 0
31

TABLE 10. APOLLO 16, TRAVERSE I BEARING AND RANGE READOUTS
05 00 46 29
05 00 55 18
05 02 58 32
05 03 00 44
05 03 01 43
05 03 04 00
05 03 05 03
05 03 07 28
05 03 10 33
05 03 11 09
05 03 12 24
05 03 14 08
05 03 18 46
05 03 20 27
05 03 23 15
Navigation Bearing ( d e )
0
0
33
33
65
72
89
91
89
89
88
87
86
87
Navigation Range ( d e )
0.0
0.0
0.1
0.1
0.2
0.3
0.4
0.5
0.7
1 .o
1 .o
1.1
1.2
1.4
Event
Navigation System Initialization
Departure from LM
Arrive at ALSEP
Leave ALSEP (No Drift)
Thought was Spook
Near Halfway
Arrive at Halfway
Leave Halfway

TABLE 10. (Concluded)
Ground Elapsed Time (day, hr, min, sec)
05 03 24 08
05 04 14 32
05 04 19 41
05 04 21 10
05 04 48 07
05 04 54 14
05 04 56 59
05 04 58 03
05 04 58 09
05 04 59 24
05 04 59 57
05 05 02 36
05 05 08 00
05 05 09 43 I
Navigation Bearing ( d e )
88
88
89
87
87
22
Navigation Range (km)
1.4
1.4
0.8
0.8
0.8
0. I
Event
Arrive at Station 1 (Plum)
Leave Station 1
Arrive at Station 2 (Buster and Spook)
Leave Station 2
Arrive at Grand Prix Site
Mark On
Mark Off 1st Grand Prix
2nd Grand Prix Mark On
Mark Off
Leave Grand Prix Site
Arrive at Station 10
Leave Station 10
Arrive at LM
33
i

TABLE 1 1. APOLLO 16, TRAVERSE I1 BEARING AND RANGE READOUTS
Ground Elapsed Time (day, hr, min, sec)
05 23 28 48
05 23 31 40
05 23 32 32
05 23 33 32
05 23 34 18
05 23 37 25
05 23 37 52
05 23 39 02
05 23 39 43
05 23 40 49
05 23 43 04
05 23 44 39
05 23 46 07
05 23 47 52
05 23 49 48
05 23 52 09
05 23 54 25
05 23 55 36
05 23 57 54
05 23 58 59
06 00 00 04
06 00 01 19
Navigation Bearing (deg)
0
0
10
356
350
348
346
348
346
344
347
348
352
355
354
354
355
355
355
354
3 54
355
Navigation Range (km)
0.0
0.0
0.1
0.3
0.3
0.8
0.9
1.0
1.1
1.2
1.5
1.6
1.7
2.0
2.2
2.5
2.8
3 .O
3.3
3.4
3.6
3.7
Event
Navigation System Initialization
Departure from LM
34
a

TABLE 1 1. (Concluded)
Ground Elapsed Time (day, hr, min, sec)
06 00 03 32
06 00 04 09
06 00 07 26
06 01 05 16
06 01 06 58
06 01 10 11
06 01 58 40
06 02 04 21
06 02 07 21
06 02 30 02
06 02 34 04
06 02 35 02
06 02 37 14
06 02 39 12
06 02 40 19
06 03 42 39
06 03 48 15
06 03 50 21
06 03 53 48
06 04 31 20
06 04 54 51
Navigation Bearing (deg)
355
354
3 54
3 54
354
353
353
355
357
357
005
006
007
010
01 1
01 1
01 1
015
007
007
Navigation Range (km)
4 .O
4 .O
4.1
4.1
3.8
3.5
3.5
3.0
3.1
3.1
3 .O
3 .O
3.1
3 .O
2.9
2.9
2.9
2.7
2.6
2 -6
Event
Arrive at Station 4 (Crown)
Leave Station 4
Arrive at Station 5
Leave Station 5
Arrive at Station 6
Leave Station 6
Arrive a Station 8
Right Rear Fender Extension Off
Leave Station 8
Arrive at Station 9
Leave Station 9 (Lost LRV Navigation System)
Arrive at LM
35

TABLE 12. APOLLO 16, TRAVERSE I11 BEARING AND RANGE READOUTS
Ground Elapsed Time (day, hr, min, sec)
06 22 08 52
06 22 09 13
06 22 10 06
06 22 11 51
06 22 14 15
06 22 17 01
06 22 18 57
06 22 20 27
06 22 22 15
06 22 23 35
06 22 26 14
06 22 28 01
06 22 29 04
06 22 32 13
06 22 33 32
06 22 36 26
06 22 39 19
06 22 40 27
06 22 42 56
06 22 45 15
Navigation Bearing (deg)
0
162
180
195
195
189
195
193
195
195
192
192
191
190
186
181
180
179
179
Navigation Range (km)
0.0
0.1
0.1
0.3
0.6
0.9
1.2
1.4
1.7
1.9
2.2
2.6
2.7
3.1
3.4
3.7
4.0
4.1
4.4
4.5
Event
Navigation System Initialization
Departure from LM
Rim of Palmetto
Navigation System Working Super
Arrive at Station 11/12 (North Ray)
36
.l

TABLE 12. (Concluded)
Ground Elapsed Time (day, hr, min, sec)
07 00 09 46
07 00 11 17
07 00 11 43
07 00 16 23
07 00 17 39
07 00 46 33
07 00 47 31
07 00 48 56
07 00 51 45
07 01 00 07
07 01 04 04
07 01 08 04
07 01 09 54
07 01 11 22
07 01 15 38
07 01 48 42
07 01 49 11
07 02 24 57
07 02 27 09
Navigation Bearing (deg)
179
170
183
184
184
186
188
191
192
194
198
198
196
188
188
243
Navigation Range (km)
4.5
4.4
3.8
3.8
3.8
3.7
3.6
3.1
1.9.
1.4
0.9
0.7
0.5
0.1
0.1
0.2
Event
Leave Station 1 1 / 12
17 km/hr on the Moon
Arrive at Station 13
Leave Station 13
Arrive at Station 10 Prime
Leave Station 10 Prime
Arrive at LM
Leave LM
Arrive at Station Rest in in Peace (RIP)
37

Figure 15. Apollo 16, Traverse I plot.
38
a

Figure 16. Apollo 16, Traverse I1 plot.
39
d

Figure 17. Apollo 16, Traverse I11 plot.
40
a

APOLLO 17 LRV NAVIGATION SYSTEM EVALUATION
Traverse I
During Traverse I, the navigation (NAV) system was initialized at the Surface Electrical Properties Experiment (SEP). A navigation system update was not required, and the navigation system closure error at the SEP was 0.0 m. The distance readout was 2.5 km at the end of Traverse I.
Traverse I I
During Traverse 11, the navigation system was initialized at $he SEP. A navigation system check was performed at Station 3. A navigation system update was not required, and the closure at the LM was 200 m. The navigation system was initialized at the SEP, which is approximately 150 m from the LM. Therefore, the closure error was approximately 50 m. The distance readout at the end of Traverse I1 was 20.1 km.
Traverse I 1 I
During Traverse 111, the navigation system was initialized at the SEP. A navigation system update was not required, and the closure at the LM was 100 m. The navigation system was initialized at the SEP, which is approximately 150 m from the LM. Therefore, the closure error was approximately 50 m. The distance readout at the end of Traverse I11 was 12.0 km.
Evaluation
The navigation system position error was 100 m or less during all three traverses. The navigation system did not require an update during the lunar operation. Gyro drift, gyro misalignment, case torquing, and wheel slippage were all contributors to position error; however, it is impossible to determine each quantitatively because of insufficient data. It is evident, though, that all errors were small and that the LRV navigation system performed very well.
Data resulting from the evaluation are given in Tables 13 through 17 and Figures 18 through 20.
41

TABLE 13. APOLLO 17 LRV NAVIGATION SYSTEM PERFORMANCE
Odometer Distance Map Distancea
Ride Timeb
Park Time Navigation System Operation Time' Average Velocityd
Mobility Ratee
Number of Navigation Checks Number of Navigation Updates
Maximum Position Error Gyro Drift Rate Gyro Misalignment Percent Wanderg
Navigation Closure Error f
Traverse I
2.5 km 2.3 km -33 min -33 min
-66 min 4.5 5 km/hr 4.18 km/hr 0 0 Om 1 OOm Small Small 9%
Traverse I1
20.2 km 19.0 km -145 min -176 rnin
-321 min 8.35 km/hr 7.8 5 km/hr 1 0
100 m Small Small 6%
Traverse I11
12.1 km 11.0 km -91 min -195 min
-286 min 7.95 km/hr 7.24 km/hr 0 0
100 m Small Small 10%
a. Map distance traveled, neglecting deviations around small craters. b. The time spent riding, including minor stops, from departure to arrival at the SEP. c. The ride time plus the park time. d. The odometer reading at the end of the traverse divided by the ride time. e. The map distance divided by the ride time. f. The position error in the navigation system at the end of the traverse.
speed - mobility rate mobility rate
g. %wander = x 100%.
42

+.,
5 &
9 m b N
b 00 N
0 3 N 3 b 00 00 m N N N N
9 0
9 0
9 0
9 0
9 Y 3 0
I
9 3
9 d-
9 0
9 0
9 0
9 0
a
d- \o b b In In N 0
I? 00 \o m 0 d- d- m
m 00 3 b N 3 N 3
d- v, v, u3 0 0 0 0
43

TABLE 15. APOLLO 17, TRAVERSE I BEARING AND RANGE READOUTS
44

TABLE 16. APOLLO 17, TRAVERSE I1 BEARING AND RANGE READOUTS
Ground Elapsed Time (day, hr, min, sec)
05 18 45 00
05 18 47 00
05 18 48 56
05 18 51 04
05 19 02 50
05 19 05 30
05 19 09 41
05 19 11 13
05 19 14 34
05 19 19 03
05 19 24 48
05 19 37 58
05 19 43 08
05 19 44 47
05 19 49 53
05 19 52 18
05 19 53 29
05 20 01 08
Navigation Bearing (deg)
265
0
83
83
81
78
80
82
80
83
82
81
81
78
78
77
71
Navigation Range (km)
0.1
0.0
0.5
1 .o 1.4
2.0
2.6
2.6
2.9
3.8
4.3
4.9
5.6
5.7
6.2
6.5
6.6
7.4
Event
Departure from LM
Arrive at SEP
Navigation System Initialization and Alignment
South of the Center of Camelot
Southern Rim of Horatio
North Side of Bronte
45
J

TABLE 16. (Continued)
Ground Elapsed Time (day, hr, min, sec)
05 20 03 00
05 21 07 47
05 21 12 32
05 21 29 45
05 21 46 27
05 21 46 27
05 22 25 54
05 22 31 58
05 22 33 54
05 22 34 08
05 22 34 58
05 22 35 29
05 22 39 02
05 22 40 07
Navigation Bearing (deg)
71
71
71
73
73
79
81
83
87
87
87
87
87
90
93
94
94
94
98
99
Navigation Range (km)
7.6
7.6
7 .O
6.6
6.3
5.7
5.7
5.7
5.9
6.0
6.0
6.0
5.9
5.3
5.2
5.1
5.1
5 .O
4.8
4.7
Event
Arrive at Station 2
Leave Station 2
Arrive at Station 3 (Lara)
Navigation System Alignment Check
Leave Station 3 (Lara)
46

TABLE 16. (Concluded)
Ground Elapsed Time (day, hr, min, sec)
05 22 41 42
05 22 42 57
05 23 16 15
05 23 23 03
05 23 25 54
05 23 29 57
05 23 31 28
05 23 35 5 5
05 23 40 40
05 23 42 43
05 23 45 15
06 00 15 20
06 00 18 08
06 00 23 12
06 00 27 42
06 00 32 24
Navigation Bearing (deg)
101
102
102
102
103
106
106
106
103
99
94
86
86
83
83
82
81
81
89
Navigation Range (km)
4.5
4.4
4.4
3.8
3.4
3.2
3.2
3.1
2.5
2 .o 1.7
1.4
1.4
1.1
0.7
0.5
0.4
0.4
0.2
Event
Arrive at Station 4 (Shorty)
Leave Station 4 (Shorty)
Arrive at Victory
Leave Victory
Arrive at Station 5 (Camelot)
Leave Station 5 (Camelot)
Arrive at Location for Change 8
Leave Location for Change 8
Arrive at LM
47

TABLE 17. APOLLO 17, TRAVERSE I11 BEARING AND RANGE READOUTS
Ground Elapsed Time (day, hr, min, sec)
06 17 33 00
06 17 35 07
06 17 41 22
06 17 46 12
06 17 49 52
06 17 51 24
06 18 11 20
06 19 22 10
06 19 29 05
06 19 51 09
06 19 56 57
06 20 02 35
06 20 05 59
06 20 07 40
06 20 55 33
Navigation Bearing (de&
0
207
188
187
185
184
192
192
193
200
200
210
214
226
227
226
226
228
Navigation Range (km)
0.1
0.0
0.4
0.9
1.1
1.5
2.3
3.1
3.1
3.1
3.3
3.3
3.4
3.4
3 -6
3.9
4.0
4.0
3.4
Event
Departure from LM
Navigation System Alignment
Navigation System Initialization
Arrive at Station 6
Leave Station 6
Arrive at Station 7
Leave Station 7
Arrive at Station 8
Leave Station 8
48

Ground Elapsed Time (day, hr, min, sec)
06 21 05 39
06 21 09 37
06 21 13 10
06 22 09 05
06 22 11 41
06 22 15 00
06 22 17 08
06 22 20 04
06 22 23 02
06 22 23 36
06 22 26 13
06 22 27 30
06 22 28 51
06 22 30 11
06 22 37 47
TABLE 17. (Concluded)
Navigation Bearing (deg)
227
228
230
230
230
230
236
244
250
253
252
250
252
244
252
22 1
151
Navigation Range (km)
3.3
3 .O
2.9
2.5
2.2
2.2
2.1
1.7
1.4
1.1
0.9
0.9
0.6
0.4
0.2
0.2
0. I
Event
East Rim of Cochise
Arrive at Station 9
Leave Station 9
At Mariner
At San Luis Ray
Arrive at LM
J
49

Figure 1 8. Apollo 1 7, Traverse I plot .
50
1

Y 0 a c(
51

Figure 20. Apollo 17, Traverse 111 plot.
52

CONCLUSION
The comparatively simple and economical directional gyro-odometer-processor .iavigation system successfully met the requirements of enabling the astronauts to find desired science sites, return to the lunar module, and return to previously visited sites. It withstood the vibrational environment of launch and the extreme thermal conditions of the lunar surface. A minimum of crew time and effort was required for its operation. The accuracy of the system proved to be much better than specified. Table 18 summarizes the performance during the three Apollo missions.
George C. Marshall Space Flight Center National Aeronautics and Space Administration
Marshall Space Flight Center, Alabama, July 1973
53

TABLE 18. APOLLO 15,16, AND 17 LRVNAVIGATION SYSTEM PERFORMANCE SUMMARY
Odometer Distance Map Distancea
Ride Timeb
Park Time Navigation System Operation TimeC
Average Velocityd
Mobility Ratee
Number of Navigation Checks Number of Navigation Updates Navigation Closure Errorf
Maximum Position Error Gyro Drift Rate Gyro Misalignment Percent Wanderg
Apollo 15
27.9 km 25.2 km - 180 min -310 min
-490 min 9.30 km/hr 8.40 km/hr 2 l h <200 m <300 m <1 deg < I deg 10.71%
Apollo 16
26.6 km 22.8 km - 199 min -601 min
-800 min 8.02 km/hr 6.63 km/hr 1 0 0 < lo0 m <1 deg <1 deg 20.96%
Apollo 17
34.8 km 32.3 km -269 min -304 min
-573 min 7.76 km/hr 7.20 km/hr 1 0 0 < l o 0 m <1 deg <1 deg 7.77%
a. Map distance traveled, neglecting deviations around small craters. b. The time spent riding, including minor stops, from departure to arrival at the end point. c. The ride time plus the park time. d. The odometer reading at the end of the traverse divided by the ride time. e. The map distance divided by the ride time. f. The position error in the navigation system at the end of the traverse.
speed - mobility rate mobility rate
g. %wander = x 100%.
h. Alignment heading includes almost one degree misalignment.
54
J

REFERENCES
1. Walls, B.F.; Mastin, W.C.; and Broussard, P.H., Jr.: Experimental Development Program for Lunar Surface Navigation Equipment. NASA TM X-64509, Apr. 30, 1970.
2. Walls, B.F.; Mastin, W.C.; and Broussard, P.H., Jr.: Laboratory and Field Tests of a Lunar Surface Navigation System. NASA TM X-6455 1 , Aug. 28, 1970.
3. The Boeing Company : Engineering Critical Component Detail Specification for Navigation Subsystem. Report No. EC-209 10003, Prepared Under NASA Contract No. NAS8-25145, Huntsville, Ala., Apr. 6, 1971.
4. Spearow, R.G.; Wahl, D.J.; and Tonkin, M.R.: Design and Test Data for Signal Processing Unit - Lunar Roving Vehicle Navigation Subsystem. Report No. D209-50025, Prepared Under Contract No. NAS8-25 145, The Boeing Company, Huntsville, Ala.
5. Volder, J.E. : The Cordic Trigonometric Computing Technique. IRE Transactions on Electronic Computer, Sept. 1959, pp. 330-334.
6. Duchasneau, B.E.: Field Tests of the Navigation System Equipment Used on the Lunar Roving Vehicle. Report No. T209-10065-1 , Prepared Under Contract No. NAS8-25145, The Boeing Company, Huntsville, Ala., Jan. 4, 1971.
55 NASA-Langley, 1973 - 21