lower gallatin tmdl planning area flow monitoring project ... · lower gallatin tmdl planning area...
TRANSCRIPT
M05TMDL02SAP05 05/06/2010
i
Lower Gallatin TMDL Planning Area Flow Monitoring Project 2009-2010:
Sampling and Analysis Plan
Prepared by: MONTANA DEPARTMENT OF ENVIRONMENTAL QUALITY Watershed Management Section, Water Quality Planning Bureau 1520 East 6th Avenue Helena, MT 59620-0901 Approvals (DEQ) __________________________________ __________________ Pete Schade (TMDL Project Coordinator) Date __________________________________ __________________ Dean Yashan (TMDL Section Supervisor) Date __________________________________ __________________ Mindy McCarthy (Quality Assurance Officer) Date Acknowledgment (Contractor) __________________________________ __________________ Jeff Dunn (PBS&J Watershed Specialist) Date
M05TMDL02SAP05 05/06/2010
ii
Table of Contents Table of Contents................................................................................................................ ii 1.0 Introduction............................................................................................................. 1 2.0 Objectives and Design ............................................................................................ 2 3.0 Field Sampling Methods ......................................................................................... 4
3.1 Flow Rod Installation and Removal ................................................................... 4 3.2 Stream Flow Monitoring..................................................................................... 4 3.3 Data Retrieval ..................................................................................................... 4
4.0 Data Quality Objectives for Measurement Data..................................................... 5 4.1 Precision.............................................................................................................. 5 4.2 Accuracy and Bias .............................................................................................. 5 4.3 Representativeness.............................................................................................. 5 4.4 Completeness ...................................................................................................... 5 4.5 Comparability ..................................................................................................... 5 4.6 Measurement Range............................................................................................ 6
5.0 Data Analysis, Record Keeping, and Reporting ..................................................... 6 6.0 Schedule.................................................................................................................. 8 7.0 Project Team and Responsibilities.......................................................................... 8 Appendix A:........................................................................................................................ 9

Lower Gallatin TMDL Planning Area: Flow-Monitoring SAP
1
1.0 Introduction The following flow monitoring sampling and analysis plan documents activities to be conducted in support of TMDL development in the Lower Gallatin TMDL Planning Area: refer to the Lower Gallatin TMDL Project Plan, DEQ Project ID M05-TMDL-02. Monitoring stream flow is a valuable component of watershed planning efforts. Stream flow data provide information on basin hydrology, and allow evaluation of pollutant loads contributed from the watershed above a monitoring station. Often, gaging stations installed, operated, and maintained by the US Geological Service provide these data; however, cost and limited resources preclude gaging all streams where management activities are underway. Installation of digital stage recorders (trade name TruTrak) combined with periodic flow monitoring, provides an inexpensive alternative to established gaging stations. This report presents a sampling and analysis plan (SAP) to guide stream flow monitoring and associated data collection and management in the Lower Gallatin TMDL Planning Area. The purpose of a SAP is to guide project activities from the inception of the project through to its completion. Sub-components include provisions for maintaining data quality, detailing sampling locations, and identifying responsible parties. Similarly, DEQ document WQPBWQM-007 (Appendix A), Standard Operating Procedure for Digital Stage Recorders provides a practical guide to rod installation and use. **NOTE: WQPBWQM-007 is currently being updated: 2010 data collection will follow the updated version of this document. This project will involve the efforts of several entities:
• The Greater Gallatin Watershed Council (GGWC) is the contracting entity and will administer the Project. The GGWC is a locally led, non-profit watershed group working on water quality issues in the lower Gallatin watershed.
• The Gallatin Water Quality Protection District (GWQPD) provides technical expertise and local technical oversight.
• The Montana DEQ will conduct rod installation, removal and data retrieval for DEQ-owned flow-rods (4)
• PBS&J (contractor) will conduct rod installation, removal, and data retrieval for GWQPD-owned flow-rods (1), will conduct flow measurements calibrations for all 5 rods, and conduct data analysis on flow data.
Lower Gallatin TMDL Planning Area: Flow-Monitoring SAP
2
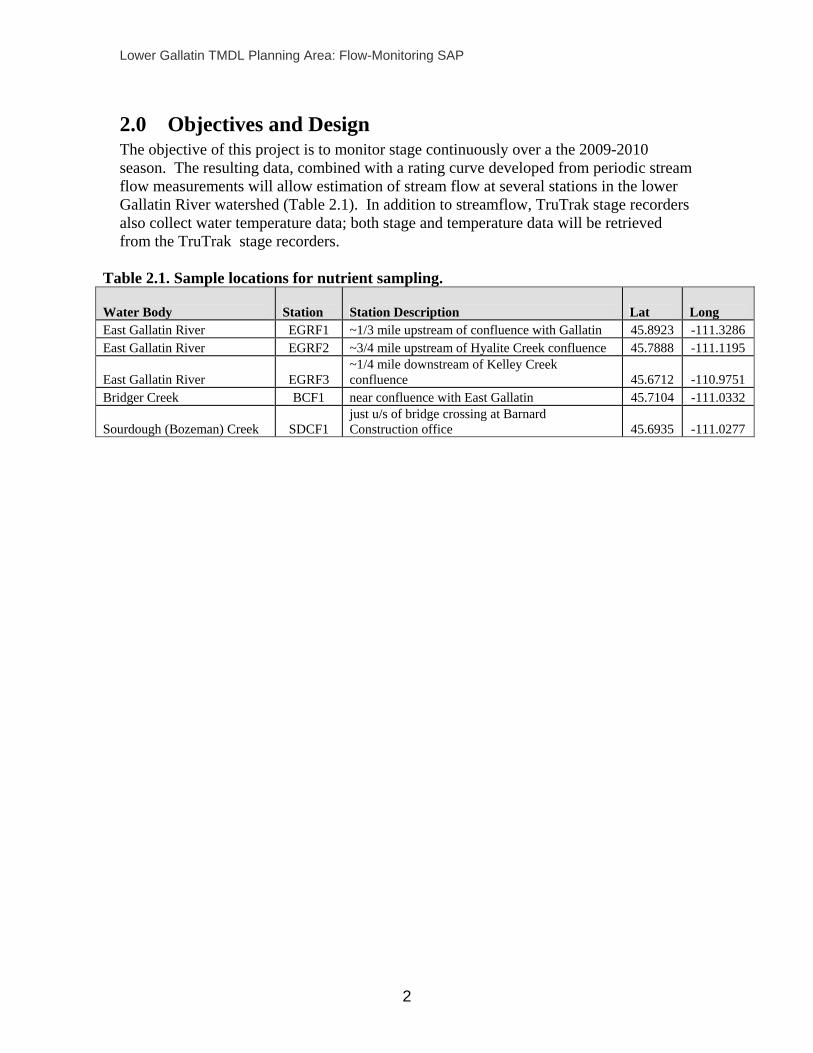
2.0 Objectives and Design The objective of this project is to monitor stage continuously over a the 2009-2010 season. The resulting data, combined with a rating curve developed from periodic stream flow measurements will allow estimation of stream flow at several stations in the lower Gallatin River watershed (Table 2.1). In addition to streamflow, TruTrak stage recorders also collect water temperature data; both stage and temperature data will be retrieved from the TruTrak stage recorders.
Table 2.1. Sample locations for nutrient sampling.
Water Body Station Station Description Lat Long East Gallatin River EGRF1 ~1/3 mile upstream of confluence with Gallatin 45.8923 -111.3286 East Gallatin River EGRF2 ~3/4 mile upstream of Hyalite Creek confluence 45.7888 -111.1195
East Gallatin River EGRF3 ~1/4 mile downstream of Kelley Creek confluence 45.6712 -110.9751
Bridger Creek BCF1 near confluence with East Gallatin 45.7104 -111.0332
Sourdough (Bozeman) Creek SDCF1 just u/s of bridge crossing at Barnard Construction office 45.6935 -111.0277
Lower Gallatin TMDL Planning Area: Flow-Monitoring SAP
3
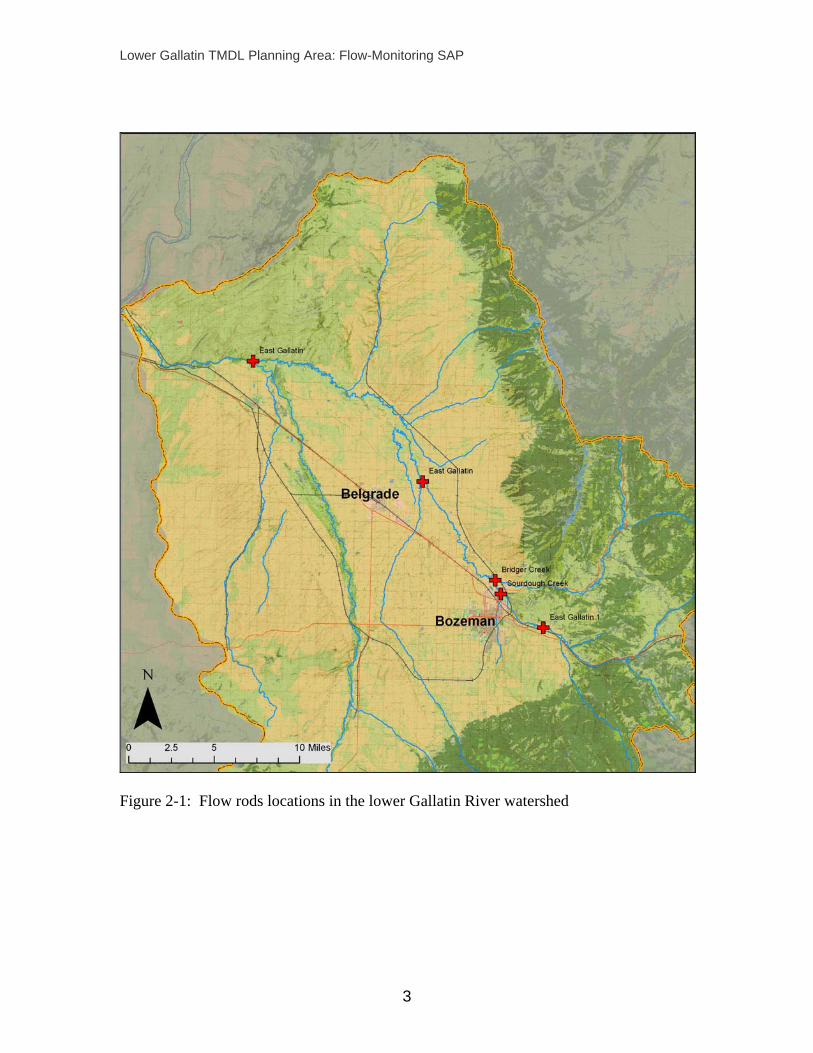
Figure 2-1: Flow rods locations in the lower Gallatin River watershed
Lower Gallatin TMDL Planning Area: Flow-Monitoring SAP
4
3.0 Field Sampling Methods Field methods include provisions relating to installation and use of Flow rods, and periodic measures of stream flow. Appendix A, Standard Operating Procedure for Digital Stage Recorders, provides detailed information on the installation, use and management of flow-rods.
3.1 Flow Rod Installation and Removal A total of five flow-rods will be deployed for this project. DEQ has primary responsibility for installing and removing four flow rods at stations EGRF1, EGRF2, EGRF3, and BCF1. DEQ will also be responsible for retrieving data from these 4 sites and delivering the data to the PBS&J for processing and analysis. DEQ will install the flow rods during early July, 2009&2010 and remove them in October 2009 & 2010. Flow measurements and cross-sections will be conducted during each installation and removal. PBS&J will be responsible for installing and removing the 5th flow rod at station SDCF1 under the same schedule as above. PBS&J will also be responsible for retrieving data from this rod. Flow measurements and cross-sections will be conducted during each installation and removal. The flow rod used at station SDCF1 is owned and maintained by the Gallatin Water Quality Protection District.
3.2 Stream Flow Monitoring Discharge measurements provide the basis of development of a rating curve, which allows correlation of stage with discharge. Establishment of a survey hub or monument (rebar with cap or wooden hub) is an initial step that allows relation of stage to a known datum. This will occur following installation and will allow determination if shifting has occurred between installation and monitoring. PBS&J will conduct all flow-rod calibrations by measuring stream flow at each station on three (3) occasions during the 2009 summer low-flow period and again in 2010 on six (6) occasions (June through September) to capture a range of flows including peak flows, ascending and declining limbs, and base flows. Additional discharge measurements may be taken, if time and resources permit, to create a more precise rating curve. Contractor will use a Marsh McBirney Flow meter to measure stream flow at a surveyed cross section using DEQ’s standard operating procedures (SOPs). Stage will be recorded for each stream flow measurement from a separate staff gage mounted nearby.
3.3 Data Retrieval A laptop computer connected with a communication cable will provide the means for retrieval of stage and temperature data from the Flow rod. At the conclusion of each field season, DEQ or PBS&J personnel will download the data and transfer it to a laptop using OmniLog software. The raw file is solely a backup file and contains the uncalibrated data. File names will follow a convention using a site identifier and the serial number of the Flow rod. Raw data will be imported into a Microsoft Excel spreadsheet for
Lower Gallatin TMDL Planning Area: Flow-Monitoring SAP
5
management and analysis, and delivered to the DEQ TMDL Project Coordinator (Pete Schade).
4.0 Data Quality Objectives for Measurement Data Data quality objectives are the quantitative and qualitative criteria established for data in order to meet the project’s objectives. Categories of data quality objective include precision, accuracy, representativeness, completeness, comparability, and measurement range. This section describes the approach to ensure data collected for this effort meet a high standard for data quality.
4.1 Precision Precision refers to the degree of agreement among repeated measurements of the same characteristic. The strategy to ensure a high level of precision involves several components. The first is selection of equipment with demonstrably high precision as reported in the manufacturer’s specifications for ranges likely to occur in the field. Strict adherence to manufacturer’s instructions and SOPs in calibration and use of meters will also promote precision for these parameters. The second approach addresses the human component, such as inter-observer bias in collecting measurements. In these cases, training and adherence to SOPs provides a means to encourage a high degree of precision.
4.2 Accuracy and Bias Accuracy is a measure of confidence that describes how close a measurement is to its “true value”, which is often unknown. Strict adherence to SOPs, training, oversight by the project Coordinator, and implementation of QA/QC protocols are the primary means of promoting accuracy with respect to inter-observer error. Manufacturer’s specifications provide information on accuracy of field meters when calibrated according to instructions
4.3 Representativeness Representativeness refers to the extent to which measurements actually represent the true environmental condition. Site selection is instrumental in ensuring representativeness. Application of USGS guidelines for site selection for stream flow monitoring sites will promote a high degree of representativeness.
4.4 Completeness Completeness is a measure of the amount of data prescribed for assessment activities and the usable data actually collected, expressed as a percentage. PBS&J will promote completeness by field checking all data sheets for the requisite data and ensuring adherence to the sampling schedule.
4.5 Comparability Comparability is the degree to which data are directly comparable to similar studies. Gaging stream flows with Flow rods is becoming the standard alternative to USGS gage stations in water quality planning efforts across Montana. Agencies employing this approach include DEQ, DNRC, Montana Fish, Wildlife, & Parks, and Natural Resources
Lower Gallatin TMDL Planning Area: Flow-Monitoring SAP
6
and Conservation Service. As a standard method, which incorporates USGS protocols, this method shows considerable comparability to stream gaging efforts throughout the state.
4.6 Measurement Range Measurement range is a data quality objective that applies specifically to instruments or measuring devices employed in assessments. Most manufacturer report the measurement range of their instruments along with other specifications. Measurement ranges of equipment used in flow monitoring are consistent with expected ranges in streams in the project area.
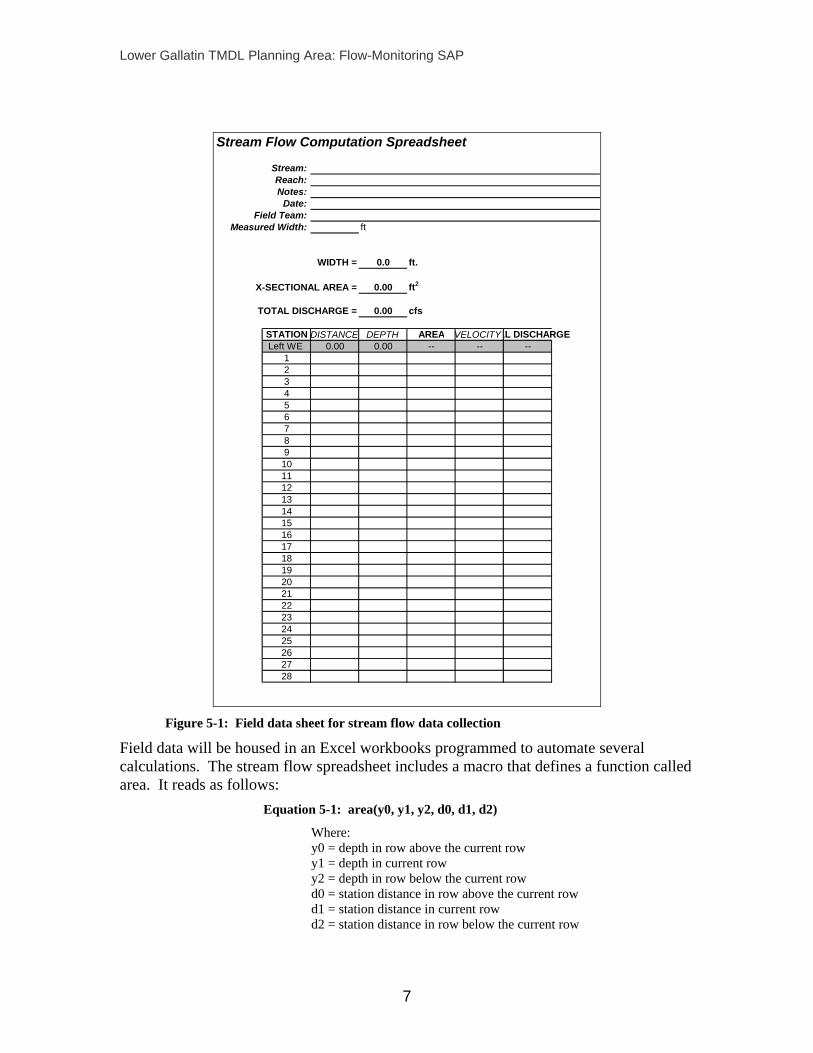
5.0 Data Analysis, Record Keeping, and Reporting Data collected in this effort will include electronic stage and temperature data retrieved from flow rods, stream flow data collected at established cross sections, cross sectional measurements, staff gage heights, and location coordinates collected with a handheld GPS unit. DEQ will use their standard field sheets in collection of cross sectional data and coordinates during installation of Flow rods. Contractor will record flow data and gage heights on sheets developed for this purpose (Figure 5-1). Data analysis will be conducted by PBS&J and includes the development of a rating curve within an Excel workbook/spreadsheet formatted for this purpose. The spreadsheet will quantify a relation between recorded stage from the logger to discharge at each of the monitoring sites. The rating curve will be developed for instantaneous flow measurements during the summer/spring of 2009/2010 and fitted to a power curve function (Q = ahb). Only one curve will be developed for the range of flow conditions due to the limitations on the number of site visits for curve calibration (versus individual curves for low, intermediate, and high flows). Discharge coefficients (a & b) will be fitted using least squares methodology using a statistical software package such as Microsoft Excel or equivalent. All data, spreadsheets, field forms and associated information will be delivered to the TMDL Project Coordinator.
Lower Gallatin TMDL Planning Area: Flow-Monitoring SAP
7
Stream Flow Computation Spreadsheet
Stream:Reach:Notes:
Date:Field Team:
Measured Width: ft
WIDTH = 0.0 ft.
X-SECTIONAL AREA = 0.00 ft2
TOTAL DISCHARGE = 0.00 cfs
STATION DISTANCE DEPTH AREA VELOCITY LL DISCHARGELeft WE 0.00 0.00 -- -- --
12345678910111213141516171819202122232425262728
Figure 5-1: Field data sheet for stream flow data collection
Field data will be housed in an Excel workbooks programmed to automate several calculations. The stream flow spreadsheet includes a macro that defines a function called area. It reads as follows:
Equation 5-1: area(y0, y1, y2, d0, d1, d2)
Where: y0 = depth in row above the current row y1 = depth in current row y2 = depth in row below the current row d0 = station distance in row above the current row d1 = station distance in current row d2 = station distance in row below the current row

Lower Gallatin TMDL Planning Area: Flow-Monitoring SAP
8
6.0 Schedule Stream flow monitoring and associated activities will initiate in late July 2009 and proceed through October 2010. DEQ will install Flow rods in mid July 2009. Flow rods will be removed in October 2009 for the winter and then re-install in June 2010 to capture peak flows in 2010.
7.0 Project Team and Responsibilities This project is a partnership between the Greater Gallatin Watershed Council, Montana Department of Environmental Quality and PBS&J. Personnel involved in this project are presented in Table 7.1. Table 7.1 Project Personnel Roles.
Name Organization Title Sharlyn Izurieta Greater Gallatin Watershed Council Executive Director Pete Schade MT Dept. of Environmental Quality Senior TMDL Planner Gary Ingman PBS&J Project Coordinator Jeff Dunn PBS&J Watershed Specialist Mindy McCarthy MT Dept. of Environmental Quality DEQ QA Officer
Sharlyn Izurieta is the Executive Director for the Greater Gallatin Watershed Council. Sharlyn is responsible for contract oversight and review of project deliverables. Pete Schade is the Senior TMDL Planner for the Lower Gallatin TMDL Planning Area. Pete is responsible for technical project scoping, project oversight and review and acceptance of all project deliverables. Gary Ingman, senior biologist with PBS&J is the Flow Monitoring project manager. The project manager will provide general oversight and coordination to the monitoring project and monitoring activities. Gary will also be responsible for reviewing the monitoring procedures and results to ensure that measurement quality objectives and quality control requirements are met. Jeff Dunn is a Watershed Specialist with PBS&J. Jeff’s responsibilities include field data collection and coordination, and data assessment, analysis and reporting. Jeff will collect all field data and conduct field measurements. Jeff will also develop flow rating curves for all flow-monitoring stations. Mindy McCarthy is the Quality Assurance Officer for the Water Quality Planning Bureau at the Montana Department of Environmental Quality Water Quality. Mindy is responsible for review and approval of Sampling and Analysis Plans associated with this project.
WQPBWQM-007 Rev. Draft Date: -----
Page 9 of 26
9
Appendix A:
Water Quality Planning Bureau
Standard Operating Procedure for Digital Stage Recorders
Prepared by Patrick Lizon, Andy Welch, & Mark Bostrom
Approvals: ___________________________________________________ Chris Shirley, QC Coordinator, WQPB ___________________________________________________ Mark Bostrom, QA Officer, WQPB ___________________________________________________ Rosie Sada de Suplee, Water Quality Monitoring Section Supervisor, WQPB ___________________________________________________ George Mathieus, (former) Bureau Chief, WQPB
WQPBWQM-007 Rev. Draft Date: -----
Page 10 of 26
10
Introduction Digital stage recorders (DSRs) are used by the Montana Water Quality Planning Bureau of the Department of Environmental Quality for approximating the hydrograph at a lotic monitoring site during a period of interest when long-term stream discharge gaging data are unavailable. The data are applied in the development of Total Maximum Daily Loads (TMDLs) where estimates of seasonal fluctuation in stream discharge are necessary in order to determine the capacity of a water body to assimilate pollutants under water quality standards attainment. Consistent procedures for determining stream discharge via DSRs will enhance the accuracy1 of seasonality considerations within the TMDL development process and thus will increase the likelihood of achieving water quality standards attainment through implementation of appropriate controls on flow-dependent pollutants. Much of the information in this SOP regarding the practical use of DSRs has been garnered from the work of Dave Amman, Hydrologist for Montana DNRC as described in his 2004 report entitled “A Practical Guide to Aquarod Installation”. Amman’s report should be consulted for the detailed insights it provides (especially regarding stilling well construction and installation) that are not covered in this SOP. Purpose The purpose of this SOP is to establish procedures that will guide the use of DSRs within water resource protection programs administered by the State of Montana. This SOP is not intended to substitute the respective user manuals published by manufacturers of the digital water level recorders. The discussion of AquaRod® and TruTrack® instruments within this SOP is not intended to be an endorsement of either product. Frequency of Review and Approval The applicability and validity of this SOP will be re-evaluated and updated as necessary one year after its original date of approval and bi-annually thereafter. Scope and Applicability This SOP will be implemented within projects coordinated by the State of Montana where additional stream discharge data is required in order to fulfill water resource protection obligations addressed by the following sections of the Clean Water Act (CWA) and Montana Water Quality Act (MWQA): Common Name CWA Citations (CFR) MWQA Citation (MCA) Water Quality Classification & Standards 40 CFR Part 131 Title 75, Chapter 5, Part 3 Water Quality Assessment 40 CFR Part 130 Title 75, Chapter 5, Part 7
Accordingly, the site selection, installation, maintenance, and data management procedures for AquaRod® and TruTrack® instruments are described in this document in order to achieve a consistent source of reliable data.
1Accuracy is the combination of high precision and low bias.
WQPBWQM-007 Rev. Draft Date: -----
Page 11 of 26
11
Methodological Summary AquaRod® and TruTrack instruments measure and record water stage (along with ancillary temperature data) at a programmed time interval. The recording interval for an AquaRod® ranges from one to thirty minutes; alternatively, an AquaRod® can be programmed to record observations when a pre-selected change in stage occurs. The TruTrack® DSR instrument can log water stage at in one second increments at a rate ranging from once per second to once every ten hours. DSRs are typically deployed within small diameter stilling wells. A stilling well is required for housing the DSR since hydraulic turbulence may introduce error into the digital stage measurement and floating debris has the potential to damage the instrument. Stilling wells may be driven vertically into the channel substrate, or alternatively, the instrumentation may be mounted to a pre-existing structure in the channel (i.e. bridge pillar or abutment). A reference staff gauge needs to be installed on a nearby structure (e.g. bridge pillar) or to the stilling well for collecting manual water level observations; these observations help identify circumstances which may propagate error into the DSR data. Please be aware that attaching a staff gauge to the stilling well is sometimes undesirable since circumstances that impact the stilling well may affect the staff gauge as well (e.g. shifting of the stilling well within the substrate) . Please refer to Rantz et al. (1982a) for information regarding stage measurement using staff gauges and refer to DNRC (2004) for detailed information regarding the construction and installation of the DSR apparatus. At the end of the deployment period, the data is downloaded from the instrument and quality control checks are performed to verify the instrument was functioning properly during deployment. For data analysis, the stage readings are plotted against in-situ stream discharge measurements in order to develop a rating curve. The equation for the “best-fit” line from the rating curve can then be used to create a hydrograph for the period of observation by converting each in-situ stage measurement into an estimated discharge value. Changes in the channel both within and among years affect the stage-discharge relationship. Thus, the accuracy and precision of a rating curve largely depends primarily upon: the inherent stability and sensitivity of the channel under the range of flows, the selection of an appropriate monitoring site, the number of years that the monitoring is conducted, the number of manual discharge measurements performed each year, and the range of flows over which discharge measurements are performed. A hydrograph developed from this process is of limited reliability in the estimation of future discharge parameters given that stream flow is highly variable from year to year.
WQPBWQM-007 Rev. Draft Date: -----
Page 12 of 26
12
Personnel Qualifications The location for installation of the DSR instrument is often only abstractly addressed (e.g. 100 yards downstream of Route 66 crossing) within a Sampling and Analysis Plan (SAP). The exact location where the instrument will be placed will typically be determined in the field upon observation of local water body conditions. Inexperienced personnel must not perform the installation and servicing. To ensure that the instrument is not incorrectly sited, (at minimum) the crew leader responsible for field installation of the DSR apparatus must have at least two field seasons of experience measuring hydrological and/or geomorphological attributes of lotic water bodies. Accordingly, the SAP will provide the names of the staff responsible for performing the instrument installation and servicing in advance. Safety Concerns A high level of caution must be maintained at all times during the installation process. The field crew must consist of at least two persons. Installing the digital stage recorders requires crew members to perform activities such as lifting/repetitive motions, walking/hiking, bending/twisting, climbing (e.g. ladder, stream banks, etc.), wading, etc. The minimum personal protective equipment requirement for each crew member involved with instrument installation should consist of hard hat, safety glasses, and heavy gloves. Due to the nature of the worksite environment, waders are often required, although steel toed boots may be worn at the discretion of the crew members. Working with heavy pipe and post-pounders from an elevated position (e.g. on a ladder) upon potentially mobile substrates in flowing water poses a unique and continuous safety risk. Pounding the stilling well into the substrate generates loud noise as well as strong vibration of the pounding device. Please be aware that noise associated with flowing water (and/or road traffic, wind, etc.) may impair verbal communication between crew members and that wearing of ear protection during anchoring of the stilling well may further inhibit communication. Additional potential safety hazards that must be considered include: inclement weather; tree snags; rough terrain; unstable stream banks; deep, swift, and/or cold water; uncooperative members of the public; disrupted wildlife.
WQPBWQM-007 Rev. Draft Date: -----
Page 13 of 26
13
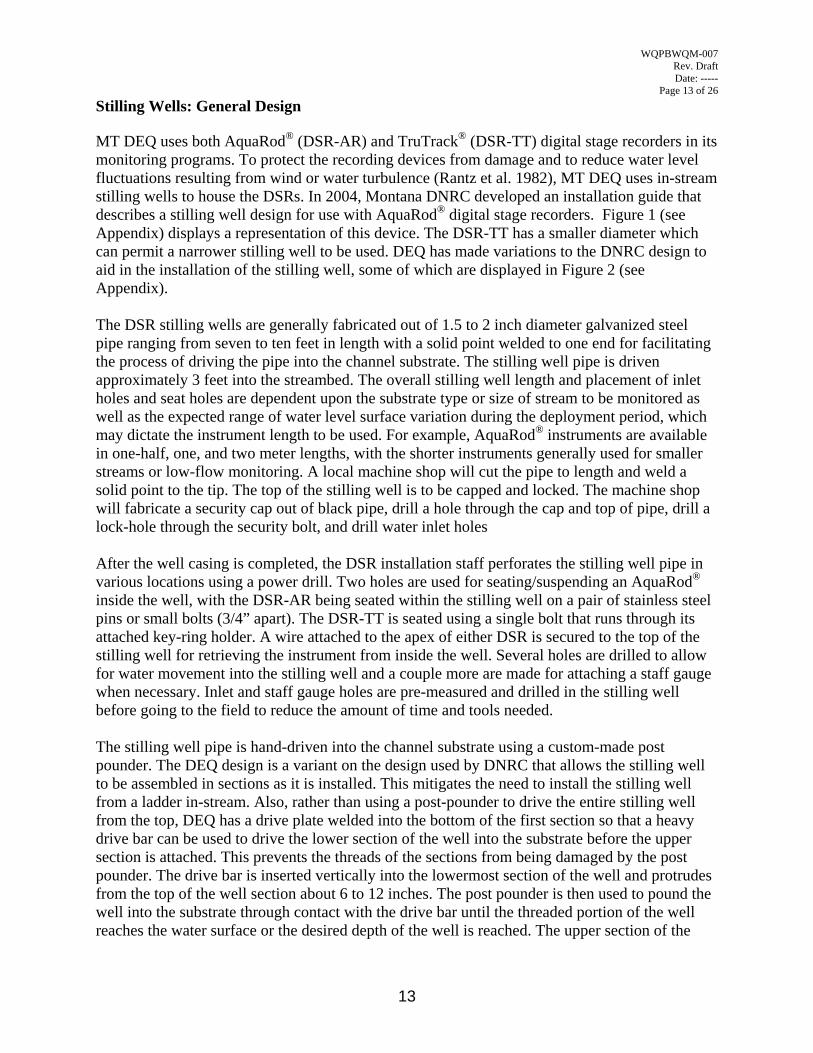
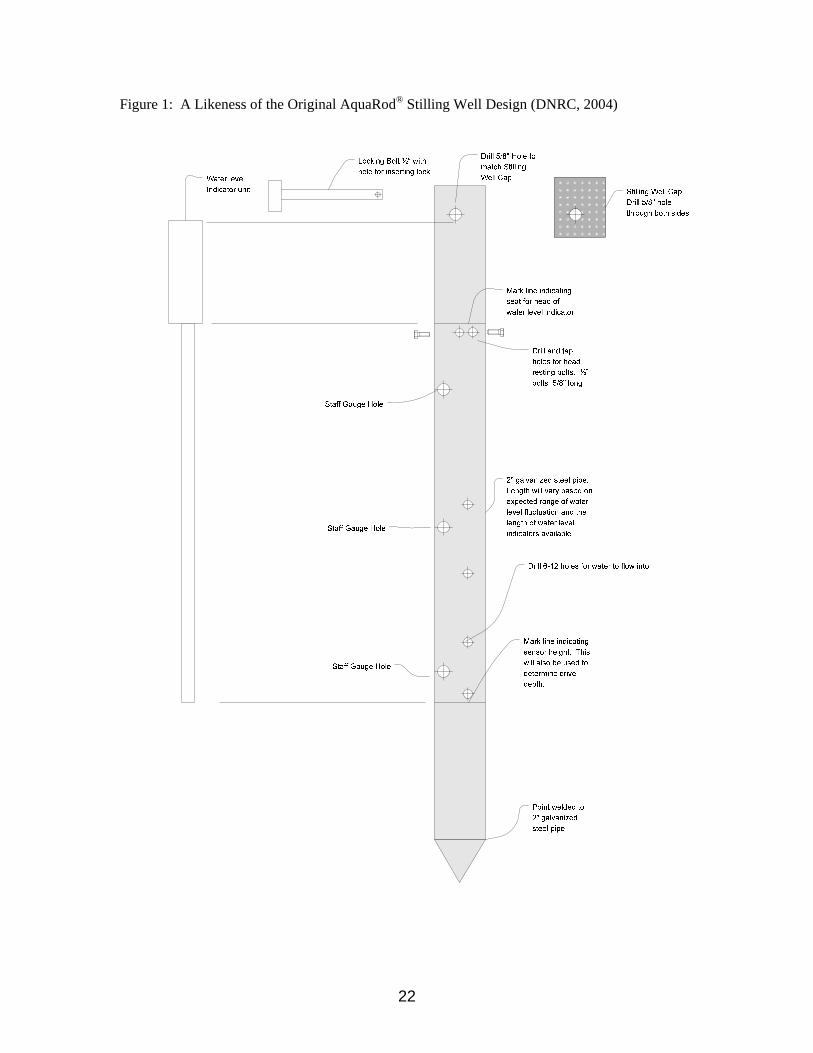
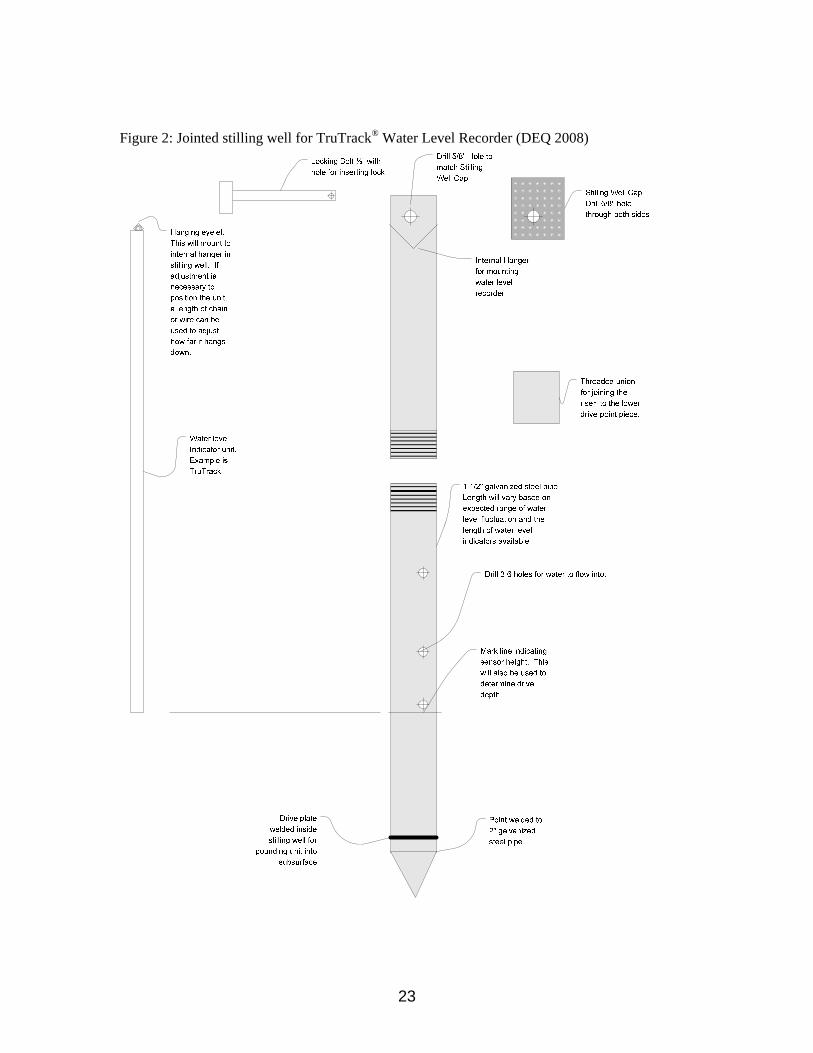
Stilling Wells: General Design MT DEQ uses both AquaRod® (DSR-AR) and TruTrack® (DSR-TT) digital stage recorders in its monitoring programs. To protect the recording devices from damage and to reduce water level fluctuations resulting from wind or water turbulence (Rantz et al. 1982), MT DEQ uses in-stream stilling wells to house the DSRs. In 2004, Montana DNRC developed an installation guide that describes a stilling well design for use with AquaRod® digital stage recorders. Figure 1 (see Appendix) displays a representation of this device. The DSR-TT has a smaller diameter which can permit a narrower stilling well to be used. DEQ has made variations to the DNRC design to aid in the installation of the stilling well, some of which are displayed in Figure 2 (see Appendix). The DSR stilling wells are generally fabricated out of 1.5 to 2 inch diameter galvanized steel pipe ranging from seven to ten feet in length with a solid point welded to one end for facilitating the process of driving the pipe into the channel substrate. The stilling well pipe is driven approximately 3 feet into the streambed. The overall stilling well length and placement of inlet holes and seat holes are dependent upon the substrate type or size of stream to be monitored as well as the expected range of water level surface variation during the deployment period, which may dictate the instrument length to be used. For example, AquaRod® instruments are available in one-half, one, and two meter lengths, with the shorter instruments generally used for smaller streams or low-flow monitoring. A local machine shop will cut the pipe to length and weld a solid point to the tip. The top of the stilling well is to be capped and locked. The machine shop will fabricate a security cap out of black pipe, drill a hole through the cap and top of pipe, drill a lock-hole through the security bolt, and drill water inlet holes After the well casing is completed, the DSR installation staff perforates the stilling well pipe in various locations using a power drill. Two holes are used for seating/suspending an AquaRod® inside the well, with the DSR-AR being seated within the stilling well on a pair of stainless steel pins or small bolts (3/4” apart). The DSR-TT is seated using a single bolt that runs through its attached key-ring holder. A wire attached to the apex of either DSR is secured to the top of the stilling well for retrieving the instrument from inside the well. Several holes are drilled to allow for water movement into the stilling well and a couple more are made for attaching a staff gauge when necessary. Inlet and staff gauge holes are pre-measured and drilled in the stilling well before going to the field to reduce the amount of time and tools needed. The stilling well pipe is hand-driven into the channel substrate using a custom-made post pounder. The DEQ design is a variant on the design used by DNRC that allows the stilling well to be assembled in sections as it is installed. This mitigates the need to install the stilling well from a ladder in-stream. Also, rather than using a post-pounder to drive the entire stilling well from the top, DEQ has a drive plate welded into the bottom of the first section so that a heavy drive bar can be used to drive the lower section of the well into the substrate before the upper section is attached. This prevents the threads of the sections from being damaged by the post pounder. The drive bar is inserted vertically into the lowermost section of the well and protrudes from the top of the well section about 6 to 12 inches. The post pounder is then used to pound the well into the substrate through contact with the drive bar until the threaded portion of the well reaches the water surface or the desired depth of the well is reached. The upper section of the
WQPBWQM-007 Rev. Draft Date: -----
Page 14 of 26
14
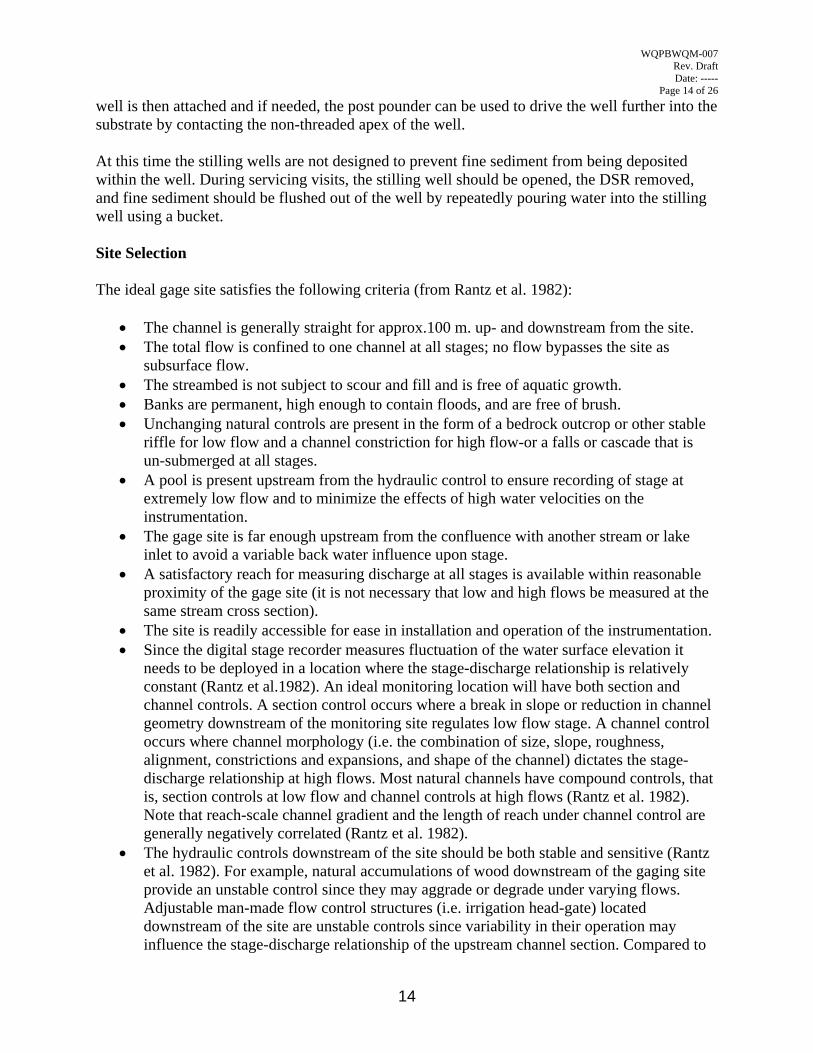
well is then attached and if needed, the post pounder can be used to drive the well further into the substrate by contacting the non-threaded apex of the well. At this time the stilling wells are not designed to prevent fine sediment from being deposited within the well. During servicing visits, the stilling well should be opened, the DSR removed, and fine sediment should be flushed out of the well by repeatedly pouring water into the stilling well using a bucket. Site Selection The ideal gage site satisfies the following criteria (from Rantz et al. 1982):
• The channel is generally straight for approx.100 m. up- and downstream from the site. • The total flow is confined to one channel at all stages; no flow bypasses the site as
subsurface flow. • The streambed is not subject to scour and fill and is free of aquatic growth. • Banks are permanent, high enough to contain floods, and are free of brush. • Unchanging natural controls are present in the form of a bedrock outcrop or other stable
riffle for low flow and a channel constriction for high flow-or a falls or cascade that is un-submerged at all stages.
• A pool is present upstream from the hydraulic control to ensure recording of stage at extremely low flow and to minimize the effects of high water velocities on the instrumentation.
• The gage site is far enough upstream from the confluence with another stream or lake inlet to avoid a variable back water influence upon stage.
• A satisfactory reach for measuring discharge at all stages is available within reasonable proximity of the gage site (it is not necessary that low and high flows be measured at the same stream cross section).
• The site is readily accessible for ease in installation and operation of the instrumentation. • Since the digital stage recorder measures fluctuation of the water surface elevation it
needs to be deployed in a location where the stage-discharge relationship is relatively constant (Rantz et al.1982). An ideal monitoring location will have both section and channel controls. A section control occurs where a break in slope or reduction in channel geometry downstream of the monitoring site regulates low flow stage. A channel control occurs where channel morphology (i.e. the combination of size, slope, roughness, alignment, constrictions and expansions, and shape of the channel) dictates the stage-discharge relationship at high flows. Most natural channels have compound controls, that is, section controls at low flow and channel controls at high flows (Rantz et al. 1982). Note that reach-scale channel gradient and the length of reach under channel control are generally negatively correlated (Rantz et al. 1982).
• The hydraulic controls downstream of the site should be both stable and sensitive (Rantz et al. 1982). For example, natural accumulations of wood downstream of the gaging site provide an unstable control since they may aggrade or degrade under varying flows. Adjustable man-made flow control structures (i.e. irrigation head-gate) located downstream of the site are unstable controls since variability in their operation may influence the stage-discharge relationship of the upstream channel section. Compared to
WQPBWQM-007 Rev. Draft Date: -----
Page 15 of 26
15
other channel locations, sensitive controls (i.e. sections with relatively narrow width to depth ratios) result in greater changes in water depth per unit increase in stream discharge. In summary, the ideal monitoring location consists of a pool in a relatively straight section of the channel having a stable and sensitive natural bed-form (e.g. well-developed downstream riffle or bedrock outcrop) as a section control and a downstream geomorphic constriction as a channel control.
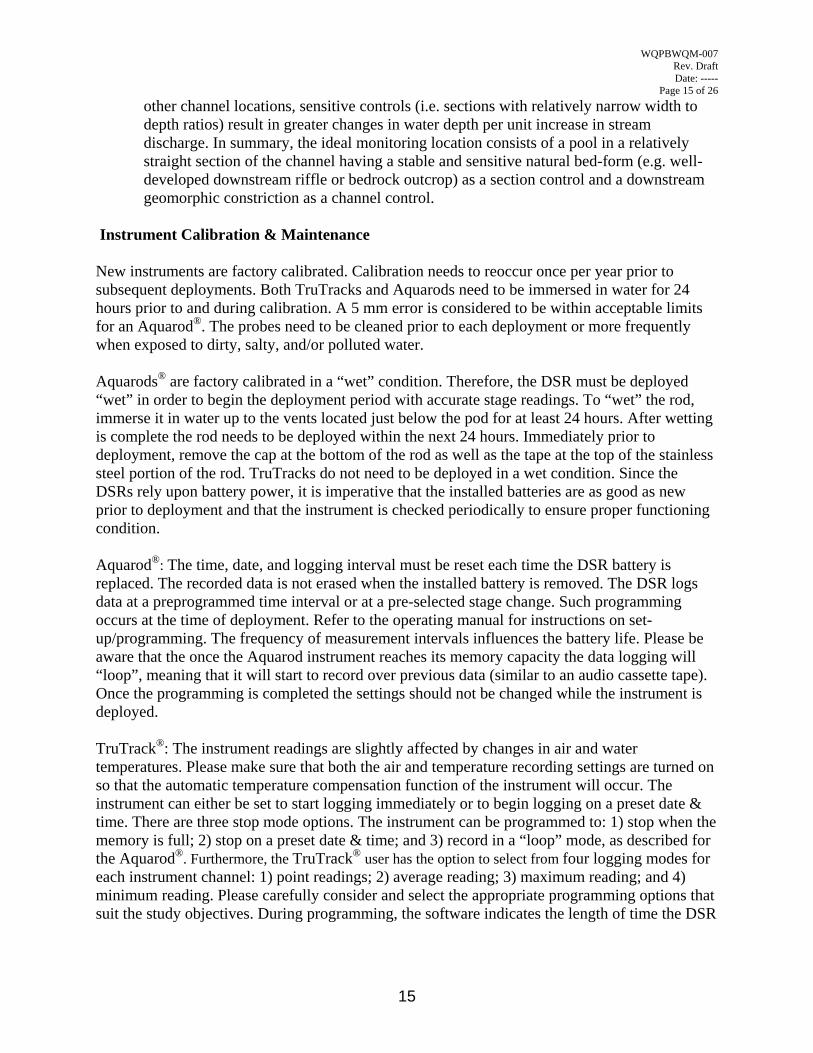
Instrument Calibration & Maintenance New instruments are factory calibrated. Calibration needs to reoccur once per year prior to subsequent deployments. Both TruTracks and Aquarods need to be immersed in water for 24 hours prior to and during calibration. A 5 mm error is considered to be within acceptable limits for an Aquarod®. The probes need to be cleaned prior to each deployment or more frequently when exposed to dirty, salty, and/or polluted water. Aquarods® are factory calibrated in a “wet” condition. Therefore, the DSR must be deployed “wet” in order to begin the deployment period with accurate stage readings. To “wet” the rod, immerse it in water up to the vents located just below the pod for at least 24 hours. After wetting is complete the rod needs to be deployed within the next 24 hours. Immediately prior to deployment, remove the cap at the bottom of the rod as well as the tape at the top of the stainless steel portion of the rod. TruTracks do not need to be deployed in a wet condition. Since the DSRs rely upon battery power, it is imperative that the installed batteries are as good as new prior to deployment and that the instrument is checked periodically to ensure proper functioning condition. Aquarod®: The time, date, and logging interval must be reset each time the DSR battery is replaced. The recorded data is not erased when the installed battery is removed. The DSR logs data at a preprogrammed time interval or at a pre-selected stage change. Such programming occurs at the time of deployment. Refer to the operating manual for instructions on set-up/programming. The frequency of measurement intervals influences the battery life. Please be aware that the once the Aquarod instrument reaches its memory capacity the data logging will “loop”, meaning that it will start to record over previous data (similar to an audio cassette tape). Once the programming is completed the settings should not be changed while the instrument is deployed. TruTrack®: The instrument readings are slightly affected by changes in air and water temperatures. Please make sure that both the air and temperature recording settings are turned on so that the automatic temperature compensation function of the instrument will occur. The instrument can either be set to start logging immediately or to begin logging on a preset date & time. There are three stop mode options. The instrument can be programmed to: 1) stop when the memory is full; 2) stop on a preset date & time; and 3) record in a “loop” mode, as described for the Aquarod®. Furthermore, the TruTrack® user has the option to select from four logging modes for each instrument channel: 1) point readings; 2) average reading; 3) maximum reading; and 4) minimum reading. Please carefully consider and select the appropriate programming options that suit the study objectives. During programming, the software indicates the length of time the DSR
WQPBWQM-007 Rev. Draft Date: -----
Page 16 of 26
16
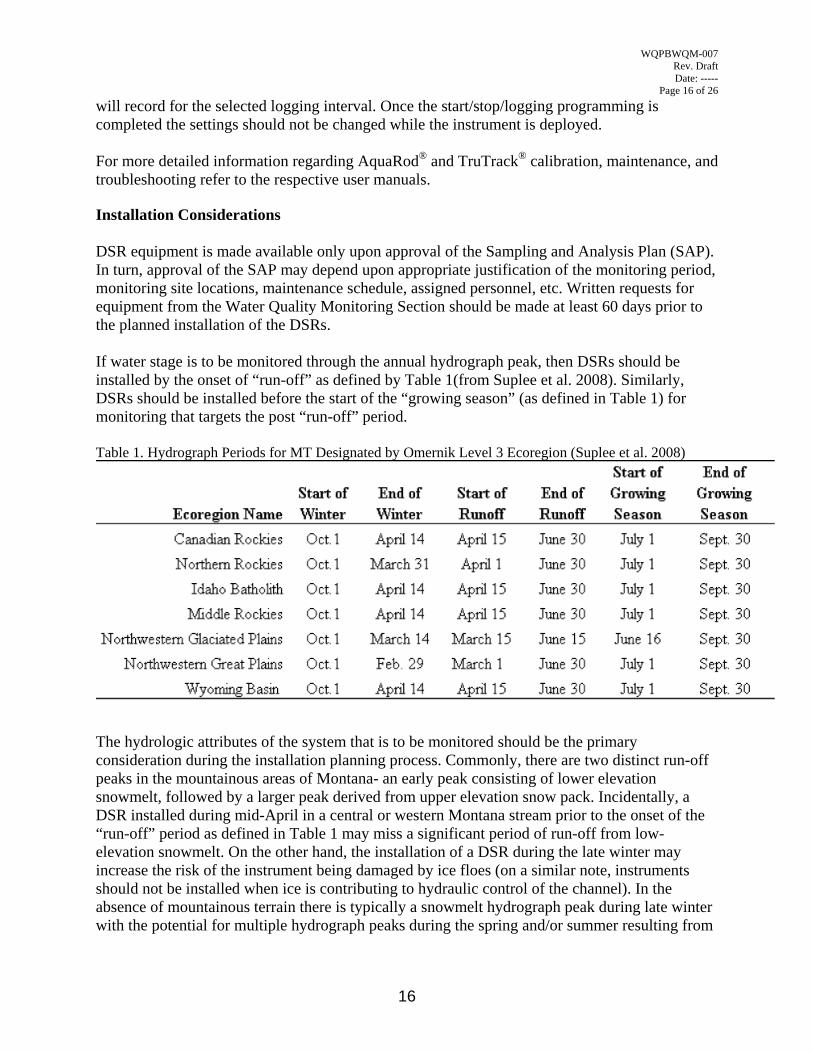
will record for the selected logging interval. Once the start/stop/logging programming is completed the settings should not be changed while the instrument is deployed. For more detailed information regarding AquaRod® and TruTrack® calibration, maintenance, and troubleshooting refer to the respective user manuals. Installation Considerations DSR equipment is made available only upon approval of the Sampling and Analysis Plan (SAP). In turn, approval of the SAP may depend upon appropriate justification of the monitoring period, monitoring site locations, maintenance schedule, assigned personnel, etc. Written requests for equipment from the Water Quality Monitoring Section should be made at least 60 days prior to the planned installation of the DSRs. If water stage is to be monitored through the annual hydrograph peak, then DSRs should be installed by the onset of “run-off” as defined by Table 1(from Suplee et al. 2008). Similarly, DSRs should be installed before the start of the “growing season” (as defined in Table 1) for monitoring that targets the post “run-off” period. Table 1. Hydrograph Periods for MT Designated by Omernik Level 3 Ecoregion (Suplee et al. 2008)
The hydrologic attributes of the system that is to be monitored should be the primary consideration during the installation planning process. Commonly, there are two distinct run-off peaks in the mountainous areas of Montana- an early peak consisting of lower elevation snowmelt, followed by a larger peak derived from upper elevation snow pack. Incidentally, a DSR installed during mid-April in a central or western Montana stream prior to the onset of the “run-off” period as defined in Table 1 may miss a significant period of run-off from low-elevation snowmelt. On the other hand, the installation of a DSR during the late winter may increase the risk of the instrument being damaged by ice floes (on a similar note, instruments should not be installed when ice is contributing to hydraulic control of the channel). In the absence of mountainous terrain there is typically a snowmelt hydrograph peak during late winter with the potential for multiple hydrograph peaks during the spring and/or summer resulting from
WQPBWQM-007 Rev. Draft Date: -----
Page 17 of 26
17
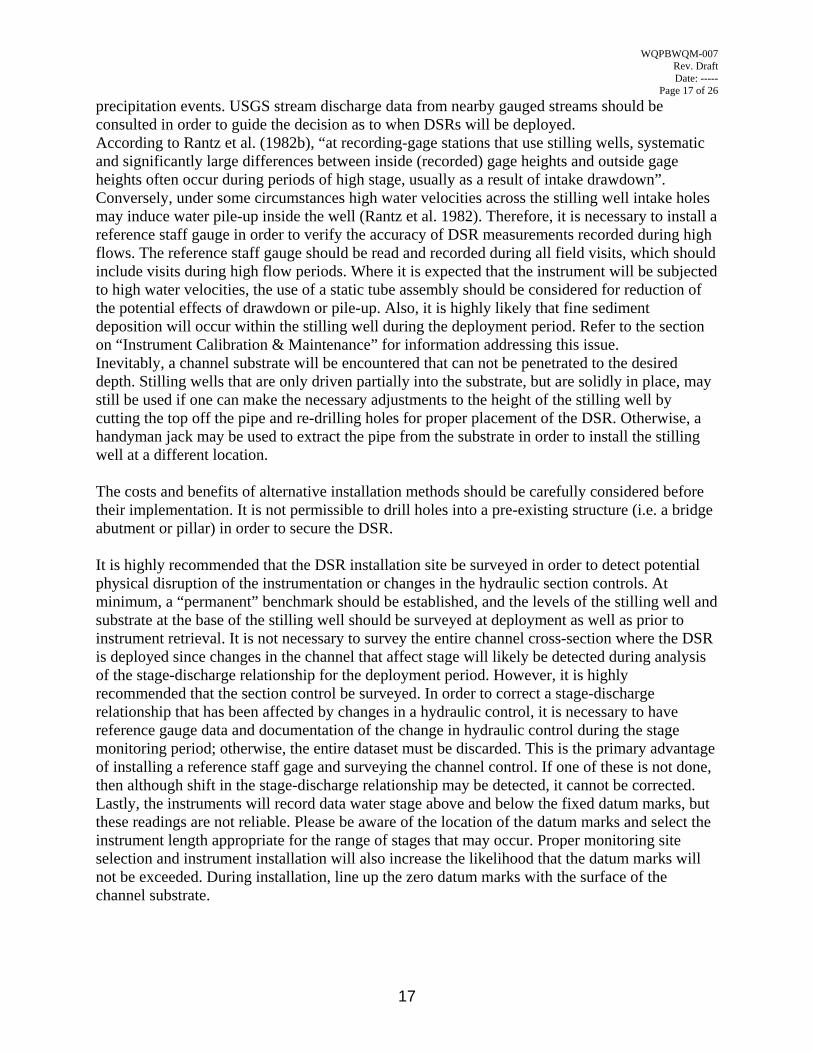
precipitation events. USGS stream discharge data from nearby gauged streams should be consulted in order to guide the decision as to when DSRs will be deployed. According to Rantz et al. (1982b), “at recording-gage stations that use stilling wells, systematic and significantly large differences between inside (recorded) gage heights and outside gage heights often occur during periods of high stage, usually as a result of intake drawdown”. Conversely, under some circumstances high water velocities across the stilling well intake holes may induce water pile-up inside the well (Rantz et al. 1982). Therefore, it is necessary to install a reference staff gauge in order to verify the accuracy of DSR measurements recorded during high flows. The reference staff gauge should be read and recorded during all field visits, which should include visits during high flow periods. Where it is expected that the instrument will be subjected to high water velocities, the use of a static tube assembly should be considered for reduction of the potential effects of drawdown or pile-up. Also, it is highly likely that fine sediment deposition will occur within the stilling well during the deployment period. Refer to the section on “Instrument Calibration & Maintenance” for information addressing this issue. Inevitably, a channel substrate will be encountered that can not be penetrated to the desired depth. Stilling wells that are only driven partially into the substrate, but are solidly in place, may still be used if one can make the necessary adjustments to the height of the stilling well by cutting the top off the pipe and re-drilling holes for proper placement of the DSR. Otherwise, a handyman jack may be used to extract the pipe from the substrate in order to install the stilling well at a different location. The costs and benefits of alternative installation methods should be carefully considered before their implementation. It is not permissible to drill holes into a pre-existing structure (i.e. a bridge abutment or pillar) in order to secure the DSR. It is highly recommended that the DSR installation site be surveyed in order to detect potential physical disruption of the instrumentation or changes in the hydraulic section controls. At minimum, a “permanent” benchmark should be established, and the levels of the stilling well and substrate at the base of the stilling well should be surveyed at deployment as well as prior to instrument retrieval. It is not necessary to survey the entire channel cross-section where the DSR is deployed since changes in the channel that affect stage will likely be detected during analysis of the stage-discharge relationship for the deployment period. However, it is highly recommended that the section control be surveyed. In order to correct a stage-discharge relationship that has been affected by changes in a hydraulic control, it is necessary to have reference gauge data and documentation of the change in hydraulic control during the stage monitoring period; otherwise, the entire dataset must be discarded. This is the primary advantage of installing a reference staff gage and surveying the channel control. If one of these is not done, then although shift in the stage-discharge relationship may be detected, it cannot be corrected. Lastly, the instruments will record data water stage above and below the fixed datum marks, but these readings are not reliable. Please be aware of the location of the datum marks and select the instrument length appropriate for the range of stages that may occur. Proper monitoring site selection and instrument installation will also increase the likelihood that the datum marks will not be exceeded. During installation, line up the zero datum marks with the surface of the channel substrate.
WQPBWQM-007 Rev. Draft Date: -----
Page 18 of 26
18
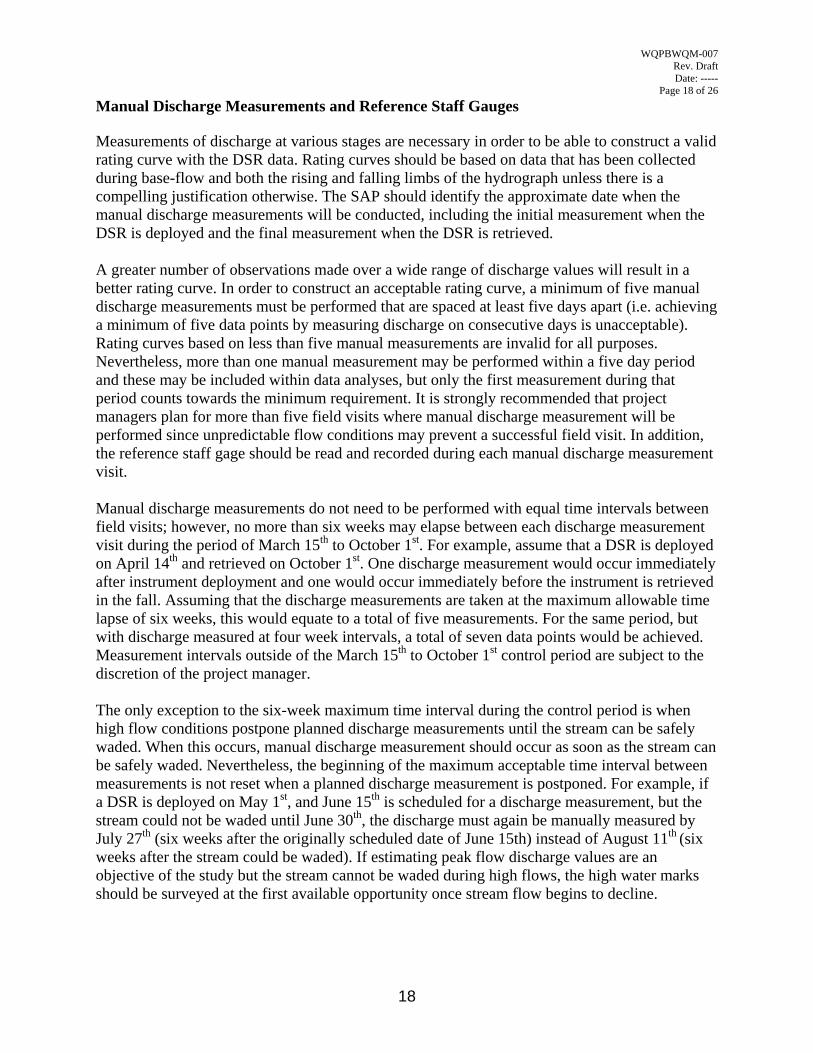
Manual Discharge Measurements and Reference Staff Gauges Measurements of discharge at various stages are necessary in order to be able to construct a valid rating curve with the DSR data. Rating curves should be based on data that has been collected during base-flow and both the rising and falling limbs of the hydrograph unless there is a compelling justification otherwise. The SAP should identify the approximate date when the manual discharge measurements will be conducted, including the initial measurement when the DSR is deployed and the final measurement when the DSR is retrieved. A greater number of observations made over a wide range of discharge values will result in a better rating curve. In order to construct an acceptable rating curve, a minimum of five manual discharge measurements must be performed that are spaced at least five days apart (i.e. achieving a minimum of five data points by measuring discharge on consecutive days is unacceptable). Rating curves based on less than five manual measurements are invalid for all purposes. Nevertheless, more than one manual measurement may be performed within a five day period and these may be included within data analyses, but only the first measurement during that period counts towards the minimum requirement. It is strongly recommended that project managers plan for more than five field visits where manual discharge measurement will be performed since unpredictable flow conditions may prevent a successful field visit. In addition, the reference staff gage should be read and recorded during each manual discharge measurement visit. Manual discharge measurements do not need to be performed with equal time intervals between field visits; however, no more than six weeks may elapse between each discharge measurement visit during the period of March 15th to October 1st. For example, assume that a DSR is deployed on April 14th and retrieved on October 1st. One discharge measurement would occur immediately after instrument deployment and one would occur immediately before the instrument is retrieved in the fall. Assuming that the discharge measurements are taken at the maximum allowable time lapse of six weeks, this would equate to a total of five measurements. For the same period, but with discharge measured at four week intervals, a total of seven data points would be achieved. Measurement intervals outside of the March 15th to October 1st control period are subject to the discretion of the project manager. The only exception to the six-week maximum time interval during the control period is when high flow conditions postpone planned discharge measurements until the stream can be safely waded. When this occurs, manual discharge measurement should occur as soon as the stream can be safely waded. Nevertheless, the beginning of the maximum acceptable time interval between measurements is not reset when a planned discharge measurement is postponed. For example, if a DSR is deployed on May 1st, and June 15th is scheduled for a discharge measurement, but the stream could not be waded until June 30th, the discharge must again be manually measured by July 27th (six weeks after the originally scheduled date of June 15th) instead of August 11th (six weeks after the stream could be waded). If estimating peak flow discharge values are an objective of the study but the stream cannot be waded during high flows, the high water marks should be surveyed at the first available opportunity once stream flow begins to decline.
WQPBWQM-007 Rev. Draft Date: -----
Page 19 of 26
19
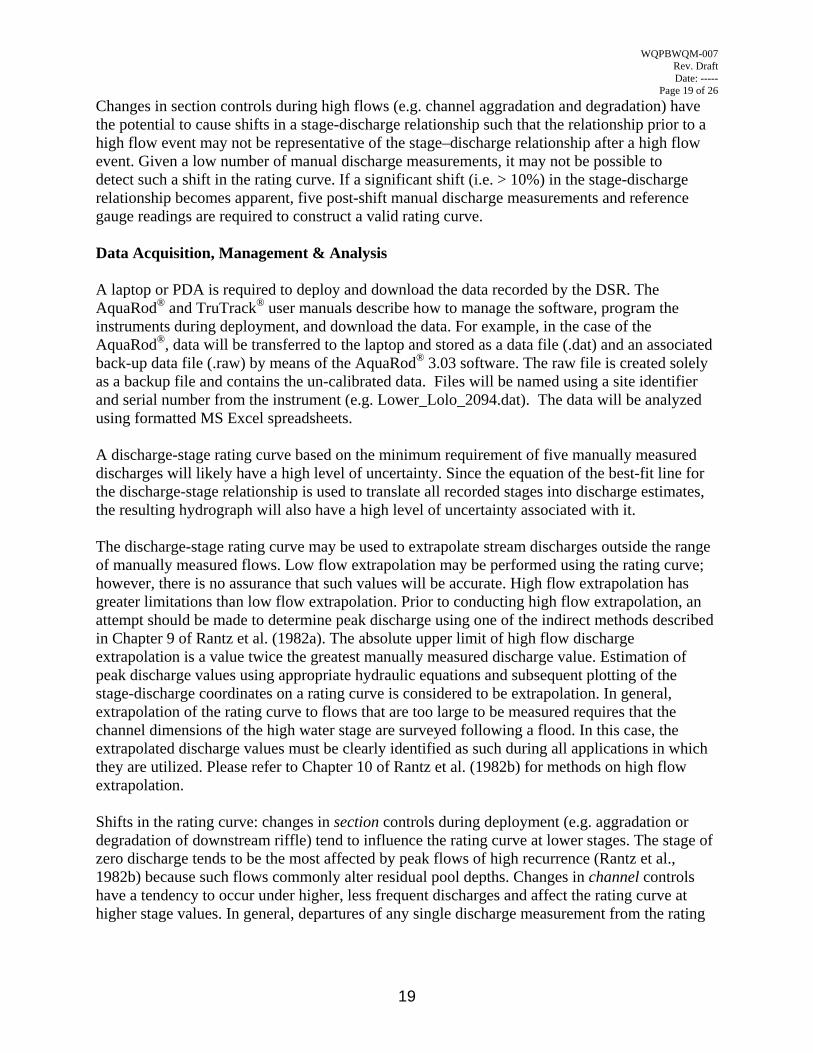
Changes in section controls during high flows (e.g. channel aggradation and degradation) have the potential to cause shifts in a stage-discharge relationship such that the relationship prior to a high flow event may not be representative of the stage–discharge relationship after a high flow event. Given a low number of manual discharge measurements, it may not be possible to detect such a shift in the rating curve. If a significant shift (i.e. > 10%) in the stage-discharge relationship becomes apparent, five post-shift manual discharge measurements and reference gauge readings are required to construct a valid rating curve. Data Acquisition, Management & Analysis A laptop or PDA is required to deploy and download the data recorded by the DSR. The AquaRod® and TruTrack® user manuals describe how to manage the software, program the instruments during deployment, and download the data. For example, in the case of the AquaRod®, data will be transferred to the laptop and stored as a data file (.dat) and an associated back-up data file (.raw) by means of the AquaRod® 3.03 software. The raw file is created solely as a backup file and contains the un-calibrated data. Files will be named using a site identifier and serial number from the instrument (e.g. Lower_Lolo_2094.dat). The data will be analyzed using formatted MS Excel spreadsheets. A discharge-stage rating curve based on the minimum requirement of five manually measured discharges will likely have a high level of uncertainty. Since the equation of the best-fit line for the discharge-stage relationship is used to translate all recorded stages into discharge estimates, the resulting hydrograph will also have a high level of uncertainty associated with it. The discharge-stage rating curve may be used to extrapolate stream discharges outside the range of manually measured flows. Low flow extrapolation may be performed using the rating curve; however, there is no assurance that such values will be accurate. High flow extrapolation has greater limitations than low flow extrapolation. Prior to conducting high flow extrapolation, an attempt should be made to determine peak discharge using one of the indirect methods described in Chapter 9 of Rantz et al. (1982a). The absolute upper limit of high flow discharge extrapolation is a value twice the greatest manually measured discharge value. Estimation of peak discharge values using appropriate hydraulic equations and subsequent plotting of the stage-discharge coordinates on a rating curve is considered to be extrapolation. In general, extrapolation of the rating curve to flows that are too large to be measured requires that the channel dimensions of the high water stage are surveyed following a flood. In this case, the extrapolated discharge values must be clearly identified as such during all applications in which they are utilized. Please refer to Chapter 10 of Rantz et al. (1982b) for methods on high flow extrapolation. Shifts in the rating curve: changes in section controls during deployment (e.g. aggradation or degradation of downstream riffle) tend to influence the rating curve at lower stages. The stage of zero discharge tends to be the most affected by peak flows of high recurrence (Rantz et al., 1982b) because such flows commonly alter residual pool depths. Changes in channel controls have a tendency to occur under higher, less frequent discharges and affect the rating curve at higher stage values. In general, departures of any single discharge measurement from the rating
WQPBWQM-007 Rev. Draft Date: -----
Page 20 of 26
20
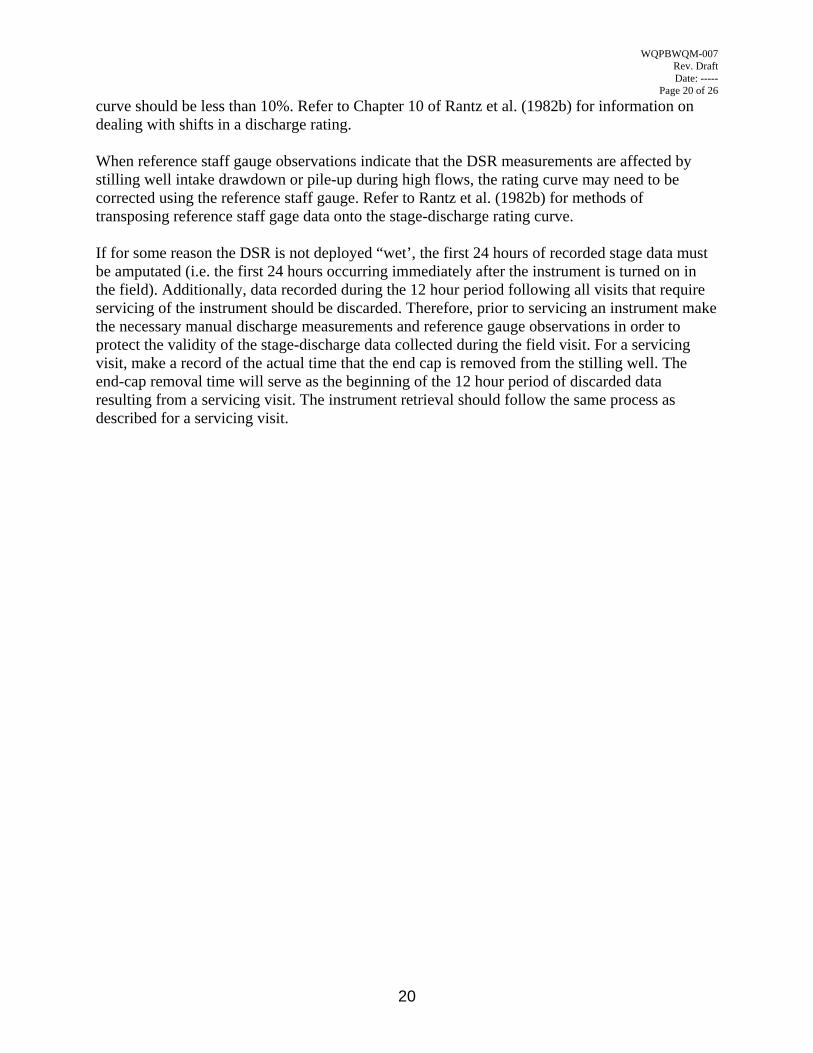
curve should be less than 10%. Refer to Chapter 10 of Rantz et al. (1982b) for information on dealing with shifts in a discharge rating. When reference staff gauge observations indicate that the DSR measurements are affected by stilling well intake drawdown or pile-up during high flows, the rating curve may need to be corrected using the reference staff gauge. Refer to Rantz et al. (1982b) for methods of transposing reference staff gage data onto the stage-discharge rating curve. If for some reason the DSR is not deployed “wet’, the first 24 hours of recorded stage data must be amputated (i.e. the first 24 hours occurring immediately after the instrument is turned on in the field). Additionally, data recorded during the 12 hour period following all visits that require servicing of the instrument should be discarded. Therefore, prior to servicing an instrument make the necessary manual discharge measurements and reference gauge observations in order to protect the validity of the stage-discharge data collected during the field visit. For a servicing visit, make a record of the actual time that the end cap is removed from the stilling well. The end-cap removal time will serve as the beginning of the 12 hour period of discarded data resulting from a servicing visit. The instrument retrieval should follow the same process as described for a servicing visit.
WQPBWQM-007 Rev. Draft Date: -----
Page 21 of 26
21
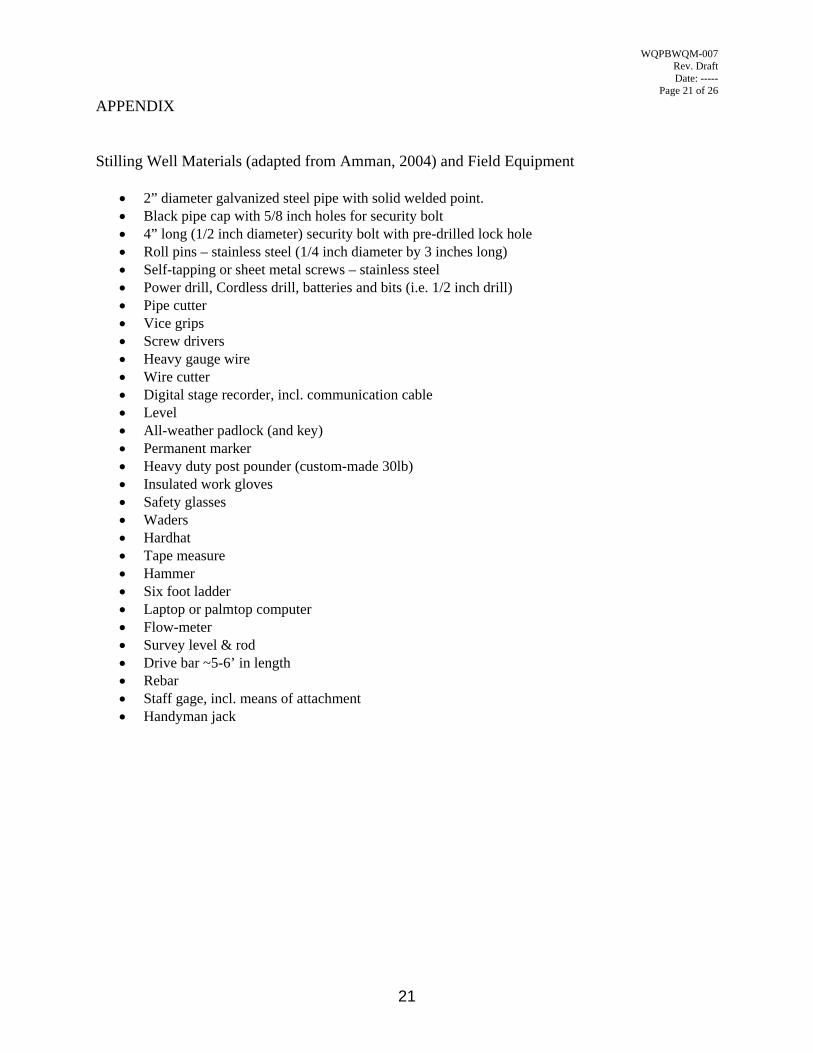
APPENDIX Stilling Well Materials (adapted from Amman, 2004) and Field Equipment
• 2” diameter galvanized steel pipe with solid welded point. • Black pipe cap with 5/8 inch holes for security bolt • 4” long (1/2 inch diameter) security bolt with pre-drilled lock hole • Roll pins – stainless steel (1/4 inch diameter by 3 inches long) • Self-tapping or sheet metal screws – stainless steel • Power drill, Cordless drill, batteries and bits (i.e. 1/2 inch drill) • Pipe cutter • Vice grips • Screw drivers • Heavy gauge wire • Wire cutter • Digital stage recorder, incl. communication cable • Level • All-weather padlock (and key) • Permanent marker • Heavy duty post pounder (custom-made 30lb) • Insulated work gloves • Safety glasses • Waders • Hardhat • Tape measure • Hammer • Six foot ladder • Laptop or palmtop computer • Flow-meter • Survey level & rod • Drive bar ~5-6’ in length • Rebar • Staff gage, incl. means of attachment • Handyman jack
22
Figure 1: A Likeness of the Original AquaRod® Stilling Well Design (DNRC, 2004)
23
Figure 2: Jointed stilling well for TruTrack® Water Level Recorder (DEQ 2008)
24
Literature Cited 2004 DNRC Amman, D. A Practical Guide to AquaRod Installation. Montana Department of Natural Resources and Conservation, Water Resources Division. Helena, Montana. 1995 USGS Wahl K.L. et al. U.S. Geological Survey Circular 1123. Stream-Gaging Program of the U.S. Geological Survey. Reston, Virginia. Rantz, S.E. et al. 1982a. Measurement and Computation of Streamflow: Volume 1. Measurement of Stage and Discharge. Geological Survey Water-Supply Paper 2175. United States Government Printing Office, Washington. Rantz, S.E. et al. 1982b. Measurement and Computation of Streamflow: Volume 2. Computation of Discharge. Geological Survey Water-Supply Paper 2175. United States Government Printing Office, Washington.