lower cape may meadows ecological restoration: analysis … · lower cape may meadows ecological...
TRANSCRIPT
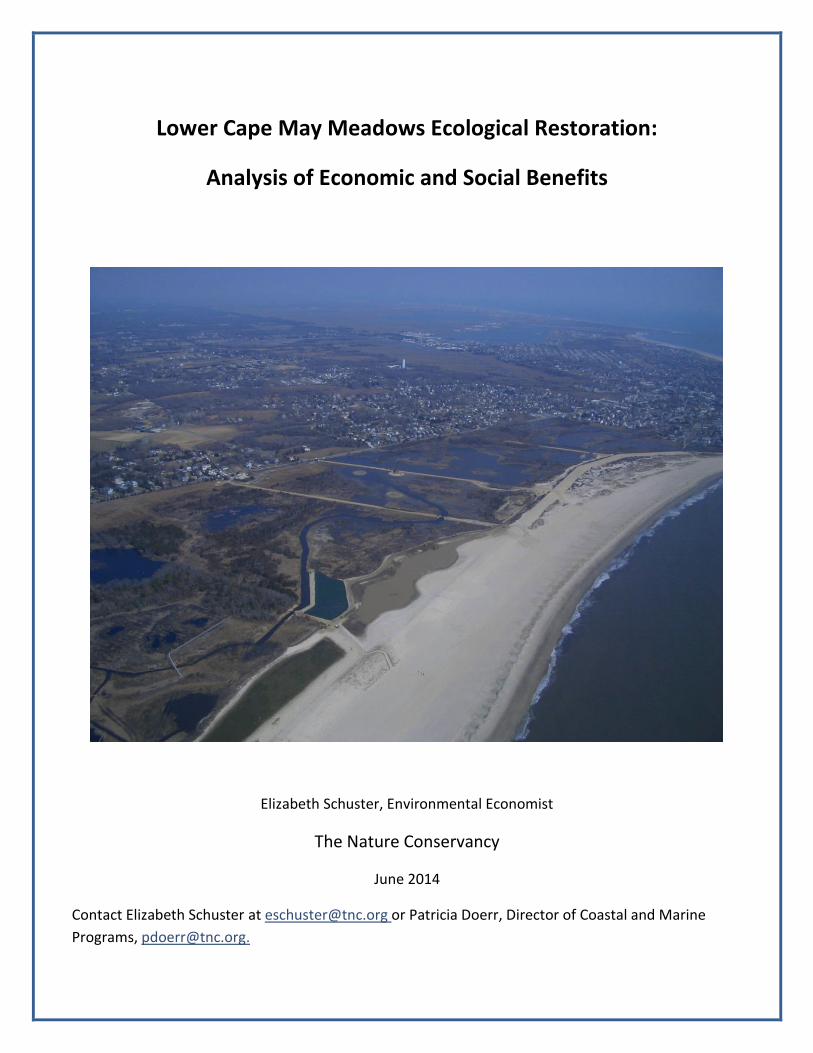
Lower Cape May Meadows Ecological Restoration:
Analysis of Economic and Social Benefits
Elizabeth Schuster, Environmental Economist
The Nature Conservancy
June 2014
Contact Elizabeth Schuster at [email protected] or Patricia Doerr, Director of Coastal and Marine
Programs, [email protected].
The Nature Conservancy, New Jersey Chapter, June 5, 2014
2
Acknowledgements
We are grateful to the New Jersey Recovery Fund for funding this research project. We also would like
to thank Dr. David A. Robinson, Professor, Department of Geography at Rutgers University and New
Jersey State Climatologist, for his support in acquiring weather data and weather-related information
on our study site. We graciously thank the Borough of Cape May Point, and in particular Mayor and
Commissioner of Revenue & Finance Anita van Heeswyk, previous mayor “Skip” Stanger, and
Emergency Management Coordinator Irene Schreiner for their support. Further, we thank Nature
Conservancy staff from the New Jersey chapter, including Patty Doerr, Adrianna Zito-Livingston, Bob
Allen, Mike Shanahan, Nina Chen, Erin Daly and the other numerous colleagues who helped edit the
report.
The Nature Conservancy, New Jersey Chapter, June 5, 2014
3
Table of Contents
ACKNOWLEDGEMENTS ..............................................................................................................................................2
TABLE OF CONTENTS ..................................................................................................................................................3
LIST OF TABLES ...........................................................................................................................................................4
LIST OF FIGURES .........................................................................................................................................................4
EXECUTIVE SUMMARY ................................................................................................................................................5
CHAPTER 1: INTRODUCTION ......................................................................................................................................6
CHAPTER 2: BACKGROUND AND OVERVIEW OF RESTORATION PROJECT .................................................................8
2.1 BACKGROUND .......................................................................................................................................................8
2.2 OVERVIEW OF RESTORATION PROJECT ............................................................................................................. 10
CHAPTER 3: IMPACT ASSESSMENT OF LCMM RESTORATION PROJECT .................................................................. 13
3.1 METHODS FOR IMPACT ASSESSMENT ............................................................................................................... 13
3.2 FLOOD MITIGATION DATA AND ANALYSIS ......................................................................................................... 14
3.3 FLOOD MITIGATION RESULTS AND DISCUSSION................................................................................................ 17
3.4 BIRDING DATA AND ANALYSIS ........................................................................................................................... 19
3.5 ECOTOURISM METHODS, DATA AND ANALYSIS ................................................................................................ 22
3.6 ECOTOURISM AND BIRDING RESULTS AND DISCUSSION ................................................................................... 24
CHAPTER 4: MULTIPLE ECOSYSTEM SERVICE BENEFITS FROM LOWER CAPE MAY MEADOWS ............................. 26
4.1 METHODS FOR QUANTIFYING MULTIPLE BENEFITS FROM LCMM .................................................................... 26
4.2 ANALYSIS OF MULTIPLE BENEFITS FROM THE LCMM SITE ................................................................................. 27
CHAPTER 5: CONCLUSIONS AND POLICY IMPLICATIONS ........................................................................................ 31
REFERENCES ............................................................................................................................................................ 33
APPENDIX A. LOCATIONS OF BERM, DUNE, WETLAND RESTORATION AND ONGOING MONITORING SITES ........ 36
APPENDIX B. QUANTIFYING ECONOMIC IMPACT AND ECOSYSTEM SERVICE BENEFITS ........................................ 38
The Nature Conservancy, New Jersey Chapter, June 5, 2014
4
List of Tables
TABLE 1. NFIP DAMAGE CLAIMS AND WEATHER DATA FROM CAPE MAY POINT, SELECTED STORMS SINCE 1985 ............... 17
TABLE 2. CASE STUDY COMPARING SUPERSTORM SANDY WITH A PRE-RESTORATION STORM ......................................... 19
TABLE 3. TOTAL DAMAGE COSTS AVOIDED OVER THE NEXT 50 YEARS, CAPE MAY POINT .............................................. 31
TABLE 4. THE RANGE OF LCMM ECOSYSTEM SERVICE BENEFITS PER HABITAT TYPE AND TYPE OF BENEFIT ......................... 32
List of Figures
FIGURE 1. MAP OF LCMM RESTORATION SITE AND SURROUNDING MUNICIPALITIES ...................................................... 8
FIGURE 2. LOWER CAPE MAY MEADOWS DURING THE DUNE BREACH IN THE OCTOBER 1991 STORM .............................. 9
FIGURE 3. HISTORIC AND PROJECTED SHORELINE EROSION FOR SOUTH CAPE MAY AND CAPE MAY POINT, 1879-2050 .... 10
FIGURE 2. BEACH REPLENISHMENT ON THE STATE PARK BEACH AND AROUND CAPE MAY POINT, BEFORE AND AFTER THE
RESTORATION ................................................................................................................................................ 11
FIGURE 3. DELINEATION OF WATERSHED THAT DRAINS INTO THE LOWER CAPE MAY MEADOWS WETLANDS ..................... 15
FIGURE 6. STORMS IN CAPE MAY POINT BY MAGNITUDE OF STORM SURGE (1985-2013) ........................................... 16
FIGURE 7. AVERAGE TOTAL CLAIMS FOR CAPE MAY POINT PER MAJOR STORM PRE- AND POST-RESTORATION LCMM. ...... 18
FIGURE 8. INCREASE IN BIRDING TRIPS REPORTED AT THE THREE LOCATIONS, ADJUSTING FOR CHANGES IN USE OF EBIRD ..... 21
FIGURE 9. AVERAGE ANNUAL TOURISM EXPENDITURES IN CAPE MAY COUNTY, HIGHLIGHTING BIRDING EXPENDITURES ...... 23
FIGURE 10. LOCATIONS OF PROPOSED BERM*, DUNE AND WETLAND RESTORATION ..................................................... 36
FIGURE 11. BEACH/DUNE AND SHORELINE MONITORING PROGRAM ....................................................................... 37
The Nature Conservancy, New Jersey Chapter, June 5, 2014
5
Executive Summary
The goal of this study was to analyze the economic and social benefits of the restoration of
Lower Cape May Meadows (LCMM) ecosystem, which includes the South Cape May Meadows Preserve
(owned and managed by The Nature Conservancy) and the Cape May Point State Park (owned and
managed by the New Jersey Department of Environmental Protection (NJDEP)). We analyzed the 456-
acre ecological restoration of LCMM, which was completed in 2007. The project was comprised of a
freshwater wetland restoration, construction of a sand dune, and two miles of beach replenishment.
The research is divided into two separate components. First, we analyzed the impact of restoration,
answering the questions:
Did restoration project increase economic and social benefits to the surrounding
communities?
If so, what are the total flood damage costs that were avoided as a result of the project,
aggregated over the community of Cape May Point and into the future?
In addition, what are the regional economic impacts from ecotourism with an emphasis
on birding at LCMM?
For the second component of the analysis, we assessed the economic value associated with
additional ecosystem service benefits from the project, presenting the range in values for services such
as beach recreation, water quality and the satisfaction individuals place on knowing coastal habitat and
wildlife is protected.
We conducted an impact assessment of the restoration using both qualitative and quantitative
methods. We found that the restoration had a beneficial impact on the community, both in terms of
flood reduction and increased ecotourism expenditures. The restoration will provide approximately
$9.6 million in total benefits from avoided costs from flooding to homes in Cape May Point over the
next 50 years. Furthermore, the regional economic impacts from birding are substantial, with $313
million each year generated by South Cape May Meadows Preserve, Cape May Point State Park and
other nearby birding hotspots in the southernmost portion of Cape May County. The preserve and
state park account for the majority of the $313 million in birding expenditures, given the visitor
amenities, ease of access and international reputation of the sites. Beyond the damage costs avoided
and birding expenditures, additional benefits are associated with the LCMM restoration site. The
approximate value of beach recreation is between $11 and $12.5 million per year, with additional
benefits from water quality improvements and from the value that the public places on wildlife and
habitat protection.
To the best of the author’s knowledge, this is among the first reports of this type to be written
in New Jersey. Understanding how coastal habitat functions and benefits communities is a crucial first
step in better managing coastal habitats in the future. Natural resource managers and ecological
restoration experts will benefit from reading this entire report, while policy makers will benefit from
reading Chapter 1, the first section of Chapter 2, the two results and discussion sections in Chapter 3,
and Chapter 5.
The Nature Conservancy, New Jersey Chapter, June 5, 2014
6
Chapter 1: Introduction
Costly storms like Superstorm Sandy and Hurricane Irene are bringing public attention to the
need to increase the resiliency1 of our coastal communities. The economic costs of coastal disasters are
already substantial. Superstorm Sandy resulted in over $50 billion in damage, with more than half—
$37 billion—in New Jersey (Blake et al. 2013; State of New Jersey 2012). Beyond the physical damage
from the storm, other financial costs are high, including business closings, missed work days and lost
income to households. Another study looking at extreme weather reported that in New Jersey, power
interruptions resulting from storms such as hurricanes, thunderstorms, and snow and ice are 10 times
more common than they were 20 years ago (New Jersey Climate Adaptation Alliance 2013). Future
storms are expected to be more intense, more frequent and less predictable, and will be exacerbated
by rising sea levels. New Jersey is considered a hot spot for sea level rise, where predicted increases in
sea level are three to four times higher than the global average (Sallenger, Doran and Howd 2012).
Since Superstorm Sandy, there has been increased public attention on the role that natural
infrastructure2 plays in coastal areas to reduce risk from coastal hazards. Examples include: marshes,
which can attenuate waves and reduce wave and flood damage to communities; wetlands, which can
store flood water and reduce flood damage to homes; and sand dunes, which can buffer communities
from damage caused by storm surge. Natural infrastructure is an appealing option because in addition
to risk reduction, it offers a variety of other benefits. For example, a restored marsh can also lead to
water quality improvements, an increase in ecotourism revenues by attracting rare birds, and can
serve as a nursery for recreational and commercial fisheries.
The literature supports the claim that open space reduces damage from flooding. Brody and
Highfield (2013) were among the first to do a comprehensive analysis of the role that open space plays
in reducing damage claims to the Federal Emergency Management Agency’s (FEMA) National Flood
Insurance Program (NFIP). They estimated a decrease of $1,052 per community per year in flood
damage claims, per additional point in FEMA’s Community Rating System (CRS) Program. Aggregating
over the total average CRS points, the savings are $200,000 per community each year in damage costs
avoided (ibid.). The CRS gives points to communities for undertaking certain flood mitigation strategies,
such as updating floodplain ordinances and increasing the amount of open space, particularly open
space in floodplains. Another recent study that analyzed 34 major hurricanes in the United States since
1980 found that a loss of just one acre of coastal wetland leads to an increase of $13,360 in damage to
communities during each storm (Costanza et al. 2008).
In the past, governmental entities in coastal areas have largely sought “grey infrastructure”
solutions for risk reduction, such as seawalls, bulkheads and other engineered solutions. However,
there is growing interest among decision makers to explore the role of natural infrastructure to
increase the number of risk reduction options available. Natural infrastructure solutions have the
potential to be more cost-effective while providing additional social, economic and ecological benefits.
1 Community resilience refers to a human community’s ability to adapt to changing natural and economic conditions, and
respond and recover more efficiently after a disruptive event such as a coastal storm. 2 Natural infrastructure can be described as practices that enhance, restore or create ecological functions in order to
provide ecosystem services for people.
The Nature Conservancy, New Jersey Chapter, June 5, 2014
7
Although several analyses have been conducted on the economic benefits that natural
infrastructure provides in coastal areas, the majority of the studies cover broad regions and, in many
cases, multiple states. Very few studies exist that quantify the full range of post-project risk reduction
benefits resulting from an ecological restoration that restores ecological function in a coastal area.
Thus, this case study is a crucial analysis towards building the case that a wetland, dune and beach
restoration project has the potential to benefit communities.
The Lower Cape May Meadows restoration serves as a useful case study for several reasons.
First, the Borough of Cape May Point has experienced several intense hurricanes and nor’easters in
recent years, both in the time periods immediately before and after the restoration was completed.
Second, Cape May Point is a coastal community adjacent to the ocean, so community assets are at risk
from sea level rise in addition to damage from storms. And third, the wetland restoration is directly
adjacent to multiple homes and thereby provides a unique opportunity to evaluate the impact of the
restoration on communities.
The Nature Conservancy, New Jersey Chapter, June 5, 2014
8
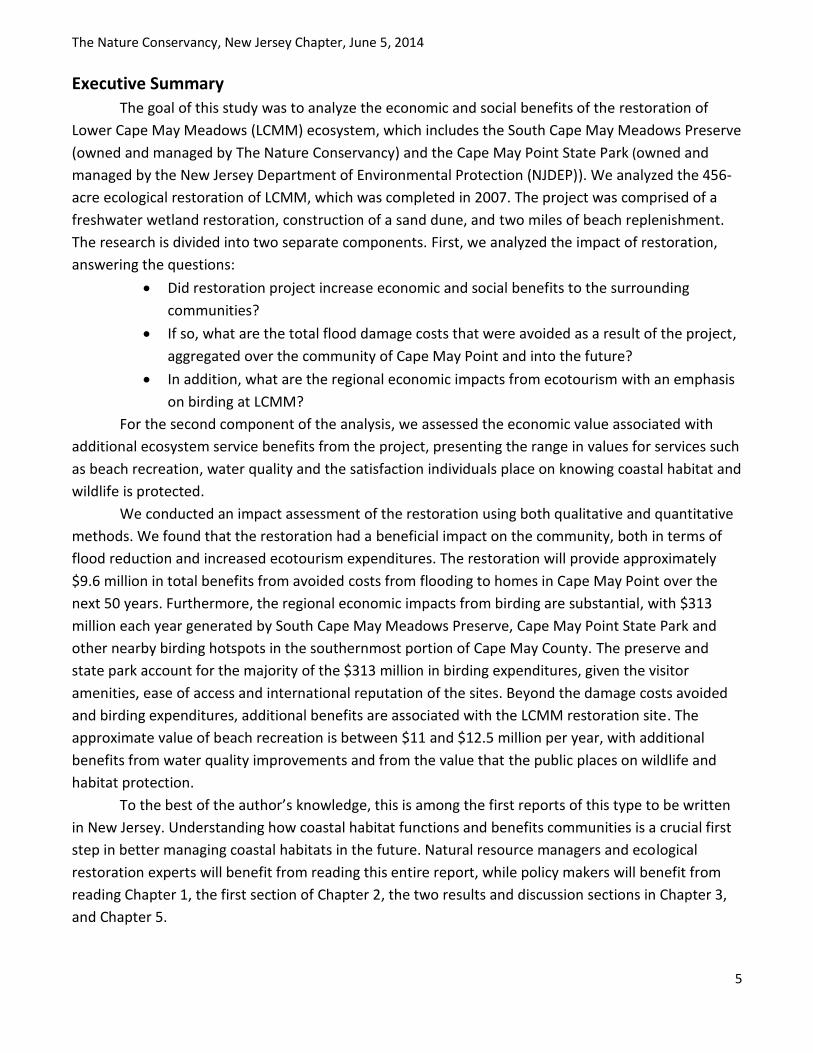
Chapter 2: Background and Overview of Restoration Project
2.1 BACKGROUND
Located at the southern tip of a peninsula, the Lower Cape May Meadows (LCMM) restoration,
which includes Cape May Point State Park and South Cape May Meadows Preserve, is surrounded by
three different communities: Cape May Point to the west, West Cape May to the north, and Cape May
City on the east (refer to Figure 1 for a map). The restoration project and the surrounding towns are
exposed to harsh weather, wind and coastal erosion, and are vulnerable to flooding from storm surge
and rain. The area has experienced numerous hurricanes and nor’easters, with an average of one
major hurricane passing within 100 kilometers every 4.5 years and the number of nor’easters slightly
more frequent (Wu, Yarnal, and Fisher 2002). In addition, an analysis of flood risk found that Cape May
Point lies in the “high risk” to “very high risk” zone, which will be exacerbated by sea level rise (ibid.).
Figure 1. Map of LCMM restoration site and surrounding municipalities
Of the three communities, Cape May Point was selected for analysis in this study because it is a
manageable area, which facilitates the collection of data and increases the probability of getting a
representative sample. It is a small residential municipality comprised of 600 homes, with
The Nature Conservancy, New Jersey Chapter, June 5, 2014
9
approximately one-third of those homes occupied by year-round residents and the remainder
seasonally occupied or rented.
There is a fourth community worthy of mention, yet it does not appear in the map. The town of
South Cape May, once located at the southern portion of The Nature Conservancy’s South Cape May
Meadows Preserve (see Figure 1), was a small but vibrant Victorian resort town.3 After the Great
Atlantic Hurricane of ‘44, however, people began to abandon the town, which was fully deserted by
the mid-fifties. Some homes were moved to Cape May Point or West Cape May, while other homes
were too damaged to be moved. In addition to the complete loss of the town of South Cape May, Cape
May Point also lost many homes, businesses and roads.
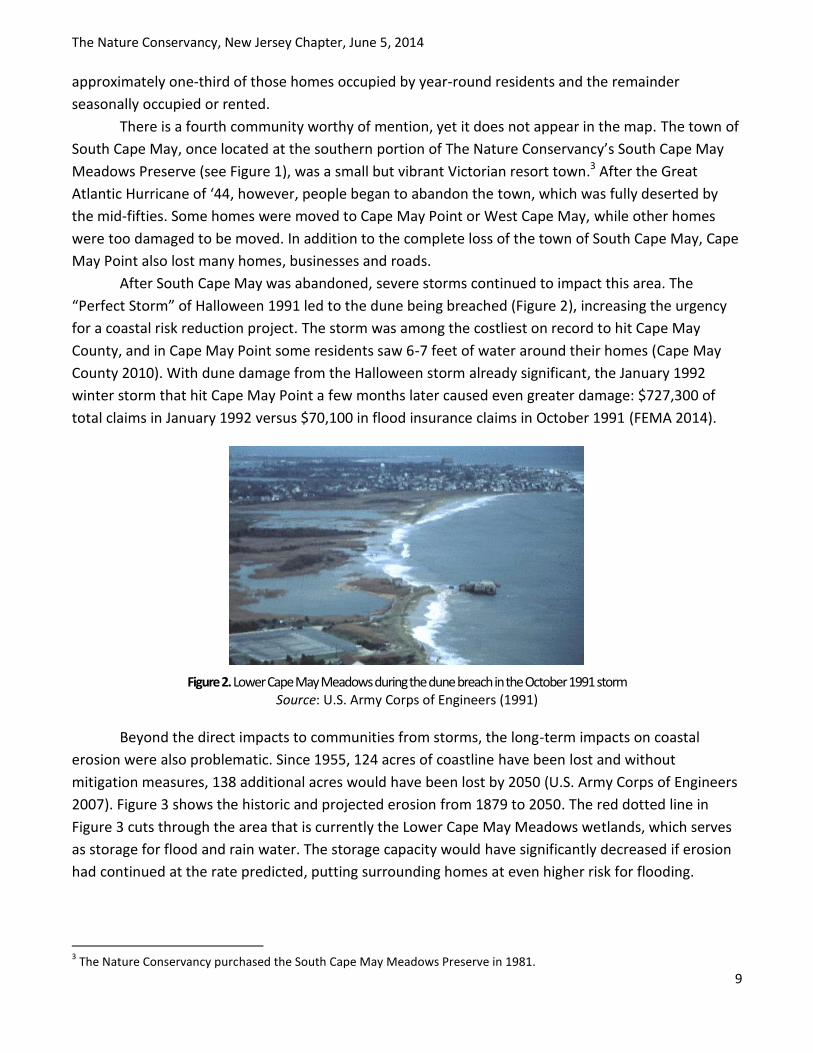
After South Cape May was abandoned, severe storms continued to impact this area. The
“Perfect Storm” of Halloween 1991 led to the dune being breached (Figure 2), increasing the urgency
for a coastal risk reduction project. The storm was among the costliest on record to hit Cape May
County, and in Cape May Point some residents saw 6-7 feet of water around their homes (Cape May
County 2010). With dune damage from the Halloween storm already significant, the January 1992
winter storm that hit Cape May Point a few months later caused even greater damage: $727,300 of
total claims in January 1992 versus $70,100 in flood insurance claims in October 1991 (FEMA 2014).
Figure 2. Lower Cape May Meadows during the dune breach in the October 1991 storm Source: U.S. Army Corps of Engineers (1991)
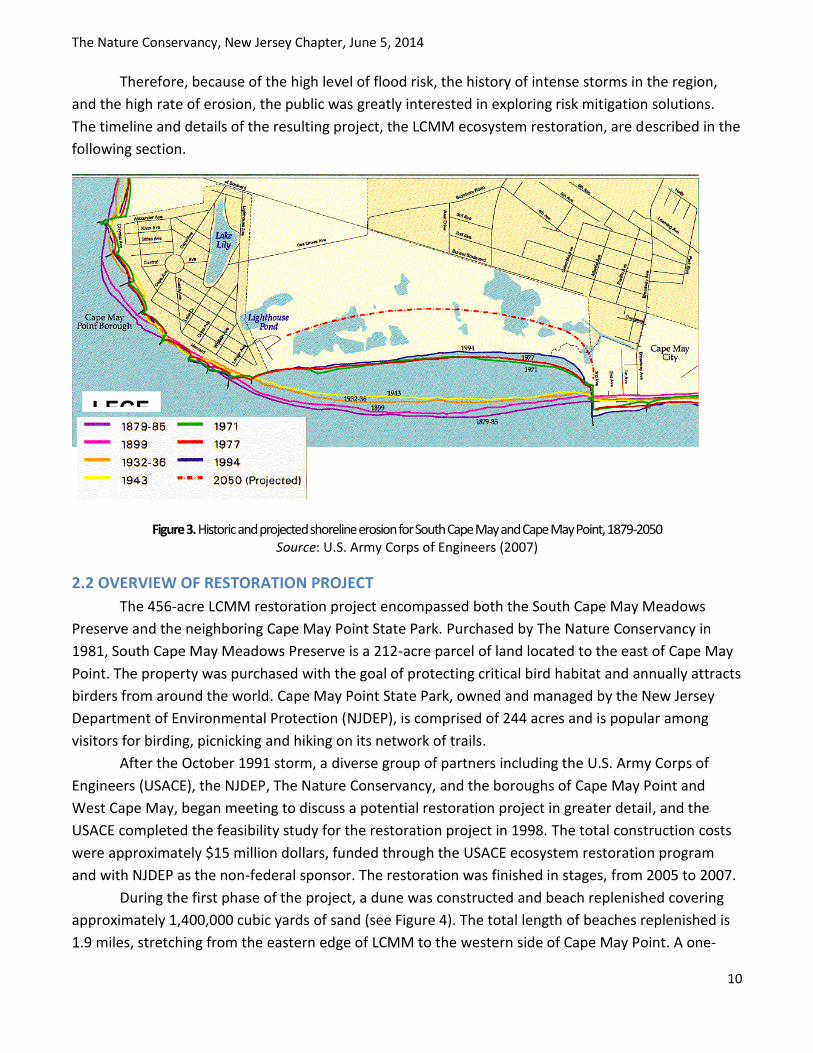
Beyond the direct impacts to communities from storms, the long-term impacts on coastal
erosion were also problematic. Since 1955, 124 acres of coastline have been lost and without
mitigation measures, 138 additional acres would have been lost by 2050 (U.S. Army Corps of Engineers
2007). Figure 3 shows the historic and projected erosion from 1879 to 2050. The red dotted line in
Figure 3 cuts through the area that is currently the Lower Cape May Meadows wetlands, which serves
as storage for flood and rain water. The storage capacity would have significantly decreased if erosion
had continued at the rate predicted, putting surrounding homes at even higher risk for flooding.
3 The Nature Conservancy purchased the South Cape May Meadows Preserve in 1981.
The Nature Conservancy, New Jersey Chapter, June 5, 2014
10
Therefore, because of the high level of flood risk, the history of intense storms in the region,
and the high rate of erosion, the public was greatly interested in exploring risk mitigation solutions.
The timeline and details of the resulting project, the LCMM ecosystem restoration, are described in the
following section.
Figure 3. Historic and projected shoreline erosion for South Cape May and Cape May Point, 1879-2050 Source: U.S. Army Corps of Engineers (2007)
2.2 OVERVIEW OF RESTORATION PROJECT
The 456-acre LCMM restoration project encompassed both the South Cape May Meadows
Preserve and the neighboring Cape May Point State Park. Purchased by The Nature Conservancy in
1981, South Cape May Meadows Preserve is a 212-acre parcel of land located to the east of Cape May
Point. The property was purchased with the goal of protecting critical bird habitat and annually attracts
birders from around the world. Cape May Point State Park, owned and managed by the New Jersey
Department of Environmental Protection (NJDEP), is comprised of 244 acres and is popular among
visitors for birding, picnicking and hiking on its network of trails.
After the October 1991 storm, a diverse group of partners including the U.S. Army Corps of
Engineers (USACE), the NJDEP, The Nature Conservancy, and the boroughs of Cape May Point and
West Cape May, began meeting to discuss a potential restoration project in greater detail, and the
USACE completed the feasibility study for the restoration project in 1998. The total construction costs
were approximately $15 million dollars, funded through the USACE ecosystem restoration program
and with NJDEP as the non-federal sponsor. The restoration was finished in stages, from 2005 to 2007.
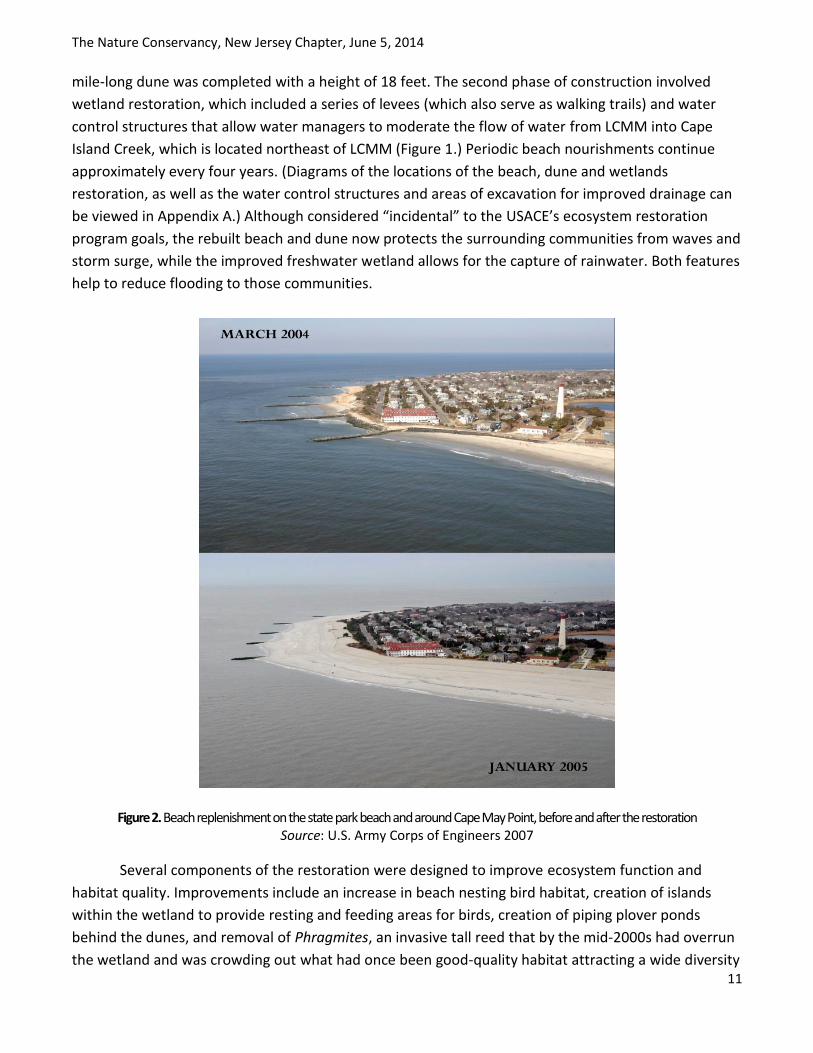
During the first phase of the project, a dune was constructed and beach replenished covering
approximately 1,400,000 cubic yards of sand (see Figure 4). The total length of beaches replenished is
1.9 miles, stretching from the eastern edge of LCMM to the western side of Cape May Point. A one-
LEGE
The Nature Conservancy, New Jersey Chapter, June 5, 2014
11
mile-long dune was completed with a height of 18 feet. The second phase of construction involved
wetland restoration, which included a series of levees (which also serve as walking trails) and water
control structures that allow water managers to moderate the flow of water from LCMM into Cape
Island Creek, which is located northeast of LCMM (Figure 1.) Periodic beach nourishments continue
approximately every four years. (Diagrams of the locations of the beach, dune and wetlands
restoration, as well as the water control structures and areas of excavation for improved drainage can
be viewed in Appendix A.) Although considered “incidental” to the USACE’s ecosystem restoration
program goals, the rebuilt beach and dune now protects the surrounding communities from waves and
storm surge, while the improved freshwater wetland allows for the capture of rainwater. Both features
help to reduce flooding to those communities.
Figure 2. Beach replenishment on the state park beach and around Cape May Point, before and after the restoration Source: U.S. Army Corps of Engineers 2007
Several components of the restoration were designed to improve ecosystem function and
habitat quality. Improvements include an increase in beach nesting bird habitat, creation of islands
within the wetland to provide resting and feeding areas for birds, creation of piping plover ponds
behind the dunes, and removal of Phragmites, an invasive tall reed that by the mid-2000s had overrun
the wetland and was crowding out what had once been good-quality habitat attracting a wide diversity
The Nature Conservancy, New Jersey Chapter, June 5, 2014
12
of migratory birds. Also, prior to the restoration, the wetland water remained confined in stagnant
pools, and each section of the wetland was isolated from the next with no drainage, leading to poor
quality habitat as well as a landscape lacking in aesthetics. A channel was created to allow the flow of
freshwater through the wetland, providing habitat benefits, and into Cape Island Creek. From Cape
Island Creek, the water flows into Cape May Harbor and then into the Atlantic Ocean. These hydrologic
improvements were designed not only to improve habitat quality but to provide benefits to the
surrounding municipalities as well. The ability for the wetland to now capture stormwater and drain
into Cape Island Creek is crucial in terms of risk reduction for communities. Prior to the restoration, the
various sections of the wetlands were blocked without an exit channel for water, and the wetlands
occasionally overflowed during major hurricanes and nor’easters onto Sunset Boulevard, the street just
to the north of the wetland (Schreiner, Personal communication, September 16, 2013).
The Nature Conservancy, New Jersey Chapter, June 5, 2014
13
Chapter 3: Impact Assessment of LCMM Restoration Project
The analysis of the social and economic benefits of the LCMM restoration project is divided into two
separate components, each with distinct methodology, data, analysis and results:
1) In Chapter 3, an impact assessment of the restoration project was conducted to determine
whether the project reduced flooding and increased ecotourism in the area. In addition, if the
project did succeed at increasing benefits, what is the value of the economic benefits
associated with flood reduction and ecotourism, with an emphasis on birding?
2) In Chapter 4, an analysis was conducted to quantify the multiple ecosystem service benefits
beyond flood reduction and regional economic impacts from birding.
3.1 METHODS FOR IMPACT ASSESSMENT
The first portion of this analysis is focused on the impact of the restoration project on the
community, looking at the question of whether social and economic benefits were higher after the
restoration than they were before. More precisely, did the project reduce flooding in Cape May Point
by improving the protective capacity of the habitat, and did it increase ecotourism in the area by
improving critical bird habitat? It is worth noting that damage costs avoided are considered a benefit
when assessing risk reduction projects.
We employed a mixed methods approach based upon primary data sets as well as expert
consultation and stakeholder interviews. Our data comes from the U.S. Army Corps of Engineers
(USACE), Federal Emergency Management Agency’s (FEMA) National Flood Insurance Program (NFIP),
the National Oceanic and Atmospheric Administration (NOAA), and various weather collection stations.
Our interviews took place in fall 2013 and winter 2013-14 with a range of county and municipal
managers, state-level government officials, nonprofit organizations working in the region, community
members, and experts on coastal restoration. All dollar values in this analysis have been converted to
2013 USD using the Bureau of Labor Statistics Consumer Price Index (U.S. Department of Labor 2014a).
Due to limited access to fine-scale data (e.g., parcel-level flood damage values), the lack of a
rigorous pre-restoration analysis and no comparable control site, a mixed-methods approach is
recommended and used for this analysis. By accessing time series data on major storms since 1985 as
well as Cape May County tourism data with interviews and regional statistics, we were able to build the
case regarding the impact of the restoration. We conducted 30 interviews to assess the question of
whether the community is better off due to the restoration and to gain necessary background
information on the science and policies affecting the success of the restoration. A little over half of the
interviews were with individuals with local knowledge and expertise related to the community of Cape
May Point and to the LCMM ecosystem restoration. A little less than half of the interviews were with
subject experts with knowledge of hydrology, weather, storm surge, economics, policy or engineering.
We analyzed the data and the information gained from the interviews to assess the following
questions:

The Nature Conservancy, New Jersey Chapter, June 5, 2014
14
1. Did the community see a reduction in storm surge damage from hurricanes and
nor’easters after the restoration?
2. Did the community experience less damage from precipitation-based flooding after the
restoration?
3. Has the region seen economic benefits from birding related to the restoration?
3.2 FLOOD MITIGATION DATA AND ANALYSIS
While the USACE did conduct an initial economic feasibility assessment for the project in 1998,
the feasibility report only assessed the predicted flood reduction benefits from the beach and dune
restoration and did not include expected benefits from the wetland restoration; nor did they include
any of the additional ecosystem service benefits. This report aims to assess a wider range of economic
benefits that were not quantified in the USACE feasibility study, based upon actual “before and after”
data from the site. To begin to quantify the additional flood reduction benefits associated with the
wetland restoration, we needed to determine which homes in the surrounding communities benefit
from the water storage and drainage capacity of the LCMM wetlands. Local and county engineers who
understand the hydrology and stormwater infrastructure of the region determined the geographic area
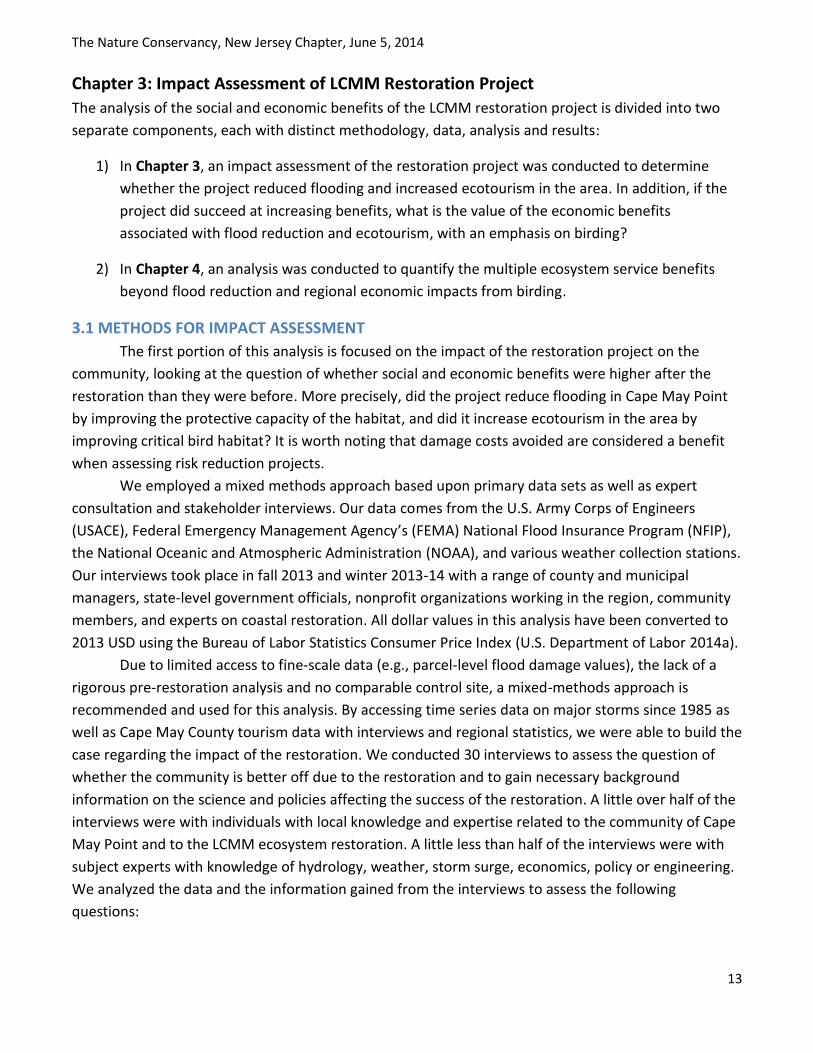
that drains into the wetlands (delineated by a purple line on the map in Figure 5). The delineation is
not exact, but gives us a general sense of the full geographic area benefiting from the storage and
drainage capacity of the wetland system. All of Cape May Point’s 600 homes drain into the wetlands of
LCMM and are the main area of emphasis of our study, for which we have historic damage data. The
restoration also benefits portions of West Cape May and Cape May City that include an additional 710
homes, although we lack historic damage data for those towns. While they are therefore not included
in the analysis in Chapter 3, it is important to recognize that homes in these communities also did
experience benefits from the restoration.
A description of the drainage improvements resulting from the restoration is important to
highlight because it furthers the point that the drainage capacity of the system is engineered to
support an additional reduction in flooding, beyond the flood storage benefits of the wetland system.
Stormwater runoff from Cape May Point flows into Lake Lily (the dark gray shape in Cape May Point in
Figure 5) and then into the Lower Cape May Meadows wetland. After draining into the wetland, most
of the water either infiltrates into the ground or exits through an underground drainage culvert that
connects directly with Cape Island Creek and eventually flows to the ocean.
Because the wetland has a fairly large storage capacity relative to the drainage area, under
normal conditions the flow of water into Cape Island Creek is sufficient for drainage. The flood control
structures in the hydrologic system allow for some flexibility in water management, with options to
increase or decrease the water in the wetlands, and also include back-up drainage options. In extreme
cases, particularly during storm events, water can be pumped from Lake Lily and exit to the northwest
into the Delaware Bay, or can be drained through a release pipe that exits through the dune south of
the state park.
The Nature Conservancy, New Jersey Chapter, June 5, 2014
15
To calculate the flood reduction benefits of the project, we next collected a variety of weather
and NFIP claim data specific to our site. One major cause of damage in coastal storms is storm surge,
though it is nearly impossible to obtain parcel-level storm surge data for Cape May Point for the time
period in question – 1985-2013.4 Therefore, storm surge data was obtained from the National Oceanic
and Atmospheric Administration’s (NOAA) tide gauge at the Cape May Ferry Terminal, immediately
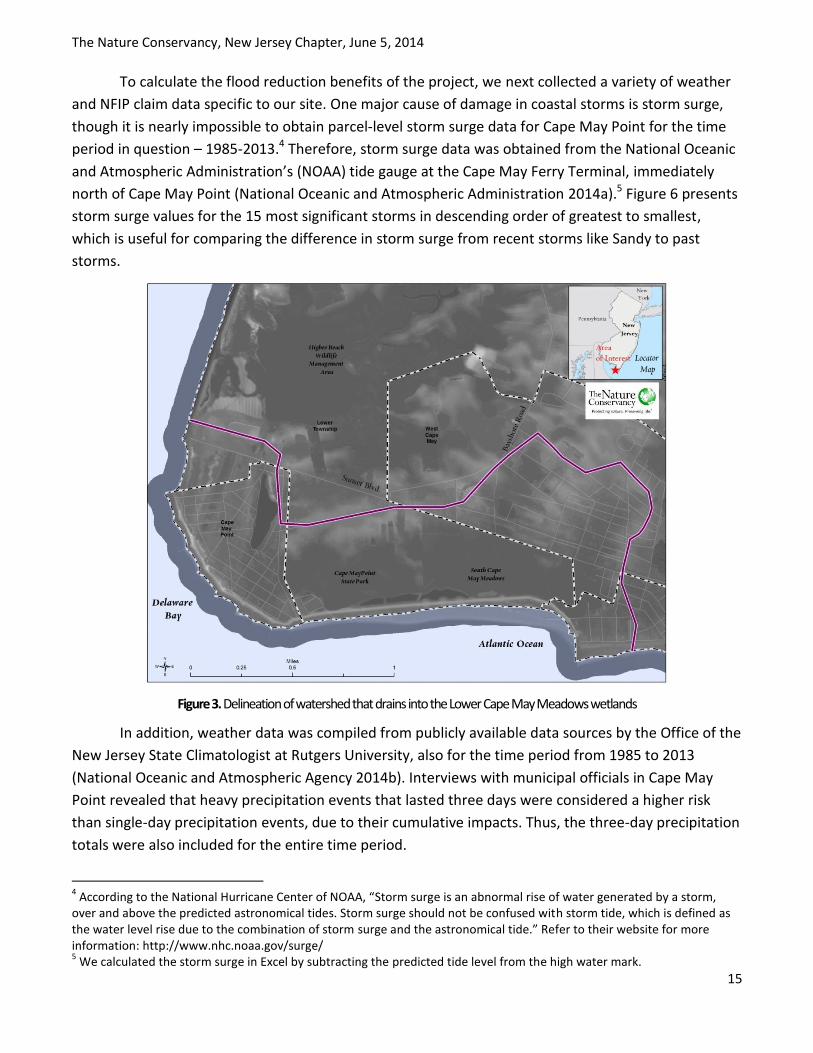
north of Cape May Point (National Oceanic and Atmospheric Administration 2014a).5 Figure 6 presents
storm surge values for the 15 most significant storms in descending order of greatest to smallest,
which is useful for comparing the difference in storm surge from recent storms like Sandy to past
storms.
Figure 3. Delineation of watershed that drains into the Lower Cape May Meadows wetlands
In addition, weather data was compiled from publicly available data sources by the Office of the
New Jersey State Climatologist at Rutgers University, also for the time period from 1985 to 2013
(National Oceanic and Atmospheric Agency 2014b). Interviews with municipal officials in Cape May
Point revealed that heavy precipitation events that lasted three days were considered a higher risk
than single-day precipitation events, due to their cumulative impacts. Thus, the three-day precipitation
totals were also included for the entire time period.
4 According to the National Hurricane Center of NOAA, “Storm surge is an abnormal rise of water generated by a storm,
over and above the predicted astronomical tides. Storm surge should not be confused with storm tide, which is defined as the water level rise due to the combination of storm surge and the astronomical tide.” Refer to their website for more information: http://www.nhc.noaa.gov/surge/ 5 We calculated the storm surge in Excel by subtracting the predicted tide level from the high water mark.
The Nature Conservancy, New Jersey Chapter, June 5, 2014
16
The three-day total precipitation data provides additional insights into the analysis. First, it
highlights that during Superstorm Sandy, the community experienced the largest amount of
precipitation for any storm event in Cape May Point during the time period. The second greatest
amount of precipitation over a three-day window was during Hurricane Irene in August 2011. Thus, the
two greatest precipitation events since 1985 occurred after the restoration was completed. Also,
looking back at the storm surge data, Cape May Point experienced at least four storm events after the
restoration with tidal levels in the moderate to major flooding range, according to NOAA’s
categorization of storm surge. Thus, the precipitation and storm surge conditions after the Lower Cape
May Meadows restoration project have offered several opportunities to test the capacity of the
restored site to buffer against flood damage.
Figure 6. Storms in Cape May Point by magnitude of storm surge (1985-2013)
To identify the storms with the greatest level of damage, we obtained FEMA data from Cape
May Point on the total value of NFIP claims on major storms since 1985 (FEMA 2014). Storms were
classified as “major” if community members reported the storm as having a notable impact on them
and/or if the storm was reported in the Cape May County Hazard Mitigation Plan (Cape May County
2010). We obtained the total value of NFIP claims paid out to Cape May Point for the entire time
period over which they’ve maintained data (FEMA 2014). The total value of claims in our dataset
represents 94 percent of the total value of claims, which provides a truly representative sample of
major storms during a nearly 30 year period. The flood damage values were aggregated on a per storm
0.00 0.50 1.00 1.50 2.00 2.50 3.00 3.50 4.00
September 2011 (Lee)
May 1989
February 2006
November 1991
September 1999 (Floyd)
August 2011 (Irene)
January 1998
November 2009
October 1991 ("Perfect Storm")
January 1996
January 1992
February 1998
October 2012 (Sandy)
December 1992
September/October 1985 (Gloria)
Storm surge
The Nature Conservancy, New Jersey Chapter, June 5, 2014
17
basis for all homes in Cape May Point. The flood damage represented by this number is a likely an
underestimate of actual flood damage because many homeowners who do not have a mortgage do
not have flood insurance, even if they are located in an area of frequent flooding, and those with
insurance do not always file a claim for damage. The NFIP flood claim amounts also do not include
damage to public property, and we did not include additional data on damage to public property due
to lack of availability.
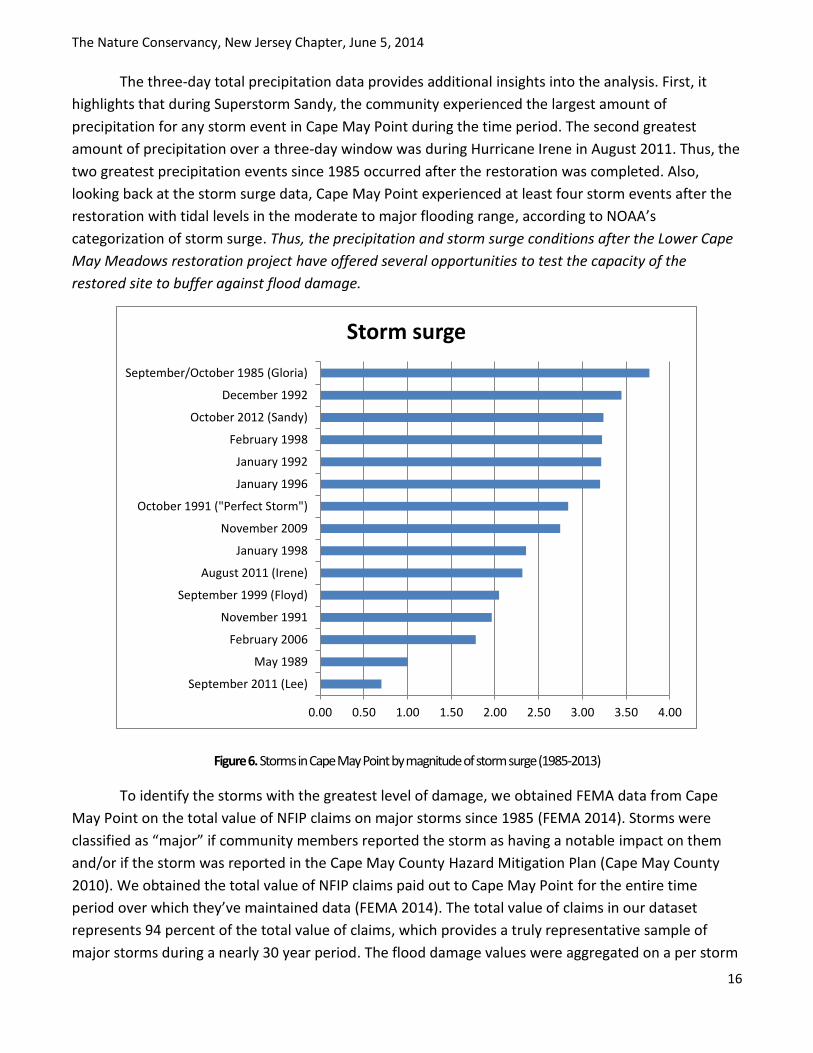
Table 1 presents the data on NFIP insurance claims, precipitation and storm surge for Cape May
Point from 1985-2013. The February 2006 row is highlighted in blue to indicate that construction was
taking place during that time period; the restoration project began in 2005 and was completed in 2007.
The analysis of data from Table 1 is presented in the following section, where we assessed the patterns
in the data to determine if the flood damage to homes in the Borough of Cape May Point was worse
before the LCMM ecosystem restoration or after, all else being equal.
Table 1. NFIP damage claims and weather data from Cape May Point, selected storms since 1985
(The blue highlighted row indicates that the restoration was taking place during that time period)
Event time # of claims Total paid
Average per claim
Precipitation (inches)6
3-day total (inches)
Storm surge (feet)
September/October 1985 (Gloria) 17 $154,903 $9,112 2.21 4.15 3.77
May 1989 0 $0.00 $0.00 0.46 0.48 1.00
October 1991 ("Perfect Storm") 11 $70,113 $6,374 1.3 1.38 2.84
November 1991 0 $0.00 $0.00 0.58 0.66 1.96
January 1992 34 $727,255 $21,390 0.59 0.59 3.22
December 1992 4 $21,577 $5,394 1.12 1.84 3.45
January 1996 1 $384 $384 1.01 1.29 3.20
January 1998 1 $8,510 $8,510 2.62 2.62 2.36
February 1998 3 $23,250 $7,750 1.04 1.23 3.22
September 1999 (Floyd) 0 $0.00 $0.00 2.15 3.06 2.00
February 2006 0 $0.00 $0.00 0.71 1.02 1.78
November 2009 0 $0.00 $0.00 1.25 1.89 2.75
August 2011 (Irene) 0 $0.00 $0.00 4.32 6.06 2.31
September 2011 (Lee) 0 $0.00 $0.00 1.07 1.18 0.70
October 2012 (Sandy) 2 $6,290 $3,145 8.9 10.01 3.24
3.3 FLOOD MITIGATION RESULTS AND DISCUSSION
Based upon Table 1, when looking at the relationship between storm surge and the total claims
paid over time, we can see that pre-restoration, major storms that had more than two feet of storm
surge all led to claims. However, after the restoration, only Sandy led to claims, while the two storms—
Hurricane Irene and the November 2009 storm—with 2.31 and 2.75 feet storm surge respectively had
no claims. In other words, the November 2009 storm and Hurricane Irene, based upon storm surge,
6 The precipitation category is for a single day during a storm; if a storm lasted for several days, then the precipitation for
the maximum single day during a storm event was selected for the table. Also, for storm surge, if the storm lasted for more than one day, we selected the maximum storm surge during the storm event.

The Nature Conservancy, New Jersey Chapter, June 5, 2014
18
would have caused damage before the restoration, yet had $0 in NFIP claims. In addition, Figure 7
shows how the average pre- and post-restoration flood damage in the range of 2.5-4 feet is
dramatically reduced.
Looking at the precipitation with respect to the total claims paid pre-restoration, major storms
with precipitation larger than 0.5 inches all had claims except for Hurricane Floyd. That means that
seven out of eight incidents pre-restoration with at least 0.5 inches of precipitation led to damage.
Post-restoration, the three major storms pre-Sandy all had greater than 0.5 inches precipitation, but
none led to claims. Hurricane Irene had a much larger level of precipitation (over four inches) than all
major storms except for Sandy, but again, did not lead to any claims.
Figure 7. Average total claims for Cape May Point per major storm pre- and post-restoration LCMM. *Only the total claims for major storms with storm surge between 2.5 – 4 feet are shown,
as the claims for storms with storm surge of less than 2.5 feet were extremely small or none.
We see a similar pattern in three-day total precipitation versus the total claims paid as well:
pre-restoration, there were several claims from three-day total precipitation levels of over 1.5 inches,
but post-restoration, except for Sandy, there no claims for major storms with similar or larger three-
day totals.
Returning to Superstorm Sandy, the total value of claims was among the lowest since 1985
even though it had the highest precipitation, the highest three-day total precipitation, and the third
highest storm surge (after Gloria and the December 1992 storm) in the post-1985 history. Comparing
Superstorm Sandy to the Nor’easter of January 1992, they had nearly equivalent levels of storm surge
while Superstorm Sandy experienced over 15 times more rain over a three-day period, yet the claims
amount from Sandy was only one percent of that of the 1992 storm (Table 2).
Given the available information, a pattern emerges: lower or no claims resulted after the
restoration for comparable storms. For Superstorm Sandy, a storm that was among the most severe in
history, the claims were an order of magnitude lower than one would expect from the pre-restoration
experience, thus confirming the flood reduction benefits of the restoration project. The information
$143,713
$3,145
$-
$50,000
$100,000
$150,000
Damage before the restoration Damage after the restoration
Average damage (in $) per storm with storm surge above 2.5 feet*
The Nature Conservancy, New Jersey Chapter, June 5, 2014
19
provided by community officials from Cape May Point through our interviews corroborates the data
from Table 1.
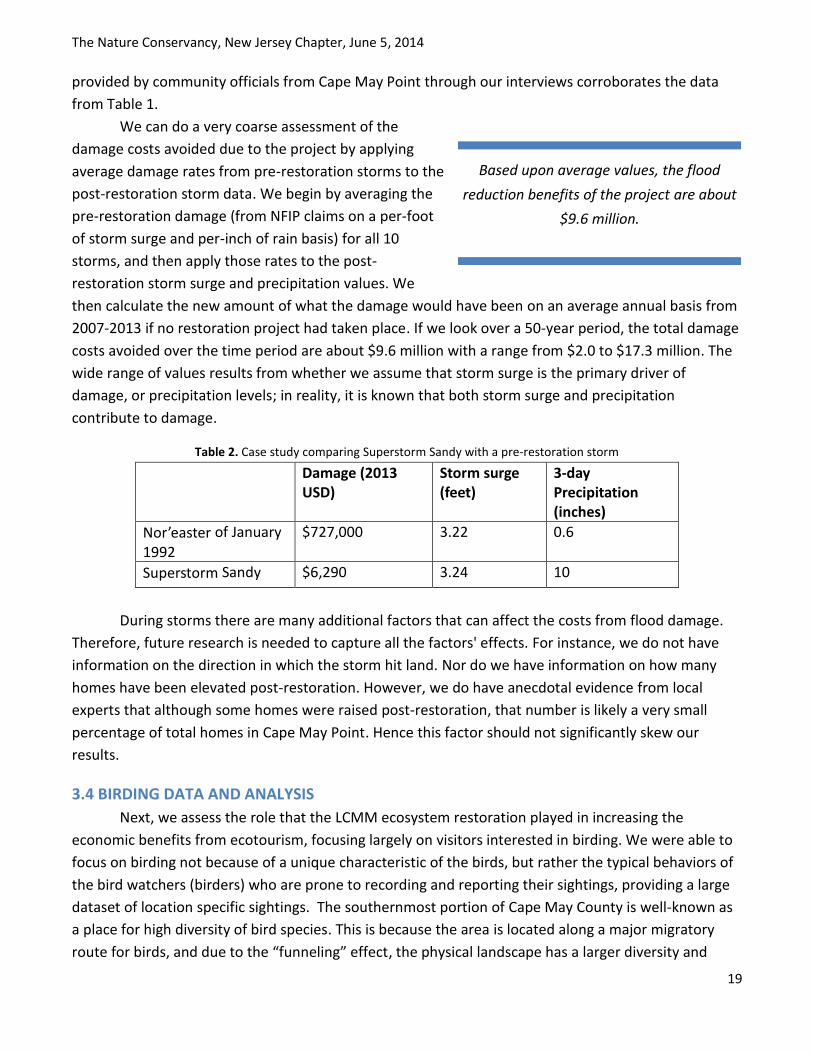
We can do a very coarse assessment of the
damage costs avoided due to the project by applying
average damage rates from pre-restoration storms to the
post-restoration storm data. We begin by averaging the
pre-restoration damage (from NFIP claims on a per-foot
of storm surge and per-inch of rain basis) for all 10
storms, and then apply those rates to the post-
restoration storm surge and precipitation values. We
then calculate the new amount of what the damage would have been on an average annual basis from
2007-2013 if no restoration project had taken place. If we look over a 50-year period, the total damage
costs avoided over the time period are about $9.6 million with a range from $2.0 to $17.3 million. The
wide range of values results from whether we assume that storm surge is the primary driver of
damage, or precipitation levels; in reality, it is known that both storm surge and precipitation
contribute to damage.
Table 2. Case study comparing Superstorm Sandy with a pre-restoration storm
Damage (2013 USD)
Storm surge (feet)
3-day Precipitation (inches)
Nor’easter of January
1992
$727,000 3.22 0.6
Superstorm Sandy $6,290 3.24 10
During storms there are many additional factors that can affect the costs from flood damage.
Therefore, future research is needed to capture all the factors' effects. For instance, we do not have
information on the direction in which the storm hit land. Nor do we have information on how many
homes have been elevated post-restoration. However, we do have anecdotal evidence from local
experts that although some homes were raised post-restoration, that number is likely a very small
percentage of total homes in Cape May Point. Hence this factor should not significantly skew our
results.
3.4 BIRDING DATA AND ANALYSIS
Next, we assess the role that the LCMM ecosystem restoration played in increasing the
economic benefits from ecotourism, focusing largely on visitors interested in birding. We were able to
focus on birding not because of a unique characteristic of the birds, but rather the typical behaviors of
the bird watchers (birders) who are prone to recording and reporting their sightings, providing a large
dataset of location specific sightings. The southernmost portion of Cape May County is well-known as
a place for high diversity of bird species. This is because the area is located along a major migratory
route for birds, and due to the “funneling” effect, the physical landscape has a larger diversity and
Based upon average values, the flood
reduction benefits of the project are about
$9.6 million.
The Nature Conservancy, New Jersey Chapter, June 5, 2014
20
abundance of birds. By funneling effect, we are referring the to the concept that birds prefer to
maximize the amount of time they fly over land before crossing the Delaware Bay, and the LCMM area
is the shortest distance from the state of Delaware. However, not all areas where diverse species of
birds are found are easily accessible to the public. Thus, improving the habitat quality in the area,
increasing public access and improving trail quality attract additional visitors. Increasing the number of
visitors from outside of the region leads to more expenditures in local restaurants, hotels and other
establishments such as a bike rental shops. This leads to positive impacts for the community in terms
of increased revenues, as well as maintaining employment or creating new jobs.
Therefore, first we move to the question of habitat quality: was there a change in habitat
quality after the restoration? One of the stated goals of the LCMM restoration was to improve and
diversify bird habitat within Cape May Point State Park and South Cape May Meadows Preserve.
Habitat restoration measures included reconnected stream flow, creation of freshwater ponds (within
the impounded wetland), and control of Phragmites, a common reed that is an invasive species. This
creation of a diverse marsh complex provided exposed mudflat, shallow water feeding areas and
deeper sections of open water, leading to an augmented feeding area and expanded habitat area for a
variety of waterbird species. The restoration also created new ponds for piping plovers, a state
endangered and federally threatened species. These plover ponds were designed to reduce exposure
of piping plovers to disturbance by human activities on the beach, which allows uninterrupted feeding
and thereby increases the probability of survival for plover chicks. Finally, the restoration increased
beach height and width, extending the beach habitat available for beach nesting birds. Thus, the
restoration created at least three new habitat types, as well as enhanced beach habitat, all of which
benefited critical wildlife species.
Then, more specifically, how did the improved habitat affect bird abundance, species diversity,
and birding opportunities? To assess these changes after the ecological restoration, we used the
Cornell Lab of Ornithology’s web-based bird sightings database, eBird (eBird 2014). The eBird database
allows users to select data based upon the specific site of interest. We used the database to examine
bird sightings for a six-year period (1999-2004) before the restoration and in the seven-year period
(2007-2013) following the restoration project to detect trends in species diversity and abundance of all
reported species.
In general, there was an increase in both number of bird species and their abundance. In
addition, no species were “lost” - that is, reported before but not after the restoration. The overall
number of species recorded prior to the project saw a notable increase after the project’s completion,
from 191 species to 319 at South Cape May Meadows Preserve and from 266 to 333 at Cape May Point
State Park. Groups of birds most benefitted by the improvements to the wetland were shorebirds and
waterfowl, including least sandpipers, greater and lesser yellow legs, northern shoveler and pied billed
grebe. Each of these birds was sighted nearly twice as often after the restoration was completed.
These facts point to success of the project in increasing and improving existing habitats for bird
species, as well as creation of new habitat, which attracted new species of birds to the restoration
sites. However, the increase is also partially a result of improvement of the eBird interface, including
the new ability to report sightings via mobile technology, and an increase in eBird popularity among
The Nature Conservancy, New Jersey Chapter, June 5, 2014
21
birders. Also, we were not able to account for the variability among birding trips, i.e., different lengths
of trips.
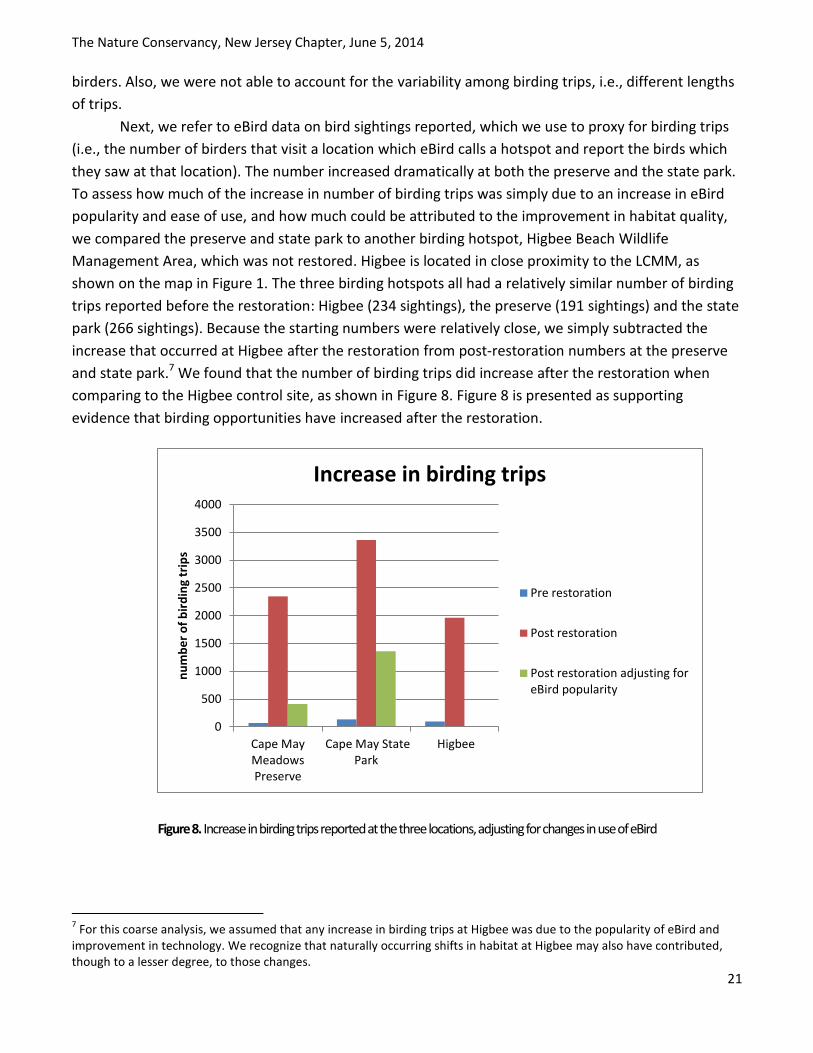
Next, we refer to eBird data on bird sightings reported, which we use to proxy for birding trips
(i.e., the number of birders that visit a location which eBird calls a hotspot and report the birds which
they saw at that location). The number increased dramatically at both the preserve and the state park.
To assess how much of the increase in number of birding trips was simply due to an increase in eBird
popularity and ease of use, and how much could be attributed to the improvement in habitat quality,
we compared the preserve and state park to another birding hotspot, Higbee Beach Wildlife
Management Area, which was not restored. Higbee is located in close proximity to the LCMM, as
shown on the map in Figure 1. The three birding hotspots all had a relatively similar number of birding
trips reported before the restoration: Higbee (234 sightings), the preserve (191 sightings) and the state
park (266 sightings). Because the starting numbers were relatively close, we simply subtracted the
increase that occurred at Higbee after the restoration from post-restoration numbers at the preserve
and state park.7 We found that the number of birding trips did increase after the restoration when
comparing to the Higbee control site, as shown in Figure 8. Figure 8 is presented as supporting
evidence that birding opportunities have increased after the restoration.
Figure 8. Increase in birding trips reported at the three locations, adjusting for changes in use of eBird
7 For this coarse analysis, we assumed that any increase in birding trips at Higbee was due to the popularity of eBird and
improvement in technology. We recognize that naturally occurring shifts in habitat at Higbee may also have contributed, though to a lesser degree, to those changes.
0
500
1000
1500
2000
2500
3000
3500
4000
Cape MayMeadowsPreserve
Cape May StatePark
Higbee
nu
mb
er
of
bir
din
g tr
ips
Increase in birding trips
Pre restoration
Post restoration
Post restoration adjusting foreBird popularity
The Nature Conservancy, New Jersey Chapter, June 5, 2014
22
3.5 ECOTOURISM METHODS, DATA AND ANALYSIS
This next section delves deeper into the economic value of ecotourism and birding. We focus
on birding because it is the most popular, well-known form of wildlife viewing in the region and based
upon data availability.8 The goal of this section is to quantify the regional economic impact of birding
expenditures in Cape May County. When conducting regional economic impact studies, the goal is to
determine the additional impact of the intervention in question. In this case, the intervention is both
the protection and restoration of LCMM. If local community members visit the site daily, then we make
the assumption that they are already spending a given percentage of their household budget in Cape
May County and thus we would not expect spending by local community members to lead to
additional economic benefits. Therefore, the important aspect to consider is that the visitors are from
outside of the region and that their regional expenditures have a positive net impact on the economy.
Refer to Appendix B for more information on methods related to economic impact assessments.
To help understand the role of birding visitors to the LCMM Ecosystem Restoration, relative to
tourism as a whole, we obtained data on tourism and ecotourism in Cape May County. The tourism
industry is a major economic driver for the county. It is worth $5.2 billion annually, attracts 12.4 million
visitors each year to its pristine beaches, activities, and natural resources, and accounts for 47 percent
of total jobs (Cape May County 2013). Since data collection began in 1994, the economic impact of
tourism on the county has been growing each year (ibid.). With regard to ecotourism specifically in
Cape May County, different studies have found that:
10 percent of visitors to Cape May County indicated that birding is the most important
factor for choosing the county as their destination, and about 11 percent of visitors
reported going birding during their current trip.9 (ibid.)
Wildlife viewing accounts for about $522 million in visitor expenditures each year in
Cape May County, or about 12 percent of total tourism expenditures for 2006
(Perniciaro 2006).
Birders in the Cape May region spend an average of $662 per trip for direct expenses
such as hotels, restaurants, tours and travel (Eubanks, Stoll and Kerlinger 2000).10
The next step of our assessment was to determine the economic impact from birding at LCMM.
This is accomplished first by determining the number of visitors to LCMM from outside of the region.
No precise numbers are available on the number of annual birders to LCMM. Thus, we will refer to the
Cape May County tourism department survey numbers for the county and for Cape May City,
extrapolating the numbers to apply to the area immediately surrounding Cape May City (i.e., the area
8 In addition to birding, a variety other wildlife are also available for viewing at the LCMM restoration site, such as moths
and butterflies (particularly during their popular monarch migration in the fall), several species of mammal including river otter, rabbits and muskrat, and even reptiles including frogs, turtles and snakes. 9 The surveys were conducted by the Cape May County Department of Tourism. About half of the survey respondents were
emailed the survey and the remaining half were in-person intercept surveys at various locations throughout Cape May, with a total of 2,590 completed surveys. 10
The authors based the study on primary data collection from 600 visitor surveys from 2000 regarding spending on birding and horseshoe crab viewing in Cape May and Cumberland counties (Eubanks, Stoll and Kerlinger 2000).
The Nature Conservancy, New Jersey Chapter, June 5, 2014
23
south of the canal, also known as Cape Island). Given that Cape May City is the southernmost city in
Cape May County and one can reach the state park and the preserve in just minutes by bike or car, the
economic impact as quantified by this method will be close to the actual value of the impact from
LCMM11. Using this method means that we also included visitors to other sites such as Higbee Beach
Wildlife Management Area. However, we do know that the two sites within LCMM are among the
more popular birding hotspots in southern Cape May County and are highly accessible to the public,
meaning that a majority of birders visiting this area visit LCMM.
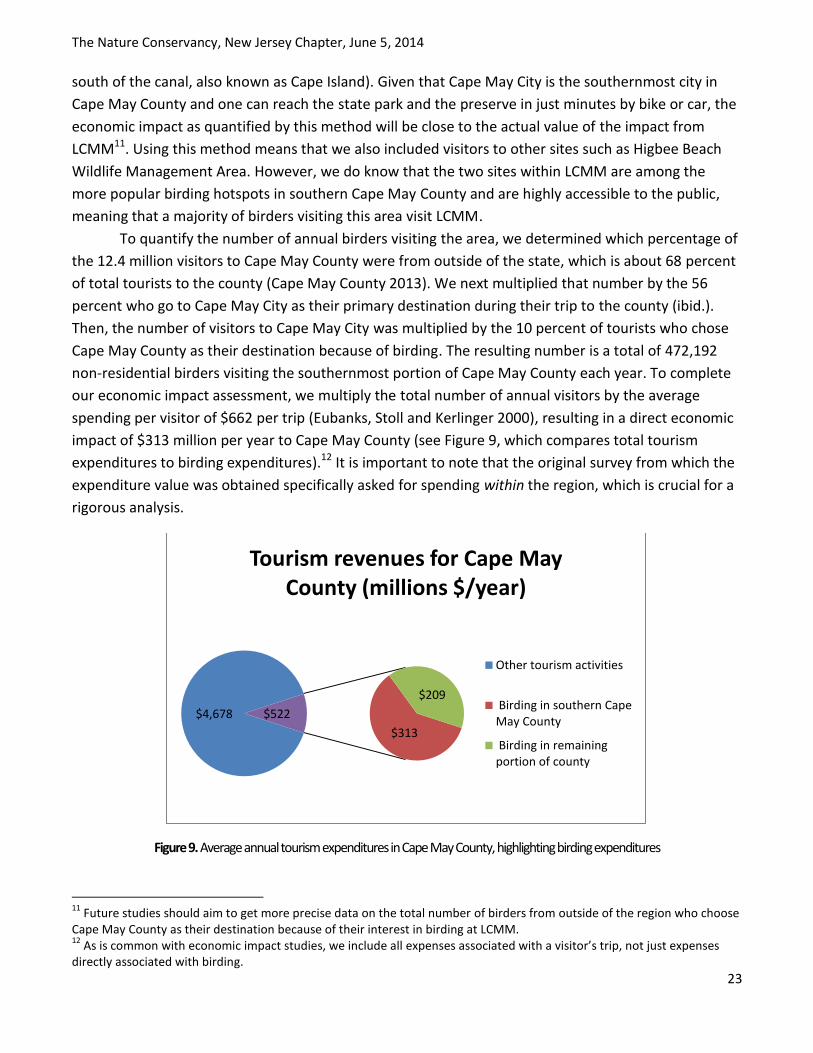
To quantify the number of annual birders visiting the area, we determined which percentage of
the 12.4 million visitors to Cape May County were from outside of the state, which is about 68 percent
of total tourists to the county (Cape May County 2013). We next multiplied that number by the 56
percent who go to Cape May City as their primary destination during their trip to the county (ibid.).
Then, the number of visitors to Cape May City was multiplied by the 10 percent of tourists who chose
Cape May County as their destination because of birding. The resulting number is a total of 472,192
non-residential birders visiting the southernmost portion of Cape May County each year. To complete
our economic impact assessment, we multiply the total number of annual visitors by the average
spending per visitor of $662 per trip (Eubanks, Stoll and Kerlinger 2000), resulting in a direct economic
impact of $313 million per year to Cape May County (see Figure 9, which compares total tourism
expenditures to birding expenditures).12 It is important to note that the original survey from which the
expenditure value was obtained specifically asked for spending within the region, which is crucial for a
rigorous analysis.
Figure 9. Average annual tourism expenditures in Cape May County, highlighting birding expenditures
11
Future studies should aim to get more precise data on the total number of birders from outside of the region who choose Cape May County as their destination because of their interest in birding at LCMM. 12
As is common with economic impact studies, we include all expenses associated with a visitor’s trip, not just expenses directly associated with birding.
$4,678
$313
$209
$522
Tourism revenues for Cape May County (millions $/year)
Other tourism activities
Birding in southern CapeMay County
Birding in remainingportion of county
The Nature Conservancy, New Jersey Chapter, June 5, 2014
24
3.6 ECOTOURISM AND BIRDING RESULTS AND DISCUSSION
This section summarizes the results from the birding and ecotourism analyses and provides
additional discussion on the significance of birding to the regional economy. The general trends show
that there was an increase in bird abundance and diversity after the restoration. Although we do not
have enough data to analyze the statistical significance of those increases in post-restoration bird
numbers, the overall patterns still suggests an increase in numbers. Further, based upon the eBird
data, we know that the number of reported bird sightings increased dramatically after the restoration
even when adjusting for the change in technology.
An increase in the number of bird sightings implies that the total number of birders increased
after the restoration. There is additional evidence that the number of visitors to the Conservancy’s
South Cape May Meadows Preserve did increase after the restoration. Visitor amenities like a larger
parking lot, observation tower, and higher, wider trails made the site more visible and accessible to
area visitors and birders alike, and in 2013, the site saw more than 90,000 visitors. Although The
Nature Conservancy did not keep detailed records of number of visitors before 2013, there is ample
anecdotal evidence to suggest that due to the improvement in amenities, the number of visitors in
2013 represents a dramatic increase from the number of visitors prior to the restoration.
We have shown that the regional economic impact from birding in the southernmost point of
Cape May County is about $313 million per year, with LCMM contributing a majority of that total value.
There is great competition among communities along the mid-Atlantic coast of the United States to
attract additional visitors each year, and thus the quality of birding is likely one factor playing a role in
differentiating Cape May County from other tourist destinations in the Mid-Atlantic region. Keeping in
mind that 10 percent of visitors surveyed reported that birding was the most important factor for
choosing the county as their destination, we can infer that many of these visitors chose Cape May
County over other counties due to its reputation for high-quality birding. Moreover, the reported
economic impact of $313 million per year may be an underestimate since we do not apply the
multiplier effect in an effort to provide a more conservative number. (For reference, the Eubanks, Stoll
and Kerlinger study applied a multiplier effect of 2.0.)13
The LCMM ecosystem restoration is playing a vital role in the resilience of the tourism industry
in the county. The tourism industry as a whole is not highly resilient to damages from hurricanes.
County-wide infrastructure damage from Superstorm Sandy (in October 2012) was estimated at $640
million (Cape May County 2013). The media also portrayed a picture of a devastated Jersey Shore,
worrying Cape May County business owners that tourists would avoid visiting the beach during
summer 2013 due to the misconception that all coastal communities had not yet recovered from
Sandy. From the Cape May County Tourism Booklet, this paragraphs sums up the concern:
13
An increase in regional expenditures has a “multiplier” effect as well, also thought of as a “re-spending” effect, on the regional economy. This is best illustrated by a simple example. When birders visit local restaurants, they increase the revenues earned by these restaurants. Restaurants may now be able to renovate or remodel their facility. They can hire local contractors, who then have additional income. The local contractors then can spend their additional income in local retail stores. All of these additional, indirect economic impacts are captured by the multiplier effect.
The Nature Conservancy, New Jersey Chapter, June 5, 2014
25
“For months, every time Sandy was mentioned in the media, the same horrific images appeared.
Unfortunately, some reports were inaccurate and the images went viral…Very few news
features told of the rebuilding and if they did, it usually ended with images of
destruction…Losing customers to other tourism destinations is a real possibility, and once the
tradition has been broken, it will be costly to win them back.” (Cape May County 2013, p3)
Given the concern for losing tourism revenues not just immediately after Sandy, but potentially
for many years into the future, building resiliency into the tourism industry is of considerable value to
the region. The Nature Conservancy’s South Cape May Meadows Preserve had no damage from Sandy,
nor did it close due to the hurricane. Cape May State Park staff also indicated that they received
virtually no damage from Sandy except for a few fallen tree limbs, and the park was only closed for one
day after the storm to clean up the fallen branches. Further, the birding season extends into the fall,
even after the regular tourism season has ended, and begins in the spring before summer tourists
usually arrive, allowing restaurant and hotel owners to extend into the “shoulder season” and increase
their opportunities for revenues. Thus, ecotourism has the potential to increase the resilience of the
tourist industry in two ways: first because open space tends to recover more quickly after a disaster
than built infrastructure, and second because ecotourism helps to extend the tourism season.
The Nature Conservancy, New Jersey Chapter, June 5, 2014
26
Chapter 4: Multiple ecosystem service benefits from Lower Cape May Meadows
The impact assessment in the previous chapter analyzed whether or not there was an
improvement to communities due to the restoration project, focusing on the economic benefits from
damage costs avoided from flooding and regional economic impacts from ecotourism. This chapter
focuses on the ecosystem service benefits beyond the aforementioned ones from the restoration of
LCMM; it also characterizes the benefits derived from the continued existence of LCMM as a protected
area. Ecosystem service benefits can be described as the goods and services provided to people by
nature and natural processes and can include non-use values, such as the satisfaction that people place
on knowing that nature is protected because it has intrinsic value.
4.1 METHODS FOR QUANTIFYING MULTIPLE BENEFITS FROM LCMM
Although there are no natural resources that can be extracted from the LCMM—no fishing,
agriculture, or other goods that are consumed and thus easily quantified—there are numerous non-
marketable benefits that people derive from LCMM. These multiple benefits include habitat and water
quality, the attractive view, wildlife viewing, and beaches good for walking, birding and swimming. To
capture many of the non-market values that visitors appreciate, we use benefit transfer to apply values
derived from studies using methods such as contingent valuation and travel cost.14 Benefit transfer, a
well-developed methodology used in environmental economics, can be defined as the monetary value
quantified for a particular ecosystem service benefit based upon primary data collected at one site
being applied to a different site with similar characteristics. Please refer to Appendix B with for more
information on methods for valuing ecosystem service benefits.
There are certain challenges to using benefit transfer to quantify the value of ecosystem service
benefits, such as a lack of peer-reviewed and published studies and a limited number of studies with
similar conditions to the LCMM ecosystem restoration. There are a small number of valuation studies
available with location-specific data similar to our study site, and we have carefully selected the most
relevant studies. However, the results in this chapter are not meant to represent an exact dollar value
associated with the LCMM project. We give a range of potential values, which is important for policy
makers and other decision makers because without having a general sense of the value of ecosystem
services, their value is assumed to be zero. The frequent underestimation of the value of ecosystem
services leads to economically inefficient solutions, and often leads to a loss of ecosystem services that
provide significant benefits to communities. Thus, it is crucial to place approximate estimates on
ecosystem service benefits as a placeholder until additional scientific studies can be conducted to
further validate these numbers.
The exact value of ecosystem service benefits varies based upon local ecological, political,
demographic and economic drivers, and upon the habitat types present at the site. In order to most
accurately transfer the economic benefits across habitat types, these local conditions and drivers
should be consistent across study areas. Therefore, we looked for previous studies with habitat types
that are similar to the Atlantic coast of New Jersey, which is characterized as highly developed, and
14
All dollar values in this chapter have been converted to 2013 USD using the Bureau of Labor Statistics CPI Inflation Calculator (U.S. Department of Labor 2014b).
The Nature Conservancy, New Jersey Chapter, June 5, 2014
27
with a high dependence on coastal-related tourism. The habitat types in LCMM used to calculate the
ecosystem service benefits include the wetlands, dune and beach area within the Cape May Point State
Park and the South Cape May Preserve. Within the LCMM ecosystem restoration site, approximately
344 acres are freshwater wetlands and 112 acres are beach and dune habitat.
4.2 ANALYSIS OF MULTIPLE BENEFITS FROM THE LCMM SITE
GENERAL VALUE OF WETLAND AND BEACH/DUNE SYSTEM. An ambitious study completed in
2007 sought to place a value on all ecosystem goods and services in New Jersey (NJDEP 2007). It
ranked marine ecosystem services and freshwater wetlands as the highest valued habitat types in the
state, both of which are present in the LCMM ecosystem restoration. The researchers estimated the
value of freshwater wetlands at $14,555 per acre per year and the beach and dune system at $51,979
per acre per year. Multiplying those values to the entire acreage of the restoration site gives a value of
$10,900,000 each year, though this is considered an average value and is not specific to the conditions
at LCMM.15
An earlier study based upon primary data collection—surveys of New Jersey residents across
the state—found that residents are willing to pay a one-time fee of $37 per person for protecting and
restoring coastal wetlands (Singh 1997). The study was completed in three different years (1994, 1995
and 1996) and the median willingness-to-pay remained constant over the three years. Also noteworthy
is that when asked their opinion on the best use of New Jersey’s coastal wetlands, 92 percent of
respondents selected flood protection, wildlife or recreation. The study does not employ the most
rigorous surveying and analysis techniques that are recommended for contingent valuation studies;
however, the results are still useful to get a better sense of the range of values specific to New Jersey
for wetland protection. Also because it is a statewide study, it shows that in general there is wide
public support for coastal wetland protection, not just among those who live next to the coast.
ECOLOGICAL RESTORATION. Perhaps the study in closest geographic proximity to Cape May
was conducted in New Jersey’s Barnegat Bay, where the researchers surveyed residents of the coastal
watershed to see their willingness-to-pay for restoring a mix of habitat types in the watershed (Nicosia
et al. 2011).16 Residents are willing to pay $11.50 per month on their water bills, or $136 annually.
Residents were clearly explained the types of ecosystem restoration that would result from their
payment, advised that the fee would be in addition to their current monthly water bills, and then a
regression model was used to analyze the results. The Barnegat Bay study extrapolated the results to
the entire watershed of 660 square miles. In contrast, households in the LCMM watershed are less
than one and a half miles from the wetlands and coast. Thus, extrapolating to only the three
surrounding communities gives a conservative estimate, if one considers that in the Barnegat Bay
15
The $10.9 million is comprised of $5.04 million per year for wetlands and $5.82 million per year for the beach/dune system at LCMM. 16
For peer-reviewed journal article, refer to Gray, S., Jordan, R.C. and Nicosia, K. 2014. Willingness to pay for coastal ecosystem service restoration in a highly urbanized watershed: A contingent valuation survey (in review). Ecological Economics.

The Nature Conservancy, New Jersey Chapter, June 5, 2014
28
study, households roughly 25 miles away from the coast were still willing to pay for coastal restoration.
With 1,300 homes in the three communities surrounding LCMM, the total value aggregates up to
$176,800 annually.
WATER QUALITY. Healthy freshwater and coastal wetlands are well known for their water
quality benefits, which include reducing erosion and sedimentation, and retaining contaminants such
as excess nutrients and heavy metals. Awareness is increasing along New Jersey’s Atlantic coast about
the importance of water quality for swimming, fishing and boating. For instance, in Barnegat Bay, poor
water quality has become a serious issue, leading to eutrophication and other stresses such as
pathogenic bacteria, which has led to beach closings and areas where shellfish can no longer be
harvested (Barnegat Bay Partnership 2011). In Cape May County, the water quality situation is not
considered as severe as in Barnegat Bay, though preventative actions can help mitigate the problem
from worsening. In a recent analysis by the New Jersey Chapter of the Nature Conservancy, analysts
found that more than 20 percent of Cape May County is covered by coastal wetlands, and protecting
these wetlands is the first step in maintaining their water quality filtration services.
In the case of the LCMM wetlands, the majority of the water that drains out of the system exits
through a culvert into Cape Island Creek, which in turn drains into Cape May Harbor. Cape Island Creek
is a popular area for dolphin watching, birding and boating. Based upon limited availability of data, we
use boating in Cape Island Creek to represent the value of water quality benefits from LCMM. It would
be preferable to link the economic value of water quality improvements directly to revenues from
wildlife viewing boat tour companies, but the visitation and revenue data are proprietary. Thus, to give
us a general sense of the economic value of boating in and around Cape Island Creek, we refer to a
Long Island study from the Peconic Estuary (Johnston et al. 2002). Through visitor surveys, the
researchers applied the travel cost method and found the value of each boat trip at $29 per person.
The total annual value to the Peconic Estuary is $27.7 million. Although the geographic size of Cape
Island Creek and the mouth of the creek is a fraction of the size of the Peconic Estuary, it is still useful
for municipal planners and other decision makers to see that just a single activity—boating—could
aggregate up to a substantial economic value for consumers.
RECREATION. In Chapter Three, we discussed the regional economic impacts of birding in
southern Cape May County. However, there are a wider range of recreational activities associated with
LCMM. Here, we refer to the consumer surplus, which is the value that the visitor would be willing to
pay for an activity beyond the amount the visitor spends on hotel, restaurant and other expenditures.
Thus, the consumer surplus does not represent the value that a visitor pays, but rather, is linked to
consumer well-being. Considering consumer well-being is important because values and well-being
often drive decision-making and ultimately lead to spending. Further, incorporating well-being into
regional planning leads to more socially optimal outcomes for the entire community.
We begin with recreational values for beach visitors. The improvement in well-being that beach
visitors receive comes from swimming, walking, sunbathing or wildlife viewing. A Long Island survey
with 1,354 respondents on the economic value of coastal ecosystems found that beach visitors value a
day of beach recreation at $13 (Johnston et al. 2002). The value for beach visitors in Long Island is
The Nature Conservancy, New Jersey Chapter, June 5, 2014
29
surprisingly close to a 1992 study from New Jersey, which found that beach users and non-users across
New Jersey were willing to pay on average $15 per person to maintain the existence of New Jersey
beaches (Silberman, Gerlowski, and Williams 1992).
In the LCMM ecosystem restoration, an important component of the project was increasing the
width of the beach. Several studies have demonstrated that beach width matters for beach visitors,
with visitors willing to pay for wider beaches. A 2008 study from North Carolina found that consumers
may place a higher value on beach visitation than originally estimated, at $97 per trip for the baseline
scenario, with an additional $7.50 per trip when beach width increases (Whitehead et al 2008). A 2003
study from Florida found that not only are visitors willing to pay for wider beaches, but they are also
willing to pay for resulting habitat improvements that lead to an increase in wildlife numbers (Shivlani,
Letson and Theis 2003). For the increase in beach width, beach visitors are willing to pay an additional
$2.68 per visitor per trip for recreational benefits, plus $0.14 per visitor per trip for the habitat
benefits. However, the authors report that the value is likely an underestimate due to their data
collection and analysis methods. These values are similar to those from a 2013 study on Delaware
beaches, finding visitors are willing to pay approximately $2.75 per day trip per person for increasing
beach width to twice the starting width (Parsons et al. 2013). All of the aforementioned studies may be
underestimates for LCMM, since the LCMM beach was nearly completely lost in many sections, and
thus the beach nourishment brought certain out-of-use sections back into use.
To get a sense of the potential magnitude at LCMM, we base our calculation on the number of
visitors to the state park, at an average of 700,000 visitors each year (McCay, Personal communication,
September 18, 2013). We do not have access to the total number of beach visitors each year to LCMM,
thus we can use the average annual number of visitors to the state park as a proxy. Aggregating the
average values from the beach recreation and beach width studies, we find that beach recreation at
LCMM is worth between $11 and $12.5 million each year (these figures include the additional value
beach visitors place on habitat for wildlife from increasing beach width).
ADDITIONAL ECOSYSTEM SERVICE BENEFITS. It is likely that there are additional ecosystem
service benefits provided by LCMM that are not covered by the analysis in Chapters Three or Four of
this report. Future studies could be aimed at quantifying these additional services. Two potential
benefits—from erosion reduction and improved property values—are worth mentioning. We know
that if erosion rates were to remain constant, the area where the state park and preserve are now
located was projected to lose an additional 138 acres by 2050 (U.S. Army Corps of Engineers 2007).
Erosion of the shoreline would lead to numerous economic losses: loss of beaches and loss of birding
habitat would decrease expenditures from beach and birding visitors, leading to economic losses
across the region. The loss of dunes would lead to a loss of storm surge protection. The erosion would
also lead to loss of storage capacity of the wetland and with that loss of storage, flooding would likely
increase.
The LCMM restoration is also potentially leading to economic benefits for homeowners closest
to the restoration site. A 2009 study assessed the increase in property values for homes in North
Carolina with respect to an improvement beach and dune quality and found the results to be most
The Nature Conservancy, New Jersey Chapter, June 5, 2014
30
significant for homes within 300 meters of the beach (Gopalakrishnan et al. 2009). They used an
innovative method of regression analysis and found beach width to represent a larger portion of home
values than previously thought. The North Carolina study also used their model to predict what the
change in property values would be if the erosion rate were to triple, and found that property values
would decrease by a staggering 53 percent in certain communities. Although the general idea that
beach quality can be capitalized into the housing market applies to the Cape May region as well, we
cannot apply the exact numbers from the North Carolina study because property value studies are
location-specific.
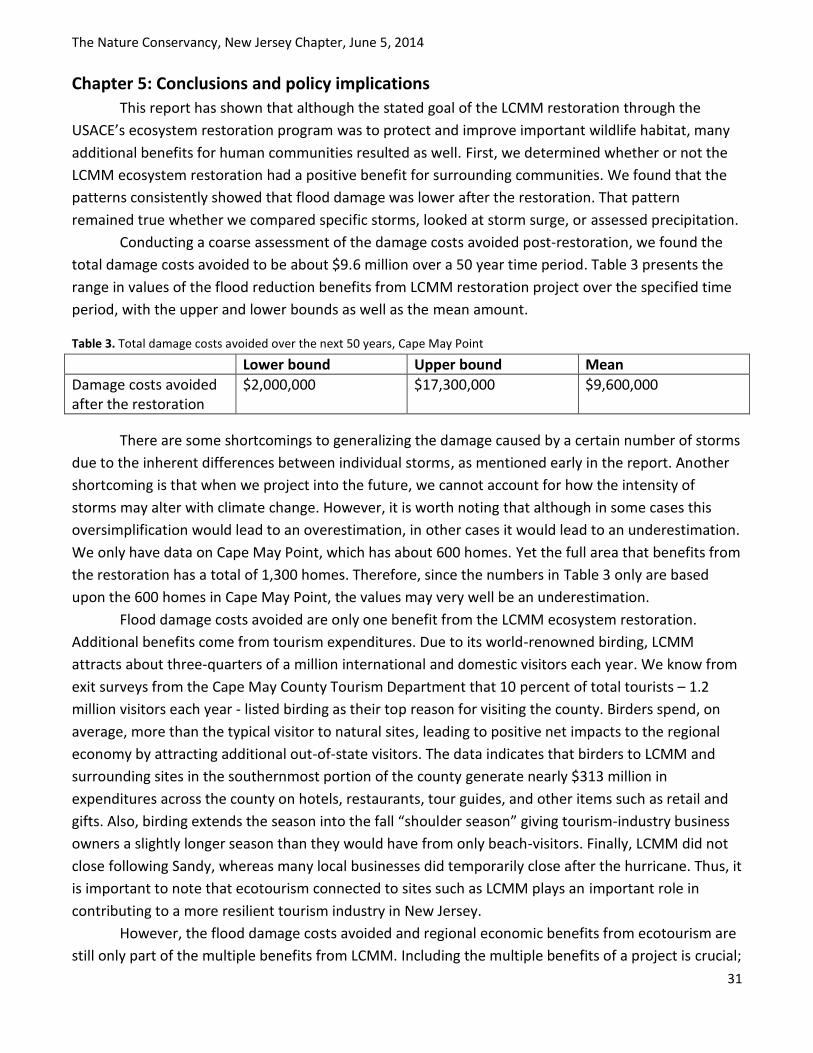
The Nature Conservancy, New Jersey Chapter, June 5, 2014
31
Chapter 5: Conclusions and policy implications
This report has shown that although the stated goal of the LCMM restoration through the
USACE’s ecosystem restoration program was to protect and improve important wildlife habitat, many
additional benefits for human communities resulted as well. First, we determined whether or not the
LCMM ecosystem restoration had a positive benefit for surrounding communities. We found that the
patterns consistently showed that flood damage was lower after the restoration. That pattern
remained true whether we compared specific storms, looked at storm surge, or assessed precipitation.
Conducting a coarse assessment of the damage costs avoided post-restoration, we found the
total damage costs avoided to be about $9.6 million over a 50 year time period. Table 3 presents the
range in values of the flood reduction benefits from LCMM restoration project over the specified time
period, with the upper and lower bounds as well as the mean amount.
Table 3. Total damage costs avoided over the next 50 years, Cape May Point
Lower bound Upper bound Mean
Damage costs avoided after the restoration
$2,000,000 $17,300,000 $9,600,000
There are some shortcomings to generalizing the damage caused by a certain number of storms
due to the inherent differences between individual storms, as mentioned early in the report. Another
shortcoming is that when we project into the future, we cannot account for how the intensity of
storms may alter with climate change. However, it is worth noting that although in some cases this
oversimplification would lead to an overestimation, in other cases it would lead to an underestimation.
We only have data on Cape May Point, which has about 600 homes. Yet the full area that benefits from
the restoration has a total of 1,300 homes. Therefore, since the numbers in Table 3 only are based
upon the 600 homes in Cape May Point, the values may very well be an underestimation.
Flood damage costs avoided are only one benefit from the LCMM ecosystem restoration.
Additional benefits come from tourism expenditures. Due to its world-renowned birding, LCMM
attracts about three-quarters of a million international and domestic visitors each year. We know from
exit surveys from the Cape May County Tourism Department that 10 percent of total tourists – 1.2
million visitors each year - listed birding as their top reason for visiting the county. Birders spend, on
average, more than the typical visitor to natural sites, leading to positive net impacts to the regional
economy by attracting additional out-of-state visitors. The data indicates that birders to LCMM and
surrounding sites in the southernmost portion of the county generate nearly $313 million in
expenditures across the county on hotels, restaurants, tour guides, and other items such as retail and
gifts. Also, birding extends the season into the fall “shoulder season” giving tourism-industry business
owners a slightly longer season than they would have from only beach-visitors. Finally, LCMM did not
close following Sandy, whereas many local businesses did temporarily close after the hurricane. Thus, it
is important to note that ecotourism connected to sites such as LCMM plays an important role in
contributing to a more resilient tourism industry in New Jersey.
However, the flood damage costs avoided and regional economic benefits from ecotourism are
still only part of the multiple benefits from LCMM. Including the multiple benefits of a project is crucial;
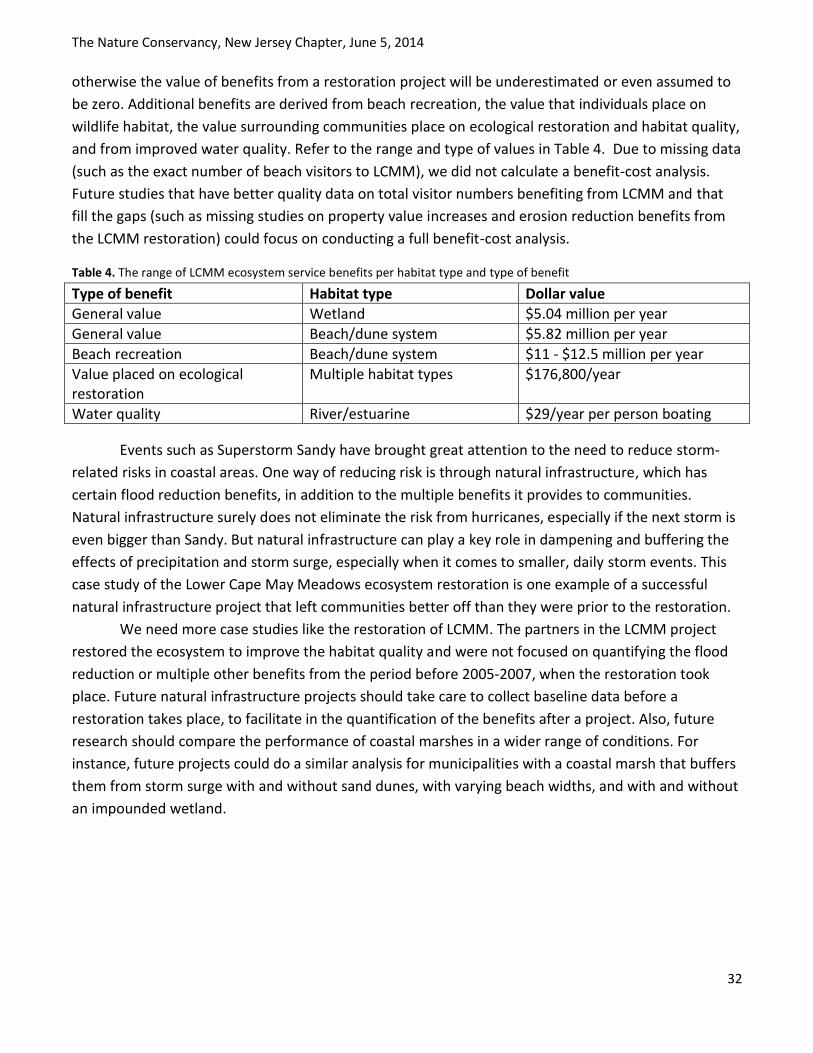
The Nature Conservancy, New Jersey Chapter, June 5, 2014
32
otherwise the value of benefits from a restoration project will be underestimated or even assumed to
be zero. Additional benefits are derived from beach recreation, the value that individuals place on
wildlife habitat, the value surrounding communities place on ecological restoration and habitat quality,
and from improved water quality. Refer to the range and type of values in Table 4. Due to missing data
(such as the exact number of beach visitors to LCMM), we did not calculate a benefit-cost analysis.
Future studies that have better quality data on total visitor numbers benefiting from LCMM and that
fill the gaps (such as missing studies on property value increases and erosion reduction benefits from
the LCMM restoration) could focus on conducting a full benefit-cost analysis.
Table 4. The range of LCMM ecosystem service benefits per habitat type and type of benefit
Type of benefit Habitat type Dollar value
General value Wetland $5.04 million per year
General value Beach/dune system $5.82 million per year
Beach recreation Beach/dune system $11 - $12.5 million per year
Value placed on ecological restoration
Multiple habitat types $176,800/year
Water quality River/estuarine $29/year per person boating
Events such as Superstorm Sandy have brought great attention to the need to reduce storm-
related risks in coastal areas. One way of reducing risk is through natural infrastructure, which has
certain flood reduction benefits, in addition to the multiple benefits it provides to communities.
Natural infrastructure surely does not eliminate the risk from hurricanes, especially if the next storm is
even bigger than Sandy. But natural infrastructure can play a key role in dampening and buffering the
effects of precipitation and storm surge, especially when it comes to smaller, daily storm events. This
case study of the Lower Cape May Meadows ecosystem restoration is one example of a successful
natural infrastructure project that left communities better off than they were prior to the restoration.
We need more case studies like the restoration of LCMM. The partners in the LCMM project
restored the ecosystem to improve the habitat quality and were not focused on quantifying the flood
reduction or multiple other benefits from the period before 2005-2007, when the restoration took
place. Future natural infrastructure projects should take care to collect baseline data before a
restoration takes place, to facilitate in the quantification of the benefits after a project. Also, future
research should compare the performance of coastal marshes in a wider range of conditions. For
instance, future projects could do a similar analysis for municipalities with a coastal marsh that buffers
them from storm surge with and without sand dunes, with varying beach widths, and with and without
an impounded wetland.
The Nature Conservancy, New Jersey Chapter, June 5, 2014
33
References
Barnegat Bay Partnership. 2011. State of the Bay Report. Barnegat Bay Partnership, Science and research, State of the Bay. Web. http://bbp.ocean.edu/pages/345.asp
Blake, E. S., T. B. Kimberlain, R. J. Berg, J. P. Cangialosi and J. L. Beven II. 2013. Tropical Cyclone Report Hurricane Sandy. National Hurricane Center. 14 (Feb. 12, 2013). Web. http://www.nhc.noaa.gov/data/tcr/AL182012_Sandy.pdf.
Brody, Samuel D. and Wesley E. Highfield. 2013. Open space protection and flood mitigation: a national study. Land Use Policy 32:89-95.
Cape May County, Department of Tourism. 2013. Developing a game plan – lessons learned from Sandy. Prepared for the Cape May County Tourism Conference, April 25 2013. Print. 40pp.
Cape May County and Tetra Tech EM, Inc. 2010. Cape May County Multi-Jurisdictional All Hazards Mitigation Plan Volume I. Cape May County, Emergency Management, Public Works/County Engineer Reports & Studies. April 2010 with October 2010 Revisions. Web. http://www.capemaycountygov.net/Cit-e-Access/webpage.cfm?TID=5&TPID=8740
Costanza, Robert, Octavio Pérez-Maqueo, M. Luisa Martinez, Paul Sutton, Sharolyn J. Anderson, and Kenneth Mulder. 2008. The Value of coastal wetlands for hurricane protection. Ambio 37(4): 241-248. Web. http://www.uvm.edu/giee/pubpdfs/Costanza_2008_Ambio.pdf
Gopalakrishnan, Sathya, Martin D. Smith, Jordan M. Slott, and A. Brad Murray. 2009. The value of disappearing beaches: A hedonic pricing model with endogenous beach width. Prepared for presentation at the Agricultural & Applied Economics Association’s 2009 AAEA & ACCI Joint Annual Meeting, Milwaukee, Wisconsin, July 26-29, 2009.
eBird. Explore Data. eBird, View and Explore Data, 2014. Web. http://ebird.org/ebird/eBirdReports?cmd=Start
Eubanks, Ted, John R. Stoll, and Paul Kerlinger. 2000. Wildlife-associated recreation on the New Jersey Delaware Bayshore. Prepared for the New Jersey Division of Fish and Wildlife. Web. http://www.fermatainc.com/?page_id=937
Federal Emergency Management Agency. The National Flood Insurance Program. Federal Emergency Management Agency 2014. Web. http://www.fema.gov/national-flood-insurance-program
Haab, Timothy C. and Kenneth E. McConnell. Valuing Environmental and Natural Resources: the Econometrics of Non-Market Valuation. Northampton, MA: Edward Elgar, 2002. Print.
Johnston, Robert J., Thomas A. Grigalunas, James J. Opaluch, Marisa Mazzotta, and Jerry Diamantedes. 2002. Valuing estuarine resource services using economic and ecological models: The Peconic Estuary system study. Coastal Management 30:47-65.
McCay, Lorraine. New Jersey Department of Environmental Protection, Cape May Point State Park Superintendent, Cape May Point, New Jersey. Personal Communication. 18 September 2013.
The Nature Conservancy, New Jersey Chapter, June 5, 2014
34
National Oceanic and Atmospheric Administration. 2014a. Tides and Currents. National Oceanic and Atmospheric Administration, Center for Operational Oceanographic Products and Services 2014. Web. http://tidesandcurrents.noaa.gov/gmap3/index.shtml?type=TidePredictions®ion
National Oceanic and Atmospheric Administration. 2014b. National Climatic Data Center. National Oceanic and Atmospheric Administration, Cape May station of the National Weather Service (NWS) Cooperative Observer Program (COOP) 2014. Web. http://www.ncdc.noaa.gov/
New Jersey Climate Adaptation Alliance. 2013. Working Briefs: A Summary of Climate Change Impacts and Preparedness Opportunities for Six New Jersey Sectors. Rutgers University, School of Environmental and Biological Sciences, Climate and Environmental Change Initiative. Web. http://ceci.rutgers.edu/njadaptpdfs/workingbrief-utilities.pdf
New Jersey Department of Environmental Protection. 2007. Valuing New Jersey’s Nature Capital: An assessment of the economic value of the state’s natural resources. Web. http://www.nj.gov/dep/dsr/naturalcap/nat-cap-3.pdf
Nicosia, Kristina, Suhrudh Daaram, Ben Edelman, Lev Gedrich, Eric He, Sarah McNeilly, Vishnu Shenoy, Akhil Velagapudi, Walter Wu, Luna Zhang, Aneri Barvalia, Veena Bokka, Brian Chan, Jennifer Chiu, Sai Dhulipalla, Victoria Hernandez, Jenny Jeon, Pranav Kanukollu, Pearl Kravets, Amrita Mantha, Colin Miranda, Vishan Nigam, Meghnee Patel, Sam Praveen, Thomas Sang, Shruti Upadhyay, Tanvee Varma, Camilla Xu, Bhavish Yalamanchi, Masha Zharova, Allen Zheng, Rashika Verma, James Vasslides, Rebecca Jordan, John Manderson, and Steven Gray. 2011. Measuring the willingness to pay for restoration of a highly urbanized coastal watershed. Barnegat Bay Partnership, Science and Research, Completed Research and Restoration Projects. Web. http://bbp.ocean.edu/pages/372.asp
Parsons, G. Chen, Z.Standing, N.Lilley, J.Hidrue, M. 2013. A Contingent Behavior Travel Cost Model for Valuing Beach Width for Recreational Use. Marine Resource Economics 28.3: 221-241.
Perniciaro, Richard C. 2006. Economic impact of ecotourism resources in Cape May County, New Jersey. Center for Regional and Business Research, prepared for Cape May County – Economic Resources and Capital Planning, November 2006.
Sallenger, Asbury H., Kara S. Doran, and Peter A. Howd. 2012. Hotspot of accelerated sea-level rise on the Atlantic coast of North America. Nature Climate Change 2:884-888. Web. http://www.nature.com/nclimate/journal/v2/n12/full/nclimate1597.html
Shivlani, Manoj P., David Letson, and Melissa Theis. 2003. Visitor preferences for public beach amenities and beach restoration in South Florida. Coastal Management 31:367-385.
Schreiner, Irene. Borough of Cape May Point, Emergency Management Coordinator, Cape May Point, New Jersey. Personal communication. 16 September 2013.
Silberman, Jonathan, Daniel A. Gerlowski, and Nancy A. Williams. 1992. Estimating existence value for users and nonusers of New Jersey beaches. Land Economics 68(2): 225-236.

The Nature Conservancy, New Jersey Chapter, June 5, 2014
35
Singh, Harbans. 1997. Contingent valuation measurement of coastal wetlands: A case study of New Jersey. Middle States Geographer 30:50-54. Web. http://www.msaag.org/wp-content/uploads/2013/05/7_Singh.pdf
State of New Jersey. 2012. Christie Administration Releases Total Hurricane Sandy Damage Assessment of $36.9 Billion (Nov. 28, 2012). Web. http://www.nj.gov/governor/news/news/552012/approved/20121128e.html
U.S. Army Corps of Engineers. 2013. New Jersey Shore Protection, Lower Cape May Meadows – Cape May Point, NJ. U.S. Army Corps of Engineers, Philadelphia District, Marine Design Center. Web. http://media.dma.mil/2013/Jul/30/2000729703/-1/-1/0/130730-A-EO314-103.JPG
U.S. Army Corps of Engineers. 2007. Ecosystem Restoration: Lower Cape May Meadows – Cape May Point. U.S. Army Corps of Engineers, Philadelphia District. Prepared by Dwight Pakan for the ENR Conference. November 1, 2007.
U.S. Department of Labor. 2014a. Consumer Price Index. U.S. Department of Labor, Bureau of Labor and Statistics. Web. 10 January 2014. http://www.bls.gov/cpi/
U.S. Department of Labor. 2014b. CPI Inflation Calculator. U.S. Department of Labor. Web. 5 May 2014. http://data.bls.gov/cgi-bin/cpicalc.pl
Whitehead, J. C. Dumas, C. F.Herstine, J.Hill, J.,Buerger, B. 2008. Valuing Beach Access and Width with Revealed and Stated Preference Data. Marine Resource Economics 23:119–35.
Wu, Shuang-Ye, Brent Yarnal, and Ann Fisher. 2002. Vulnerability of coastal communities to sea-level rise: a case study of Cape May County, New Jersey, USA. Climate Research 22:255-270.
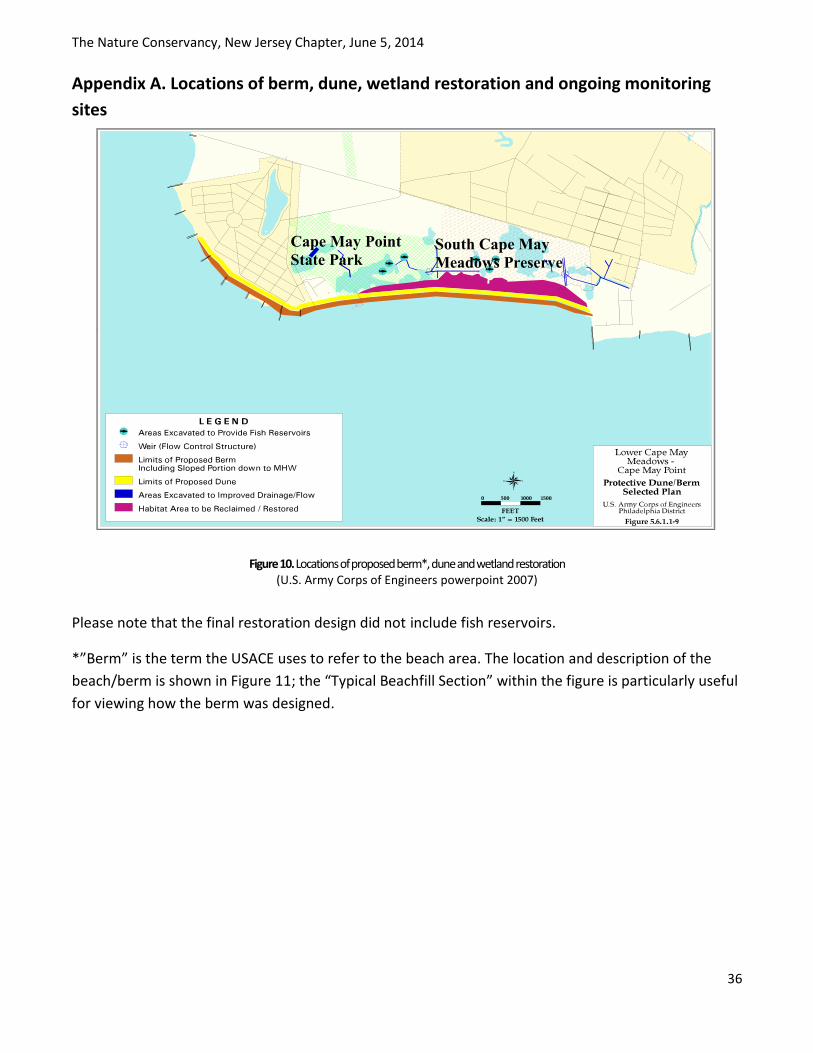
The Nature Conservancy, New Jersey Chapter, June 5, 2014
36
Appendix A. Locations of berm, dune, wetland restoration and ongoing monitoring
sites
Figure 10. Locations of proposed berm*, dune and wetland restoration (U.S. Army Corps of Engineers powerpoint 2007)
Please note that the final restoration design did not include fish reservoirs.
*”Berm” is the term the USACE uses to refer to the beach area. The location and description of the
beach/berm is shown in Figure 11; the “Typical Beachfill Section” within the figure is particularly useful
for viewing how the berm was designed.
Cape May Point
State Park
South Cape May
Meadows Preserve
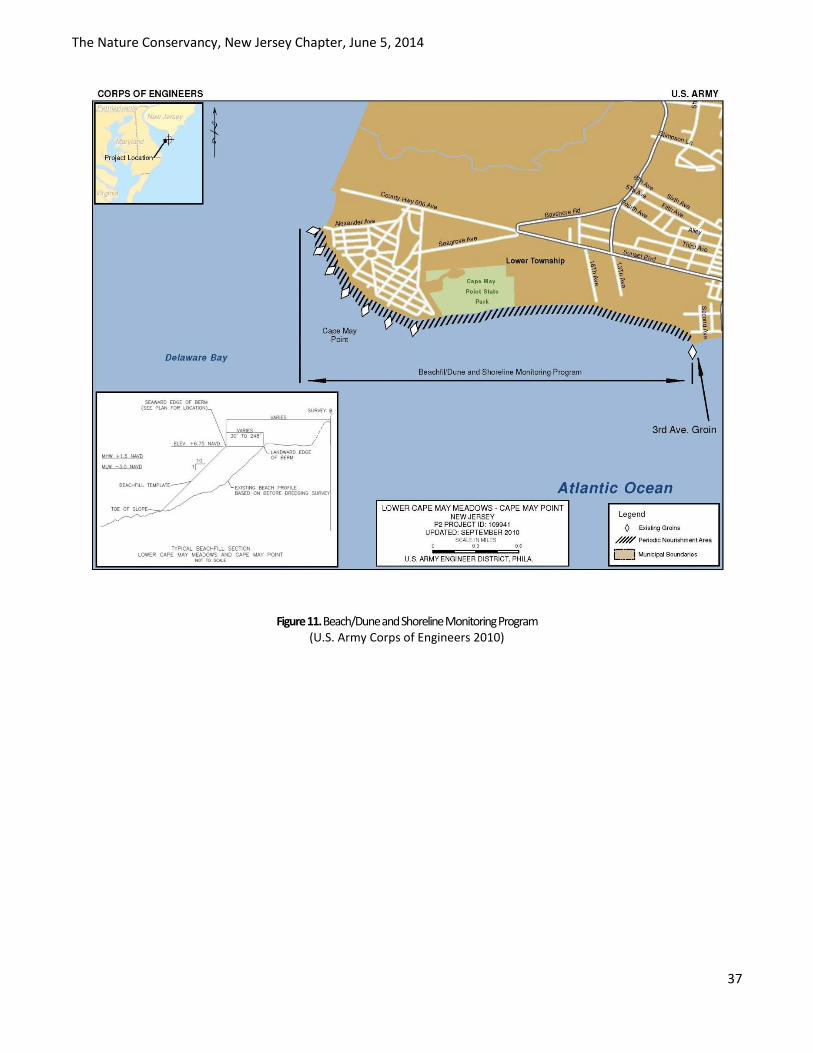
The Nature Conservancy, New Jersey Chapter, June 5, 2014
37
Figure 11. Beach/Dune and Shoreline Monitoring Program (U.S. Army Corps of Engineers 2010)
The Nature Conservancy, New Jersey Chapter, June 5, 2014
38
Appendix B. Quantifying economic impact and ecosystem service benefits
Regional economic impact from ecotourism: In Chapter Three of this report, we focus on the regional
economic impact from birding. Because visiting state parks, nature preserves and other protected
areas can stimulate spending in other areas of the economy, it is important to ask: What would a
region’s economy be like if the protected area did not exist? By chance, the National Park Service was
able to study this question during the government shutdown of October 2013. They found that for the
Delaware Water Gap National Recreation Area, a 70,000-acre national park located across the borders
of Pennsylvania and New Jersey, visitor numbers decreased by 19 percent from the previous year, with
a decrease in spending of $2.5 million (USDOI 2014).
Regarding terminology and definitions, an economic impact is different from a benefit. The
economic impact of birding is related to spending linked to birding trips. The recreational benefit of
birding is not linked to spending habits, but rather to the well-being to individuals generated from the
activity. Contingent valuation and travel cost method (described below) are methods used to
determine the magnitude of the benefit provided to visitors, beyond the amount they actually spend.
For more information on quantifying economic impacts, refer to an informative article titled,
“Determining Economic Contributions and Impacts: What is the difference and why do we care?”
(Watson et al. 2007)
Two key factors to consider should be considered in an economic impact assessment for the
change in regional revenues to be considered a net impact. First, the visitors must be from outside of
the region. Second, the visitor spending must be within the region. For instance, if a birder from
Pennsylvania takes a day trip to Cape May County but stops at a restaurant in Philadelphia, PA, then
the spending takes place outside of the region and would not count as a net economic impact for Cape
May County. Economic impact from recreation can be measured using several different methods, and
two of the more common methods are presented here. The most straightforward method is to survey
visitors and quantify the expenditures for items such as travel, meals and hotels; determine length of
trip; and then average the numbers and extrapolate over a wider group of visitors to estimate the
cumulative economic impact.
The second method is to combine survey data with integrated modeling software called
IMPLAN, which measures the regional economic impact of a given activity or sector. IMPLAN is an
input-output model that can be used to quantify the regional economic benefits from visitor spending,
taking into consideration leakage (the expenditures that leave the region) and multiplier effects (the
secondary effects of visitor spending) as well as jobs supported by a given activity. We’ll restate the
definition of a multiplier as presented in Chapter Three:
An increase in regional expenditures has a “multiplier” effect, also thought of as a “re-
spending” effect, on the regional economy. This is best illustrated by a simple example. When
birders visit local restaurants, they increase the revenues earned by these restaurants.
Restaurants may now be able to renovate or remodel their facility. They can hire local
contractors, who then have additional income. The local contractors then can spend their
The Nature Conservancy, New Jersey Chapter, June 5, 2014
39
additional income in local retail stores. All of these additional, indirect economic impacts are
captured by the multiplier effect.
Because economic multipliers are sector- and region-specific, using IMPLAN to calculate the multiplier
effect will be more accurate than transferring a multiplier from a different region. In this report, we
base our analysis on secondary data specific to Cape May County related to tourism and visitor
spending.
Valuation of ecosystem services benefits: Chapter Four of this report focuses on the economic value
of the ecosystem service benefits provided by Cape May Point State Park and South Cape May
Meadows Preserve. In cases where a market exists for a given resource, the calculation of the
economic value is fairly easy. In cases where the habitat is producing goods, such as fish, crops or
timber, the value of harvesting the resource can be quantified directly. For instance, in the
southwestern United States, water is bought and sold in water markets, and thus the value of water
can be based upon the market price. However, in many cases, no market price exists for a given good;
there are no established markets for the value of seeing a rare bird species, for clean water, or for
protecting the habitat of an endangered species. Yet even when the value is not accounted for by the
market, individuals may still be receiving value from those natural resources. One example would be if
a visitor to the region paid a nominal fee to visit a beach for the day, but the individual would have
been willing to pay a higher amount for the value that she received for the visit. The difference
between the actual value paid and the amount of value perceived by the visitor is called the consumer
surplus. Including the consumer surplus when making decisions gives a more accurate picture of the
expected benefits of one project compared to another, and should lead to better outcomes for society.
In this report, we reference several established methods from environmental economics, as
follows:
1) Benefit transfer: Benefit transfer is a well-developed methodology used in environmental
economics. Benefit transfer can be defined as the monetary value quantified for a particular
ecosystem service benefit based upon primary data collected at one site being applied to a
different site with similar characteristics. Often, the value being transferred was initially derived
from a contingent valuation study (e.g. willingness-to-pay) or a study using the travel cost
method. Benefit transfer is recommended because it is less costly than primary data collection,
though this method should only be used if the value being transferred comes from a site with
similar political, demographic and biophysical characteristics and was quantified using
appropriate economic methods and empirical technique. Only a very limited number of quality
empirical studies exist from the region and not all available studies have the same demographic
and political characteristics. Thus, the values derived from benefit transfer should not be
considered exact, but rather, they serve to demonstrate the potential values for a given
ecosystem service benefit.
2) Contingent valuation is a common method for quantifying ecosystem service benefits that are
not captured directly by the market. Contingent valuation involves primary data collection,
The Nature Conservancy, New Jersey Chapter, June 5, 2014
40
usually surveying individuals, on the perceived value of the resource at stake. When designed in
a rigorous manner, contingent valuation studies using willingness-to-pay estimates can be fairly
accurate. For instance, Johnston (2006) surveyed utility customers in Rhode Island in
anticipation of a binding referendum, and the study accurately predicted the percent of the
community voting yes to an increase on the water utility bill. For more information on
recommended methods for conducting contingent valuation studies, refer to Valuing
Environmental and Natural Resources: the Econometrics of Non-Market Valuation by Tim Haab
and Kenneth McConnell (2002).
3) Travel cost method is another common approach among environmental economists. Because
we expect that one’s behaviors give insight into his or her values, the assumption is that the
cost of travel and time spent visiting a natural site are suitable proxies for the actual value the
person places on that site. Thus if a person travels a longer distance to a given site, its value
increases. Generally, information on travel time, site characteristics and consumer preferences
are obtained through visitor surveys. Next the data is modeled in a multivariate analysis to
create a demand curve of the willingness-to-pay for a given site. Then, the demand curve is
used to aggregate the value of the site and can be compared to other sites to understand the
relative value. For example, a Long Island survey of 1,354 respondents on the economic value
of coastal ecosystems found that a day of birding in the Peconic Estuary was worth $76 for
visitors from outside of the region (Johnston et al. 2002). The researchers used the travel cost
method, which uses the value of the visitors’ time and transportation costs to represent their
value for each activity, so the $76 represents the consumer surplus, not the amount spent by a
visitor on his trip.