low delta-v crashes resulting in serious injury paper...1 1 low delta-v crashes resulting in serious...
TRANSCRIPT

1
1
Low Delta-V Crashes Resulting in Serious Injury
Mark ScarboroNHTSA
May 16, 2007
2
Questions
When occupants are seriously injured at low delta-v’s, what contributes to the injury causation?
What details are required to better analyze this issue?
What does the field data tell us?

2
3
NASS Data
0%
5%
10%
15%
20%
25%
30%
35%
40%Pe
rcen
t of C
ases
<=20 kmph >=21kmph UNKNOWN
Delta-V
CDS Data (98-05) Delta-V DistributionCriteriaAges 18+Rollovers excluded
4
NASS DataCDS Data (98-05) Delta-V and Injury Severity
0.00%
10.00%
20.00%
30.00%
40.00%
50.00%
60.00%
70.00%
0 1-2 3+
MAIS
Perc
ent o
f Cas
es
<=20 kmph
>=21kmph
UNKNOWN
52,967Occupants
12,180 Fatals
CriteriaAges 18+Rollovers excluded
3
5
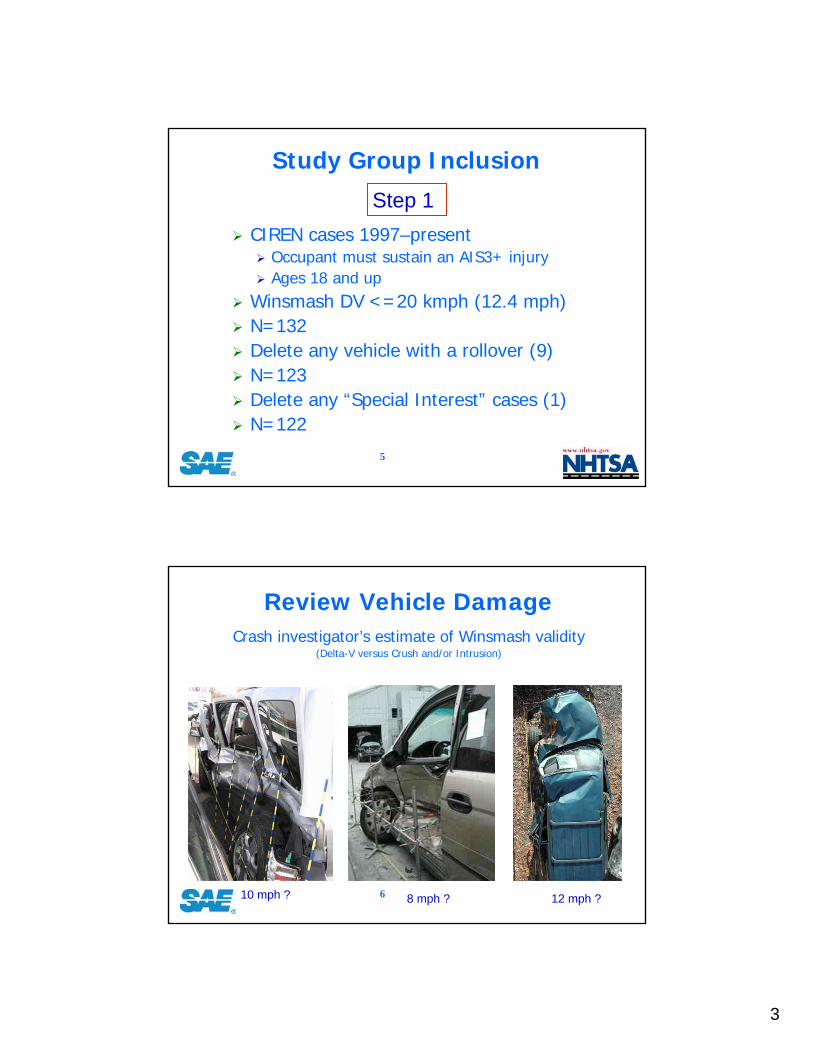
Study Group Inclusion
CIREN cases 1997–present Occupant must sustain an AIS3+ injuryAges 18 and up
Winsmash DV <=20 kmph (12.4 mph)N=132Delete any vehicle with a rollover (9)N=123Delete any “Special Interest” cases (1)N=122
Step 1
6
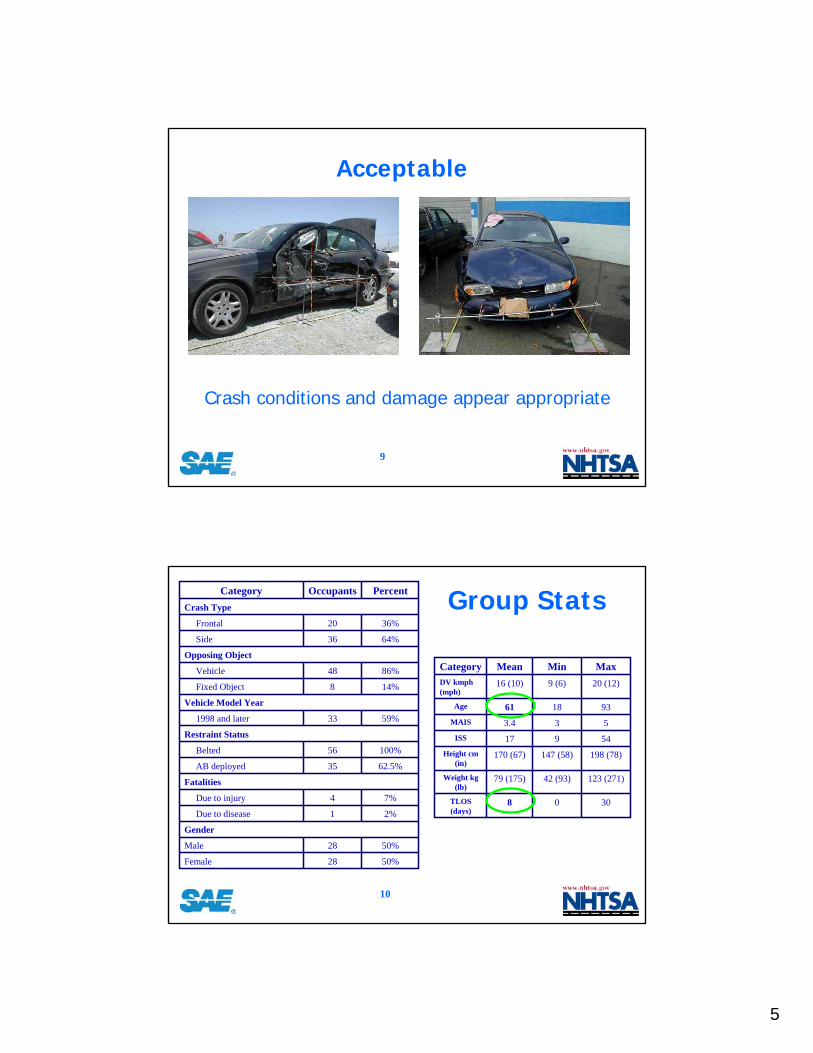
Review Vehicle DamageCrash investigator’s estimate of Winsmash validity
(Delta-V versus Crush and/or Intrusion)
10 mph ? 8 mph ? 12 mph ?

4
7
Low Estimates Dropped
Typical crashes of concernFLEE’s & FREE’sNarrow impacts with fixed objectsAngled side impacts
43 (35%) cases rated as “low estimate”N=79
8
Optimal Restraint Use
Only restrained occupants includedBelt restrained or air bag and belt restrainedUnbelted occupants excluded
Regardless of Air bag deployment21 occupants removed
Occupants with documented belt misuse2 occupants removed
N=56
5
9
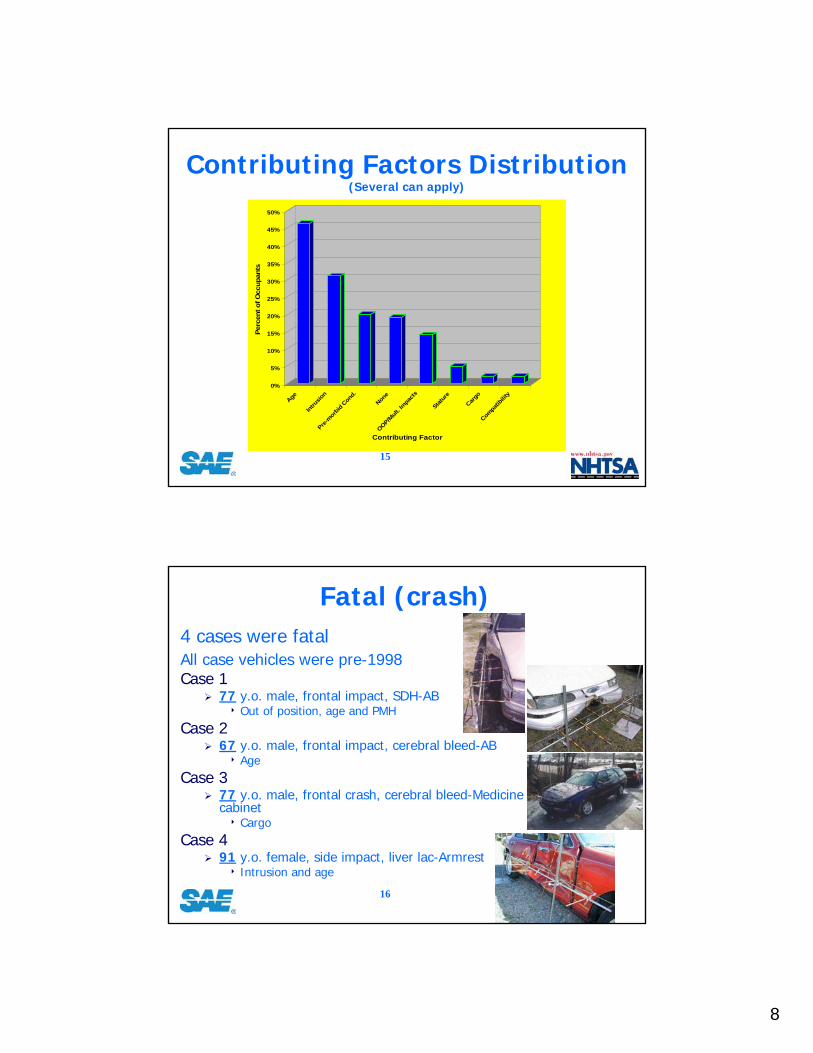
Acceptable
Crash conditions and damage appear appropriate
10
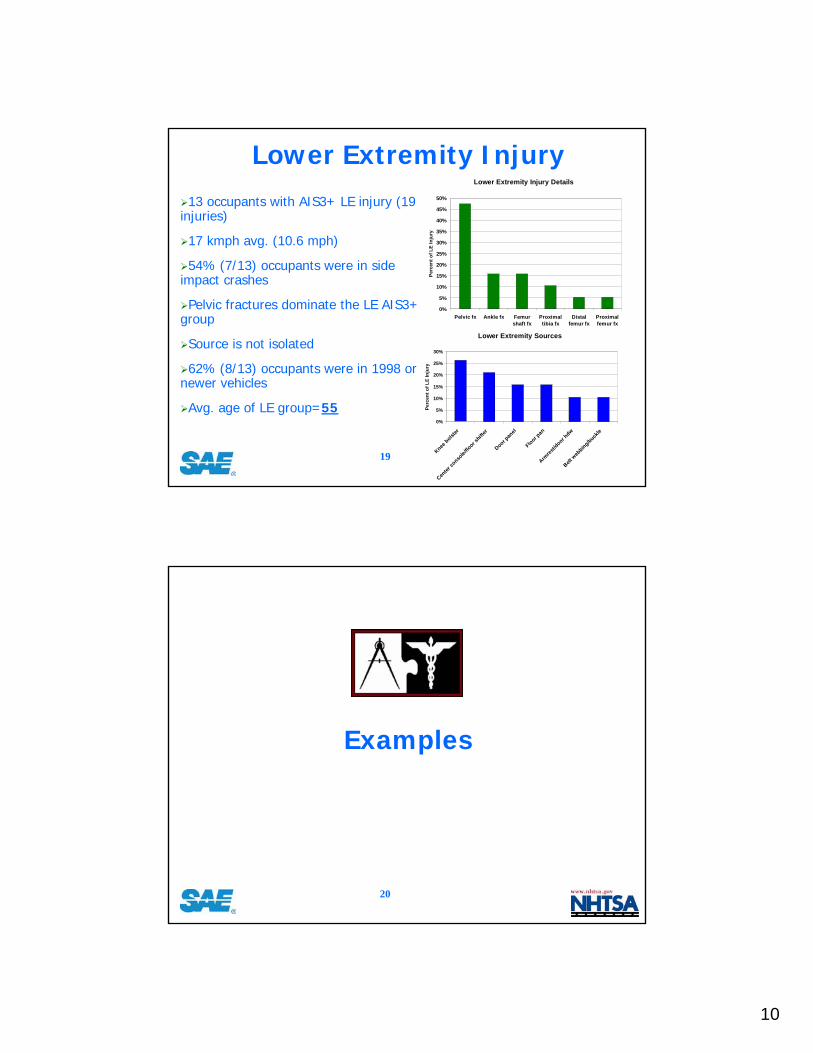
Group Stats
50%28Female
50%28Male
Gender
2%1Due to disease
7%4Due to injury
Fatalities
62.5%35AB deployed
100%56Belted
Restraint Status
59%331998 and later
Vehicle Model Year
14%8Fixed Object
86%48Vehicle
Opposing Object
64%36Side
36%20Frontal
Crash Type
PercentOccupantsCategory
3008TLOS (days)
123 (271)42 (93)79 (175)Weight kg (lb)
198 (78)147 (58)170 (67)Height cm (in)
54917ISS
533.4MAIS
931861Age
20 (12)9 (6)16 (10)DV kmph (mph)
MaxMinMeanCategory

6
11
Occupant Injury Distribution
AIS 3+ Injury by Body Region
Chest, 45%
Brain / Skull, 29%
Abdomen, 11%
Spine, 9%
Up Ext, 9%
Low Ext, 23%
*56 occupants with 102 AIS3+ injuries
12
AIS 3+ Injury Source
0%
2%
4%
6%
8%
10%
12%
14%
16%
18%
Perc
ent o
f Inj
ury
Air bag
and/or c
over
Door p
anel
Belt w
ebbin
g/buc
kle
Armres
t/doo
r hdw
Center
cons
ole/flo
or shif
ter
Extern
al ob
ject
Knee b
olster
Seat b
ack
Side window
sill/f
rame
Unknown
B-Pilla
r
Floor pan
Non-co
ntact
Other
interi
or objec
t
Windsh
ield
Component

7
13
Contributing FactorsAll cases manually reviewed for factors influencing injury causation and severity (Bio-Tab method)
Age (Elderly)Poor bone quality (osteoporosis)Calcification of vascular structures
IntrusionIntruded component causes or exacerbates injury
Pre-morbid ConditionMedical condition affecting injury causation8Medications, obesity, implants (ortho/organ)
Multiple Impacts / Out of PositionOccupant’s injury impact position is non-optimal
14
All cases manually reviewed for factors influencing injury causation and severity
Stature Occupant proximal to injurious components8 Seat track, seated height
CompatibilityStriking vehicle’s height or stiffness is a factor8Usually coded as intrusion, head contact to V2
CargoCargo shifting or moving in the vehicle is a factor8Equipment, pets (large)
Contributing FactorsContinued
8
15
Contributing Factors Distribution(Several can apply)
0%
5%
10%
15%
20%
25%
30%
35%
40%
45%
50%
Perc
ent o
f Occ
upan
ts
Age
Intru
sion
Pre-m
orbid
Con
d.
None
OOP/Mult
. Impa
cts
Statur
eCar
go
Compa
tibilit
y
Contributing Factor
16
Fatal (crash)4 cases were fatalAll case vehicles were pre-1998Case 1
77 y.o. male, frontal impact, SDH-AB8 Out of position, age and PMH
Case 267 y.o. male, frontal impact, cerebral bleed-AB8 Age
Case 377 y.o. male, frontal crash, cerebral bleed-Medicine cabinet8 Cargo
Case 491 y.o. female, side impact, liver lac-Armrest8 Intrusion and age

9
17
Brain and Skull Injury
16 Occupants with AIS3+ brain or skull injury (25 injuries)
17 kmph avg. (10.6 mph)
Majority of brain injury are cerebral bleeds
Primary source air bag and or related components
44% (7/16) of the occupants were in 1998 or newer vehicles
66% (4/6) of the occupants with AB sources were in 1997 and older vehicles
Avg. age of group=69 - AB group=72
Brain / Skull Injury Sources
0%5%
10%15%20%25%30%35%40%45%
Air bag
and/or
cover
Side wind
ow si
ll/frame
Extern
al obje
ct
Other in
terior o
bject
Belt web
bing/buc
kle
Center c
onsole
/floor s
hifter
Unknow
nPe
rcen
t of B
rain
/Sku
ll In
jury
Brain/Skull Injury Details
0%
5%
10%
15%
20%
25%
30%
Cerebral
contusio
n/hemor.
Cerebral
SDH
Cerebral
SAH
Cerebral
EDH
Concuss
ive
Base s
kull f
x
Brain s
tem co
nt.
Perc
ent o
f Bra
in/S
kull
Inju
ry
18
Chest Injury25 occupants with AIS3+ chest injury
(34 injuries)
15 kmph avg. (9.3 mph)
Rib fractures, HTX, PTX and lung contusions are high frequency
Door, armrest and belt are the primary sources
68% (17/25) of the occupants were in 1998 or newer vehicles
Avg. age of chest group=61
Chest Injury Detail
0%
10%
20%
30%
40%
50%
60%
Rib fx +/-HTX/PTX
Lung inj +/-HTX/PTX
Heartcont/lac
Diaphragmrupture
Tracheal inj
Perc
ent o
f Che
st In
jury
Chest Injury Sources
0%
5%
10%
15%
20%
25%
30%
35%
Door p
anel
Belt w
ebbin
g/buc
kle
Armre
st/do
or h
dw
B-Pilla
r
Air ba
g an
d/or c
over
Seat b
ack
Side w
indow
sill/f
ram
e
Unkno
wn
Perc
ent o
f Che
st In
jury
10
19
Lower Extremity Injury13 occupants with AIS3+ LE injury (19
injuries)
17 kmph avg. (10.6 mph)
54% (7/13) occupants were in side impact crashes
Pelvic fractures dominate the LE AIS3+ group
Source is not isolated
62% (8/13) occupants were in 1998 or newer vehicles
Avg. age of LE group=55
Lower Extremity Injury Details
0%
5%
10%
15%
20%
25%
30%
35%
40%
45%
50%
Pelvic fx Ankle fx Femurshaft fx
Proximaltibia fx
Distalfemur fx
Proximalfemur fx
Perc
ent o
f LE
Inju
ry
Lower Extremity Sources
0%
5%
10%
15%
20%
25%
30%
Knee bolst
er
Center
conso
le/flo
or shif
ter
Door pan
el
Floor pan
Armres
t/door h
dw
Belt w
ebbing/buck
lePe
rcen
t of L
E In
jury
20
Examples

11
21
Case – No Contributing Factors
Case V = 1998 Jeep Wrangler
Crosses center line, bumps curb and strikes 1991 Plymouth Acclaim
PDOF = 0
DV=18 kmph
22
No Factors
41 y.o. male driver
Belt and air bag
No past medical
Interview – good recall
No intrusion
Min. crush

12
23
No Factors
Right femur shaft fx
IM rod surgical repair
TLOS = 4 days
Initial charges = $20,686.00
24
Case – Contributing Factors
Case V – 1999 Ford Windstar van
V2 – 2005 Jeep Grand Cherokee
T-intersection crash
Nearside configuration
PDOF – 1 o’clock (30°)DV = 11 kmph (7 mph)
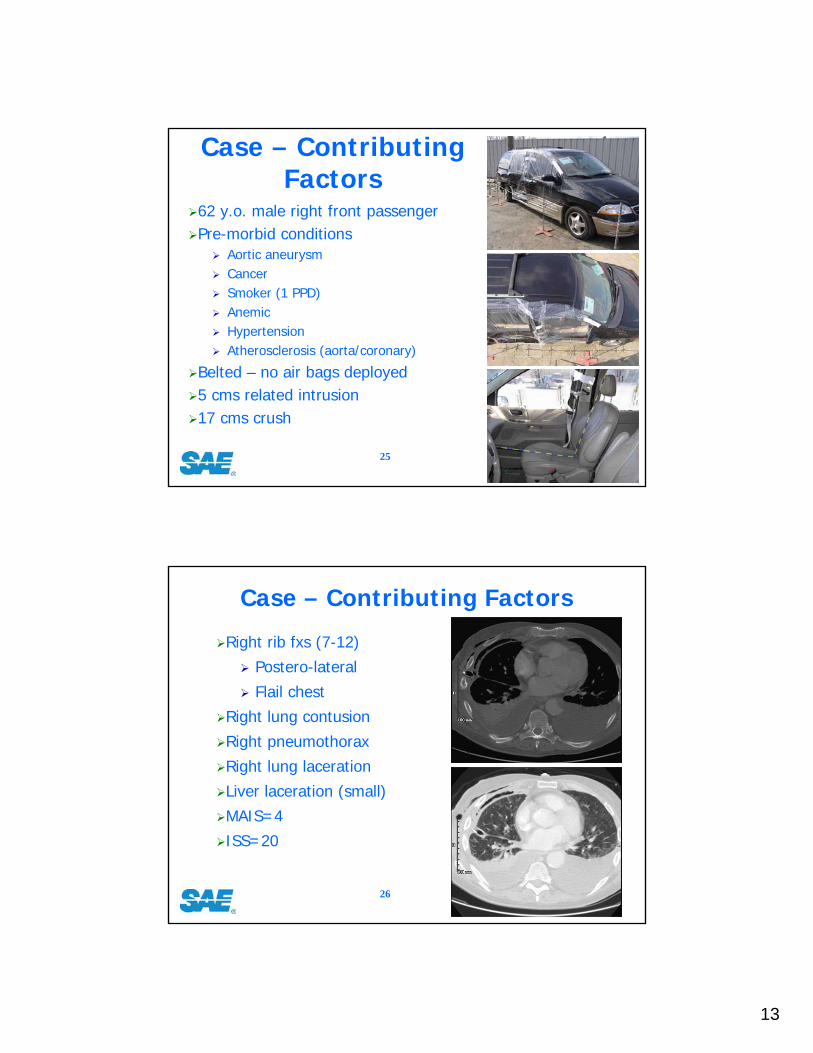
13
25
Case – ContributingFactors
62 y.o. male right front passengerPre-morbid conditions
Aortic aneurysmCancerSmoker (1 PPD)AnemicHypertensionAtherosclerosis (aorta/coronary)
Belted – no air bags deployed5 cms related intrusion17 cms crush
26
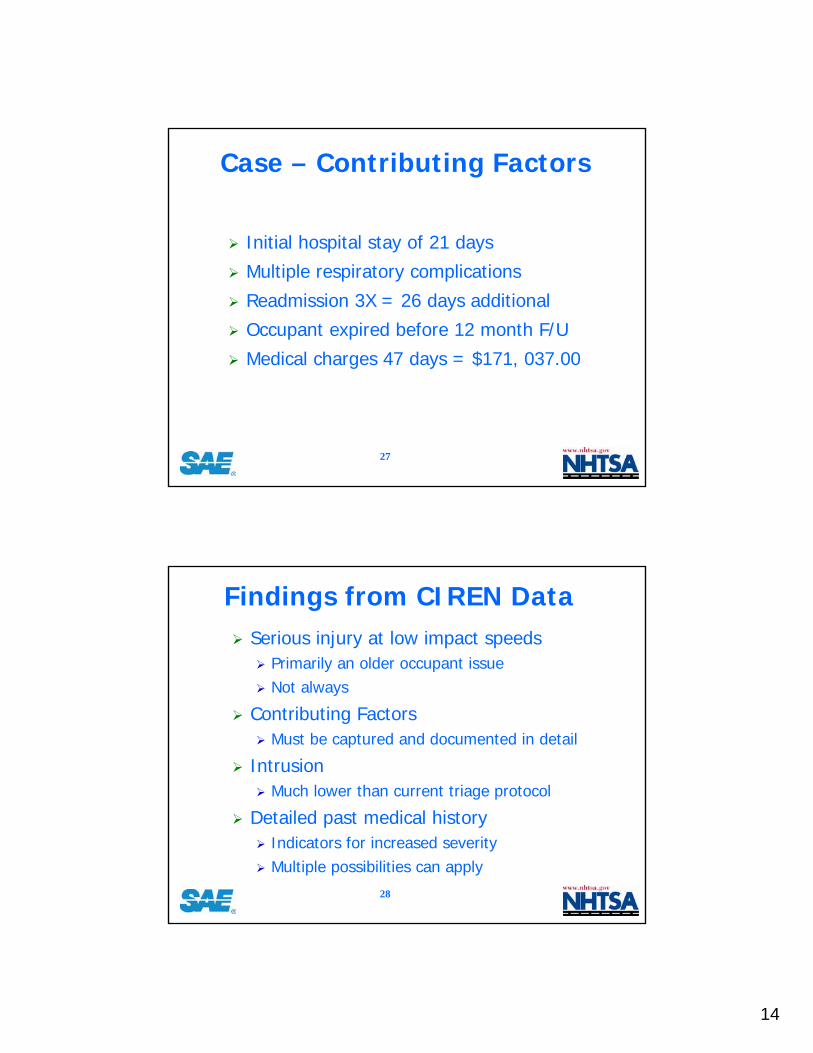
Case – Contributing Factors
Right rib fxs (7-12)
Postero-lateral
Flail chest
Right lung contusion
Right pneumothorax
Right lung laceration
Liver laceration (small)
MAIS=4
ISS=20
14
27
Case – Contributing Factors
Initial hospital stay of 21 days
Multiple respiratory complications
Readmission 3X = 26 days additional
Occupant expired before 12 month F/U
Medical charges 47 days = $171, 037.00
28
Findings from CIREN DataSerious injury at low impact speeds
Primarily an older occupant issueNot always
Contributing FactorsMust be captured and documented in detail
Intrusion Much lower than current triage protocol
Detailed past medical historyIndicators for increased severityMultiple possibilities can apply

15
29
Next Steps - CIRENBio-Tab coding to relate contributing factors directly to specific injury
Continue to better define elderly
New side impact vehicle investigation techniques
Improved intrusion, contacts and SAB data
Utilize DICOM images
CIREN and other populations
Document anatomical changes
30
Thank YouQuestions?