low coherence interferometry: from sensor multiplexing to biomedical imaging
TRANSCRIPT

Low Coherence Interferometry: From Sensor Mul7plexing to
Biomedical Imaging
António Lobo (PhD, MSc, EMBA)
Summer School AOP 2012
Porto, June 28-‐29, 2012

Outline § Some history…
§ LCI in op7cal fiber sensors • General concepts • Sensor mul7plexing
§ LCI in medical imaging • Op7cal Coherence Tomography (OCT) • OCT op7cal sources • OCT modali7es

Some history... § Low Coherence Interferometry: Sensing Applica7ons
• 1983 – Al-‐Chalabi, B. Culshaw, D.E.N. Davies, Univ. College London, UK (First Interna7onal Conference on Op7cal Fiber Sensors, OFS’1, London)
• First demonstra7on of the coherence mul7plexing in sensors • The system was not patented !

Some history... § Low Coherence Interferometry: Metrology
• 1987 – R. Youngquist, S. Carr, D.E.N. Davies – Op#cs Le)ers 12 (3), 158-‐160. • First demonstra7on on optoelectronic metrology • Op#cal Coherence-‐Domain Reflectometry (OCDR)

Some history... § Low Coherence Interferometry: Medical Applica7ons
• 1986 – A. Fercher, E. Roth, Medical Univ. Vienna, Austria (SPIE Conference on Op#cal Instrumenta#on for Biomedical Laser Applica#ons)
• 1988 – A. Fercher, K. Mengedoht, et.al. -‐ Op#cs Le)ers 13 (3), 186-‐188. • Par#ally Coherence Interferometry

Some history... § Low Coherence Interferometry: Medical Applica7ons
• 1986 – J. Fugimoto, et.al., M.I.T., USA. -‐ Op#cs Le)ers 11 (3), 150-‐152. • Intensity Correla#on • 1991 – J. Fujimoto, et.al. – Science 254, 1178-‐1181. • 1st image in-‐vitro – Op#cal Coherence Tomography (OCT)
1st Human re7na (in-‐vitro) OCT image [axial resolu7on: 15 μm, wavelength. 830 nm]

General Concepts § Low Coherence (or “white-‐light”) Interferometry
DC terms
auto-‐correla7on terms
cross-‐correla7on terms (important for Imaging)
E(t) = Eref (t)+ Esampl (t +τ n )n∑ =
= Eref (t)+ Esampl (t + Δzn c)n∑
I = E*(t) ⋅E(t)
I(τ ) = I0 ar + ann∑⎡
⎣⎢⎤⎦⎥+
+2I0 anam Re γ ss (τ nm ){ }m≠n∑ +
+2I0 anar Re γ (τ n ){ }n∑

General Concepts § Low Coherence (or “white-‐light”) Interferometry
func7on that depends on the source spectrum profile
Coherent source (ideal laser)
low coherence source (LED, SLD, Lamp,…)
axial posi7on, z axial posi7on, z OPD: Op7cal Path Difference
I(τ r ) = Const + 2I0 anam ⋅ γ (τ n )n∑ ⋅cos(ωτ n )
γ (τ ) = γ (τ ) e− iωτ
cos(ωτ n ) = cos 2πνnΔzc
⎛⎝⎜
⎞⎠⎟ = cos
2πλnΔz⎛
⎝⎜⎞⎠⎟

General Concepts § Low Coherence (or “white-‐light”) Interferometry
• Why? § Sensor ini7aliza7on on “powering-‐up” § Non-‐ambiguous dynamic range can be very large § The system can be operated such that:
§ (a) the measurement accuracy is independent of the source stability § (b) the effects of wavelength instability of the source are greatly reduced
§ The output signals from many sensors can be mul7plexed § Remote sensor tracking possible (tandem configura#on) § No op7cal isolator required (…in principle!!)
• Problems? § In “tandem configura7on” requires a second stable interferometer § Op7cal power available from typical short coherence sources are low
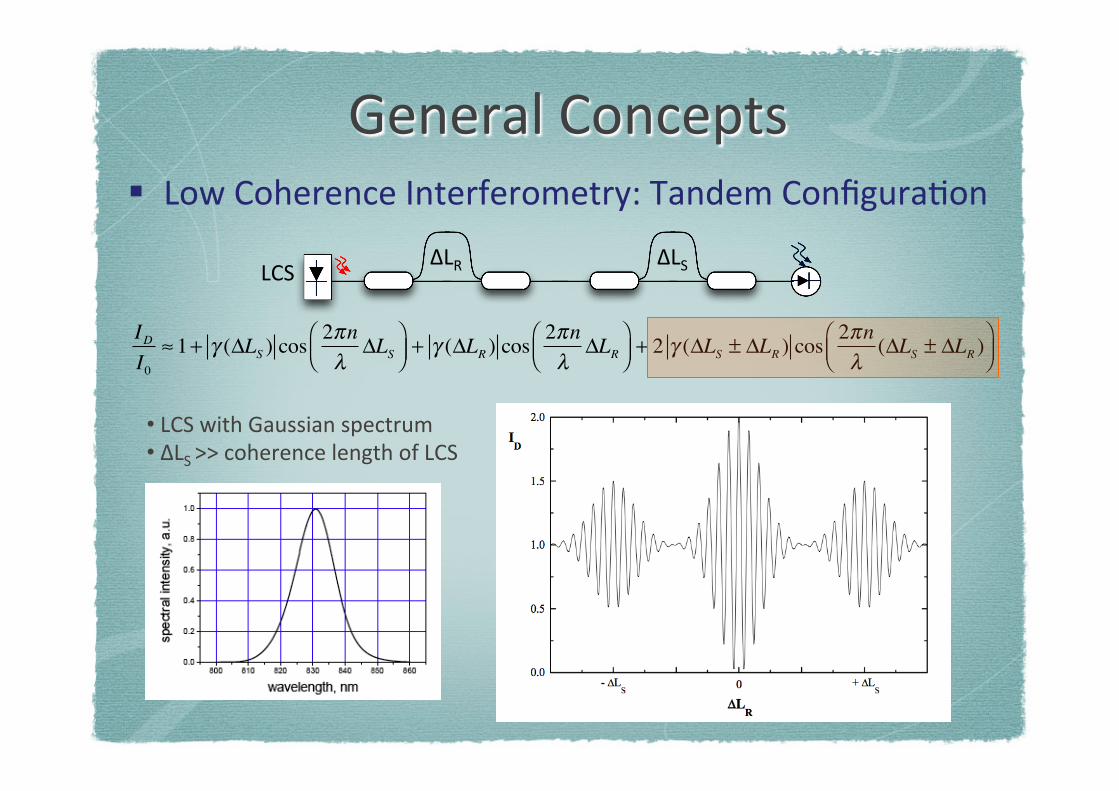
General Concepts § Low Coherence Interferometry: Tandem Configura7on
ΔLR ΔLS LCS
IDI0
≈ 1+ γ (ΔLS ) cos2πnλ
ΔLS⎛⎝⎜
⎞⎠⎟+ γ (ΔLR ) cos
2πnλ
ΔLR⎛⎝⎜
⎞⎠⎟+ 2 γ (ΔLS ± ΔLR ) cos
2πnλ(ΔLS ± ΔLR )
⎛⎝⎜
⎞⎠⎟
• LCS with Gaussian spectrum • ΔLS >> coherence length of LCS!

General Concepts § Low Coherence Interferometry: Tandem Configura7on
• LCS is mul7mode laser diode • ΔLS >> coherence length of LCS!
ΔLR ΔLS LCS
A.S. Gerges et.al., Appl. Opt. 29, 4473-‐4480 (1990). A.B. Lobo Ribeiro et.al.,Rev. Sci Instrum.63, 3586-‐3589 (1992)

General Concepts § Low Coherence Interferometry: Tandem Configura7on
• How to extend further the non-‐ambiguous dynamic range?
LCS @ λ1
LCS @ λ2
ΔLR ΔLS
φ1 =2πnλ1(ΔLS − ΔLR )
φe =2πnλe
(ΔLS − ΔLR )
λe =λ1λ2
λ1 − λ2A.B. Lobo Ribeiro et.al., Opt. Commun.109, 400-‐404 (1994).

Op7cal Sources for LCI § Ideal characteris7cs for fiber sensors
• High output op7cal power • Wavelength emission around 1550 nm (3rd telecom window)
• Smooth (no ripple) “Ideal” Gaussian spectrum profile
• Spectral bandwidth (FWHM) larger as possible
• Non-‐polarized output • Spectrally stable against back-‐reflec7ons (op7cal isolator?) • Singlemode Fiber op7c pigtailed
• Low cost (… as always!!)

Op7cal Sources for LCI § Light-‐Emiwng Diode (LED)
• Low output power in fiber (μW) • MM or SM fiber pigtailed
S-‐LED IRE-‐161 λ = 830 nm Δλ = 45 nm
Measured with a Michelson interferometer
Normalize
d visib
ility fu
nc7o
n
OPD (μm)

Op7cal Sources for LCI § Mul7mode Laser Diode (MM-‐LD)
• High output power in SMF pigtailed fiber • But…imposes some opera7onal restric7on on sensor OPD
Normalize
d visib
ility fu
nc7o
n
OPD (mm)
Measured with a Michelson interferometer
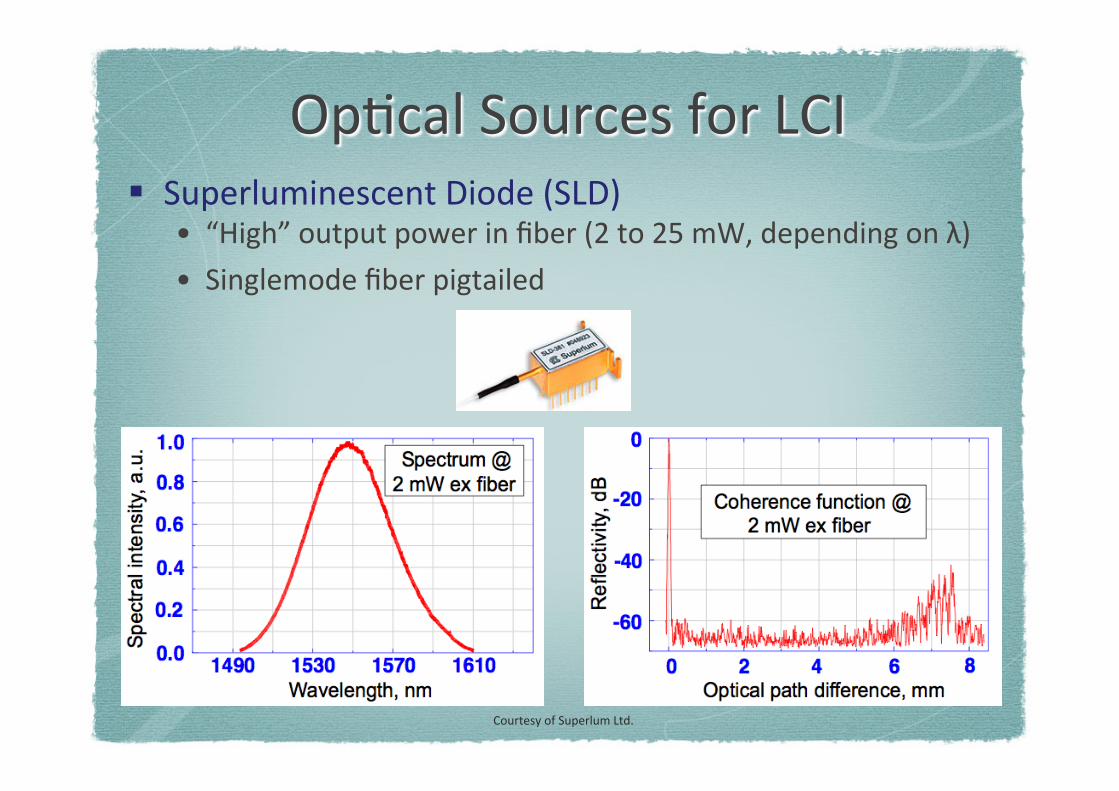
Op7cal Sources for LCI § Superluminescent Diode (SLD)
• “High” output power in fiber (2 to 25 mW, depending on λ) • Singlemode fiber pigtailed
Courtesy of Superlum Ltd.

Op7cal Sources for LCI § ASE Fiber Sources
• High output power on fiber (>50 mW) • Central wavelength emission (typ.): 1550 nm, 1060 nm
Courtesy of Mul7wave Photonics S.A.
Dimensions (mm): 120 x 90 x 22.2"

LCI in Sensor Mul7plexing § Coherence Division Mul7plexing (CDM)
• Each sensor must have different OPD • Receiver interferometer needs large tuning range • Demonstrated with polarimetric sensors
ΔLR
ΔL1 LCS
ΔL2
J.L. Santos and A.P. Leite, Proc. Conf. OFS’9, 59-‐62 (1993). A.B. Lobo Ribeiro et.al., Fiber & Integrated Op7cs 24, 171-‐199 (2005)
S1
S2

LCI in Sensor Mul7plexing § CDM + Spa7al Division Mul7plexing (SDM)
• Each sensor can have iden7cal OPD • Receiver interferometer needs smaller tuning range
ΔLR ΔL1
LCS
ΔL2
A.B. Lobo Ribeiro et.al., Proc. Conf. OFS’9, 63-‐66 (1993).

LCI in Sensor Mul7plexing § CDM + Wavelength Division Mul7plexing (WDM)
• Simultaneous measurement: Displacement + Temperature • Interroga7on of small Fabry-‐Perot cavity (for displacement)* • Fiber Bragg Gra7ng (FBG) match-‐pair technique (for temperature)**
(*) L.A. Ferreira et.al., IEEE Photon. Technol. Le|. 8, 1519-‐1521 (1996). (**) A.B. Lobo Ribeiro et.al., Appl. Opt. 36, 934-‐939 (1997).
Receiver Sensor
FBG
FP Cavity
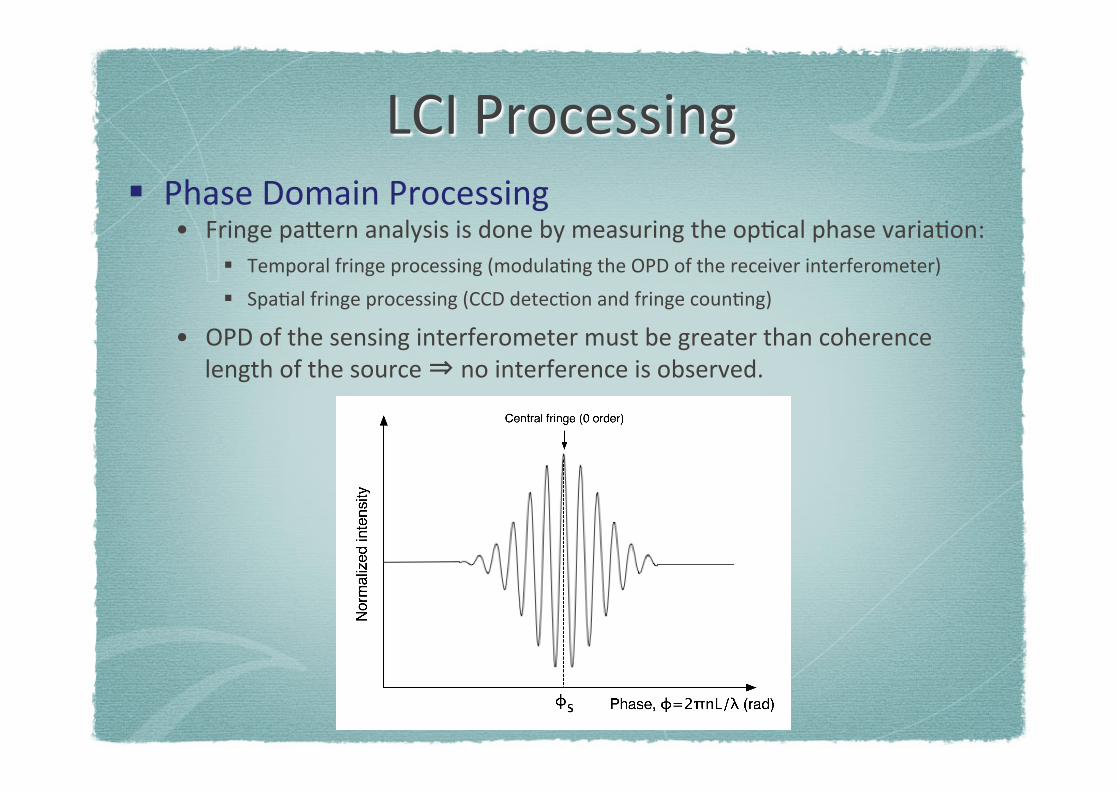
LCI Processing § Phase Domain Processing
• Fringe pa|ern analysis is done by measuring the op7cal phase varia7on: § Temporal fringe processing (modula7ng the OPD of the receiver interferometer) § Spa7al fringe processing (CCD detec7on and fringe coun7ng)
• OPD of the sensing interferometer must be greater than coherence length of the source ⇒ no interference is observed.

LCI Processing § Spectral Domain Processing
• Fringe pa|ern analysis is done using a Op7cal Spectrum Analyzer (OSA) • Free spectral range (FSR):
Normalize
d ou
tput
Wavelength, λ (nm)
Gaussian source:
FSRλ =
λ02
nΔL

LCI on Optoelectronic Metrology § Op7cal Low Coherence Reflectometry (OLCR)
W.V. Sorin, et.al., IEEE Photon. Technol. Le|. 4, 374-‐376 (1992). F.P. Kapron, et.al., J. Lightwave Tech. 7, 1234-‐1241 (1989).

Low Coherence Imaging § OLCR on Biomedical Applica7ons?
• Proper choice of op7cal source is necessary. § Wavelength § Spectral bandwidth § Output op7cal power
Biological 7ssue

Low Coherence Imaging § Op7cal Coherence Tomography (OCT)
• Already an establish medical imaging technique • Ophthalmology, Cardiology, Dermatology, etc.
1D Axial scanning (Z)
2D Axial scanning (Z)
Transverse scanning (X)
3D Axial scanning (Z)
XY Scanning
Backreflected intensity
Axial posi7on (penetra7on depth)
W. Drexler and J.G. Fugimoto, Op#cal Coherence Tomography: Technology and Applica#ons, Springer, 2008

Low Coherence Imaging § Op7cal Coherence Tomography (OCT)
• Resolu7on Limits § Wider source spectrum ⇒ Higher axial resolu7on § Higher Numerical Aperture (NA) ⇒ Large transverse resolu7on
High NA
low NA
Δx
Δz
b
Δz = 2 ln2π
⋅ λ2
ΔλΔx = 4λ
π⋅ fD
b = 2zR =πΔx2
λ
Axial Resolu7on Transverse Resolu7on
Depth Focus

Low Coherence Imaging § Op7cal Source for OCT
• Large spectral bandwidth ⇒ axial resolu7on • Adequate central wavelength ⇒ absorp7on 7ssue curve • Adequate spectral profile ⇒ Gaussian profile • Enough op7cal power ⇒ be|er SNR
Δλ Δz
Δz = 2 ln2π
⋅ λ2
Δλ

Low Coherence Imaging § Op7cal Source for OCT
• Op7cal window of biological 7ssue
new im
aging windo
w
800 900 1000 1100 1200 13000,00
0,05
0,10
0,15
0,20
0,25
0,30 Kou et al., Applied Optics, 32, 19, 3531-3540, 1993
Wat
er A
bsor
ptio
n C
oeffi
cien
ts (2
2o C) (
mm
-1)
Wavelength (nm)
~100 nm

Low Coherence Imaging § Op7cal Sources for OCT
Superluminescent Diode (SLD)
MQW Semiconductor Op7cal Amplifier (MQW-‐SOA)
ASE Doped Fiber Sources
KLM Solid State Laser
Incandescent Light Sources
Supercon7nuum Sources
Spectral BW
Spectral region
Output power
Op:cal stability
+ + ~ ++ ++ Dimensions
+ + + + +
+ ~ +++ ++ ++
++ ++ ++ + ~
+++ + -‐-‐ + ~
+++ +++ ++ ~ ~
Courtesy ( in part) from Prof. W. Drexler

Low Coherence Imaging § Op7cal Sources for OCT
• Most common used in commercial systems: SLD
λ0 = 870 nm Δλ = 180 nm
P0 = 5 mW
Superlum Ltd., Ireland
180 nm 2.5 μm

Low Coherence Imaging § Op7cal Sources for OCT
• Mostly used in R&D systems: fs-‐KLM Ti:Sapphire laser
Ophthalmic OCT exam (courtesy of Prof. W. Drexler)
FEMTOLASERS Produk7ons GmbH, Vienna, Austria
90 cm
45 cm
W.Drexler, et.al., Opt.Le|.24(17),1221-‐1223 (1991).
λ0 = 800 nm Δλ = 165 nm
Pavg = 40 mW

Low Coherence Imaging § Higher depth penetra7on into the eye?
• 1060 nm wavelength region § Local minimum in water absorp7on § Lower sca|ering 7ssue coefficient § Zero dispersion point of water § ANSI standard ~2 mW for 10 s exposure 7me
B. Povazay, et.al., Opt.Express 17 (5), 4134-‐4150 (2009)
840 nm 1060 nm Eye Fundus
SLD source ASE Doped-‐Fiber source

Low Coherence Imaging § Op7cal Sources for OCT
• ASE fiber sources @ 1060 nm § Yb-‐doped fiber (usually used as gain media) § Careful op7c design to avoid undesired laser emission § Spectral tailoring maybe necessary
A.B. Lobo Ribeiro, et.al., in Proc. SPIE vol.7139 (U.K., 2008), p.713903.

Low Coherence Imaging § Op7cal Sources for OCT
• ASE Yb-‐doped fiber source § Spectral bandwidth: 50 nm (typ.) § Output power (fiber): >50 mW
9.7 µm!
A.B. Lobo Ribeiro, et.al., in Proc. SPIE vol.7139 (U.K., 2008), p.713903.

Low Coherence Imaging § Op7cal Sources for OCT
• ASE fiber sources @ 1060 nm § Broader spectral bandwidth ⇒ other doped-‐fiber combina7ons
A.B. Lobo Ribeiro, et.al., US Patent 20100315700(A1), Dec. 2010
-50 -40 -30 -20 -10 0 10 20 30 40 500,0
0,2
0,4
0,6
0,8
1,0
Nor
mal
ized
inte
rfer
ogra
m
Optical path difference (µm)
7 µm
1000 1020 1040 1060 1080 1100 1120-35
-30
-25
-20
-15
-10
-5
0
λ0=1058.124 nm
ΔλFWHM = 71.209 nm
Pout= 21,3 mW
Pow
er d
ensi
ty (d
Bm
/nm
)
Wavelength (nm)
ASE Yb+Nd-‐doped fiber source

Low Coherence Imaging § ASE Yb+Nd-‐doped fiber source
• TD-‐OCT system @ 1 μm § With confocal channel § En-‐face and cross sec7onal OCT images § 15 μm lateral resolu7on § < 15 μm axial resolu7on § 2 Hz frame rate
I.Trifanov, et.al., IEEE Photon. Technol. Le|. 23, 21-‐23 (2011).

Low Coherence Imaging § ASE Yb+Nd-‐doped fiber source
• TD-‐OCT system @ 1 μm
I.Trifanov, et.al., IEEE Photon. Technol. Le|. 23, 21-‐23 (2011).
Choroid
100 µm RNFL"
GC/IPL"INL"OPL"ONL"ELM"
RPE"Ch/Chc"
IS/OS"
RNFL: re7nal nerve fiber layer; GC/IPL: ganglion cell/inner plexiform layer; INL: inner nuclear layer; OPL: outer plexiform layer; ONL: outer nuclear layer; ELM: external limi7ng membrane; IS/OS: photoreceptor inner segment/outer segment junc7on; RPE: re7nal pigment epithelium; Ch/Chc: choroid/choriocapillaris
Cross sec7onal OCT images of re7na

Low Coherence Imaging § Other OCT Modali7es: Fourier Domain OCT
Spectral Domain OCT (SD-‐OCT) Swept Source OCT (SS-‐OCT)
M. Wojtkowski, Appl. Opt. 49 (16), D30-‐D60 (2010).
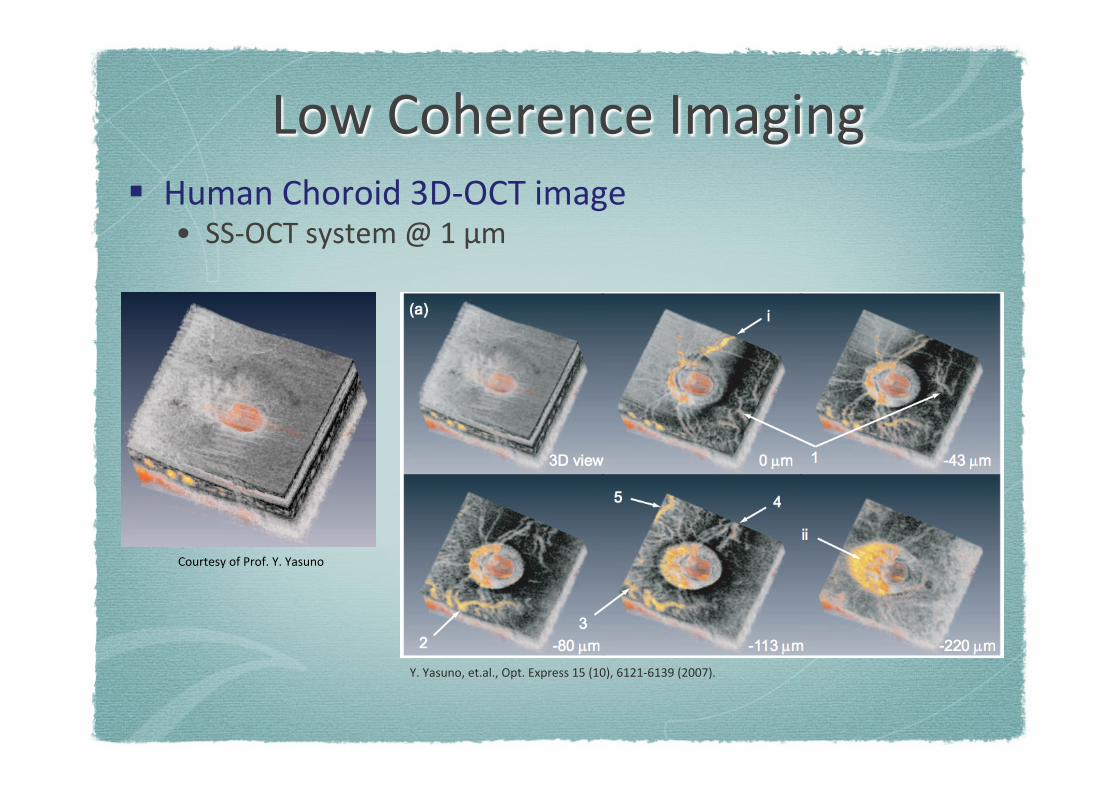
Low Coherence Imaging § Human Choroid 3D-‐OCT image
• SS-‐OCT system @ 1 μm
Courtesy of Prof. Y. Yasuno
Y. Yasuno, et.al., Opt. Express 15 (10), 6121-‐6139 (2007).

Low Coherence Imaging § Swept Fiber Laser @ 1060 nm
• Central wavelength: 1065 nm • Sweeping frequency: 1-‐ 8 kHz
A.B. Lobo Ribeiro, et.al., US Patent 2011069722(A1), Mar. 2011 I. Trifanov, et.al., in Proc. SPIE vol.7899,Photonics West 2011, pp.7899-‐100 (2011).

Low Coherence Imaging § OCT System with Swept Source @ 1060 nm
I. Trifanov, et.al., in Proc. SPIE vol.8091, BIOS Europe 2011, pp.8091-‐30 (2011).
Human tooth with lead implant (B-‐scan)
0 mm depth 2.5 mm depth 5 mm depth

Acknowledgements § UOSE/INESC-‐TEC & Physics Dept., FCUP (PT)
• Prof. José Luís Santos • UOSE R&D Team
§ AOG, School Phys. Sci., Univ. Kent (UK) § Prof. Adrian Podoleanu § Prof. David Jackson § AOG R&D Team
§ Mul7wave Photonics S.A. (PT) § Prof. José Salcedo § R&D Team
§ CMPBE, Medical Univ. Vienna (Austria) § Prof. Wolfgang Drexler § Dr. Boris Povazay
§ COG, Tsukuba Univ. (Japan) § Prof. Yoshiaki Yasuno

Thank you for your a|en7on