louisiana cancer facts & figures, colon and rectal cancer and rectal cancer • colon and rectal...
TRANSCRIPT
Louisiana Cancer Facts & Figures, Colon and Rectal Cancer
Louisiana Tumor RegistryJuly, 2017
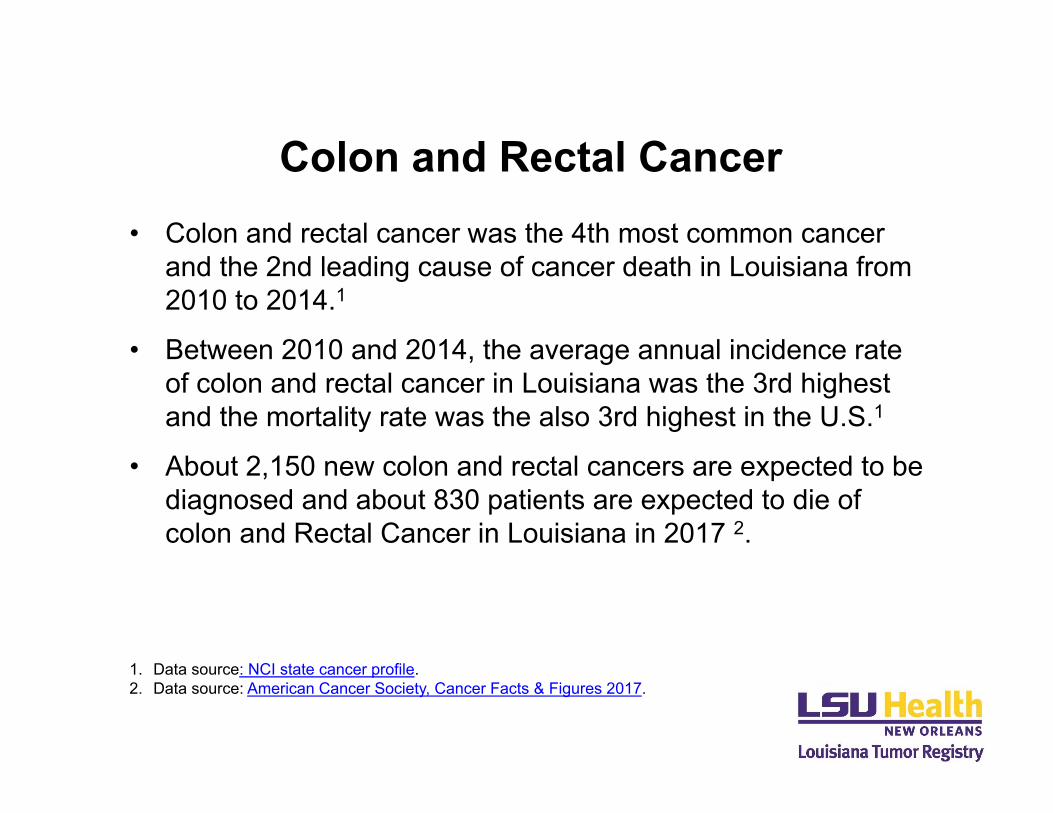
Colon and Rectal Cancer• Colon and rectal cancer was the 4th most common cancer
and the 2nd leading cause of cancer death in Louisiana from 2010 to 2014.1
• Between 2010 and 2014, the average annual incidence rate of colon and rectal cancer in Louisiana was the 3rd highest and the mortality rate was the also 3rd highest in the U.S.1
• About 2,150 new colon and rectal cancers are expected to be diagnosed and about 830 patients are expected to die of colon and Rectal Cancer in Louisiana in 2017 2.
1. Data source: NCI state cancer profile.2. Data source: American Cancer Society, Cancer Facts & Figures 2017.
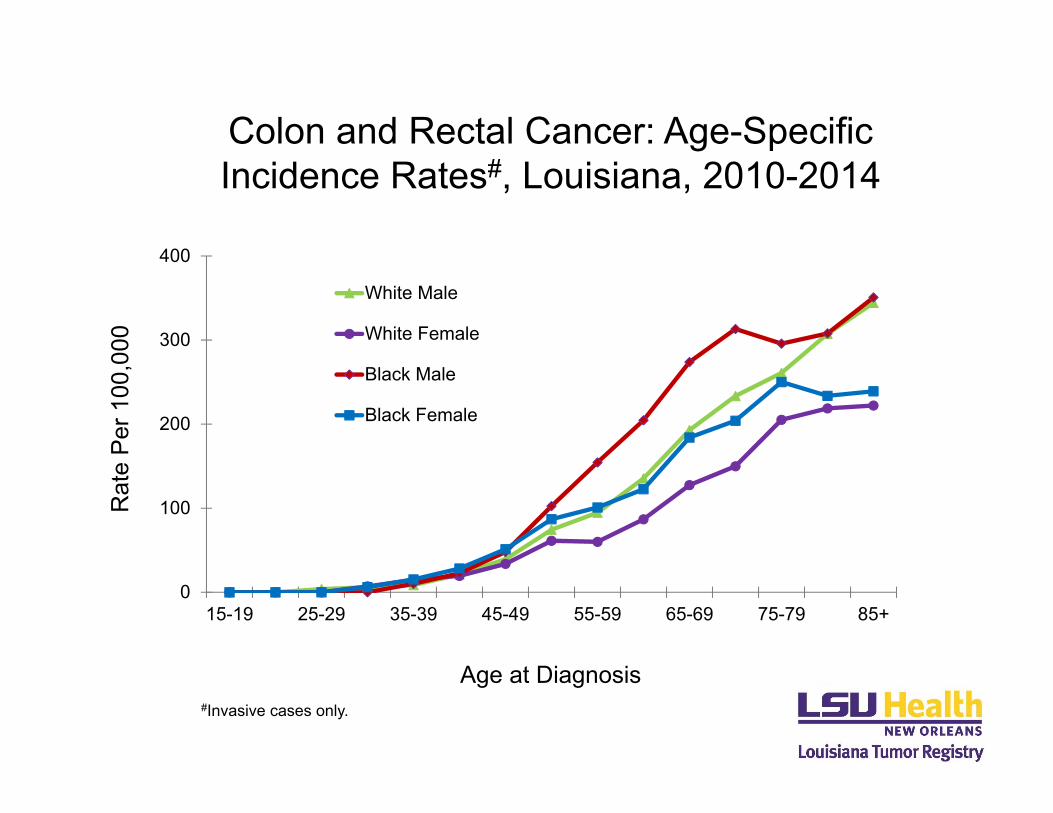
Colon and Rectal Cancer: Age-Specific Incidence Rates#, Louisiana, 2010-2014
Rat
e Pe
r 100
,000
Age at Diagnosis
0
100
200
300
400
15-19 25-29 35-39 45-49 55-59 65-69 75-79 85+
White Male
White Female
Black Male
Black Female
#Invasive cases only.
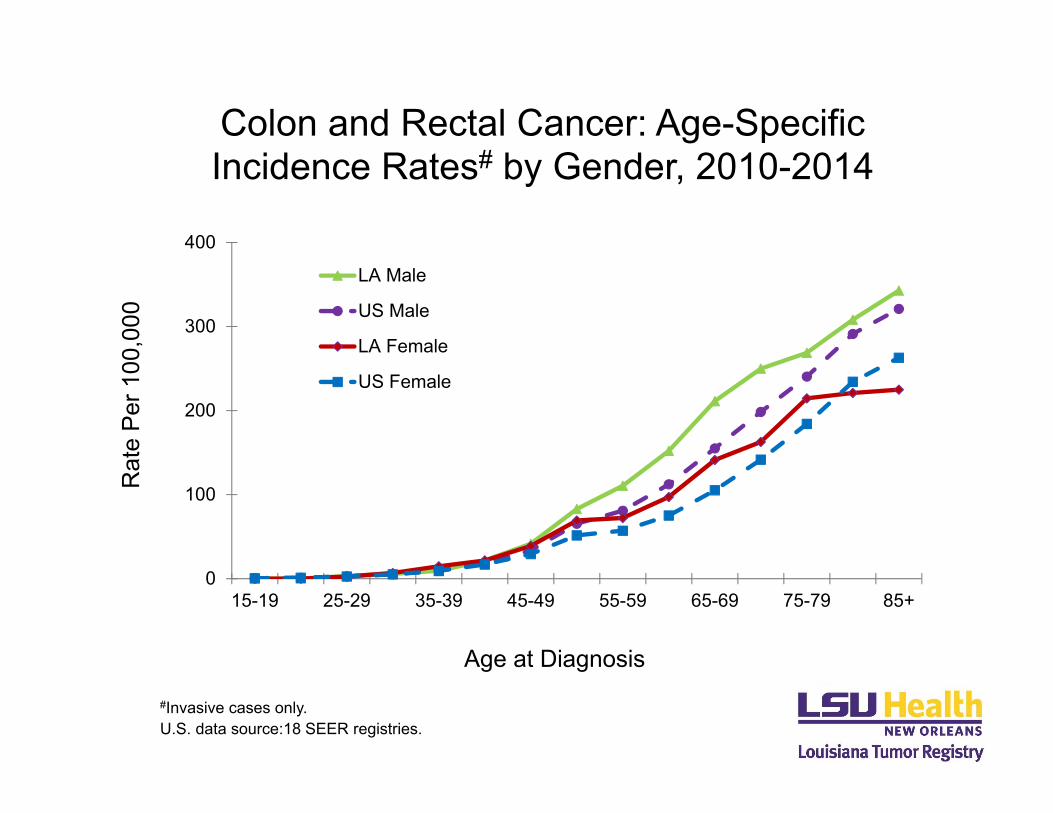
Colon and Rectal Cancer: Age-Specific Incidence Rates# by Gender, 2010-2014
Rat
e Pe
r 100
,000
Age at Diagnosis
#Invasive cases only.U.S. data source:18 SEER registries.
0
100
200
300
400
15-19 25-29 35-39 45-49 55-59 65-69 75-79 85+
LA Male
US Male
LA Female
US Female
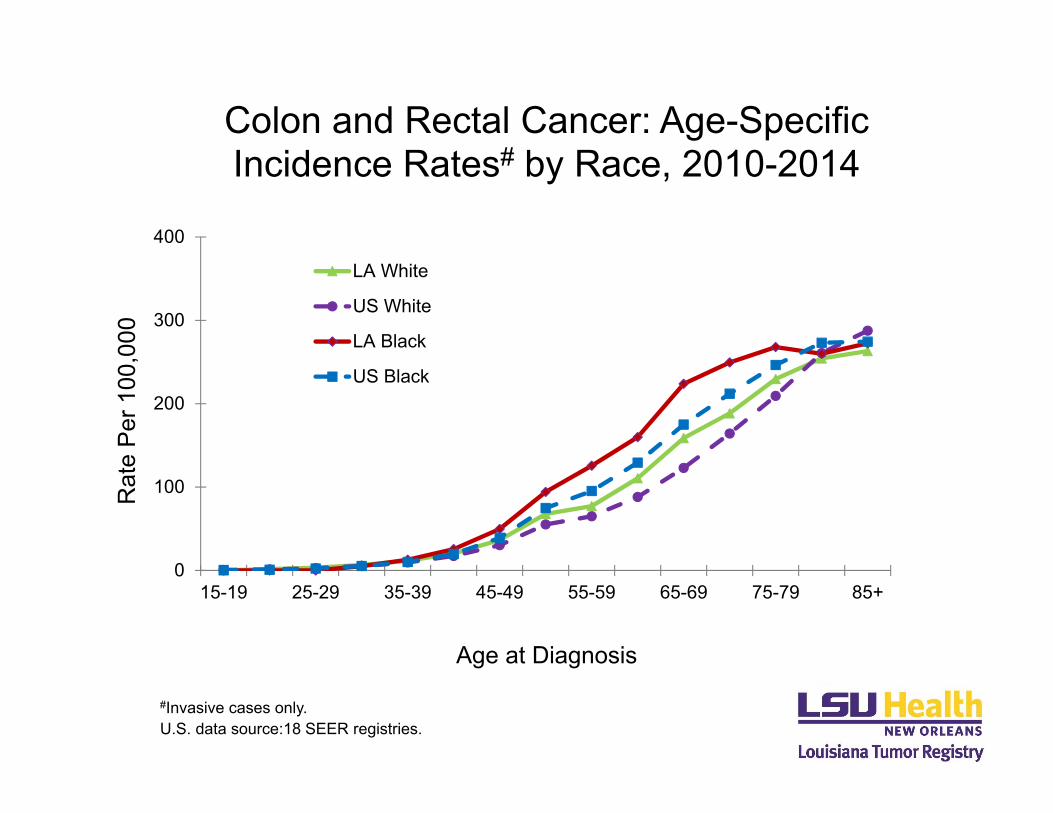
Colon and Rectal Cancer: Age-Specific Incidence Rates# by Race, 2010-2014
Rat
e Pe
r 100
,000
Age at Diagnosis
#Invasive cases only.U.S. data source:18 SEER registries.
0
100
200
300
400
15-19 25-29 35-39 45-49 55-59 65-69 75-79 85+
LA White
US White
LA Black
US Black
Rat
e Pe
r 100
,000
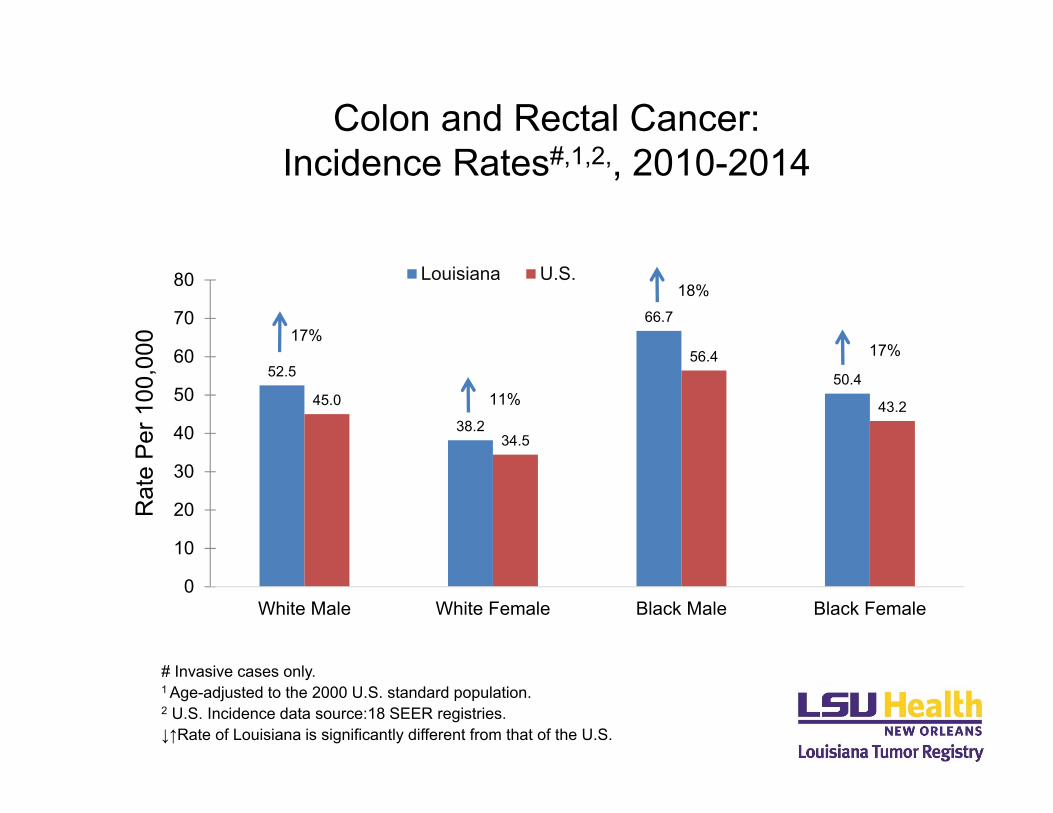
# Invasive cases only.1 Age-adjusted to the 2000 U.S. standard population. 2 U.S. Incidence data source:18 SEER registries.↓↑Rate of Louisiana is significantly different from that of the U.S.
Colon and Rectal Cancer: Incidence Rates#,1,2,, 2010-2014
52.5
38.2
66.7
50.445.0
34.5
56.4
43.2
0
10
20
30
40
50
60
70
80
White Male White Female Black Male Black Female
Louisiana U.S.
17%
11%
18%
17%
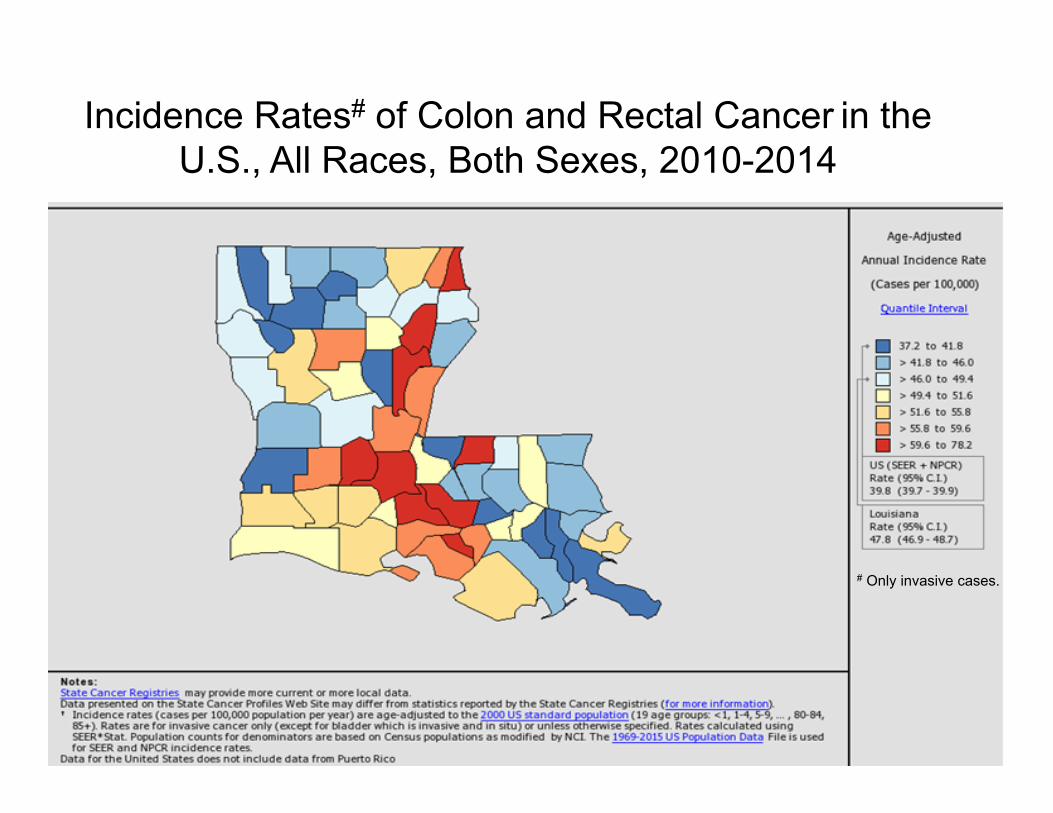
Incidence Rates# of Colon and Rectal Cancer in the U.S., All Races, Both Sexes, 2010-2014
# Only invasive cases.
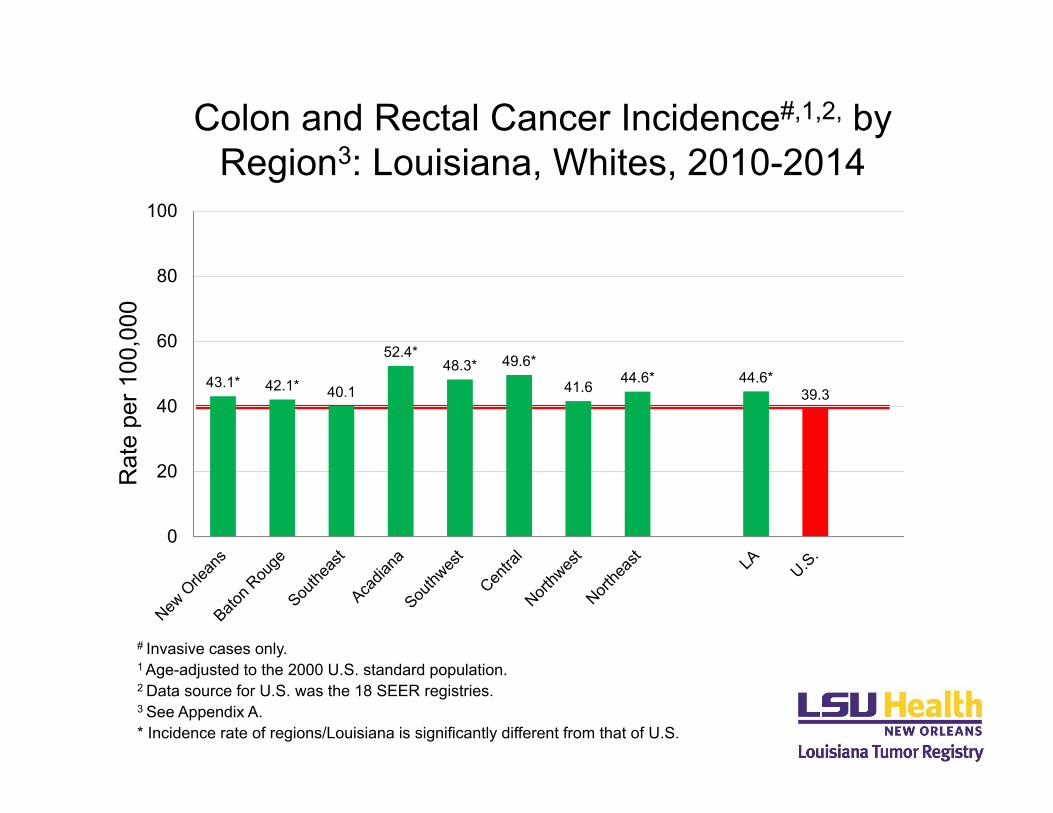
Colon and Rectal Cancer Incidence#,1,2, by Region3: Louisiana, Whites, 2010-2014
# Invasive cases only.1 Age-adjusted to the 2000 U.S. standard population. 2 Data source for U.S. was the 18 SEER registries.3 See Appendix A.* Incidence rate of regions/Louisiana is significantly different from that of U.S.
Rat
e pe
r 100
,000
43.1* 42.1* 40.1
52.4*48.3* 49.6*
41.6 44.6* 44.6*39.3
0
20
40
60
80
100
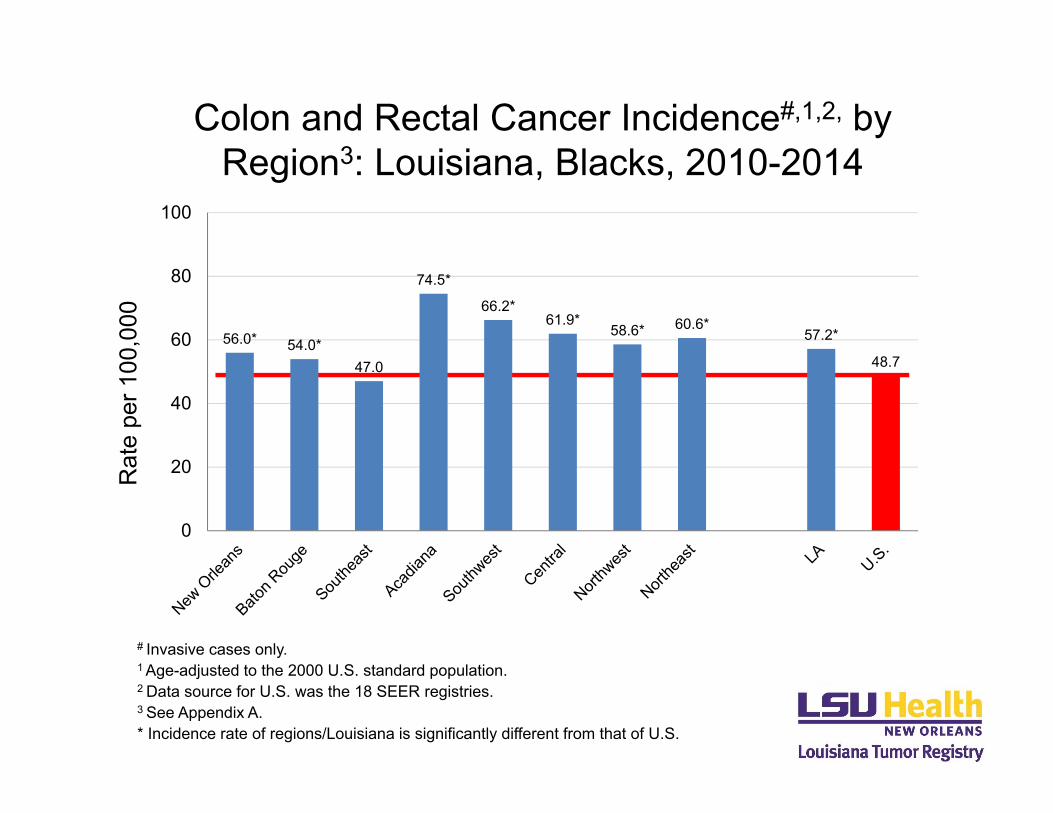
Colon and Rectal Cancer Incidence#,1,2, by Region3: Louisiana, Blacks, 2010-2014
Rat
e pe
r 100
,000
56.0* 54.0*47.0
74.5*
66.2*61.9*
58.6* 60.6*57.2*
48.7
0
20
40
60
80
100
# Invasive cases only.1 Age-adjusted to the 2000 U.S. standard population. 2 Data source for U.S. was the 18 SEER registries.3 See Appendix A.* Incidence rate of regions/Louisiana is significantly different from that of U.S.
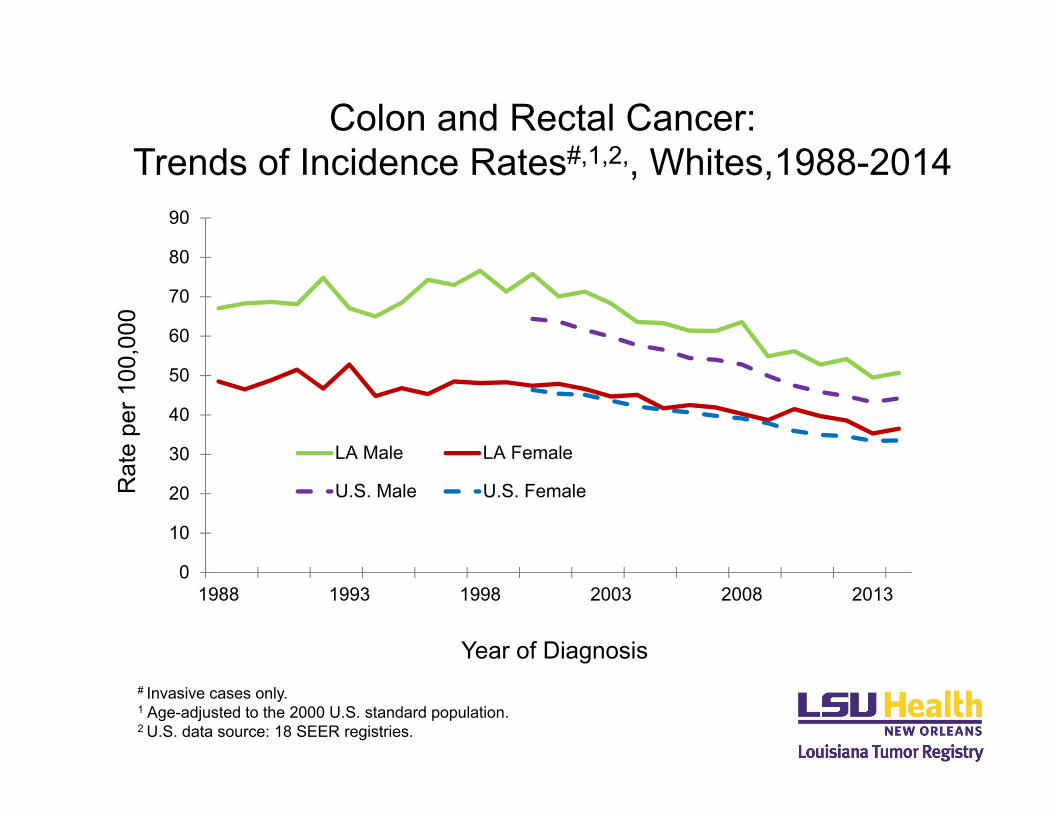
Colon and Rectal Cancer:Trends of Incidence Rates#,1,2,, Whites,1988-2014
Rat
e pe
r 100
,000
# Invasive cases only.1 Age-adjusted to the 2000 U.S. standard population. 2 U.S. data source: 18 SEER registries.
Year of Diagnosis
0
10
20
30
40
50
60
70
80
90
1988 1993 1998 2003 2008 2013
LA Male LA Female
U.S. Male U.S. Female
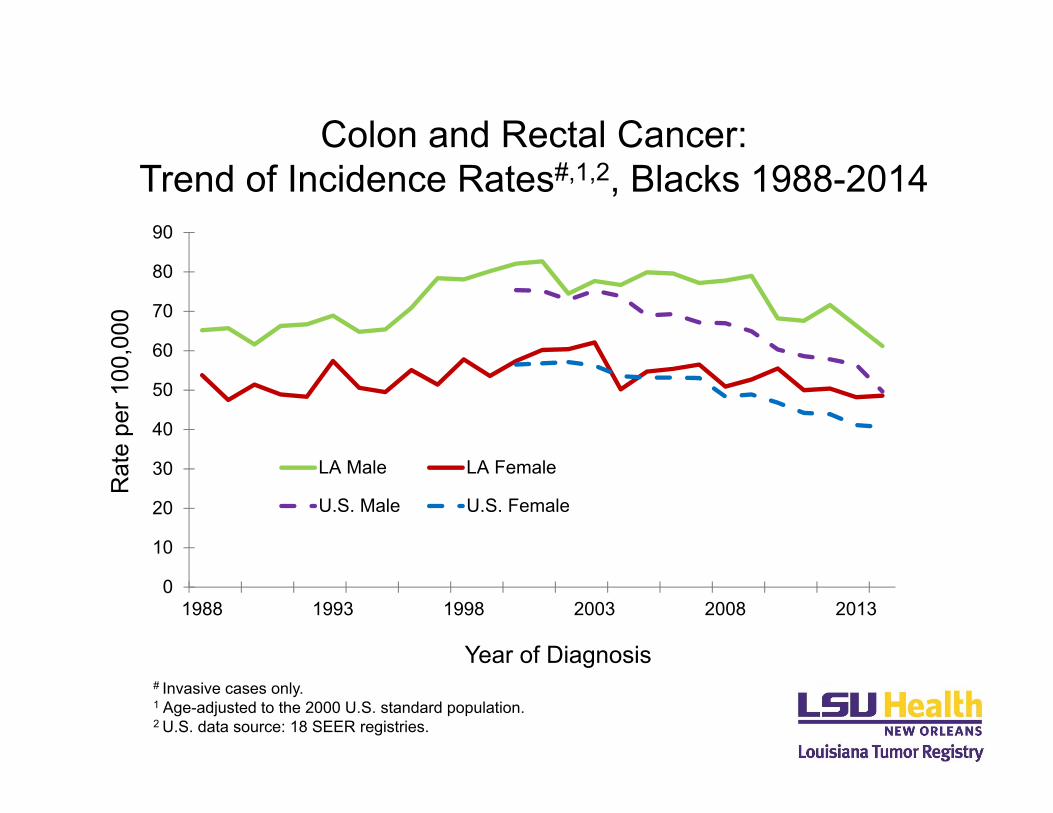
Colon and Rectal Cancer:Trend of Incidence Rates#,1,2, Blacks 1988-2014
Rat
e pe
r 100
,000
# Invasive cases only.1 Age-adjusted to the 2000 U.S. standard population. 2 U.S. data source: 18 SEER registries.
Year of Diagnosis
0
10
20
30
40
50
60
70
80
90
1988 1993 1998 2003 2008 2013
LA Male LA Female
U.S. Male U.S. Female
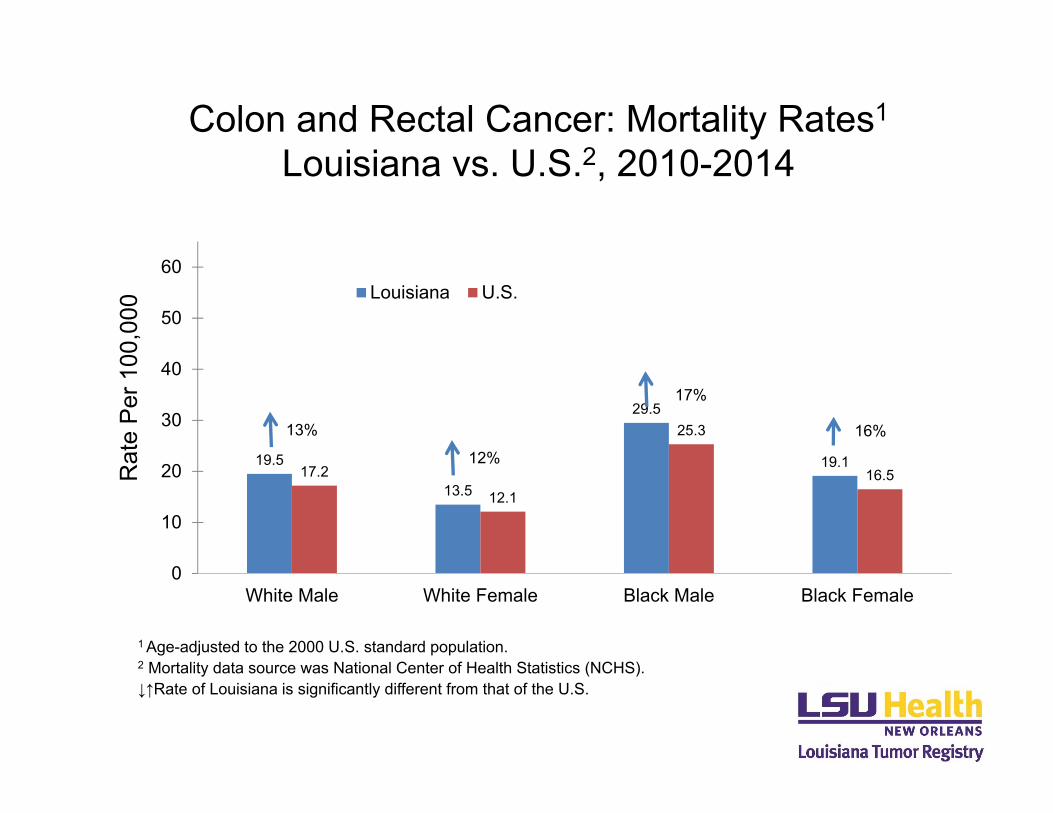
Colon and Rectal Cancer: Mortality Rates1
Louisiana vs. U.S.2, 2010-2014R
ate
Per 1
00,0
00
1 Age-adjusted to the 2000 U.S. standard population. 2 Mortality data source was National Center of Health Statistics (NCHS).↓↑Rate of Louisiana is significantly different from that of the U.S.
19.5
13.5
29.5
19.117.2
12.1
25.3
16.5
0
10
20
30
40
50
60
White Male White Female Black Male Black Female
Louisiana U.S.
13%
17%
12%16%
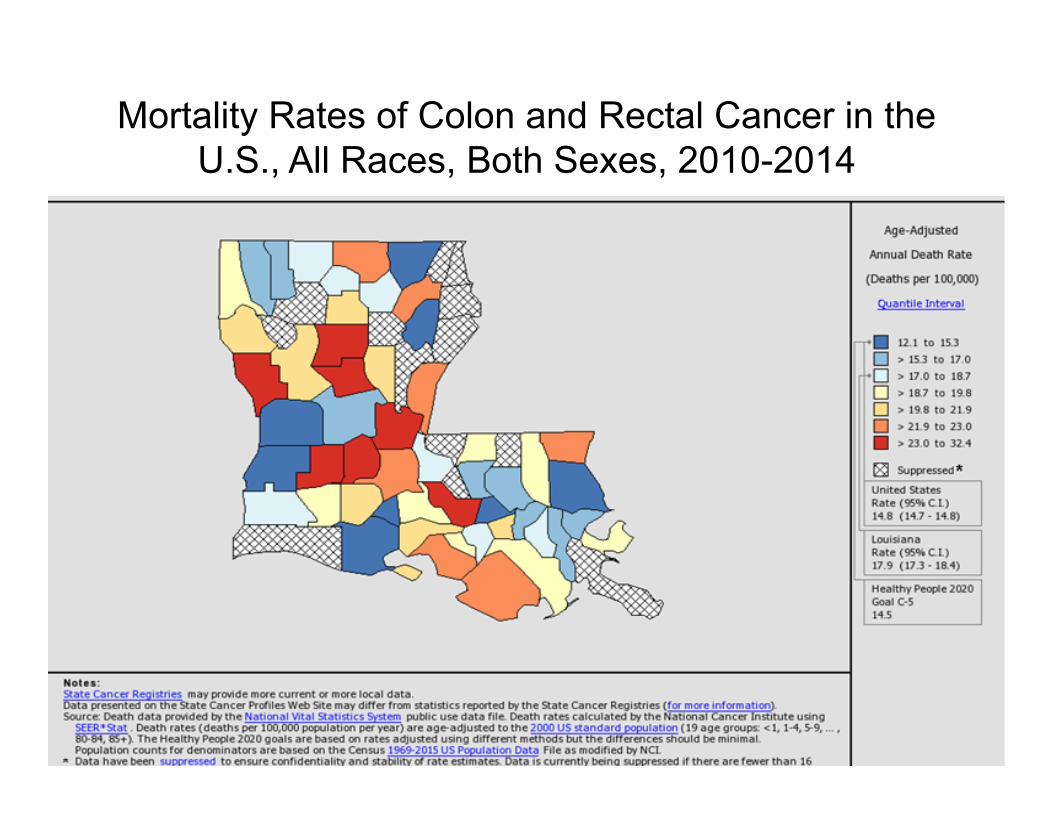
Mortality Rates of Colon and Rectal Cancer in the U.S., All Races, Both Sexes, 2010-2014
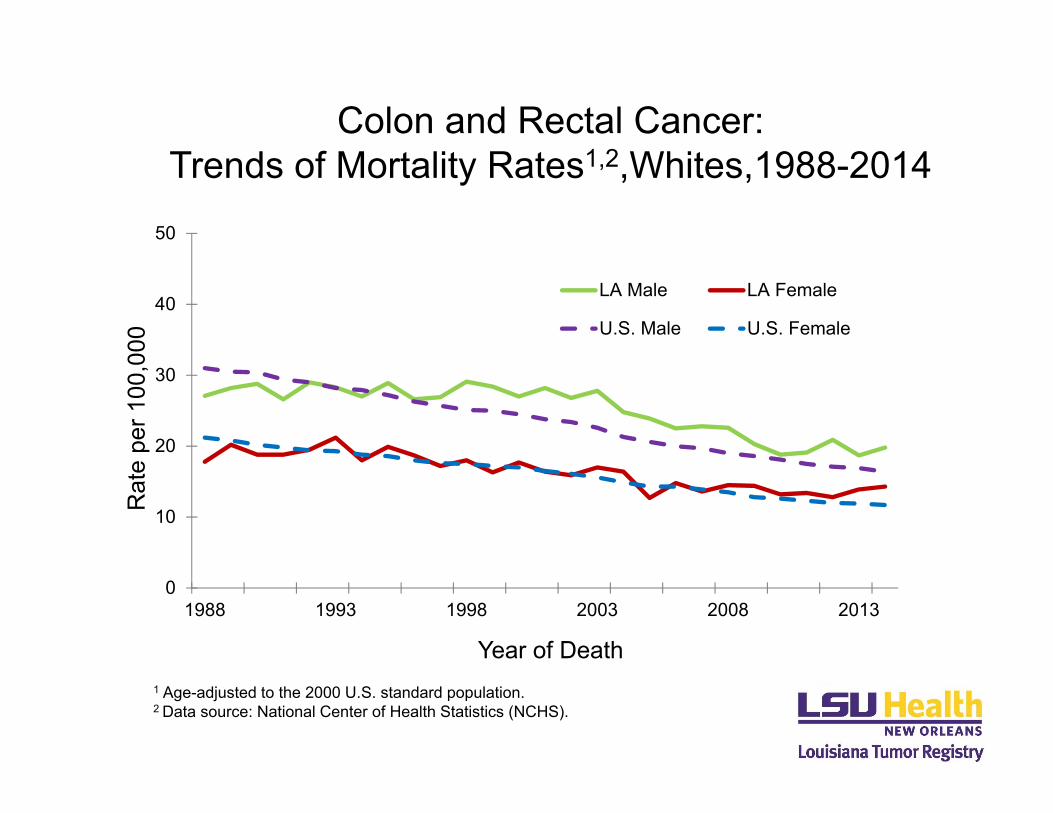
Colon and Rectal Cancer: Trends of Mortality Rates1,2,Whites,1988-2014
Rat
e pe
r 100
,000
1 Age-adjusted to the 2000 U.S. standard population. 2 Data source: National Center of Health Statistics (NCHS).
Year of Death
0
10
20
30
40
50
1988 1993 1998 2003 2008 2013
LA Male LA Female
U.S. Male U.S. Female
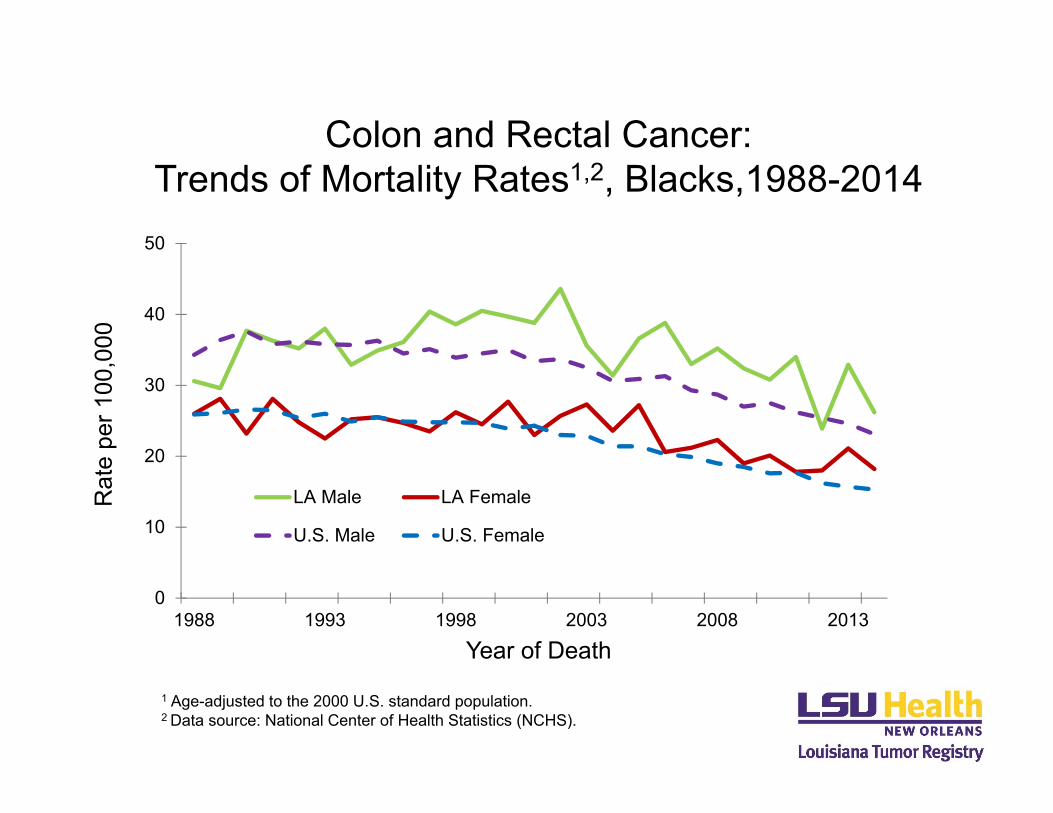
Colon and Rectal Cancer: Trends of Mortality Rates1,2, Blacks,1988-2014
Rat
e pe
r 100
,000
1 Age-adjusted to the 2000 U.S. standard population.2 Data source: National Center of Health Statistics (NCHS).
Year of Death
0
10
20
30
40
50
1988 1993 1998 2003 2008 2013
LA Male LA Female
U.S. Male U.S. Female
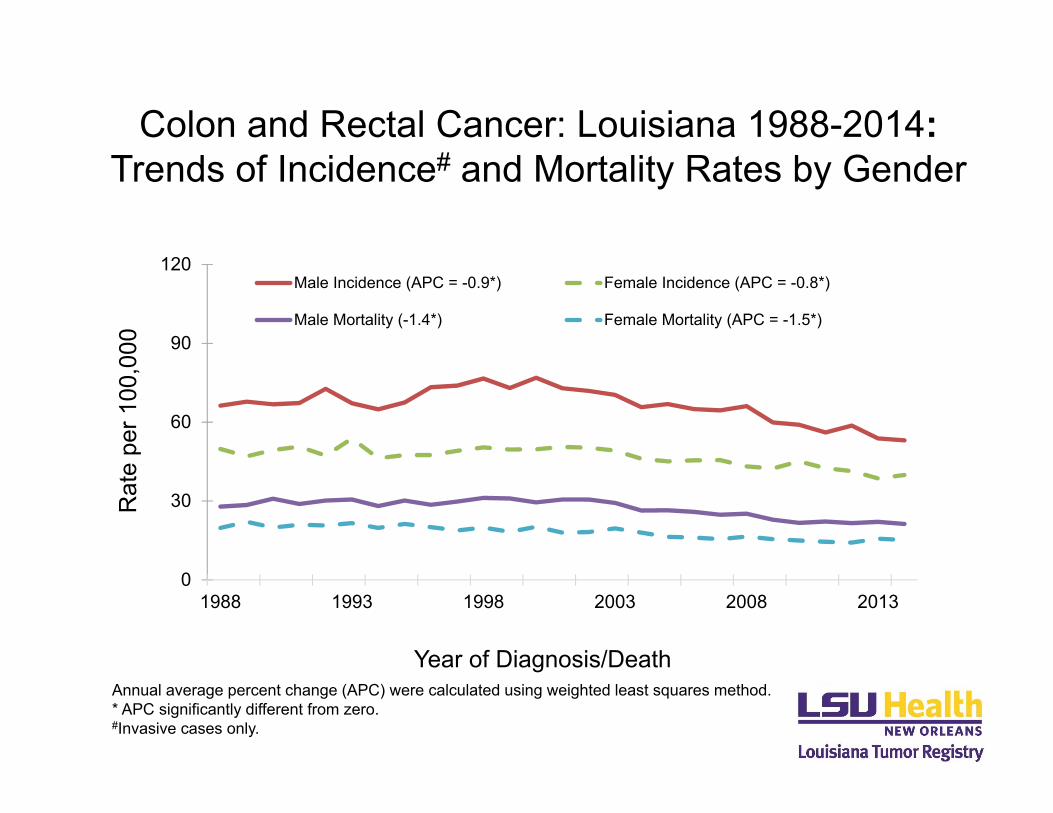
Colon and Rectal Cancer: Louisiana 1988-2014:Trends of Incidence# and Mortality Rates by Gender
Year of Diagnosis/Death
Rat
e pe
r 100
,000
0
30
60
90
120
1988 1993 1998 2003 2008 2013
Male Incidence (APC = -0.9*) Female Incidence (APC = -0.8*)
Male Mortality (-1.4*) Female Mortality (APC = -1.5*)
Annual average percent change (APC) were calculated using weighted least squares method.* APC significantly different from zero.#Invasive cases only.
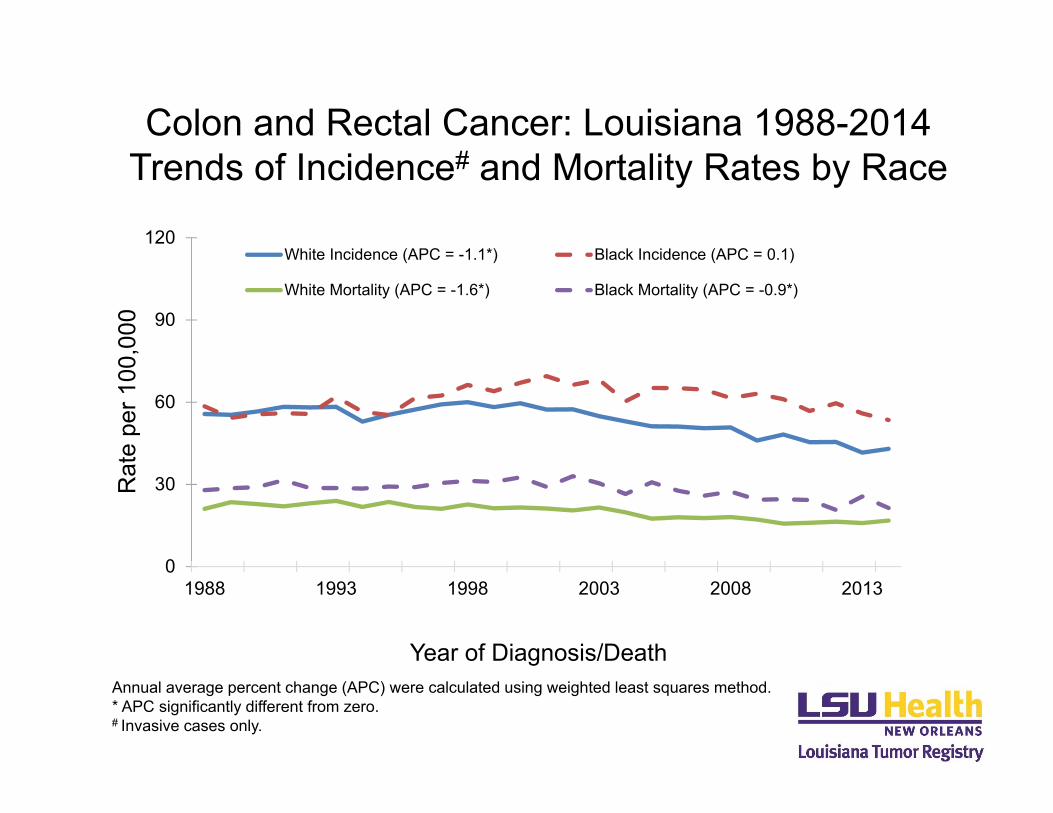
Colon and Rectal Cancer: Louisiana 1988-2014Trends of Incidence# and Mortality Rates by Race
Year of Diagnosis/Death
Rat
e pe
r 100
,000
0
30
60
90
120
1988 1993 1998 2003 2008 2013
White Incidence (APC = -1.1*) Black Incidence (APC = 0.1)
White Mortality (APC = -1.6*) Black Mortality (APC = -0.9*)
Annual average percent change (APC) were calculated using weighted least squares method.* APC significantly different from zero.# Invasive cases only.
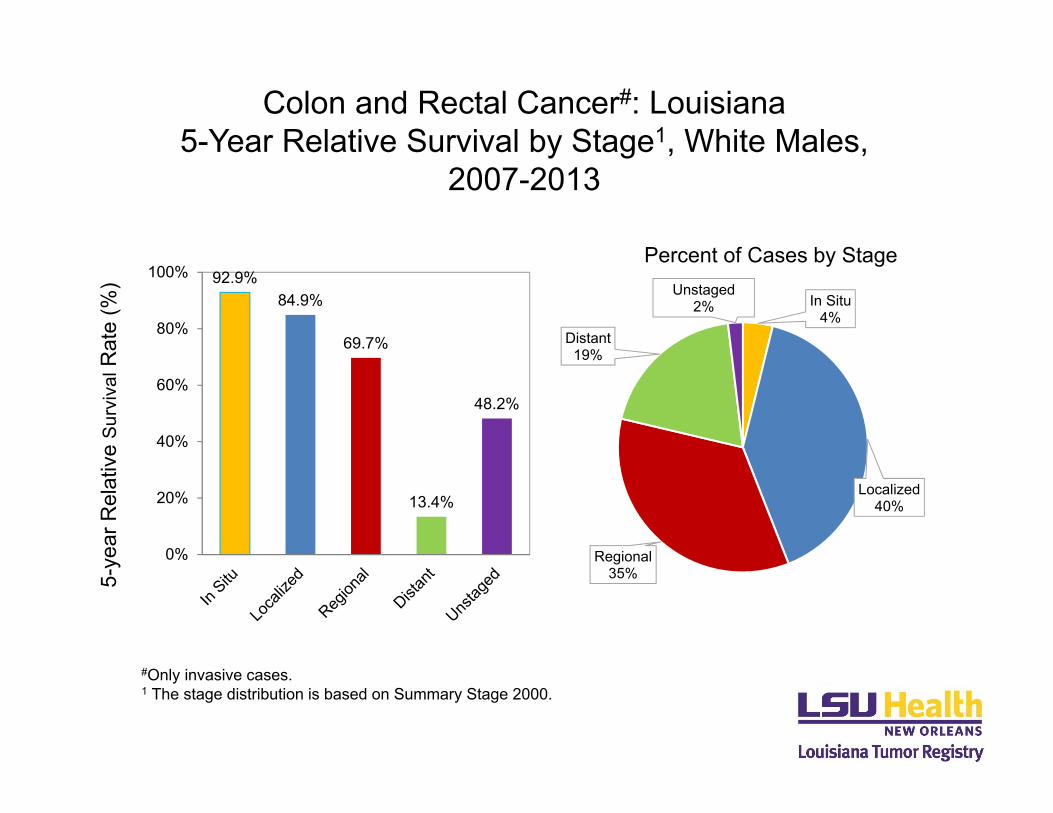
Colon and Rectal Cancer#: Louisiana5-Year Relative Survival by Stage1, White Males,
2007-2013
5-ye
ar R
elat
ive
Surv
ival
Rat
e (%
)
#Only invasive cases.1 The stage distribution is based on Summary Stage 2000.
Percent of Cases by Stage
In Situ4%
Localized40%
Regional35%
Distant19%
Unstaged2%
92.9%84.9%
69.7%
13.4%
48.2%
0%
20%
40%
60%
80%
100%
5-ye
ar R
elat
ive
Surv
ival
Rat
e (%
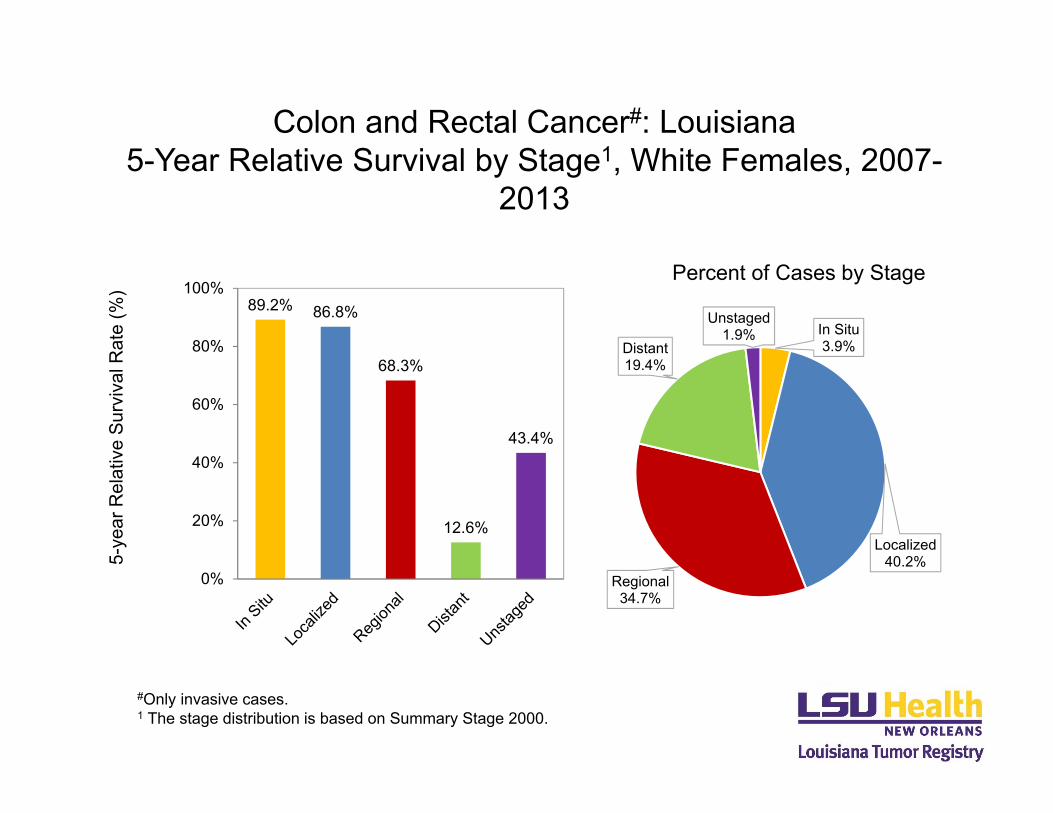
)Colon and Rectal Cancer#: Louisiana
5-Year Relative Survival by Stage1, White Females, 2007-2013
Percent of Cases by Stage
In Situ3.9%
Localized40.2%
Regional34.7%
Distant19.4%
Unstaged1.9%
89.2% 86.8%
68.3%
12.6%
43.4%
0%
20%
40%
60%
80%
100%
#Only invasive cases.1 The stage distribution is based on Summary Stage 2000.
5-ye
ar R
elat
ive
Surv
ival
Rat
e (%
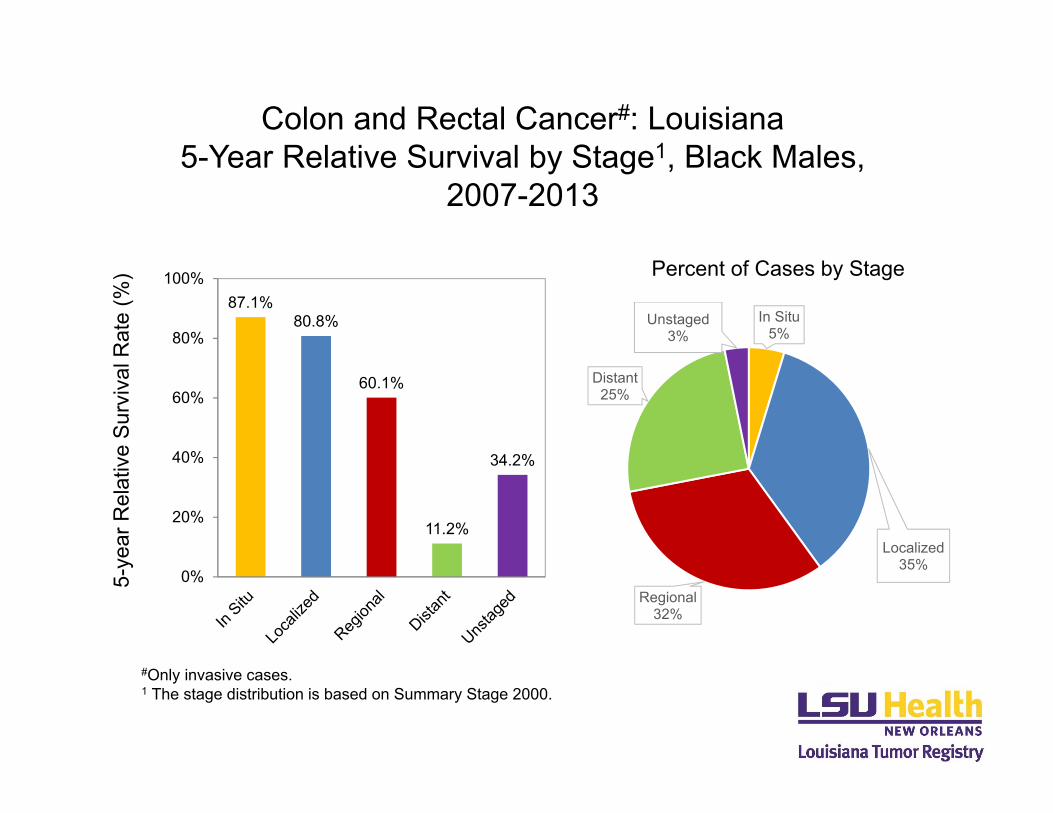
)Colon and Rectal Cancer#: Louisiana
5-Year Relative Survival by Stage1, Black Males, 2007-2013
Percent of Cases by Stage
In Situ5%
Localized35%
Regional32%
Distant25%
Unstaged3%
87.1%80.8%
60.1%
11.2%
34.2%
0%
20%
40%
60%
80%
100%
#Only invasive cases.1 The stage distribution is based on Summary Stage 2000.

5-ye
ar R
elat
ive
Surv
ival
Rat
e (%
)Colon and Rectal Cancer#: Louisiana
5-Year Relative Survival by Stage1, Black Females, 2007-2013
Percent of Cases by Stage
In Situ4%
Localized38%
Regional32%
Distant23%
Unstaged3%
93.6%86.0%
72.1%
11.9%
45.6%
0%
20%
40%
60%
80%
100%
#Only invasive cases.1 The stage distribution is based on Summary Stage 2000.
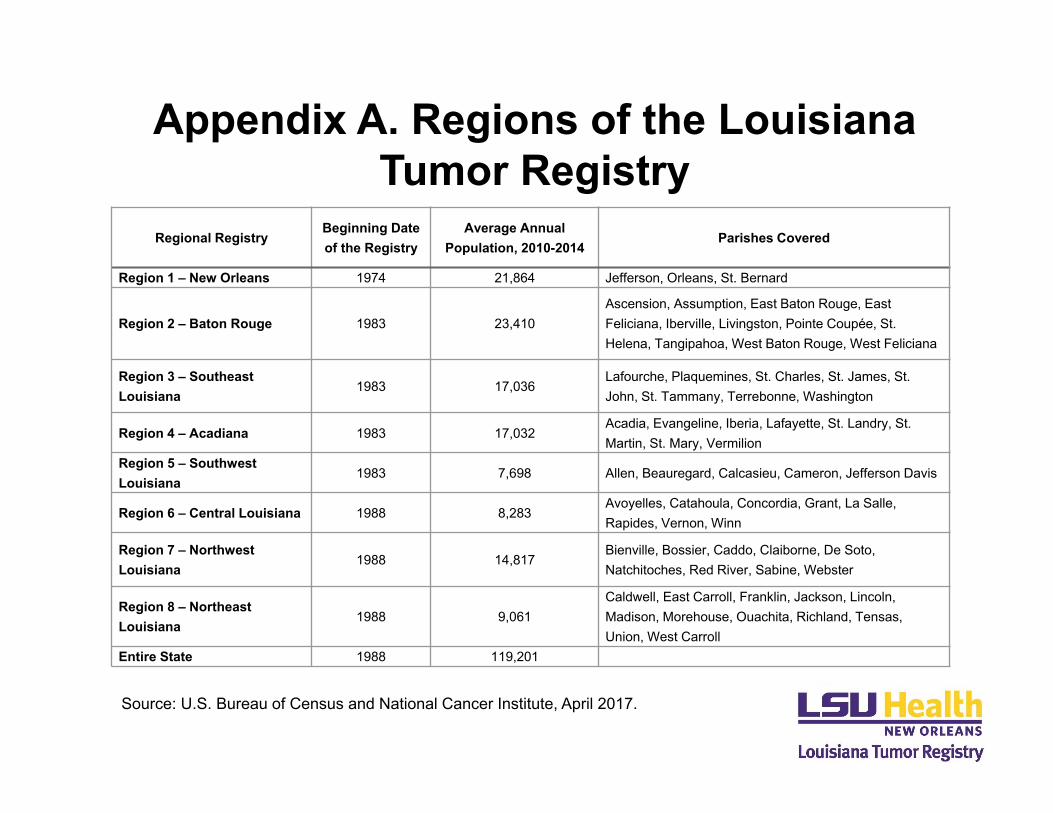
Appendix A. Regions of the Louisiana Tumor Registry
Regional RegistryBeginning Date of the Registry
Average Annual Population, 2010-2014
Parishes Covered
Region 1 – New Orleans 1974 21,864 Jefferson, Orleans, St. Bernard
Region 2 – Baton Rouge 1983 23,410Ascension, Assumption, East Baton Rouge, East Feliciana, Iberville, Livingston, Pointe Coupée, St. Helena, Tangipahoa, West Baton Rouge, West Feliciana
Region 3 – Southeast Louisiana
1983 17,036Lafourche, Plaquemines, St. Charles, St. James, St. John, St. Tammany, Terrebonne, Washington
Region 4 – Acadiana 1983 17,032Acadia, Evangeline, Iberia, Lafayette, St. Landry, St. Martin, St. Mary, Vermilion
Region 5 – Southwest Louisiana
1983 7,698 Allen, Beauregard, Calcasieu, Cameron, Jefferson Davis
Region 6 – Central Louisiana 1988 8,283Avoyelles, Catahoula, Concordia, Grant, La Salle, Rapides, Vernon, Winn
Region 7 – Northwest Louisiana
1988 14,817Bienville, Bossier, Caddo, Claiborne, De Soto, Natchitoches, Red River, Sabine, Webster
Region 8 – Northeast Louisiana
1988 9,061Caldwell, East Carroll, Franklin, Jackson, Lincoln, Madison, Morehouse, Ouachita, Richland, Tensas, Union, West Carroll
Entire State 1988 119,201
Source: U.S. Bureau of Census and National Cancer Institute, April 2017.
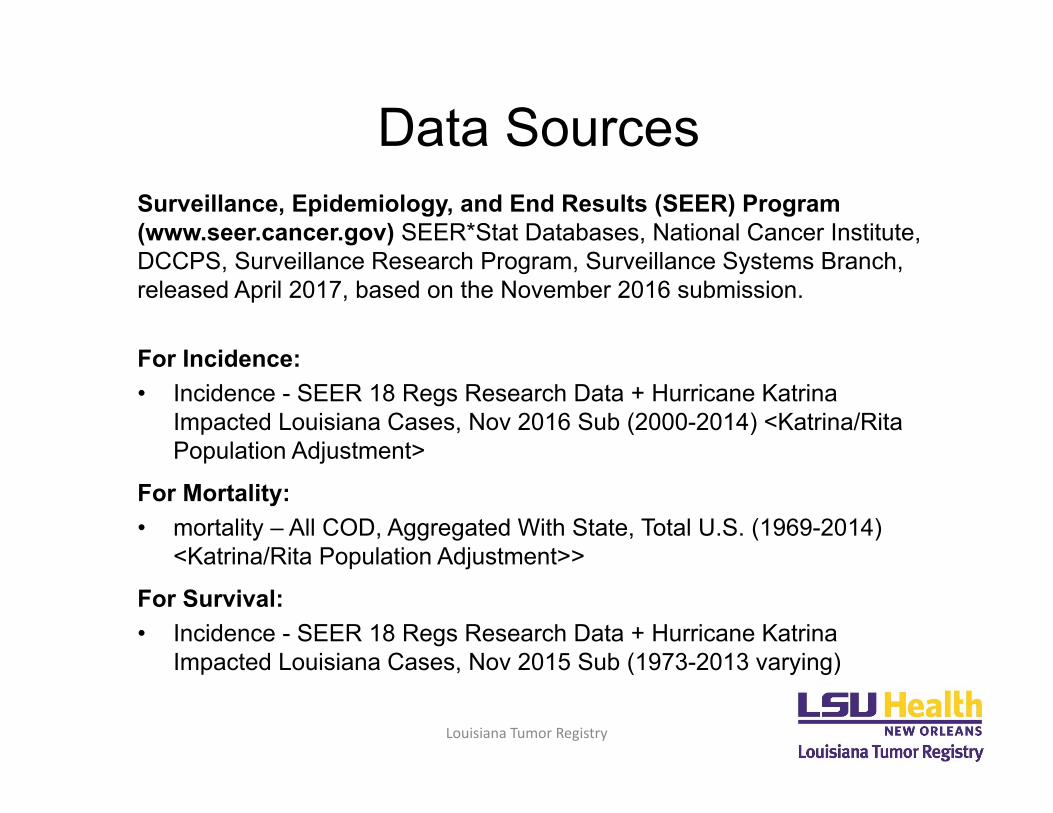
Data SourcesSurveillance, Epidemiology, and End Results (SEER) Program (www.seer.cancer.gov) SEER*Stat Databases, National Cancer Institute, DCCPS, Surveillance Research Program, Surveillance Systems Branch, released April 2017, based on the November 2016 submission.
For Incidence:• Incidence - SEER 18 Regs Research Data + Hurricane Katrina
Impacted Louisiana Cases, Nov 2016 Sub (2000-2014) <Katrina/Rita Population Adjustment>
For Mortality:• mortality – All COD, Aggregated With State, Total U.S. (1969-2014)
<Katrina/Rita Population Adjustment>>
For Survival:• Incidence - SEER 18 Regs Research Data + Hurricane Katrina
Impacted Louisiana Cases, Nov 2015 Sub (1973-2013 varying)
Louisiana Tumor Registry
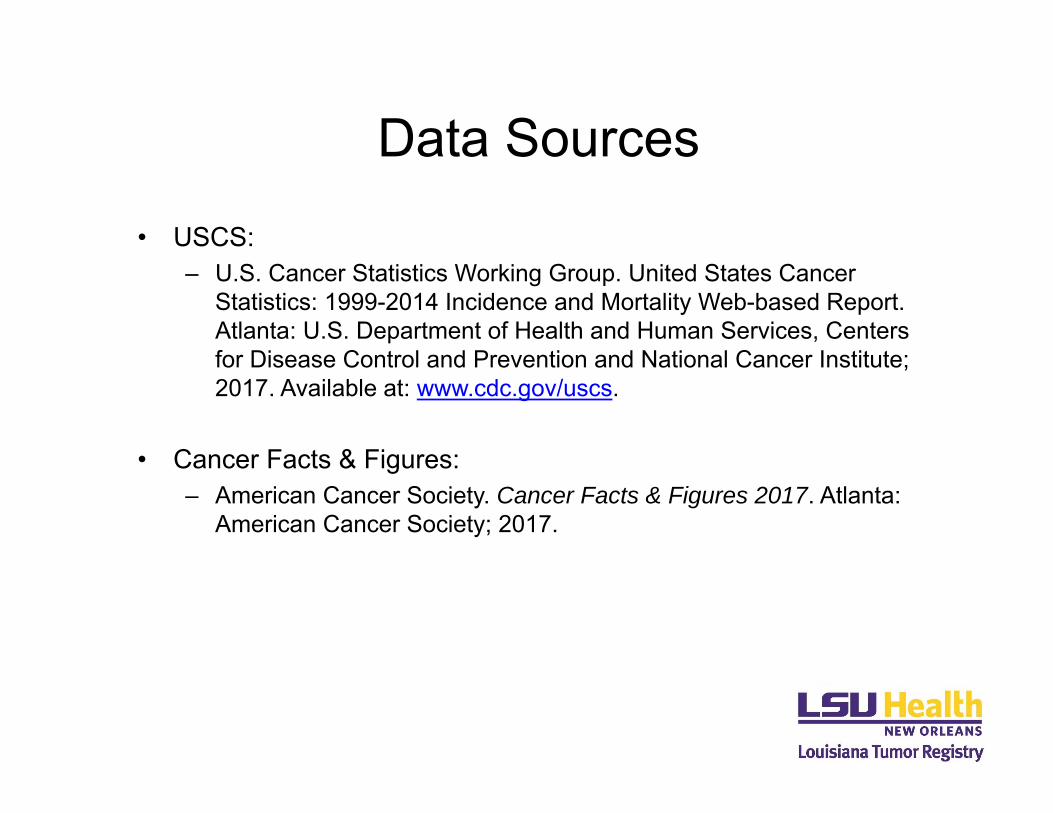
Data Sources• USCS:
– U.S. Cancer Statistics Working Group. United States Cancer Statistics: 1999-2014 Incidence and Mortality Web-based Report. Atlanta: U.S. Department of Health and Human Services, Centers for Disease Control and Prevention and National Cancer Institute; 2017. Available at: www.cdc.gov/uscs.
• Cancer Facts & Figures:– American Cancer Society. Cancer Facts & Figures 2017. Atlanta:
American Cancer Society; 2017.
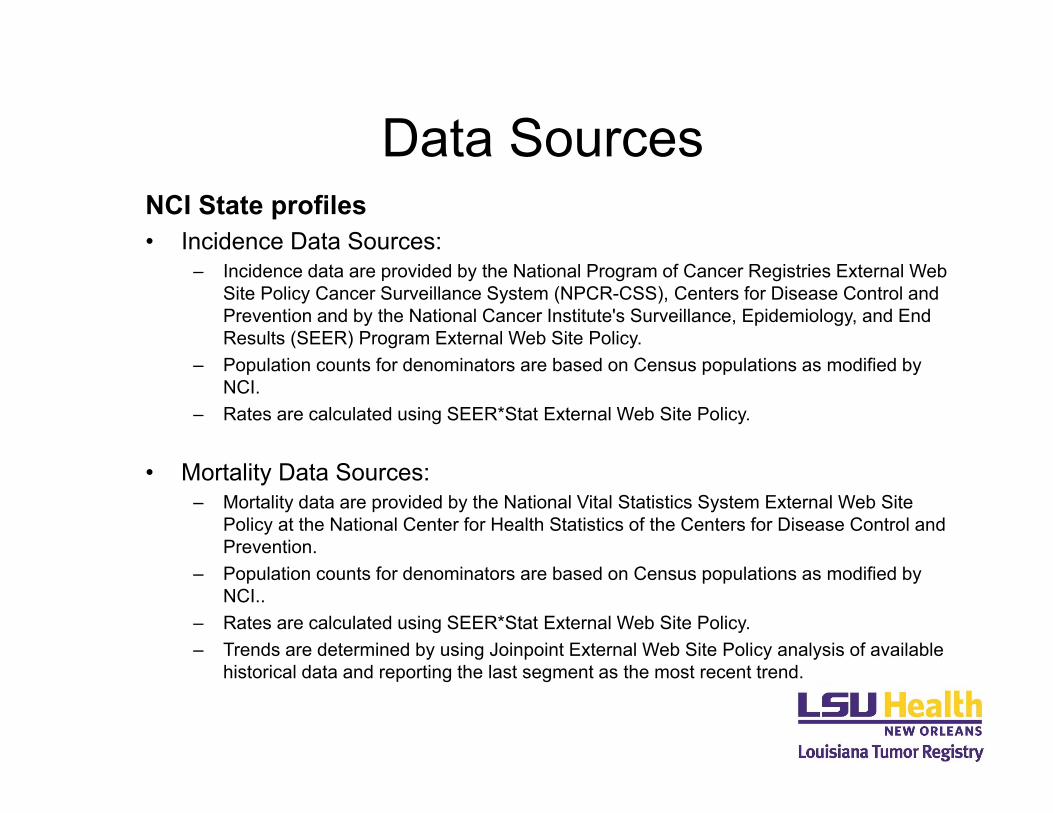
Data SourcesNCI State profiles • Incidence Data Sources:
– Incidence data are provided by the National Program of Cancer Registries External Web Site Policy Cancer Surveillance System (NPCR-CSS), Centers for Disease Control and Prevention and by the National Cancer Institute's Surveillance, Epidemiology, and End Results (SEER) Program External Web Site Policy.
– Population counts for denominators are based on Census populations as modified by NCI.
– Rates are calculated using SEER*Stat External Web Site Policy.
• Mortality Data Sources:– Mortality data are provided by the National Vital Statistics System External Web Site
Policy at the National Center for Health Statistics of the Centers for Disease Control and Prevention.
– Population counts for denominators are based on Census populations as modified by NCI..
– Rates are calculated using SEER*Stat External Web Site Policy.– Trends are determined by using Joinpoint External Web Site Policy analysis of available
historical data and reporting the last segment as the most recent trend.
Acknowledgements
• Hospital cancer registries (http://louisianatumorregistry.lsuhsc.edu/)• Louisiana Cancer Registrars’ Association (http://www.lcra-usa.org/)• Physicians and staff members in:
• Medical records offices• Pathology laboratories • Physician offices and clinics • Hospice programs and nursing homes
• Regional and central offices of the Louisiana Tumor Registry (http://louisianatumorregistry.lsuhsc.edu/regionalregistries.html)
• School of Public Health, LSU Health Sciences Center–New Orleans• Louisiana Cancer and Lung Trust Fund Board• Coroners’ offices
Sources of LTR Funding
• National Cancer Institute, SEER Program• Centers for Disease Control and Prevention (CDC),
National Program of Cancer Registries (NPCR) Program
• Louisiana Health Care Services Division

EditorsYong Yi, PhD, MS
Lauren Maniscalco, MPHMeichin Hsieh, PhD, MSPH, CTRXiaocheng Wu, MD, MPH, CTR
ContributorsXiangrong Li, MD, MSPH
Brent Mumphrey, BSTina Lefante, MPH
Lisa Pareti, BS, RHIT, CTRCarla B. Rosales, MPH