looking inside sas® forecast studio · title: looking inside sas® forecast studio author: sara...
TRANSCRIPT
Copyright © 2012, SAS Institute Inc. All rights reserved.
make connections • share ideas • be inspired
Sara Vidal Sr Solutions Architect SAS CH
Looking inside SAS® Forecast Studio
Copyright © 2012, SAS Institute Inc. All rights reserved.
Agenda
SAS Forecast Server
What is SAS Forecast Studio?
SAS Forecast Studio most recent features
Copyright © 2012, SAS Institute Inc. All rights reserved.
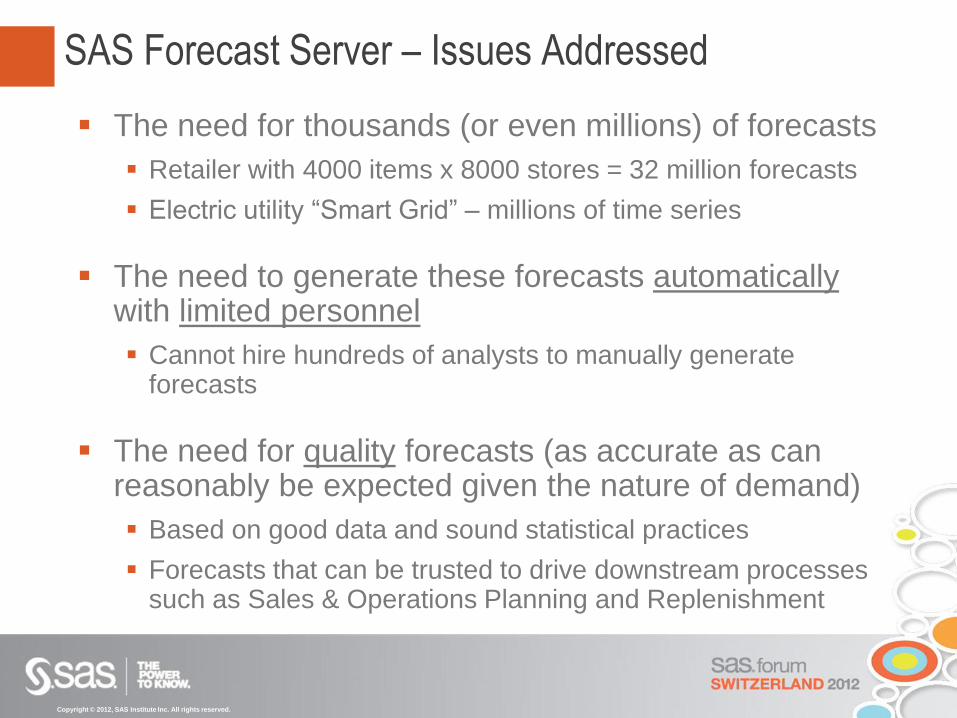
SAS Forecast Server – Issues Addressed
The need for thousands (or even millions) of forecasts
Retailer with 4000 items x 8000 stores = 32 million forecasts
Electric utility “Smart Grid” – millions of time series
The need to generate these forecasts automatically with limited personnel
Cannot hire hundreds of analysts to manually generate forecasts
The need for quality forecasts (as accurate as can reasonably be expected given the nature of demand)
Based on good data and sound statistical practices
Forecasts that can be trusted to drive downstream processes such as Sales & Operations Planning and Replenishment
Copyright © 2012, SAS Institute Inc. All rights reserved.
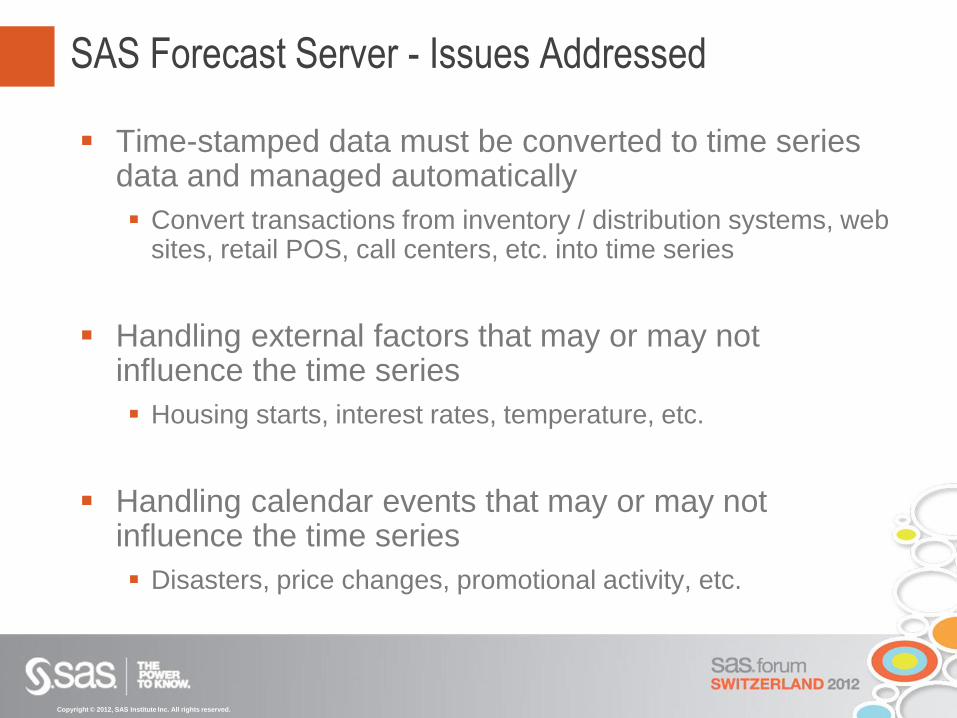
Time-stamped data must be converted to time series data and managed automatically
Convert transactions from inventory / distribution systems, web sites, retail POS, call centers, etc. into time series
Handling external factors that may or may not influence the time series
Housing starts, interest rates, temperature, etc.
Handling calendar events that may or may not influence the time series
Disasters, price changes, promotional activity, etc.
SAS Forecast Server - Issues Addressed
Copyright © 2012, SAS Institute Inc. All rights reserved.
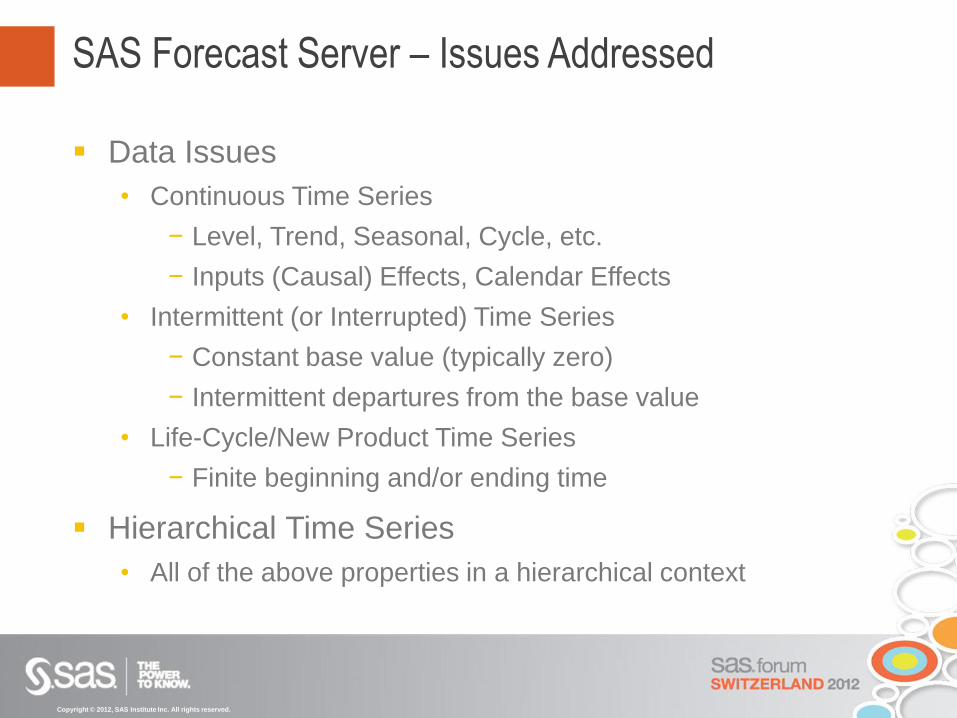
Data Issues
• Continuous Time Series
− Level, Trend, Seasonal, Cycle, etc.
− Inputs (Causal) Effects, Calendar Effects
• Intermittent (or Interrupted) Time Series
− Constant base value (typically zero)
− Intermittent departures from the base value
• Life-Cycle/New Product Time Series
− Finite beginning and/or ending time
Hierarchical Time Series
• All of the above properties in a hierarchical context
SAS Forecast Server – Issues Addressed
Copyright © 2012, SAS Institute Inc. All rights reserved.
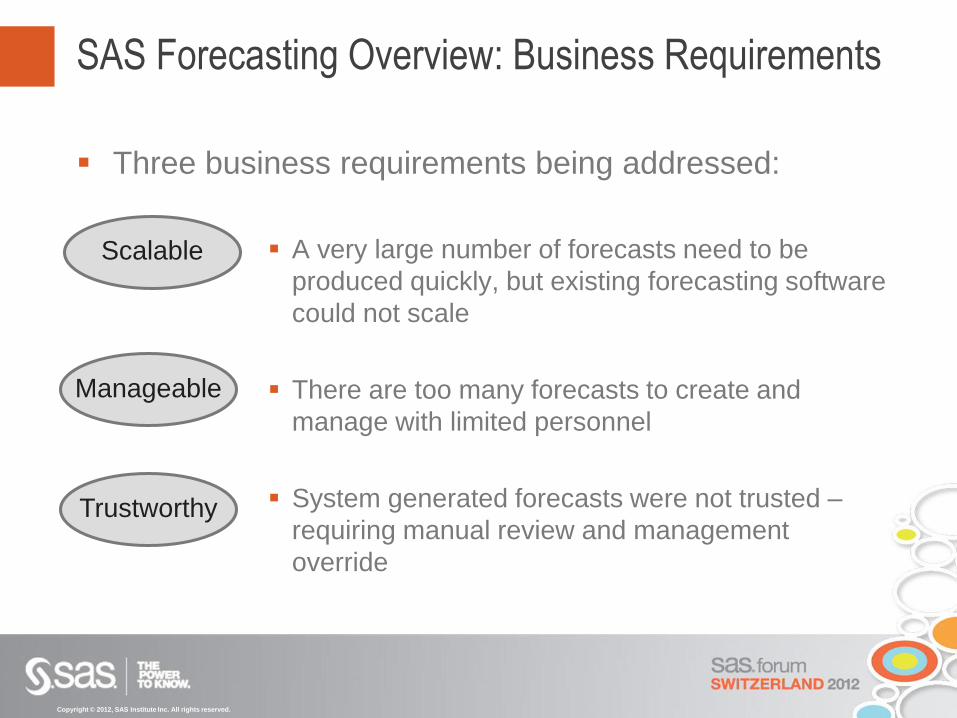
Three business requirements being addressed:
A very large number of forecasts need to be
produced quickly, but existing forecasting software
could not scale
There are too many forecasts to create and
manage with limited personnel
System generated forecasts were not trusted –
requiring manual review and management
override
Scalable
Manageable
Trustworthy
SAS Forecasting Overview: Business Requirements
Copyright © 2012, SAS Institute Inc. All rights reserved.
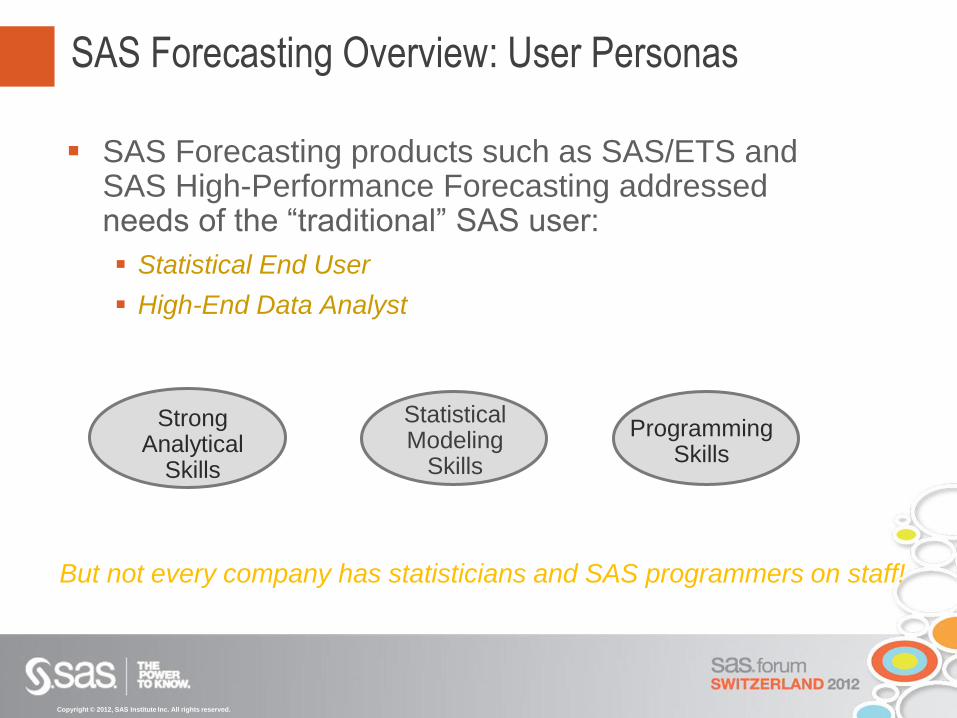
SAS Forecasting products such as SAS/ETS and SAS High-Performance Forecasting addressed needs of the “traditional” SAS user:
Statistical End User
High-End Data Analyst
Statistical Modeling
Skills
Strong Analytical
Skills
But not every company has statisticians and SAS programmers on staff!
Programming Skills
SAS Forecasting Overview: User Personas
Copyright © 2012, SAS Institute Inc. All rights reserved.
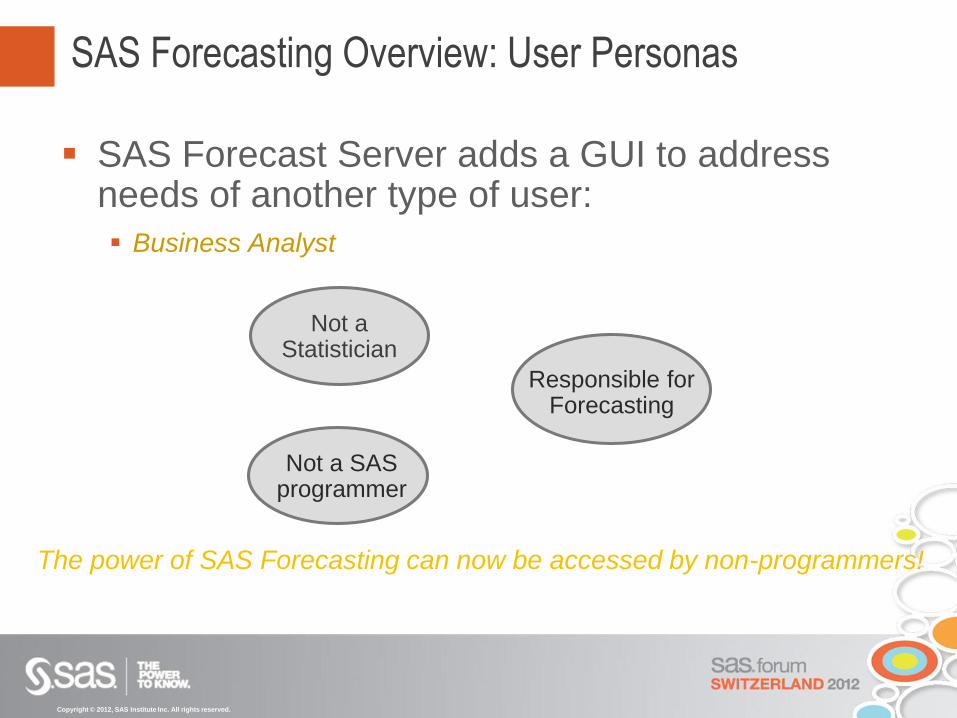
SAS Forecast Server adds a GUI to address needs of another type of user:
Business Analyst
Not a Statistician
Responsible for Forecasting
The power of SAS Forecasting can now be accessed by non-programmers!
Not a SAS programmer
SAS Forecasting Overview: User Personas
Copyright © 2012, SAS Institute Inc. All rights reserved.
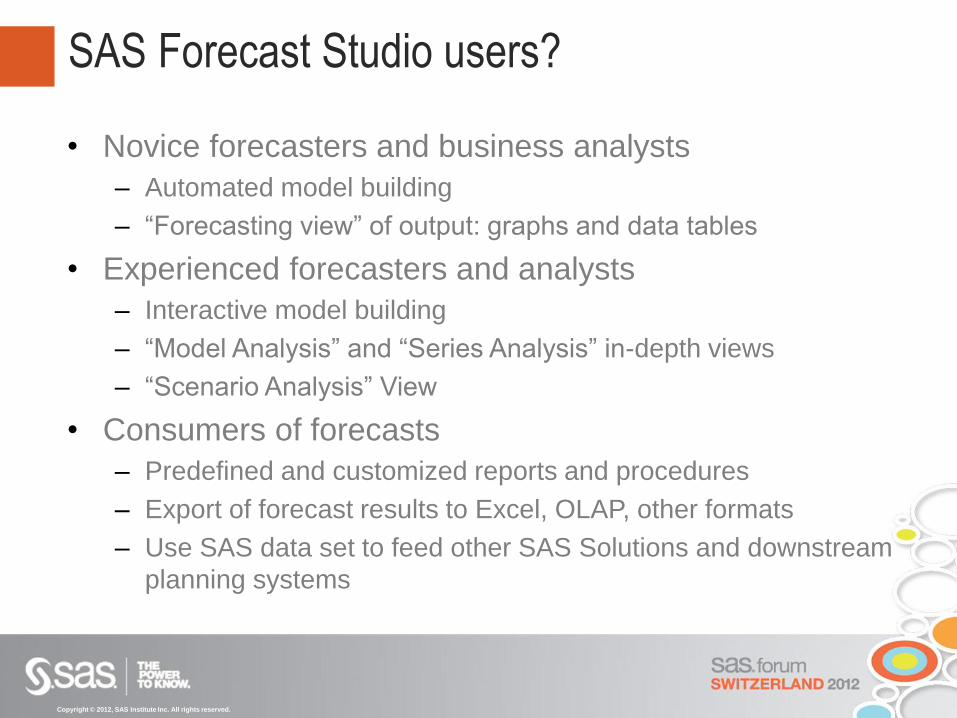
• Novice forecasters and business analysts
– Automated model building
– “Forecasting view” of output: graphs and data tables
• Experienced forecasters and analysts
– Interactive model building
– “Model Analysis” and “Series Analysis” in-depth views
– “Scenario Analysis” View
• Consumers of forecasts
– Predefined and customized reports and procedures
– Export of forecast results to Excel, OLAP, other formats
– Use SAS data set to feed other SAS Solutions and downstream
planning systems
SAS Forecast Studio users?
Copyright © 2012, SAS Institute Inc. All rights reserved.
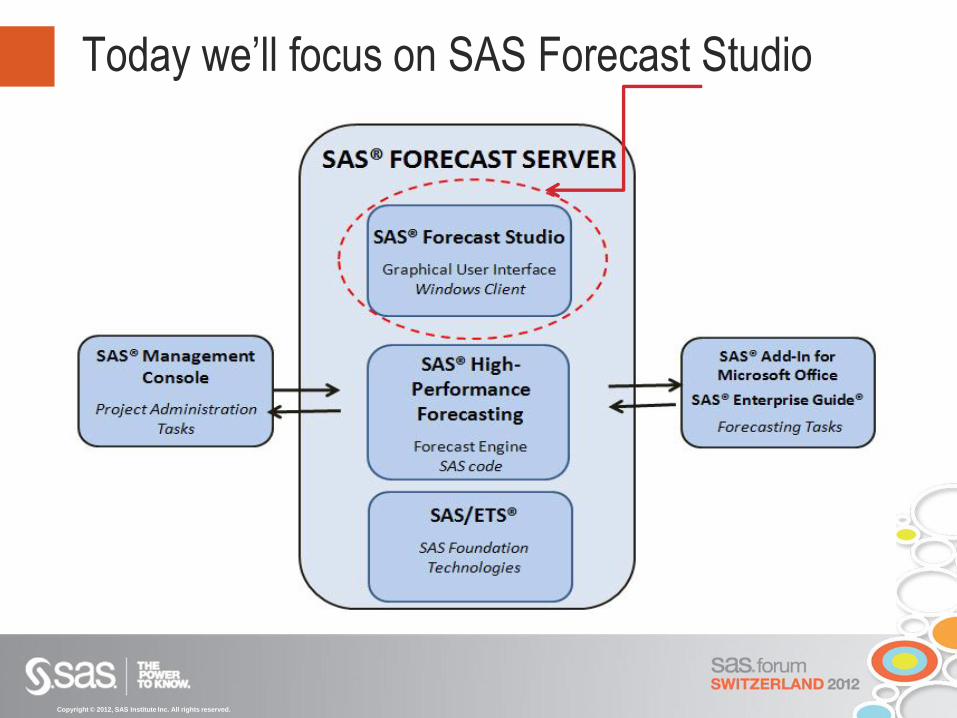
Today we’ll focus on SAS Forecast Studio
Copyright © 2012, SAS Institute Inc. All rights reserved.
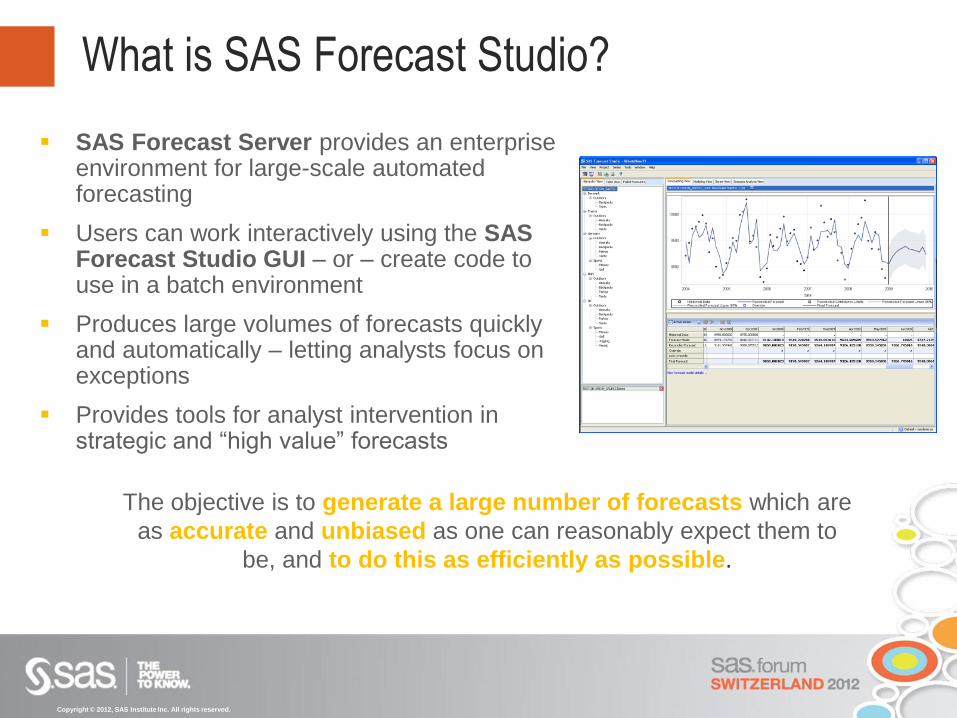
What is SAS Forecast Studio?
SAS Forecast Server provides an enterprise environment for large-scale automated forecasting
Users can work interactively using the SAS Forecast Studio GUI – or – create code to use in a batch environment
Produces large volumes of forecasts quickly and automatically – letting analysts focus on exceptions
Provides tools for analyst intervention in strategic and “high value” forecasts
The objective is to generate a large number of forecasts which are
as accurate and unbiased as one can reasonably expect them to
be, and to do this as efficiently as possible.
Copyright © 2012, SAS Institute Inc. All rights reserved.
Forecast Studio is a large scale, automated forecasting system
Forecast analysts can quickly set up forecasting projects and run them
“80/20” rule: most forecasts are just fine, but the “problematic” or high-value ones can be easily identified, and time/energy focused on those
Full array of tools for advanced forecasters and statisticians to work with time series and with models, creating custom models for their forecasting problem
Scenario analyzer allows what-if modeling using the models fit by FS, which represent the underlying functional relationship between the dependent and independent variables, which has been identified and modeled by FS.
Results are in a SAS data set, ready to be used – in SAS or exported to another application.
Large-scale forecasting using SAS Forecast Studio
Copyright © 2012, SAS Institute Inc. All rights reserved.
Choice of automation level Diagnosis
Model selection
Parameter setting
Forecast generation
Scalability
Events management
Flexible hierarchies
Extensible model selection list Built in models or add your own customized models
Extensible reporting through stored processes
Scenario Analysis (what if?)
Main Functionalities
Copyright © 2012, SAS Institute Inc. All rights reserved.
SAS Forecast Studio vs coding
Forecast Studio and High-Performance Forecasting:
Combination Models
Custom Time Interval Support
Forecast Studio only:
Rolling Simulations
Roles and capabilities
Start-up and shut-down code
Copy projects
Export model selection list
New override features
Copyright © 2012, SAS Institute Inc. All rights reserved.
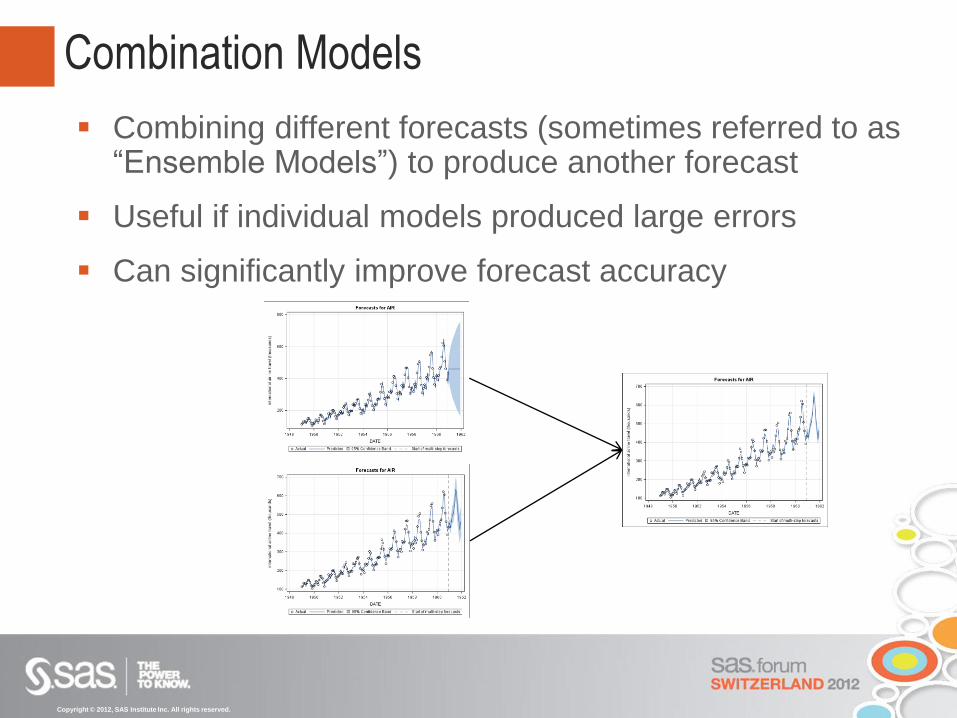
Combination Models
Combining different forecasts (sometimes referred to as “Ensemble Models”) to produce another forecast
Useful if individual models produced large errors
Can significantly improve forecast accuracy
Copyright © 2012, SAS Institute Inc. All rights reserved.
Combination Models Weighted combinations of different time series
forecasting models are often found to produce more accurate forecasts than any of the individual models.
SAS Forecast Server allows you to combine any number of time series forecasting models from the various model families (ARIMA, UCM, IDM, ESM)
The combination techniques available include:
Simple Average, User Defined Weights, Ranked Weights, OLS Weights, RLS Weights, LAD Weights, AICC weights, etc.
Additionally, it is possible to automatically generate the forecast model combinations:
Diagnostics that use Encompassing Tests to select candidate models to combine
Copyright © 2012, SAS Institute Inc. All rights reserved.
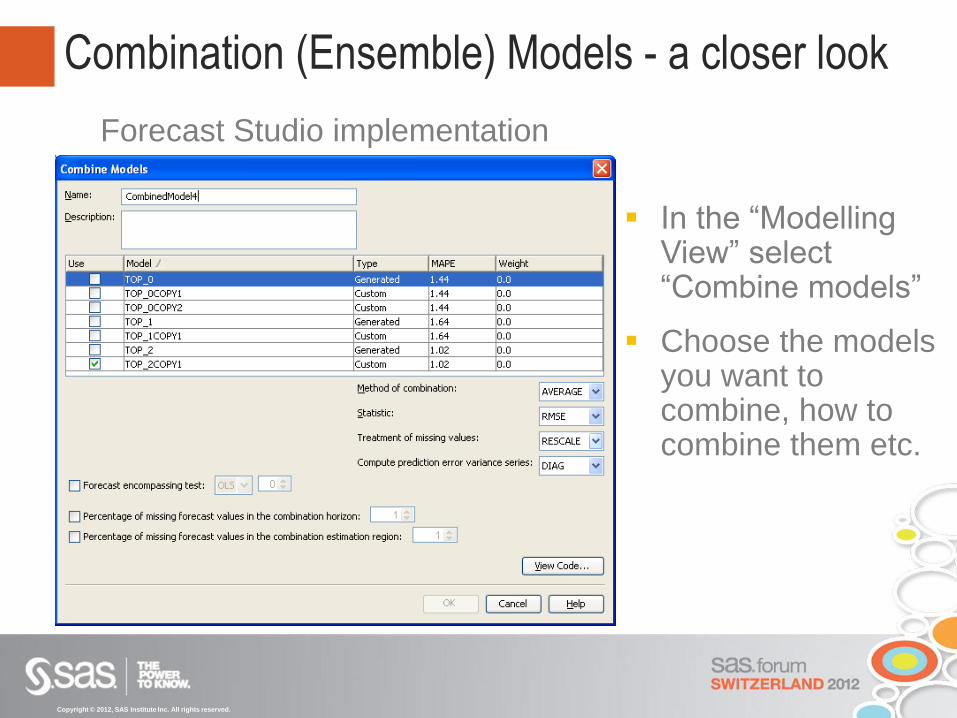
Combination (Ensemble) Models - a closer look
Forecast Studio implementation
In the “Modelling View” select “Combine models”
Choose the models you want to combine, how to combine them etc.
Copyright © 2012, SAS Institute Inc. All rights reserved.
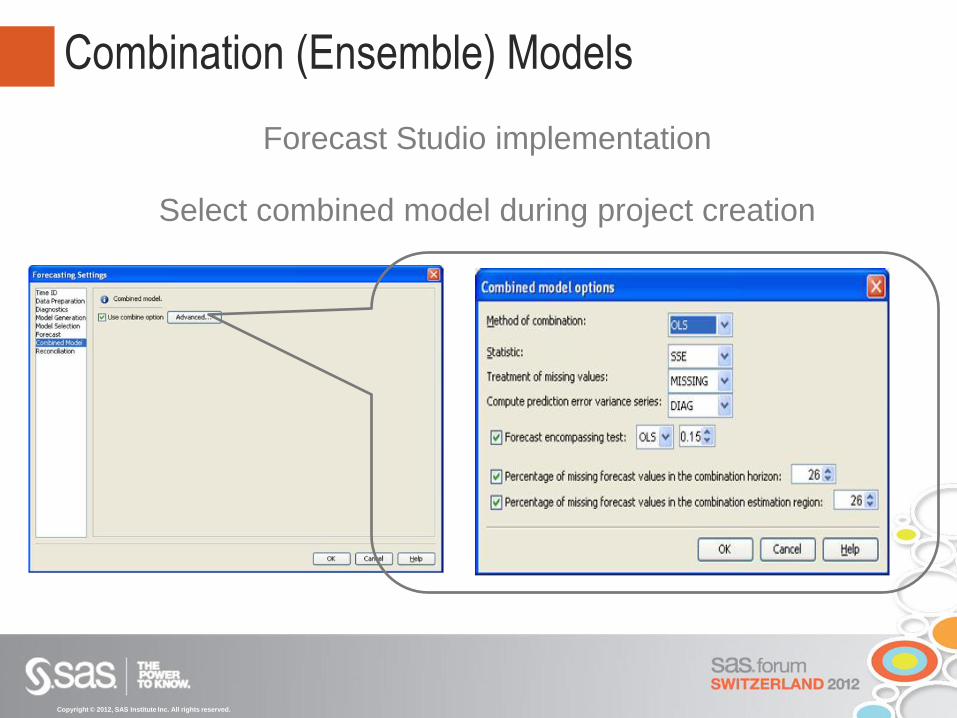
Combination (Ensemble) Models
Forecast Studio implementation
Select combined model during project creation
Copyright © 2012, SAS Institute Inc. All rights reserved.
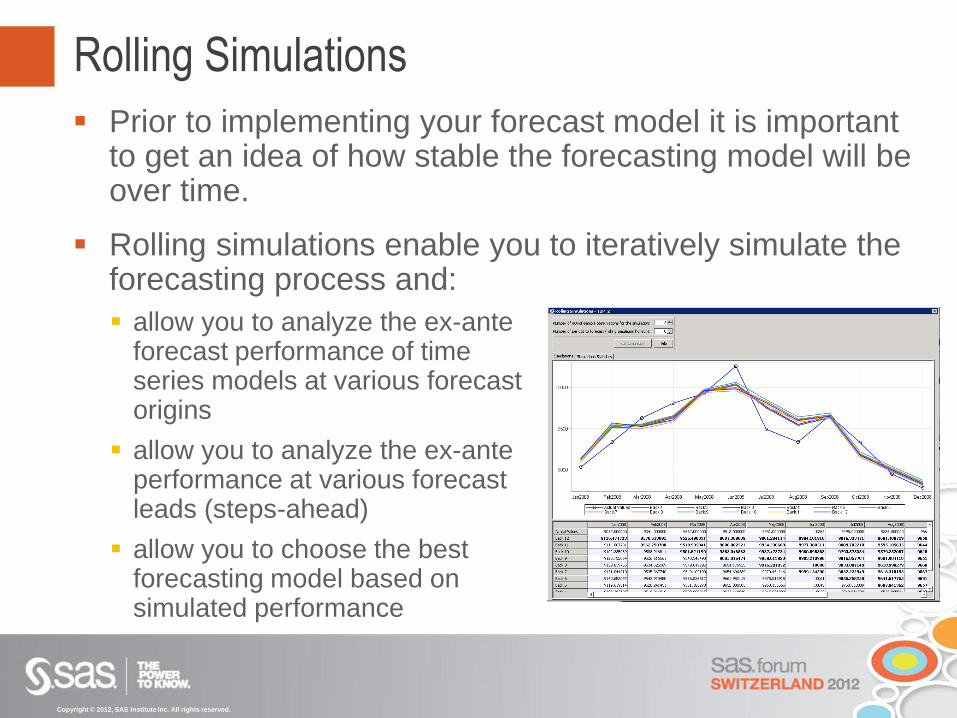
Rolling Simulations
Prior to implementing your forecast model it is important to get an idea of how stable the forecasting model will be over time.
Rolling simulations enable you to iteratively simulate the forecasting process and:
allow you to analyze the ex-ante forecast performance of time series models at various forecast origins
allow you to analyze the ex-ante performance at various forecast leads (steps-ahead)
allow you to choose the best forecasting model based on simulated performance
Copyright © 2012, SAS Institute Inc. All rights reserved.
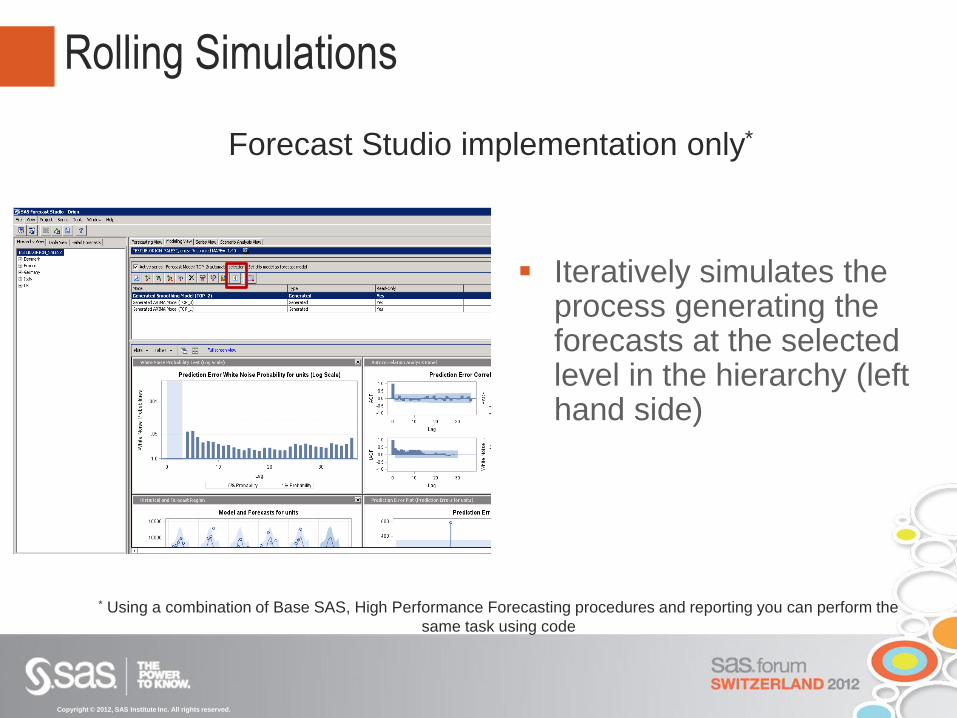
Rolling Simulations
Iteratively simulates the process generating the forecasts at the selected level in the hierarchy (left hand side)
Forecast Studio implementation only*
* Using a combination of Base SAS, High Performance Forecasting procedures and reporting you can perform the
same task using code
Copyright © 2012, SAS Institute Inc. All rights reserved.
Rolling Simulations
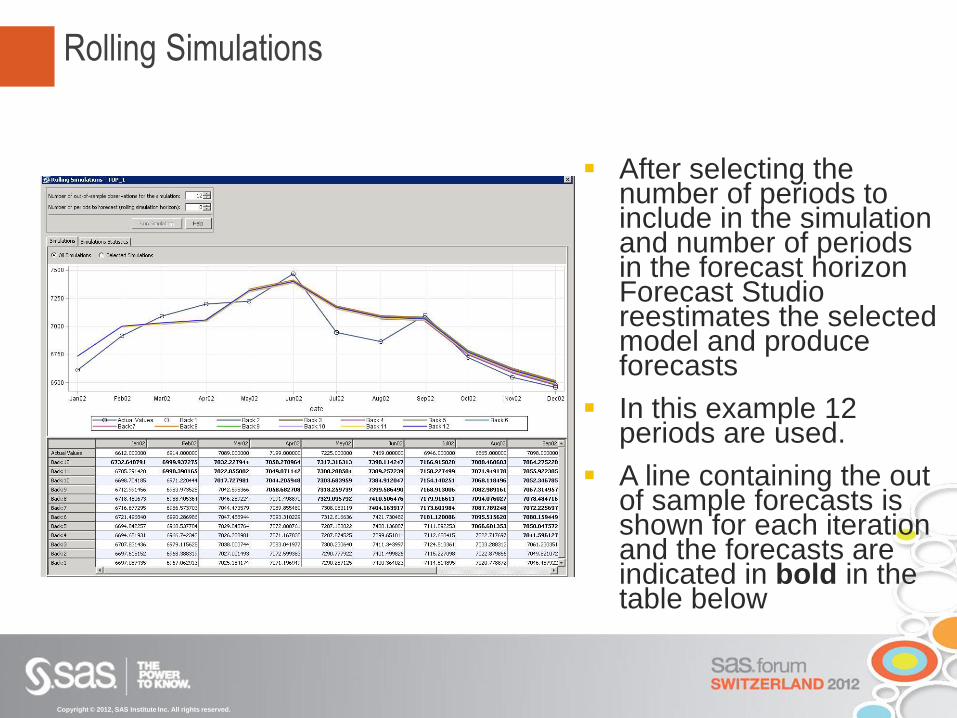
After selecting the number of periods to include in the simulation and number of periods in the forecast horizon Forecast Studio reestimates the selected model and produce forecasts
In this example 12 periods are used.
A line containing the out of sample forecasts is shown for each iteration and the forecasts are indicated in bold in the table below
Copyright © 2012, SAS Institute Inc. All rights reserved.
Rolling simulations
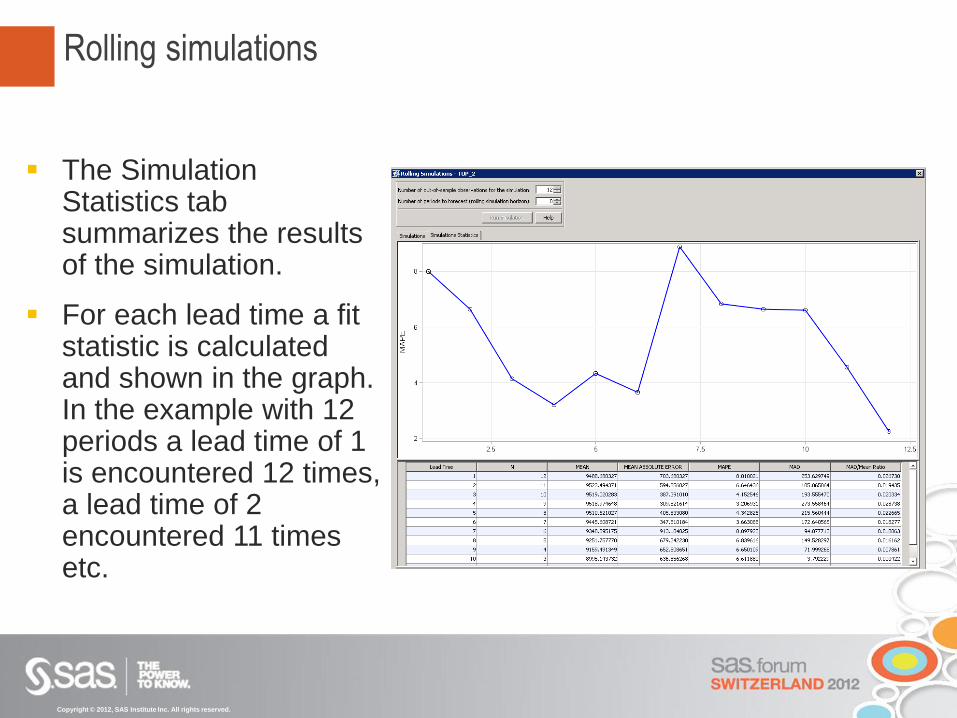
The Simulation Statistics tab summarizes the results of the simulation.
For each lead time a fit statistic is calculated and shown in the graph. In the example with 12 periods a lead time of 1 is encountered 12 times, a lead time of 2 encountered 11 times etc.

make connections • share ideas • be inspired
Copyright © 2012, SAS Institute Inc. All rights reserved.