lonmin platinum mineral resources and reserves 30 ... lonmin platinum mineral resources and reserves...
TRANSCRIPT
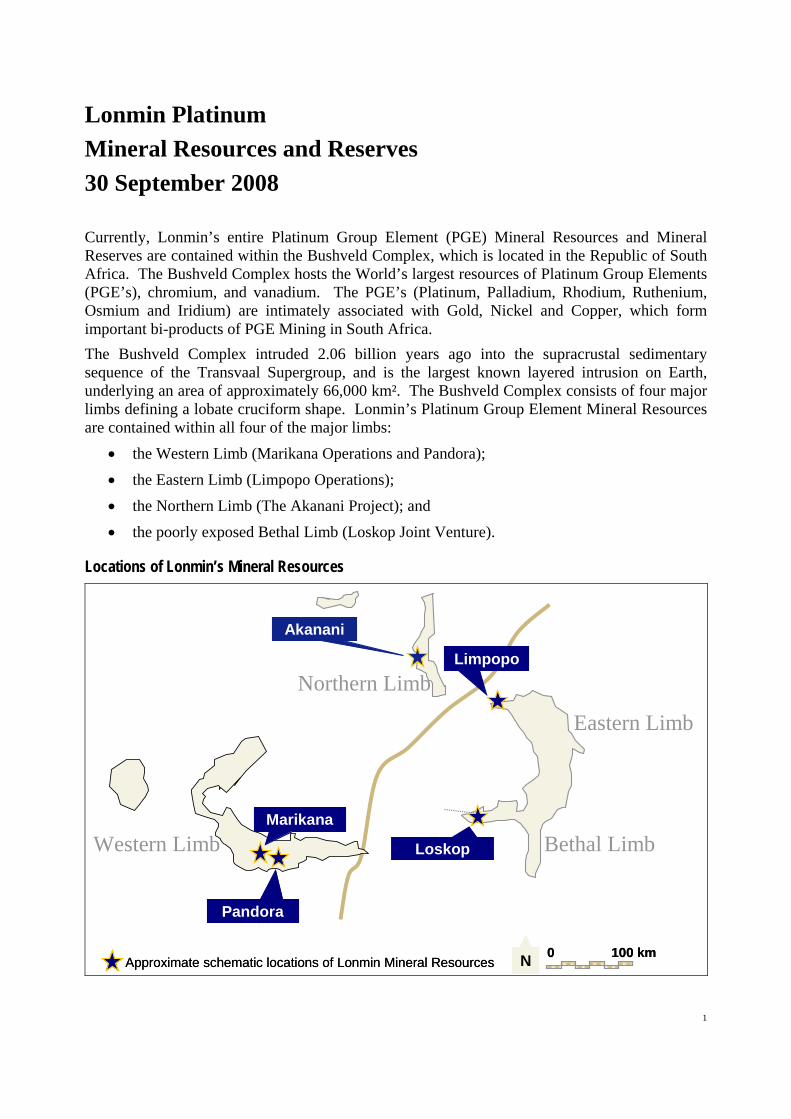
Lonmin Platinum Mineral Resources and Reserves 30 September 2008 Currently, Lonmin’s entire Platinum Group Element (PGE) Mineral Resources and Mineral Reserves are contained within the Bushveld Complex, which is located in the Republic of South Africa. The Bushveld Complex hosts the World’s largest resources of Platinum Group Elements (PGE’s), chromium, and vanadium. The PGE’s (Platinum, Palladium, Rhodium, Ruthenium, Osmium and Iridium) are intimately associated with Gold, Nickel and Copper, which form important bi-products of PGE Mining in South Africa. The Bushveld Complex intruded 2.06 billion years ago into the supracrustal sedimentary sequence of the Transvaal Supergroup, and is the largest known layered intrusion on Earth, underlying an area of approximately 66,000 km². The Bushveld Complex consists of four major limbs defining a lobate cruciform shape. Lonmin’s Platinum Group Element Mineral Resources are contained within all four of the major limbs:
• the Western Limb (Marikana Operations and Pandora); • the Eastern Limb (Limpopo Operations); • the Northern Limb (The Akanani Project); and • the poorly exposed Bethal Limb (Loskop Joint Venture).
Locations of Lonmin’s Mineral Resources
Approximate schematic locations of Lonmin Mineral ResourcesApproximate schematic locations of Lonmin Mineral Resources
Limpopo
Marikana
Loskop
Pandora
Akanani
N 0 100 kmN 0 100 km
Eastern Limb
Western Limb
Northern Limb
Bethal Limb
1
2
Lonmin’s PGE Mineral Resources in the Eastern and Western Limbs are hosted within the well known Merensky Reef and UG2 Reef. Both of these units occur in the Upper Critical Zone of the Rustenburg Layered Suite, which is a series of mafic and ultramafic cyclic units within which all of the known economic PGE mineralised layers in these areas occur. The Merensky Reef is a layer of mineralisation that occurs within, or in close association with, the Merensky Pyroxenite unit. The UG2 Reef consists of the UG2 Chromitite Layer containing PGE mineralisation and may include less well mineralised units or portions of these units either underlying or overlying the main UG2 Chromitite Layer. Lonmin’s PGE Mineral Resources in the Northern Limb are contained within the Platreef Pyroxenite unit that is generally considered to represent the Critical Zone in this area. The Platreef Pyroxenite can be in the order of 100’s of metres thick and contains zones of PGE mineralisation that are associated with various lithological sub-divisions of the Platreef Pyroxenite. At the Loskop Joint Venture, several mineralised units have been identified that are contained within a sequence that Lonmin considers to be stratigraphically equivalent to the Upper Critical Zone of the Eastern and Western Limbs of the Bushveld Complex. The Mineral Resources at Loskop are contained within the Upper Mineralised Pyroxenite (UMP). During the year, Lonmin’s entire Mineral Resource and Reserve has been thoroughly reviewed and certain areas have been re-estimated where appropriate. Details of these changes are included in the statements for the individual areas. The major changes are as follows:
• Extensive remodelling of the Marikana Resource has been completed using a state of the art methodology that allows greater sophistication in accounting for the PGE grade variations across the property. This modelling has confirmed the robustness of the UG2 Mineral Resource estimates and revealed no significant changes in the UG2 PGE grade overall. The re-modelling of the Merensky Resource has resulted in a lower overall Merensky Reef PGE grade, particularly in the known lower grade and thicker eastern areas of Marikana. It is worth noting that Lonmin does not currently mine Merensky Reef from these lower grade eastern areas but the impact has been to lower the average grade of the overall Merensky Mineral Resource. The overall Merensky Reef Mineral Reserve grade is less affected.
• A review of the P2 and P1 reef type extents at Akanani resulted in a marked increase in the Indicated Resource and PGE grade in the main mineralised zone (the P2). Additional drilling allowed Lonmin to upgrade a portion of the P2 Inferred Resource to Indicated Resource whilst other areas of lower grade or less certain continuity have been removed from the classification. The exclusion of large volumes of low grade P1 mineralisation from the Mineral Resource resulted in a significant increase in overall project grade and a reduction in overall metal content.
• At Limpopo Baobab shaft, the Probable Mineral Reserve has reduced as a result of a) a more conservative view of some areas of the Merensky Reef downgrading these to Inferred Resources pending information from closer spaced drilling; and b) changes made during the year to the Life of Mine Plan taking account of a number of factors including the need for an additional ventilation shaft and refrigeration below 750 metres. The Mineral Reserves in the relatively shallow Limpopo Phase 2 Project are unchanged since 2007.
3
Consistent with 2007 reporting, the 2008 Lonmin Mineral Resources and Reserves include Lonmin’s attributable portion only. The percentage of each of the areas attributable to Lonmin has not changed during the year. A summary of Lonmin’s Mineral Resources and Mineral Reserves is presented in the following tables: Mineral Resources (Total Measured, Indicated & Inferred)
30-Sep-2008 30-Sep-2007
3PGE+Au1 Pt 3PGE+Au1 Pt Area Mt
g/t Moz Moz Mt
g/t Moz Moz
Marikana 672.0 4.68 101.1 59.3 644.4 4.94 102.3 61.2
Limpopo 2 138.1 4.23 18.8 9.6 146.7 4.24 20.0 10.0
Limpopo Baobab shaft 28.6 4.00 3.7 1.9 32.1 3.96 4.1 2.1
Akanani 154.4 4.42 21.9 9.3 269.7 3.46 30.0 12.5
Pandora JV3 55.5 4.30 7.7 4.7 56.7 4.33 7.9 4.9
Loskop JV4 10.1 4.04 1.3 0.8 10.1 4.04 1.3 0.8
Total 1,058.8 4.54 154.5 85.6 1,159.7 4.44 165.6 91.6
Mineral Reserves (Total Proved & Probable)
30-Sep-2008 30-Sep-2007
3PGE+Au1 Pt 3PGE+Au1 Pt Area Mt
g/t Moz Moz Mt
g/t Moz Moz
Marikana 332.6 4.03 43.1 25.9 331.4 4.18 44.5 26.6
Limpopo 2 40.1 3.23 4.2 2.1 40.1 3.23 4.2 2.1
Limpopo Baobab shaft 9.4 3.16 1.0 0.5 24.2 3.32 2.6 1.3
Pandora JV3 0.46 4.28 0.06 0.04 0.30 4.55 0.04 0.03
Total 382.5 3.93 48.3 28.5 396.0 4.03 51.3 30.0
Notes on the Lonmin Platinum Mineral Resources and Reserves The Lonmin Platinum Mineral Resources and Reserves information was prepared on the following basis:
1) 3PGEAu = Pt+Pd+Rh+Au (Loskop JV4 excludes Rh due to insufficient assays). 2) Limpopo: includes Dwaalkop JV, in which Western Platinum Limited (82% owned by
Lonmin) has an interest of 50%, and Baobab shaft.
4
3) Pandora JV: Eastern Platinum Limited (82% owned by Lonmin) has an attributable interest of 42.5% in the Pandora Joint Venture together with Anglo Platinum, Mvelaphanda Resources and the Bapo Ba Mogale Mining Company.
4) Loskop JV: Western Platinum Limited (82% owned by Lonmin) has an attributable interest of 50% in the Loskop Joint Venture with Boynton Investments.
5) Incwala Resources owns 18% of both Western Platinum Limited and Eastern Platinum Limited and 26% of Akanani.
6) All quoted Resources and Reserves includes Lonmin's attributable portion only and the following percentages were applied to the total Mineral Resource and Reserve for each property:
Area Marikana Limpopo – Dwaalkop JV
Limpopo – Baobab, Doornvlei, Zebedelia Akanani Pandora Loskop
Lonmin Attributable 82% 41% 82% 74% 34.85% 41%
Consistent with the 2007 statement, the 2008 Mineral Resources and Mineral Reserves have been stated in order to reflect Lonmin’s portion only. 7) All figures are reported as metric tonnes (millions), grammes per tonne, percent or troy
ounces (millions). 8) Where Nickel (Ni) and Copper (Cu) grade estimates for the various Mineral Resources
are considered compliant with SAMREC (2007) guidelines, they are included in the Mineral Resource statements for the individual areas. These grades are reported in percent and represent acid soluble proportions.
9) All tabulated data have been rounded to one decimal place for tonnage and content and two decimal places for grades.
10) Mineral Resources are inclusive of Mineral Reserves. 11) Mineral Resources are reported as "in situ" tonnes and grade and allow for geological
losses such as faults, dykes, potholes and Iron Rich Ultramafic Pegmatite (IRUP). 12) Proved and Probable Mineral Reserves are reported as tonnes and grade expected to be
delivered to the mill, are inclusive of diluting materials and allow for losses that may occur when the material is mined.
13) Mine tailings dams are excluded from the above Mineral Resource summary 14) For economic studies and the determination of pay limits, consideration was made of
both short and long term revenue drivers. The following long term assumptions were used: Pt $1500, Pd $500, Rh $3,000, Ru $450, Ir $410, Au $550 per ounce and Ni $15,400, Cu $2,860 per tonne, using an average exchange rate of $1 to R8.
15) Dilutions are quoted as waste tonnes / waste + ore tonnes in percent.
16) Unless otherwise stated, the Lonmin Mineral Resources and Reserves estimates were prepared or supervised by various persons employed by Lonmin
5
Mineral Resource and Reserve Compliance
The 2008 Lonmin Mineral Resources and Mineral Reserves Report was prepared in accordance with the guidelines as defined in the 2007 version of the South African Code for Reporting of Mineral Resources and Mineral Reserves (the 'SAMREC Code'). The SAMREC Code sets out minimum standards, recommendations and guidelines for Public Reporting of Exploration Results, Mineral Resources and Mineral Reserves in South Africa. It has been drawn up by the Working Group of the SSC Committee under the joint auspices of the Southern African Institute of Mining and Metallurgy (SAIMM) and the Geological Society of South Africa (GSSA). An updated SAMREC Code was promulgated by the SAIMM and the Geological Society of South Africa (‘GSSA’) in June 2007. The updated code followed a review of the March 2000 Code that has been conducted since 2004, and supersedes the 2000 edition. Concurrently with the evolution of the SAMREC Code, the Committee for Mineral Reserves International Reporting Standards (CRIRSCO), initially a committee of the Council of Mining and Metallurgical Institutions (CMMI), has, since 1994, been working to create a set of standard international definitions for the reporting of Mineral Resources and Mineral Reserves. As a result of the CRIRSCO/CMMI initiative, considerable progress has been made towards widespread adoption of globally consistent reporting standards. These are embodied in similar Codes, guidelines and standards published and adopted by the relevant professional bodies around the world. The definitions in the 2007 edition of the SAMREC Code are either identical to, or not materially different from, those existing international definitions. The definitions of Mineral Resources and Mineral Reserves as contained in the 2007 edition of the SAMREC Code are as follows: A ‘Mineral Resource’ is a concentration or occurrence of material of economic interest in or on the Earth’s crust in such form, quality and quantity that there are reasonable and realistic prospects for eventual economic extraction. The location, quantity, grade, continuity and other geological characteristics of a Mineral Resource are known, or estimated from specific geological evidence, sampling and knowledge interpreted from an appropriately constrained and portrayed geological model. Mineral Resources are subdivided, and must so be reported, in order of increasing confidence in respect of geoscientific evidence, into Inferred, Indicated and Measured categories. An ‘Inferred Mineral Resource’ is that part of a Mineral Resource for which volume and/or tonnage, grade and mineral content can be estimated with a low level of confidence. It is inferred from geological evidence and sampling and assumed but not verified geologically and/or through analysis of grade continuity. It is based on information gathered through appropriate techniques from locations such as outcrops, trenches, pits, workings and drillholes that may be limited in scope or of uncertain quality and reliability. An ‘Indicated Mineral Resource’ is that part of a Mineral Resource for which tonnage, densities, shape, physical characteristics, grade and mineral content can be estimated with a reasonable level of confidence. It is based on exploration, sampling and testing information gathered through appropriate techniques from locations such as outcrops, trenches, pits,
6
workings and drillholes. The locations are too widely or inappropriately spaced to confirm geological and/or grade continuity but are spaced closely enough for continuity to be assumed. A ‘Measured Mineral Resource’ is that part of a Mineral Resource for which tonnage, densities, shape, physical characteristics, grade and mineral content can be estimated with a high level of confidence. It is based on detailed and reliable exploration, sampling and testing information gathered through appropriate techniques from locations such as outcrops, trenches, pits, workings and drillholes. The locations are spaced closely enough to confirm geological and grade continuity. A ‘Mineral Reserve’ is the economically mineable material derived from a Measured and/or Indicated Mineral Resource. It includes diluting and contaminating materials and allows for losses that are expected to occur when the material is mined. Appropriate assessments to a minimum of a Pre-Feasibility Study for a project, or a Life of Mine Plan for an operation, must have been carried out, including consideration of, and modification by, realistically assumed mining, metallurgical, economic, marketing, legal, environmental, social and governmental factors (the Modifying Factors). Such modifying factors must be disclosed. A ‘Probable Mineral Reserve’ is the economically mineable material derived from a Measured and/or Indicated Mineral Resource. It is estimated with a lower level of confidence than a Proved Mineral Reserve. It includes diluting and contaminating materials and allows for losses that are expected to occur when the material is mined. Appropriate assessments to a minimum of a Pre-Feasibility Study for a project, or a Life of Mine Plan for an operation, must have been carried out, including consideration of, and modification by, realistically assumed mining, metallurgical, economic, marketing, legal, environmental, social and governmental factors. Such modifying factors must be disclosed. A ‘Proved Mineral Reserve’ is the economically mineable material derived from a Measured Mineral Resource. It is estimated with a high level of confidence. It includes diluting and contaminating materials and allows for losses that are expected to occur when the material is mined. Appropriate assessments to a minimum of a Pre-Feasibility Study for a project, or a Life of Mine Plan for an operation, must have been carried out, including consideration of, and modification by, realistically assumed mining, metallurgical, economic, marketing, legal, environmental, social and governmental factors. Such modifying factors must be disclosed. Competent Persons Various persons, as stated in the relevant sections of this report, assisted in the preparation of the Mineral Resource and Mineral Reserve estimates. These estimates were reviewed and signed off by the Lonmin Competent Persons; J.C. Witley (Mineral Resources) and J.H.K. Hudson (Mineral Reserves). J. C. Witley is a Competent Person as defined by the SAMREC Code, being registered as a Professional Natural Scientist with the South African Council for Natural Scientific Professions (SACNASP), a member of the Geological Society of South Africa (GSSA) and with more than five years experience relevant to PGE Mineral Resource estimation. J. H. K. Hudson is a Competent Person as defined by the SAMREC Code, being registered as a professional mining engineer with the Engineering Council of South Africa (ECSA) and a fellow of the Southern African Institute of Mining and Metallurgy (SAIMM) with more than five years relevant experience in precious metal Mineral Reserve estimation.
7
External Audit Detailed external audit work was completed in support of the extensive re-modelling and re-estimation that has occurred since the previous detailed external audit in 2006.
• Snowden Mining Industry Consultants performed an independent audit of Lonmin Platinum’s Marikana, Pandora and Akanani Mineral Resource and Reserve estimates in 2008. These estimates have been endorsed by Snowden.
• SRK completed an audit of the Lonmin Limpopo Mineral Resource and Reserve estimates in 2008 for the Baobab Mine and Phase 2 Project. These estimates have been endorsed by SRK.
• No changes have been made to the Loskop 2007 Mineral Resource estimates. RSG Global’s independent audit and endorsement of the Mineral Resource estimate of the Rietfontein area of the Loskop JV in September 2007 remains applicable to the estimates reported in 2008.
8
Marikana Operations Mineral Resources and Reserves 30 September 2008
The Marikana Operations (Western Platinum Limited and Eastern Platinum Limited) are located in the Marikana district to the east of the town of Rustenburg in the North West Province of the Republic of South Africa. The Marikana mine leases are underlain by the Merensky Reef and the UG2 Chromitite Layer over a strike length of approximately 27 km. Both the Merensky Reef and the UG2 Chromitite Layer outcrop along the strike length of the lease area. The layers strike in an approximately east-west direction and generally dip between 9° and 14° to the north. The UG2 Chromitite Layer underlies the Merensky Reef by between 130 m and 210 m and the middling between the two reefs increases in thickness across the lease area from west to east. The continuity of both the Merensky and UG2 reefs has been established over the Indicated and Measured portions of the Mineral Resource by extensive underground and open pit mining, underground sampling, surface trenching, surface drilling, magnetic surveys and seismic surveys. The drilling of multiple reef intersections in each drillhole is standard practice and provides material for assay, geotechnical, mineralogical and metallurgical testing. Logging and sampling of drillholes are conducted according to standard procedures and drillhole data is electronically stored in a commercial database. The layered nature of the Bushveld Complex makes it possible to identify different lithological units, which facilitates the interpretation of geological disturbances such as dykes, faults, potholes and Iron Rich Ultramafic Pegmatite (IRUP). A total of over 700 surface diamond drillholes have been completed and drilling is ongoing on a continuous basis in order to improve the confidence in the estimate and extend the area of the Mineral Resource. Virtually the complete property has been covered by airborne or ground magnetic surveys. Two high resolution 3D seismic surveys, covering a total area of 44 km2, and a number of 2D seismic surveys were completed over the Lonmin property over the last 8 years. These include a high resolution 3D seismic survey that was completed in 2008 and covered an area of approximately 28 km2 over the Middelkraal 2, Hossy and Saffy shaft block areas as well as the remaining portions of Newman and E1 shafts. The detailed data from the seismic and magnetic surveys have proved to be invaluable in understanding the continuity of the reefs and for shaft planning and design purposes. The interpretation of the latest 3D seismic survey data is in progress and the final interpretation will be incorporated into our Mineral Resource models and mine planning during 2009. The Merensky Reef and the UG2 Reef are mined simultaneously in the lease area at an average depth of approximately 400 m. Mining is by underground and open cast mining methods with shallow incline, deep vertical shaft or open pit access to the orebodies. The underground mining methods at Marikana are conventional up-dip, down-dip and breast stoping as well as Mechanised XLP (extra low profile) and hybrid (a combination of mechanised and conventional methods) stoping. The conventional up-dip and down-dip stoping methods currently account for approximately 80% of the Marikana ore production. The Mineral Reserve estimates have been completely reviewed during 2008 and these estimates are supported by the outputs of sophisticated Mine Planning systems.
9
Revisions to the Mineral Resource and Reserve Completed During 2008 Significant Changes to the Marikana Mineral Resource estimates are as follows:
• Recent surface diamond drilling in our Schaapkraal Prospecting Right area has resulted in an extension of the UG2 Mineral Resources down dip (northwards) of the K4 Shaft Block. This amounted to an increase of approximately 13Mt of Inferred Mineral Resources at a grade of 4.51 g/t 3PGE+Au containing 1.9 Moz of 3PGE+Au.
• Since September 2007, the entire Marikana Mineral Resource has been re-modelled and re-estimated by Lonmin using Datamine Studio™ software. This has involved a review of reef facies delineation and the application of consistently applied, and in some areas thicker, resource cut selection for the individual facies types. The inclusion of tens of thousands of validated underground channel sample sections has aided in improving the accuracy of our Measured and portions of our Indicated Resources. This approach to estimation is consistent with current practices at Limpopo and Pandora as well as certain other PGE resource companies.
• The re-modelling of the UG2 Resource revealed no significant changes in the UG2 grade overall confirming the robustness of the UG2 Mineral Resource estimates.
• The overall Merensky Reef resource grade has decreased from 4.85 g/t to 4.22 g/t. The higher grade western area Merensky Reef 3PGE+Au grade has reduced by 9% overall. The eastern area Merensky Reef (Middelkraal and EPL) contains thick pyroxenite Western Plats reef type. The resource cut in the eastern area has been changed from a minimum of 90 cm variable width cut to a constant 120 cm hangingwall referenced cut, which has resulted in a 16% decrease in Mineral Resource PGE grade. Opportunities are expected to exist in order to optimise these grades with detailed underground sampling data. Currently, the eastern areas of Merensky Reef are not being mined.
• The reduction in Merensky Mineral Resource grades has been partially offset in the Mineral Reserves as a result of the thicker and consistent reef cuts and therefore lower percentage dilution. The Merensky Reef 3PGE+Au reserve grade has decreased by 5% in the western area and 8% in the eastern area.
• A review of pothole losses carried out during the year has resulted in a decrease in the expected geological losses for both the Merensky and UG2 Reef Mineral Resources. For the Merensky Reef, the average geological loss has decreased from 20% to 18% and for the UG2 the average geological loss has decreased from 21% to 16%. These changes directly relate to an increase in quantity of PGE’s contained in the Mineral Resources. Geological losses are applied to resource block areas over and above those losses removed as a result of known and defined major geological structures in which no Mineral Resources are believed to be developed.
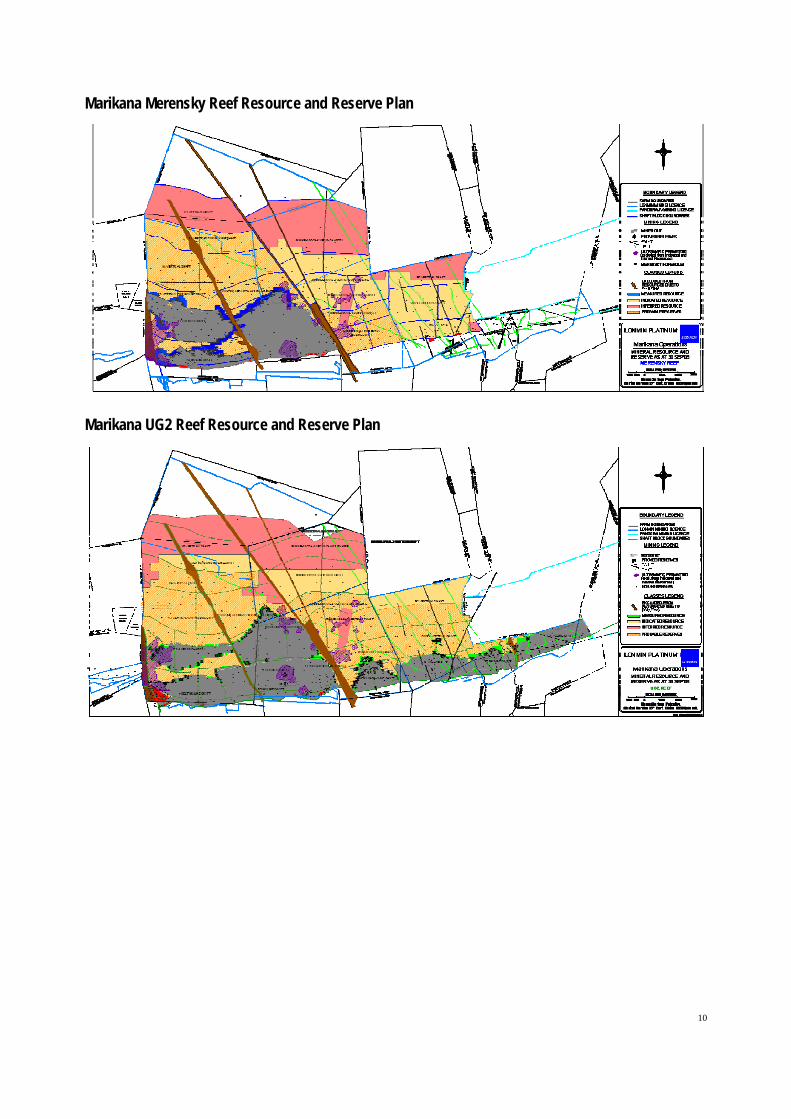
Marikana Merensky Reef Resource and Reserve Plan
Marikana UG2 Reef Resource and Reserve Plan
10
Mineral Resources1 30-Sep-2008 30-Sep-2007
3PGE+Au Pt 3PGE+Au Pt Ore source Category Mt
g/t Moz Moz Mt
g/t Moz Moz
Measured 7.5 4.14 1.0 0.6 3.9 4.03 0.5 0.3
Indicated 78.9 4.30 13.9 8.7 72.9 5.89 13.8 8.7
Inferred 21.5 6.70 4.6 2.9 34.6 7.11 7.9 5.0
Merensky
West
Sub Total 107.9 5.63 19.5 12.3 111.3 6.20 22.2 13.9
Indicated 102.0 3.38 11.1 6.6 90.5 3.95 11.5 6.8
Inferred 62.6 3.17 6.4 3.8 75.9 3.94 9.6 5.8 Merensky East
Sub Total 164.7 3.30 17.5 10.4 166.4 3.95 21.1 12.6
Merensky Total 272.6 4.22 37.0 22.7 277.7 4.85 43.3 26.5
Measured 11.4 4.96 1.8 1.1 10.9 4.93 1.7 1.0
Indicated 270.9 5.01 43.6 24.8 249.7 5.00 40.2 23.5
Inferred 117.2 4.95 18.7 10.8 106.2 5.01 17.1 10.1 UG2
Total 399.4 4.99 64.1 36.6 366.7 5.00 59.0 34.7
Measured 18.9 4.63 2.8 1.7 14.7 4.69 2.2 1.3
Indicated 451.8 4.72 68.6 40.1 413.0 4.93 65.5 39.0
Inferred 201.3 4.58 29.7 17.5 216.7 4.97 34.6 20.9 Total
Total 672.0 4.68 101.1 59.3 644.4 4.94 102.3 61.2
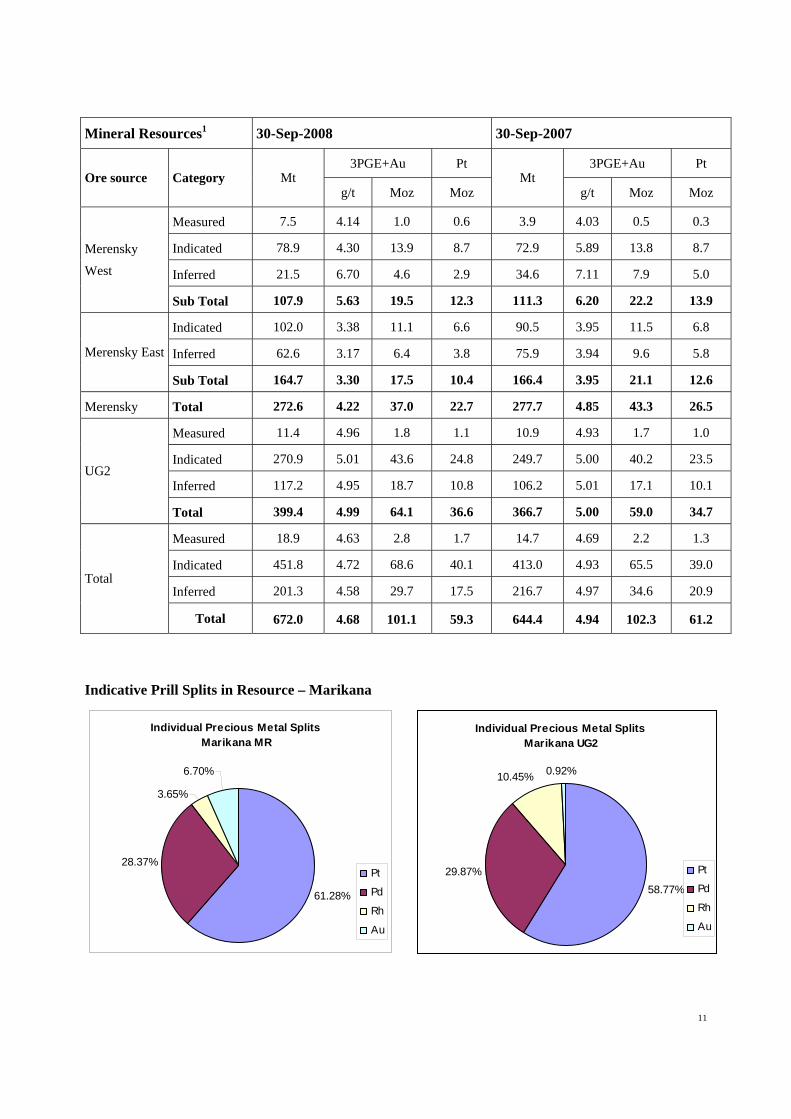
Indicative Prill Splits in Resource – Marikana
Individual Precious Metal SplitsMarikana MR
61.28%
28.37%
3.65%
6.70%
Pt
Pd
Rh
Au
Individual Precious Metal SplitsMarikana UG2
58.77%29.87%
10.45% 0.92%
Pt
Pd
Rh
Au
11
12
Mineral Reserves1 30-Sep-2008 30-Sep-2007
3PGE+Au Pt 3PGE+Au Pt Ore source Category Mt
g/t Moz Moz Mt
g/t Moz Moz
Proved 1.5 2.95 0.1 0.1 3.1 3.37 0.3 0.2
Probable 90.0 4.03 11.7 7.3 78.4 4.26 10.7 6.7 Merensky West
Sub Total 91.5 4.02 11.8 7.4 81.6 4.22 11.1 6.9
Probable 18.9 3.23 2.0 1.2 19.3 3.53 2.2 1.3 Merensky East
Sub Total 18.9 3.23 2.0 1.2 19.3 3.53 2.2 1.3
Merensky Total 110.4 3.88 13.8 8.6 100.8 4.09 13.3 8.3
Proved 5.9 4.32 0.8 0.5 9.1 4.48 1.3 0.8
Probable 216.3 4.10 28.5 16.8 221.4 4.20 29.9 17.6 UG2
Total 222.2 4.11 29.3 17.3 230.5 4.21 31.2 18.3
Proved 7.3 4.04 1.0 0.6 12.2 4.20 1.6 1.0
Probable 325.2 4.03 42.2 25.3 319.1 4.18 42.9 25.6 Total
Total 332.6 4.03 43.1 25.9 331.4 4.18 44.5 26.6
Notes on the Marikana Mineral Resources and Reserves The Marikana Mineral Resources and Reserves information was prepared on the following basis:
1) Refer to notes under summary tables. 2) The Marikana Mineral Resources and Reserves include only Lonmin's attributable
portion. 3) The Eastern Merensky area represents the area east of the Elandsdrift Fault comprising
Middelkraal, Hossy, Saffy and E1. The Western area comprises the various Karee and Rowland Shaft blocks.
4) Merensky Reef widths used for Mineral Resource estimates are based on a practical mining cut of not less than 120 cm in the eastern area and 90 cm in the western area and therefore may include some diluting material.
5) The UG2 Reef width used for Mineral Resource estimates are based on a practical mining cut of not less than 90 cm. This cut consists of the UG2 Chromitite Layer and internal waste partings and may include some external dilution in order to honour the practical minimum mining cut width.
6) Measured Resources are typically declared in and immediately adjacent to areas where reef has been exposed in underground development. Channel samples are taken from underground reef intersections using a diamond saw and are assayed at Lonmin Platinum’s laboratory. The channel samples are composited into individual reef

13
intersections, which are used to evaluate resource blocks by applying an Ordinary Kriging estimation method.
7) Indicated and Inferred Resources are estimated from the results of surface diamond drillhole reef intersections. At least four reef intersections are drilled from each drillhole and three of these intersections are sampled and assayed at a commercial laboratory. The samples of each deflection are composited into individual reef intersections, which are used to evaluate resource blocks by applying an Ordinary Kriging estimation method.
8) Confidence in the geological model, reef continuity, drilling density and geostatistical analysis is used to define resource classes. Indicated Resources at Lonmin Marikana are typically declared in areas where drill spacing is less than 800 metres. Inferred Mineral Resources are declared in areas where reef intersections are spaced between 800 and 2,000 metres, depending on knowledge of the reef continuity in individual areas. The Inferred Resources at Marikana are generally constrained by the sparse drilling grid.
9) The Mineral Resources at Marikana occur from surface to less than 2000 m below surface. The average width of the UG2 is 1.19 m and the average width of the Merensky Reef is 1.07m.
10) An average of 18% geological loss has been removed from the Merensky Reef and 16% from the UG2 Reef. Geological losses include those from dykes, fault loss, potholes and Iron Rich Ultramafic Pegmatoid (IRUP). Geological losses are applied to resource block areas over and above those losses removed as a result of known major geological structures in which no Mineral Resources are believed to be developed.
11) Modifying factors applied to convert Mineral Resources to Mineral Reserves are derived from the Mineral Reserve Management system on Lonmin Platinum’s current operations. All survey, sampling, stope-width control and geological data are stored in electronic databases and mine plans are captured electronically in a 3 dimensional geographical information system.
12) Proved Reserves are converted from fully developed Measured Resources allowing for an assessment of modifying factors for the individual mining block.
13) Probable Reserves are converted from Indicated Resources using estimated dilution and extraction factors for the individual area taking cognisance of the reef type and mining method for the individual area.
14) Mineral Reserve estimates are supported by the output of sophisticated mine planning systems.
15) Average dilution applied to the Merensky Reef is 26% and the average dilution applied to the UG2 is 19%.
16) Average losses applied as a result of both mining losses and pillar designs are approximately 13% for the Merensky Reef and approximately 17% for the UG2.
17) All Mineral Reserves are shallower than 1,400 metres below surface. 18) All projects that are classified as Mineral Reserves have passed the economic test as
prescribed by the SAMREC code. All economic evaluations were done on a consistent basis using the Lonmin economic model.
19) Appropriate assessments to a level of at least Pre-Feasibility or Life of Mine Plan have been carried out in order to declare Mineral Reserves. The table below highlights the status of the project pipeline with particular relevance to the conversion of Mineral Reserves from Mineral Resources.
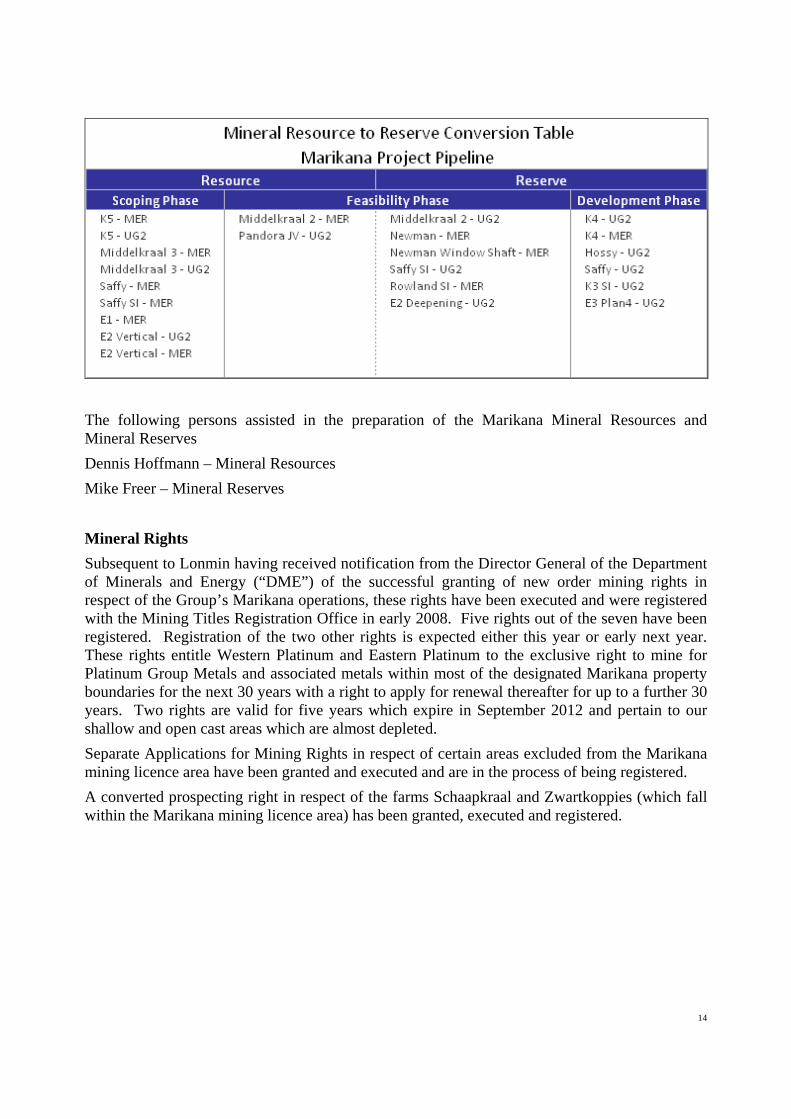
The following persons assisted in the preparation of the Marikana Mineral Resources and Mineral Reserves Dennis Hoffmann – Mineral Resources Mike Freer – Mineral Reserves
Mineral Rights Subsequent to Lonmin having received notification from the Director General of the Department of Minerals and Energy (“DME”) of the successful granting of new order mining rights in respect of the Group’s Marikana operations, these rights have been executed and were registered with the Mining Titles Registration Office in early 2008. Five rights out of the seven have been registered. Registration of the two other rights is expected either this year or early next year. These rights entitle Western Platinum and Eastern Platinum to the exclusive right to mine for Platinum Group Metals and associated metals within most of the designated Marikana property boundaries for the next 30 years with a right to apply for renewal thereafter for up to a further 30 years. Two rights are valid for five years which expire in September 2012 and pertain to our shallow and open cast areas which are almost depleted. Separate Applications for Mining Rights in respect of certain areas excluded from the Marikana mining licence area have been granted and executed and are in the process of being registered. A converted prospecting right in respect of the farms Schaapkraal and Zwartkoppies (which fall within the Marikana mining licence area) has been granted, executed and registered.
14
15
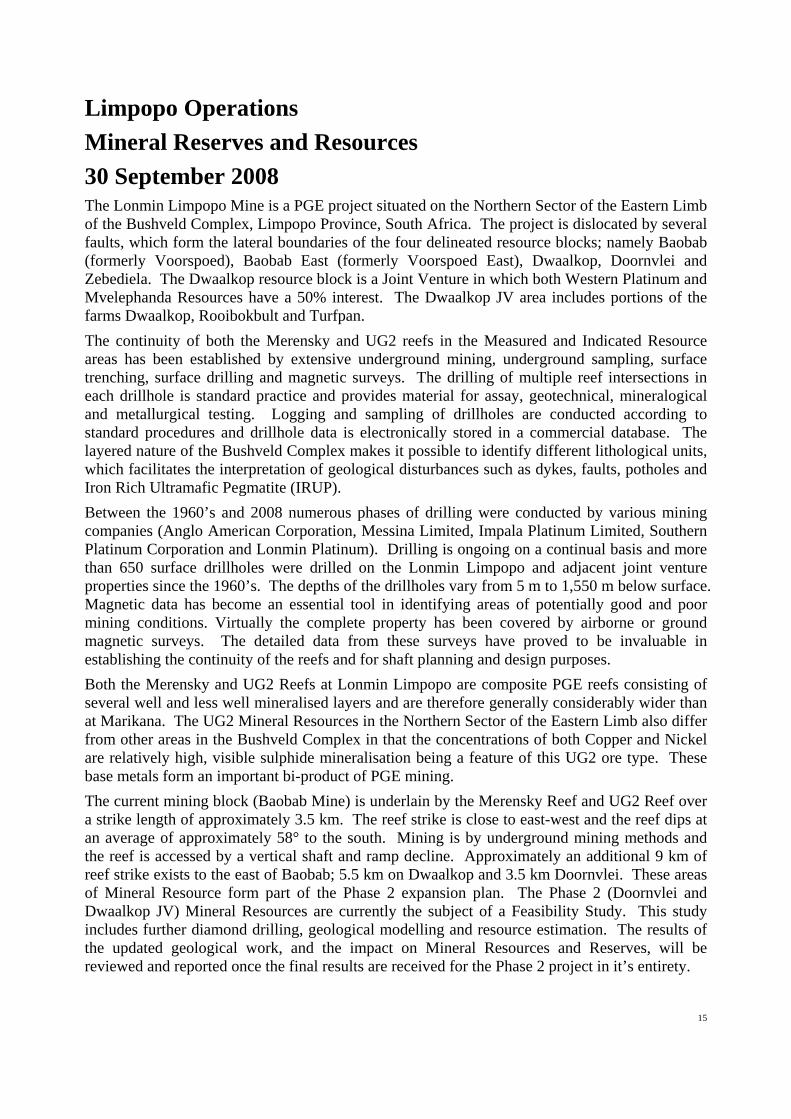
Limpopo Operations Mineral Reserves and Resources 30 September 2008 The Lonmin Limpopo Mine is a PGE project situated on the Northern Sector of the Eastern Limb of the Bushveld Complex, Limpopo Province, South Africa. The project is dislocated by several faults, which form the lateral boundaries of the four delineated resource blocks; namely Baobab (formerly Voorspoed), Baobab East (formerly Voorspoed East), Dwaalkop, Doornvlei and Zebediela. The Dwaalkop resource block is a Joint Venture in which both Western Platinum and Mvelephanda Resources have a 50% interest. The Dwaalkop JV area includes portions of the farms Dwaalkop, Rooibokbult and Turfpan. The continuity of both the Merensky and UG2 reefs in the Measured and Indicated Resource areas has been established by extensive underground mining, underground sampling, surface trenching, surface drilling and magnetic surveys. The drilling of multiple reef intersections in each drillhole is standard practice and provides material for assay, geotechnical, mineralogical and metallurgical testing. Logging and sampling of drillholes are conducted according to standard procedures and drillhole data is electronically stored in a commercial database. The layered nature of the Bushveld Complex makes it possible to identify different lithological units, which facilitates the interpretation of geological disturbances such as dykes, faults, potholes and Iron Rich Ultramafic Pegmatite (IRUP). Between the 1960’s and 2008 numerous phases of drilling were conducted by various mining companies (Anglo American Corporation, Messina Limited, Impala Platinum Limited, Southern Platinum Corporation and Lonmin Platinum). Drilling is ongoing on a continual basis and more than 650 surface drillholes were drilled on the Lonmin Limpopo and adjacent joint venture properties since the 1960’s. The depths of the drillholes vary from 5 m to 1,550 m below surface. Magnetic data has become an essential tool in identifying areas of potentially good and poor mining conditions. Virtually the complete property has been covered by airborne or ground magnetic surveys. The detailed data from these surveys have proved to be invaluable in establishing the continuity of the reefs and for shaft planning and design purposes. Both the Merensky and UG2 Reefs at Lonmin Limpopo are composite PGE reefs consisting of several well and less well mineralised layers and are therefore generally considerably wider than at Marikana. The UG2 Mineral Resources in the Northern Sector of the Eastern Limb also differ from other areas in the Bushveld Complex in that the concentrations of both Copper and Nickel are relatively high, visible sulphide mineralisation being a feature of this UG2 ore type. These base metals form an important bi-product of PGE mining. The current mining block (Baobab Mine) is underlain by the Merensky Reef and UG2 Reef over a strike length of approximately 3.5 km. The reef strike is close to east-west and the reef dips at an average of approximately 58° to the south. Mining is by underground mining methods and the reef is accessed by a vertical shaft and ramp decline. Approximately an additional 9 km of reef strike exists to the east of Baobab; 5.5 km on Dwaalkop and 3.5 km Doornvlei. These areas of Mineral Resource form part of the Phase 2 expansion plan. The Phase 2 (Doornvlei and Dwaalkop JV) Mineral Resources are currently the subject of a Feasibility Study. This study includes further diamond drilling, geological modelling and resource estimation. The results of the updated geological work, and the impact on Mineral Resources and Reserves, will be reviewed and reported once the final results are received for the Phase 2 project in it’s entirety.
16
The mining methods at Limpopo are conventional down-dip stoping and mechanised long-hole open stoping. The conventional down-dip stoping currently accounts for approximately 80% of the Limpopo ore production. Revisions to the Mineral Resource and Reserve Completed During 2008 A number of changes have been made to the Mineral Resource estimates since September 2007, over and above depletion due to mining. These are as follows:
• The Baobab Mineral Resource estimates have been internally reviewed and adjusted accordingly. An increase in average geological losses from 16% to 20% has occurred and the estimated PGE grade and content of both the Merensky and UG2 Reef Mineral Resources changed slightly as a result of the re-modelling.
• An internal review of the classification of the Baobab Mineral Resources has led to a reduction in the down dip extent of the Merensky Indicated Resources, primarily the result of the drillhole grid being inappropriately spaced to confidently assume grade continuity. The affected areas have been down graded to Inferred Mineral Resources, but are likely to be re-instated to Indicated Resources once further diamond drilling has been conducted.
• The Zebediela’s Location Mineral Resource has been re-estimated by Snowden Mining Industry Consultants and the results reported herein. A decrease in the reef strike has occurred as the sparse drilling grid in the more complex western area does not allow for continuity to be reliably inferred. However, the eastern Zebediela Mineral Resource area has been expanded due to re-interpretation arising from the addition of several drillholes not previously incorporated into the previous estimate, resulting in a larger PGE Mineral Resource overall.
• A review of the current structural model and grade estimates for Baobab East has resulted in this mineralisation being removed from the 2008 Statement of Mineral Resources. Further modelling work is required to identify those areas that are considered to have reasonable potential for eventual mining and this area will be reviewed during 2009.
• Where Ni and Cu grades have been estimated, these are reported in the Limpopo Mineral Resource Statement.
• A more conservative view of Baobab Merensky Reef confidence levels led to a decision to downgrade some areas of the Limpopo Merensky Reef Indicated Resources to Inferred Resources. Only certain portions of the Baobab Resource above 750 metre level (ml) have been included in the Life of Mine Plan, rather than to 1,000 ml as scheduled in 2007, which combined with the lower proportion of Indicated Resources has led to a significant reduction in the Baobab Probable Mineral Reserve. The shallow expansion areas of the Limpopo Mineral Resource and Reserves (Phase 2) are unchanged since September 2007.
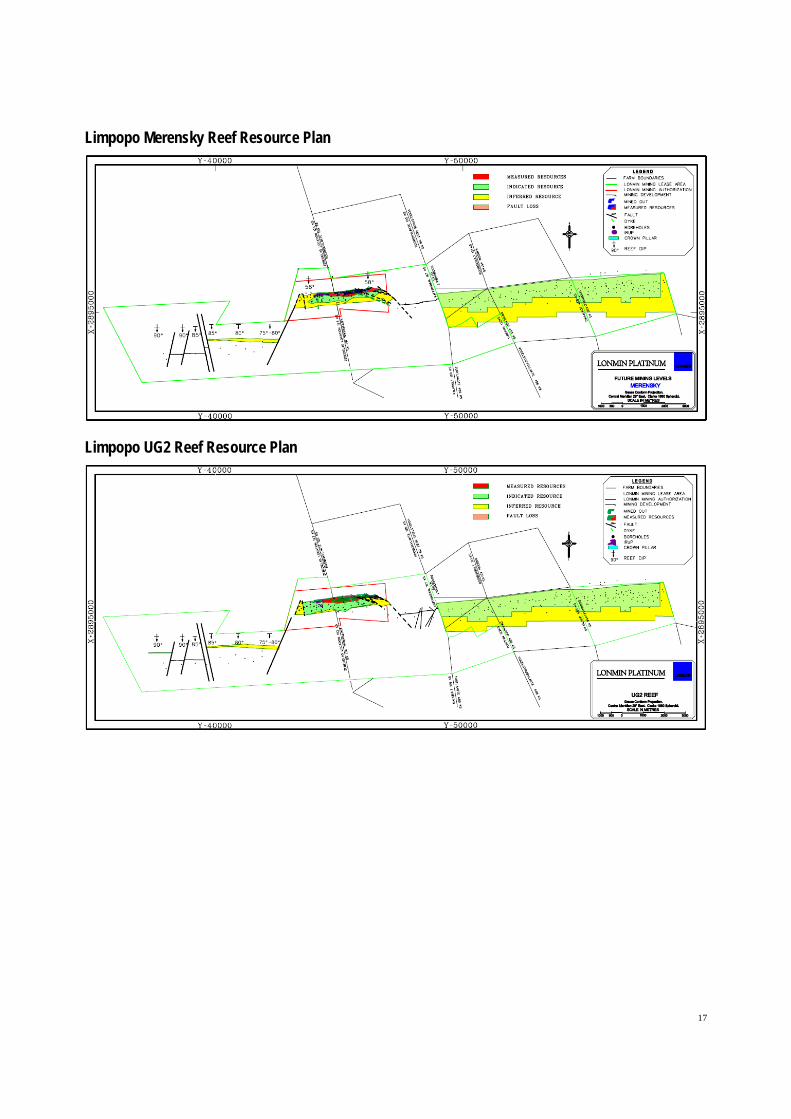
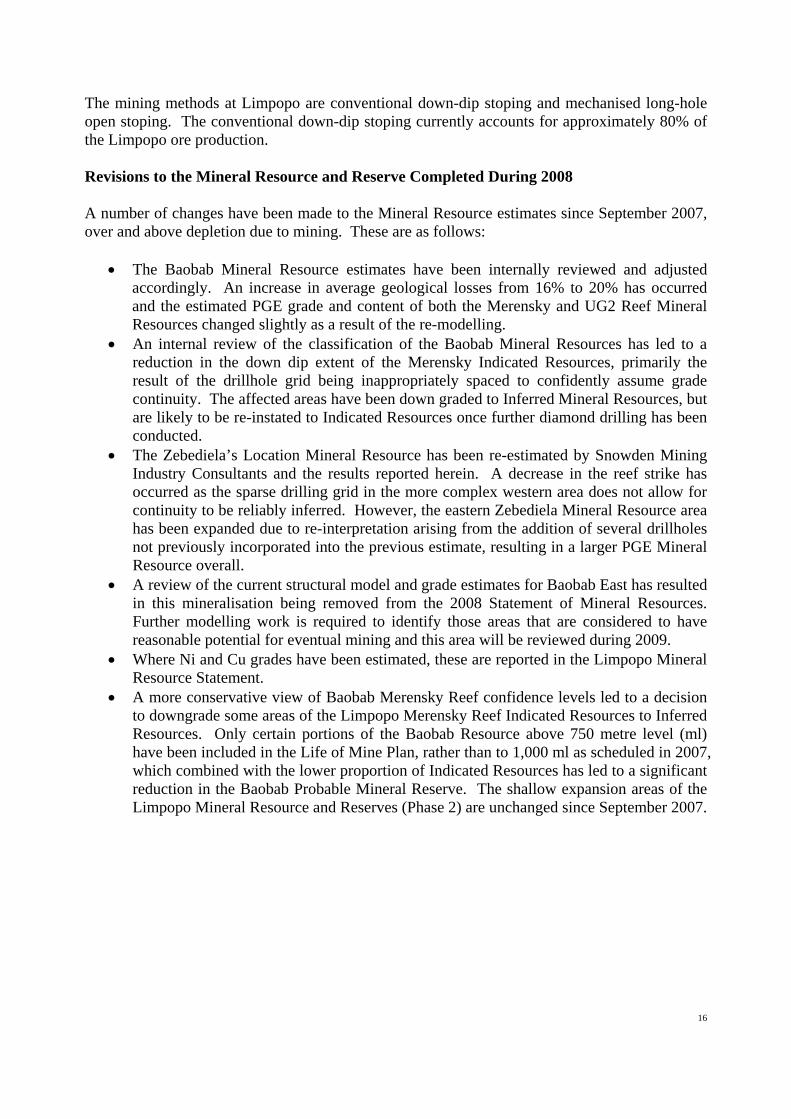
Limpopo Merensky Reef Resource Plan
Limpopo UG2 Reef Resource Plan
17
18
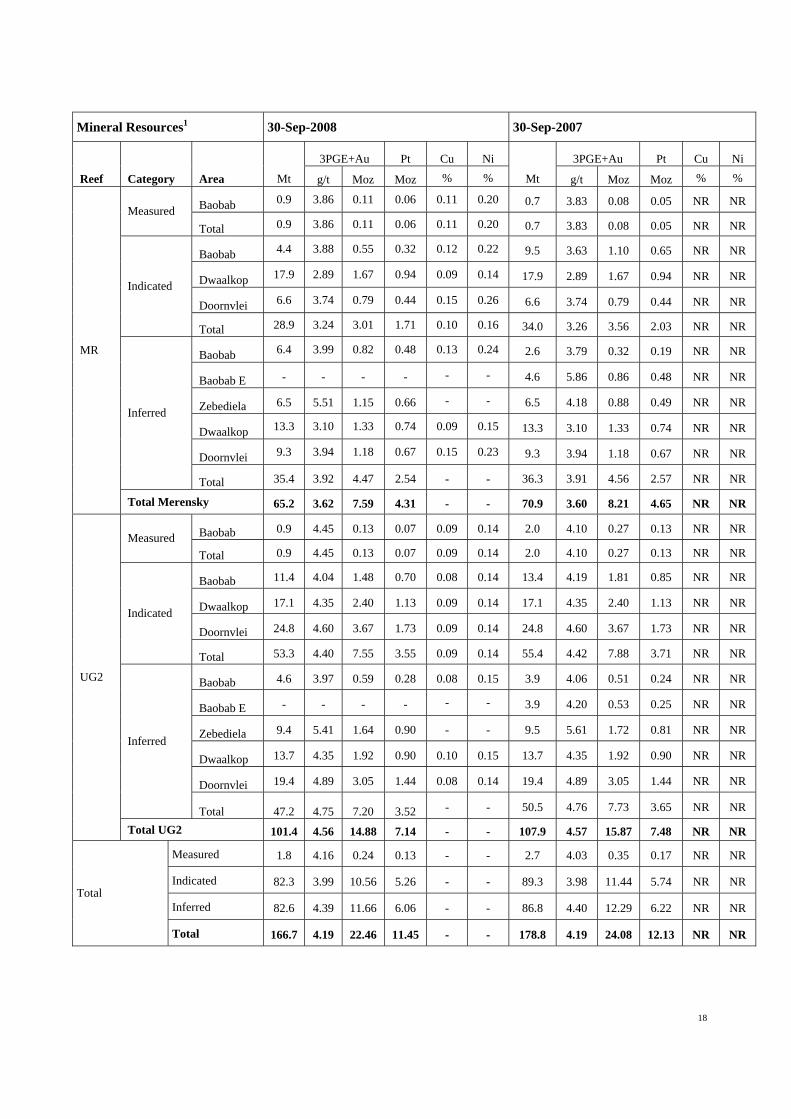
Mineral Resources1 30-Sep-2008 30-Sep-2007
3PGE+Au Pt Cu Ni 3PGE+Au Pt Cu Ni
Reef Category Area Mt g/t Moz Moz % % Mt g/t Moz Moz % %
Baobab 0.9 3.86 0.11 0.06 0.11 0.20 0.7 3.83 0.08 0.05 NR NR Measured
Total 0.9 3.86 0.11 0.06 0.11 0.20 0.7 3.83 0.08 0.05 NR NR
Baobab 4.4 3.88 0.55 0.32 0.12 0.22 9.5 3.63 1.10 0.65 NR NR
Dwaalkop 17.9 2.89 1.67 0.94 0.09 0.14 17.9 2.89 1.67 0.94 NR NR
Doornvlei 6.6 3.74 0.79 0.44 0.15 0.26 6.6 3.74 0.79 0.44 NR NR Indicated
Total 28.9 3.24 3.01 1.71 0.10 0.16 34.0 3.26 3.56 2.03 NR NR
Baobab 6.4 3.99 0.82 0.48 0.13 0.24 2.6 3.79 0.32 0.19 NR NR
Baobab E - - - - - - 4.6 5.86 0.86 0.48 NR NR
Zebediela 6.5 5.51 1.15 0.66 - - 6.5 4.18 0.88 0.49 NR NR
Dwaalkop 13.3 3.10 1.33 0.74 0.09 0.15 13.3 3.10 1.33 0.74 NR NR
Doornvlei 9.3 3.94 1.18 0.67 0.15 0.23 9.3 3.94 1.18 0.67 NR NR
Inferred
Total 35.4 3.92 4.47 2.54 - - 36.3 3.91 4.56 2.57 NR NR
MR
Total Merensky 65.2 3.62 7.59 4.31 - - 70.9 3.60 8.21 4.65 NR NR
Baobab 0.9 4.45 0.13 0.07 0.09 0.14 2.0 4.10 0.27 0.13 NR NR Measured
Total 0.9 4.45 0.13 0.07 0.09 0.14 2.0 4.10 0.27 0.13 NR NR
Baobab 11.4 4.04 1.48 0.70 0.08 0.14 13.4 4.19 1.81 0.85 NR NR
Dwaalkop 17.1 4.35 2.40 1.13 0.09 0.14 17.1 4.35 2.40 1.13 NR NR
Doornvlei 24.8 4.60 3.67 1.73 0.09 0.14 24.8 4.60 3.67 1.73 NR NR Indicated
Total 53.3 4.40 7.55 3.55 0.09 0.14 55.4 4.42 7.88 3.71 NR NR
Baobab 4.6 3.97 0.59 0.28 0.08 0.15 3.9 4.06 0.51 0.24 NR NR
Baobab E - - - - - - 3.9 4.20 0.53 0.25 NR NR
Zebediela 9.4 5.41 1.64 0.90 - - 9.5 5.61 1.72 0.81 NR NR
Dwaalkop 13.7 4.35 1.92 0.90 0.10 0.15 13.7 4.35 1.92 0.90 NR NR
Doornvlei 19.4 4.89 3.05 1.44 0.08 0.14 19.4 4.89 3.05 1.44 NR NR
Inferred
Total 47.2 4.75 7.20 3.52 - - 50.5 4.76 7.73 3.65 NR NR
UG2
Total UG2 101.4 4.56 14.88 7.14 - - 107.9 4.57 15.87 7.48 NR NR
Measured 1.8 4.16 0.24 0.13 - - 2.7 4.03 0.35 0.17 NR NR
Indicated 82.3 3.99 10.56 5.26 - - 89.3 3.98 11.44 5.74 NR NR
Inferred 82.6 4.39 11.66 6.06 - - 86.8 4.40 12.29 6.22 NR NR Total
Total 166.7 4.19 22.46 11.45 - - 178.8 4.19 24.08 12.13 NR NR
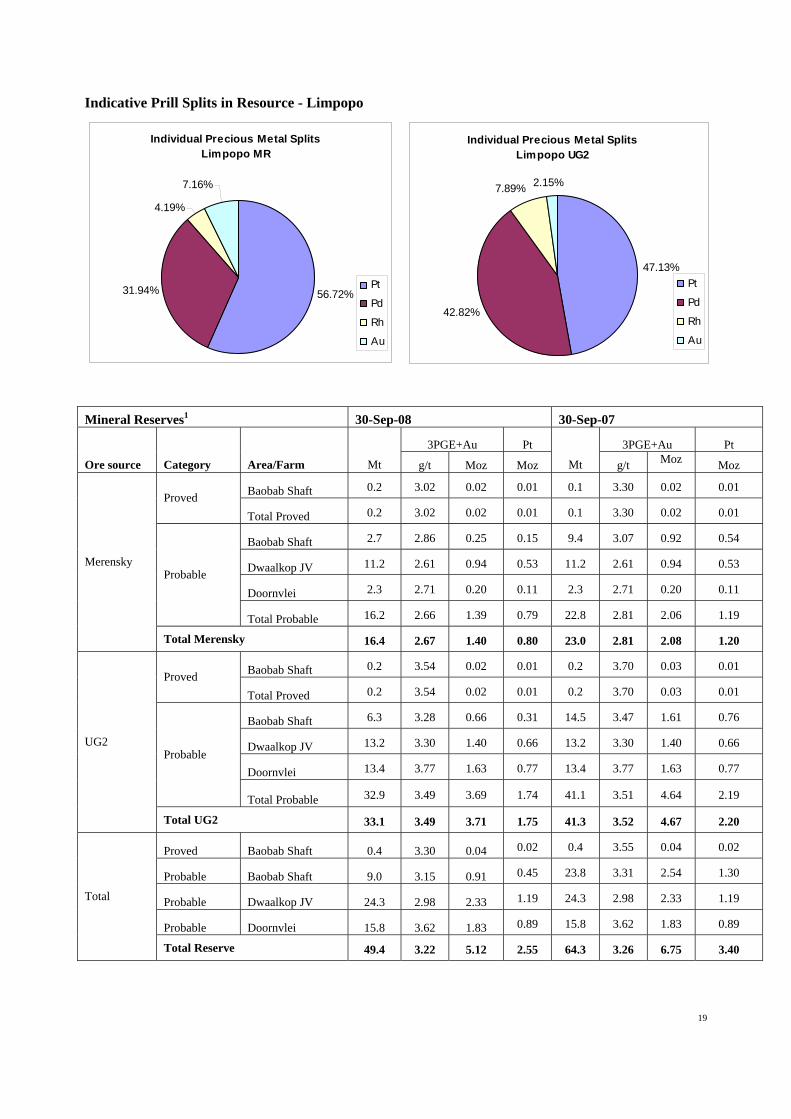
Indicative Prill Splits in Resource - Limpopo
Individual Precious Metal SplitsLimpopo MR
56.72%31.94%
4.19%
7.16%
Pt
Pd
Rh
Au
Individual Precious Metal SplitsLimpopo UG2
47.13%
42.82%
7.89% 2.15%
Pt
Pd
Rh
Au
Mineral Reserves1 30-Sep-08 30-Sep-07
3PGE+Au Pt 3PGE+Au Pt
Ore source Category Area/Farm Mt g/t Moz Moz Mt g/t Moz Moz
Baobab Shaft 0.2 3.02 0.02 0.01 0.1 3.30 0.02 0.01 Proved
Total Proved 0.2 3.02 0.02 0.01 0.1 3.30 0.02 0.01
Baobab Shaft 2.7 2.86 0.25 0.15 9.4 3.07 0.92 0.54
Dwaalkop JV 11.2 2.61 0.94 0.53 11.2 2.61 0.94
19
0.53
Doornvlei 2.3 2.71 0.20 0.11 2.3 2.71 0.20 0.11 Probable
Total Probable 16.2 2.66 1.39 0.79 22.8 2.81 2.06 1.19
Merensky
Total Merensky 16.4 2.67 1.40 0.80 23.0 2.81 2.08 1.20
Baobab Shaft 0.2 3.54 0.02 0.01 0.2 3.70 0.03 0.01 Proved
Total Proved 0.2 3.54 0.02 0.01 0.2 3.70 0.03 0.01
Baobab Shaft 6.3 3.28 0.66 0.31 14.5 3.47 1.61 0.76
Dwaalkop JV 13.2 3.30 1.40 0.66 13.2 3.30 1.40 0.66
Doornvlei 13.4 3.77 1.63 0.77 13.4 3.77 1.63 0.77 Probable
Total Probable 32.9 3.49 3.69 1.74 41.1 3.51 4.64 2.19
UG2
Total UG2 33.1 3.49 3.71 1.75 41.3 3.52 4.67 2.20
Proved Baobab Shaft 0.4 3.30 0.04 0.02 0.4 3.55 0.04 0.02
Probable Baobab Shaft 9.0 3.15 0.91 0.45 23.8 3.31 2.54 1.30
Probable Dwaalkop JV 24.3 2.98 2.33 1.19 24.3 2.98 2.33 1.19
Probable Doornvlei 15.8 3.62 1.83 0.89 15.8 3.62 1.83 0.89
Total
Total Reserve 49.4 3.22 5.12 2.55 64.3 3.26 6.75 3.40
20
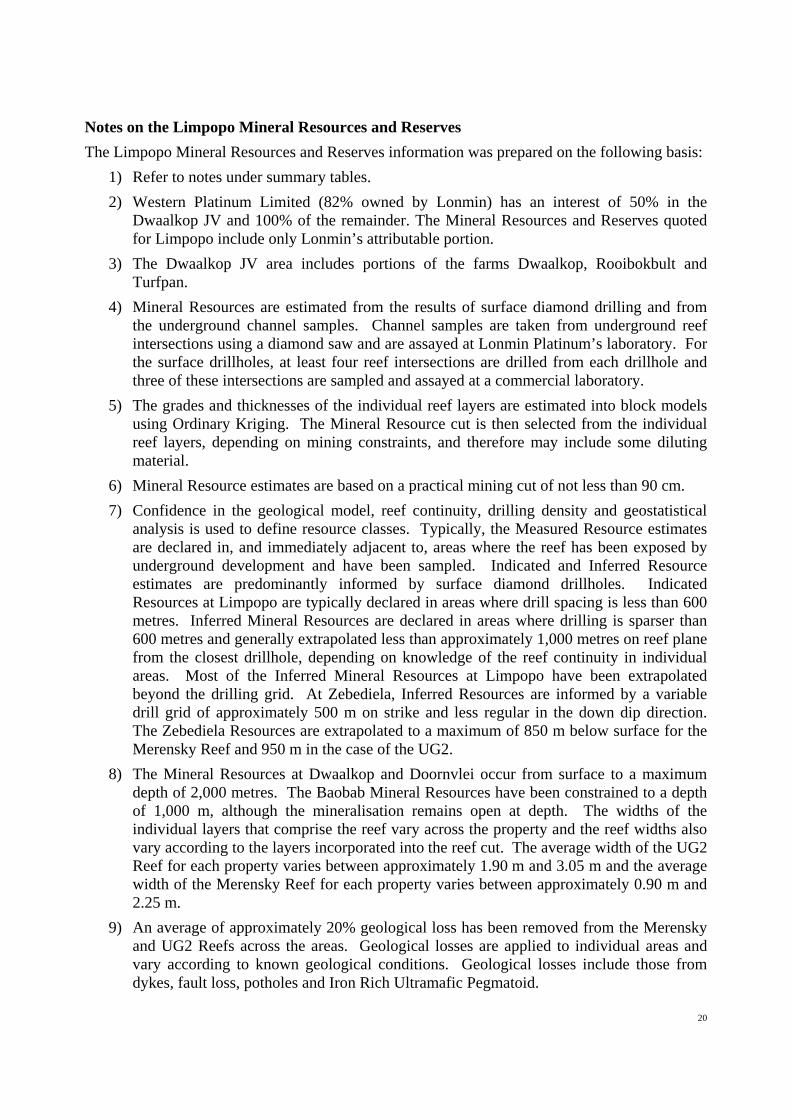
Notes on the Limpopo Mineral Resources and Reserves The Limpopo Mineral Resources and Reserves information was prepared on the following basis:
1) Refer to notes under summary tables. 2) Western Platinum Limited (82% owned by Lonmin) has an interest of 50% in the
Dwaalkop JV and 100% of the remainder. The Mineral Resources and Reserves quoted for Limpopo include only Lonmin’s attributable portion.
3) The Dwaalkop JV area includes portions of the farms Dwaalkop, Rooibokbult and Turfpan.
4) Mineral Resources are estimated from the results of surface diamond drilling and from the underground channel samples. Channel samples are taken from underground reef intersections using a diamond saw and are assayed at Lonmin Platinum’s laboratory. For the surface drillholes, at least four reef intersections are drilled from each drillhole and three of these intersections are sampled and assayed at a commercial laboratory.
5) The grades and thicknesses of the individual reef layers are estimated into block models using Ordinary Kriging. The Mineral Resource cut is then selected from the individual reef layers, depending on mining constraints, and therefore may include some diluting material.
6) Mineral Resource estimates are based on a practical mining cut of not less than 90 cm. 7) Confidence in the geological model, reef continuity, drilling density and geostatistical
analysis is used to define resource classes. Typically, the Measured Resource estimates are declared in, and immediately adjacent to, areas where the reef has been exposed by underground development and have been sampled. Indicated and Inferred Resource estimates are predominantly informed by surface diamond drillholes. Indicated Resources at Limpopo are typically declared in areas where drill spacing is less than 600 metres. Inferred Mineral Resources are declared in areas where drilling is sparser than 600 metres and generally extrapolated less than approximately 1,000 metres on reef plane from the closest drillhole, depending on knowledge of the reef continuity in individual areas. Most of the Inferred Mineral Resources at Limpopo have been extrapolated beyond the drilling grid. At Zebediela, Inferred Resources are informed by a variable drill grid of approximately 500 m on strike and less regular in the down dip direction. The Zebediela Resources are extrapolated to a maximum of 850 m below surface for the Merensky Reef and 950 m in the case of the UG2.
8) The Mineral Resources at Dwaalkop and Doornvlei occur from surface to a maximum depth of 2,000 metres. The Baobab Mineral Resources have been constrained to a depth of 1,000 m, although the mineralisation remains open at depth. The widths of the individual layers that comprise the reef vary across the property and the reef widths also vary according to the layers incorporated into the reef cut. The average width of the UG2 Reef for each property varies between approximately 1.90 m and 3.05 m and the average width of the Merensky Reef for each property varies between approximately 0.90 m and 2.25 m.
9) An average of approximately 20% geological loss has been removed from the Merensky and UG2 Reefs across the areas. Geological losses are applied to individual areas and vary according to known geological conditions. Geological losses include those from dykes, fault loss, potholes and Iron Rich Ultramafic Pegmatoid.
10) Proved Reserves are converted from fully developed Measured Resources and Probable Reserves are converted from Indicated and undeveloped Measured Resources using estimated dilution and extraction factors for the individual area taking cognisance of the reef type and planned mining method.
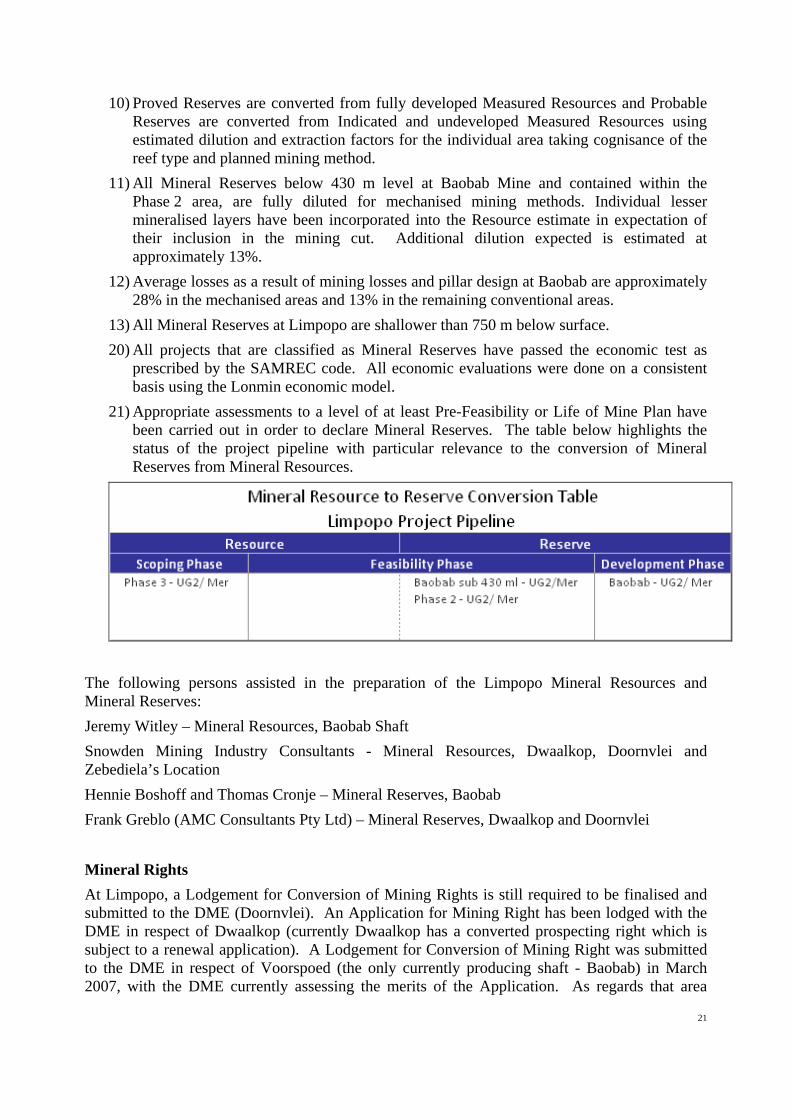
11) All Mineral Reserves below 430 m level at Baobab Mine and contained within the Phase 2 area, are fully diluted for mechanised mining methods. Individual lesser mineralised layers have been incorporated into the Resource estimate in expectation of their inclusion in the mining cut. Additional dilution expected is estimated at approximately 13%.
12) Average losses as a result of mining losses and pillar design at Baobab are approximately 28% in the mechanised areas and 13% in the remaining conventional areas.
13) All Mineral Reserves at Limpopo are shallower than 750 m below surface. 20) All projects that are classified as Mineral Reserves have passed the economic test as
prescribed by the SAMREC code. All economic evaluations were done on a consistent basis using the Lonmin economic model.
21) Appropriate assessments to a level of at least Pre-Feasibility or Life of Mine Plan have been carried out in order to declare Mineral Reserves. The table below highlights the status of the project pipeline with particular relevance to the conversion of Mineral Reserves from Mineral Resources.
The following persons assisted in the preparation of the Limpopo Mineral Resources and Mineral Reserves: Jeremy Witley – Mineral Resources, Baobab Shaft Snowden Mining Industry Consultants - Mineral Resources, Dwaalkop, Doornvlei and Zebediela’s Location Hennie Boshoff and Thomas Cronje – Mineral Reserves, Baobab Frank Greblo (AMC Consultants Pty Ltd) – Mineral Reserves, Dwaalkop and Doornvlei Mineral Rights At Limpopo, a Lodgement for Conversion of Mining Rights is still required to be finalised and submitted to the DME (Doornvlei). An Application for Mining Right has been lodged with the DME in respect of Dwaalkop (currently Dwaalkop has a converted prospecting right which is subject to a renewal application). A Lodgement for Conversion of Mining Right was submitted to the DME in respect of Voorspoed (the only currently producing shaft - Baobab) in March 2007, with the DME currently assessing the merits of the Application. As regards that area
21

22
previously subject to an old order prospecting right (i.e. primarily Zebediela’s Location), a new order prospecting right has been granted, executed and registered.
23
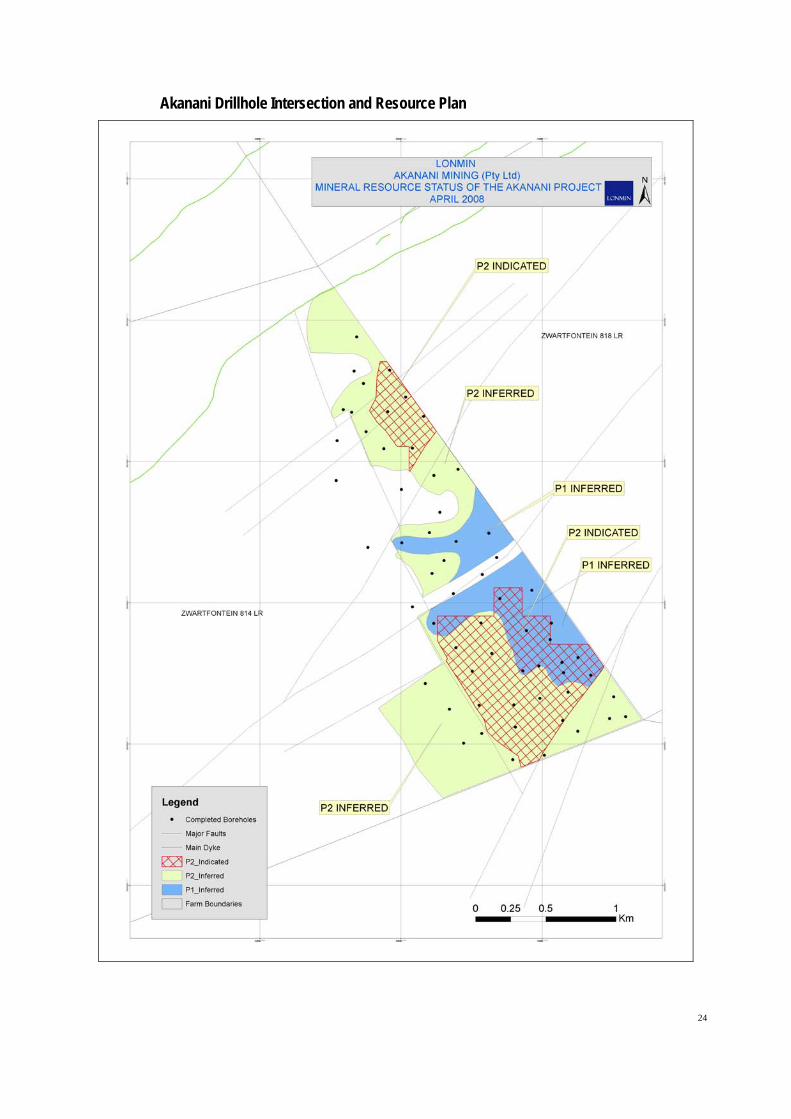
The Akanani Project Mineral Resources 30 September 2008 The acquisition of the Akanani Project was completed at the beginning of February 2007. This exciting Mineral Resource is contained within a unique deposit in the Bushveld. The considerable reef thickness makes the Mineral Resource amenable to fully mechanised bulk mining methods. The Akanani mineralisation is hosted within the Platreef pyroxenites of the Northern Limb of the Bushveld Complex. At Akanani, the lithological layering in the Platreef appears to be less continuous than that of the Critical Zone in the Eastern and Western Limbs. The results of more than eighty diamond drillholes drilled since 2005 have established that the higher grade mineralisation is generally well constrained within a geological unit of the Platreef known by Lonmin as the P2 Unit. Mineralisation in the immediately underlying P1 Unit appears to be less continuous than that of the P2 Unit and exploration is ongoing to identify zones of mineralisation continuity within this unit. The locations of major discontinuities, such as faults and dykes, have been established by magnetic surveys. Revisions to the Mineral Resource Completed During 2008 As a result of our increased understanding of the Akanani mineralisation several significant changes to the reported Mineral Resources have occurred since 30 September 2007:
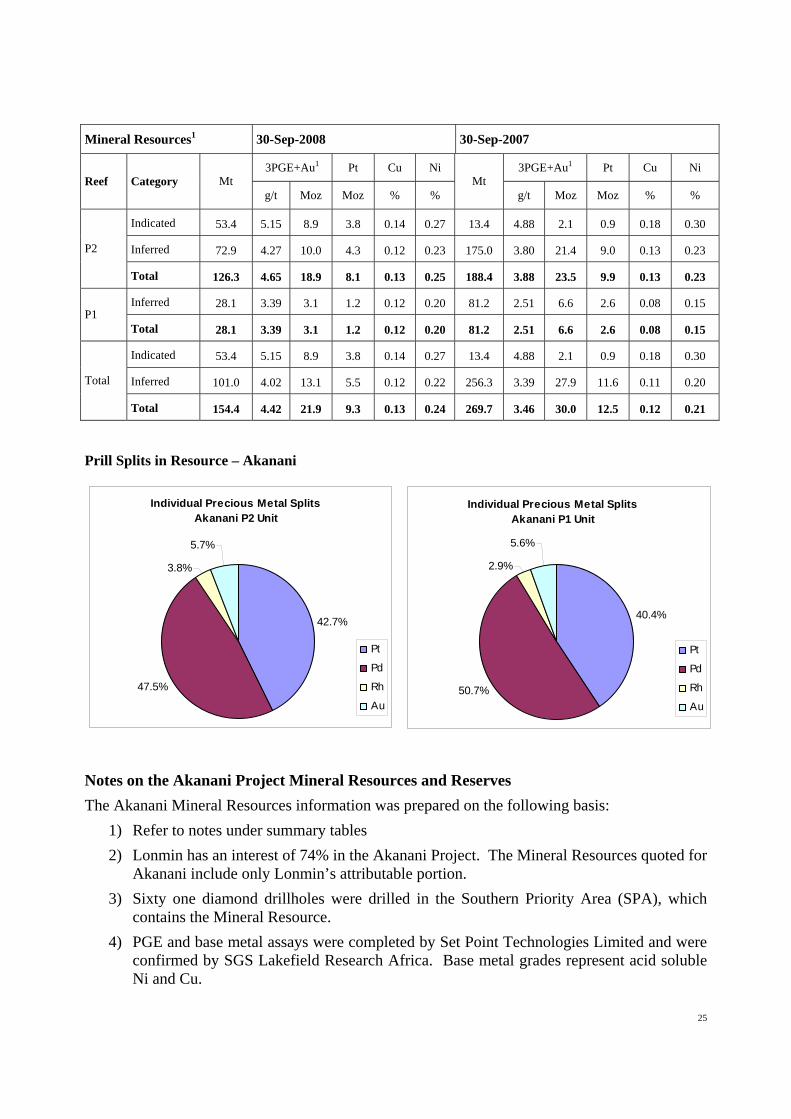
• Re-evaluation of several relatively low grade and narrow mineralised drillhole intersections in the north east of the SPA resulted in a decrease in the area enclosing the P2 Mineral Resource. This led to a reduction in the resource volume, but at an increased global PGE resource grade from 3.88 g/t to 4.65 g/t 3PGE+Au.
• The regularisation of the P1 2g/t 3PGE mineralised envelope directly below and contiguous with areas of the P2 Mineral Resource led to a large reduction in the volume of the P1 Mineral Resource. The PGE grade contained within the revised Mineral Resource increased substantially from 2.51 g/t to 3.39 g/t 3PGE+Au.
• Several small areas that have been identified to be geologically structurally complex have been removed from the Mineral Resource and will be evaluated through further diamond drilling and interpretation.
Akanani Drillhole Intersection and Resource Plan
24
Mineral Resources1 30-Sep-2008 30-Sep-2007
3PGE+Au1 Pt Cu Ni 3PGE+Au1 Pt Cu Ni Reef Category Mt
g/t Moz Moz % % Mt
g/t Moz Moz % %
Indicated 53.4 5.15 8.9 3.8 0.14 0.27 13.4 4.88 2.1 0.9 0.18 0.30
Inferred 72.9 4.27 10.0 4.3 0.12 0.23 175.0 3.80 21.4 9.0 0.13 0.23 P2
Total 126.3 4.65 18.9 8.1 0.13 0.25 188.4 3.88 23.5 9.9 0.13 0.23
Inferred 28.1 3.39 3.1 1.2 0.12 0.20 81.2 2.51 6.6 2.6 0.08 0.15 P1
Total 28.1 3.39 3.1 1.2 0.12 0.20 81.2 2.51 6.6 2.6 0.08 0.15
Indicated 53.4 5.15 8.9 3.8 0.14 0.27 13.4 4.88 2.1 0.9 0.18 0.30
Inferred 101.0 4.02 13.1 5.5 0.12 0.22 256.3 3.39 27.9 11.6 0.11
25
0.20 Total
Total 154.4 4.42 21.9 9.3 0.13 0.24 269.7 3.46 30.0 12.5 0.12 0.21
Prill Splits in Resource – Akanani
Individual Precious Metal SplitsAkanani P2 Unit
42.7%
47.5%
3.8%
5.7%
Pt
Pd
Rh
Au
Individual Precious Metal SplitsAkanani P1 Unit
40.4%
50.7%
2.9%
5.6%
Pt
Pd
Rh
Au
Notes on the Akanani Project Mineral Resources and Reserves The Akanani Mineral Resources information was prepared on the following basis:
1) Refer to notes under summary tables 2) Lonmin has an interest of 74% in the Akanani Project. The Mineral Resources quoted for
Akanani include only Lonmin’s attributable portion. 3) Sixty one diamond drillholes were drilled in the Southern Priority Area (SPA), which
contains the Mineral Resource. 4) PGE and base metal assays were completed by Set Point Technologies Limited and were
confirmed by SGS Lakefield Research Africa. Base metal grades represent acid soluble Ni and Cu.
26
5) The Mineral Resource estimates were completed for both the P2 and P1 Units at Akanani using 3D modelling techniques and Ordinary Kriging in an unfolded coordinate system.
6) Interpreted geological losses have been removed. Geological losses include those from dykes and veins, fault loss and localised alteration. 10% geological losses were removed from the P2 model. 20% geological losses were removed from the P1 model, in order to account for the occurrences of calc-silicate in this unit.
7) Indicated Mineral Resources are typically declared where drillhole spacing is less than 350 m, depending on knowledge of the reef continuity in individual areas.
8) Inferred Mineral Resources are extrapolated a maximum of 450 metres in the reef plane outside the drillhole grid to a maximum depth of 2,000 metres, depending on knowledge of the reef continuity in individual areas.
9) The Mineral Resources in the project occur from approximately 800 m below surface and are shallower than 2,000 m below surface. The average thickness of the P2 Unit Mineral Resource is approximately 20 m and the average thickness of the P1 Unit mineralisation that was converted to Mineral Resource is approximately 20 m.
10) There are currently no Mineral Reserves estimated for the Akanani Project. The following persons assisted in the preparation of the Akanani Project Mineral Resources: Jeremy Witley Hendrik Meiring Mineral Rights A converted prospecting right has been granted in respect of Akanani until 2012.
27
Pandora Joint Venture Mineral Resources and Reserves 30 September 2008
The Pandora Joint Venture is located in the Brits District immediately east and down dip (north) of the eastern area of Lonmin’s Marikana Operations. Eastern Platinum has an attributable interest of 42.5% in the Pandora JV together with Anglo Platinum, Mvelaphanda Resources and the Bapo Ba Mogale Mining Company. The area is underlain by the Merensky Pyroxenite and the UG2 Chromitite Layer over a strike length of approximately 12 km. Both the Merensky Pyroxenite and the UG2 Chromitite Layer outcrop along 5 km of the strike length of the lease area that is contiguous to the Marikana Operations. The layers strike in an approximately east-west direction and generally dip approximately 13° to the north. The continuity of the UG2 Reef has been established by extensive underground and open pit mining, underground sampling, surface trenching, surface drilling and magnetic surveys. The drilling of multiple reef intersections in each drillhole is standard practice and provides material for assay, geotechnical, mineralogical and metallurgical testing. Logging and sampling of drillholes are conducted according to standard procedures and drillhole data is electronically stored in a commercial database. The layered nature of the Bushveld Complex makes it possible to identify different lithological units, which facilitates the interpretation of geological disturbances like dykes, faults, potholes and Iron Rich Ultramafic Pegmatite (IRUP). A total of over 150 surface diamond drill holes have been completed and an infill drilling programme is in progress, which is expected to further increase our confidence in this Mineral Resource. The complete property has been covered by airborne or ground magnetic surveys. The UG2 Reef is mined from underground in the JV area via the Marikana Operations E3 Incline shaft access and from open pits from surface. The resources stated for the Pandora JV consist of UG2 reef only. The Merensky Pyroxenite that occurs in this area comprises thick Eastplats reef type and continuity of potentially payable mineralisation has not yet been established. Work is ongoing in order to evaluate the potential of this mineralisation. Revisions to the Mineral Resource and Reserves Completed During 2008
• A re-estimate of the Pandora Mineral Resource was conducted during the year, which resulted in a slightly decreased grade and tonnage for this area. Together with Anglo Platinum, a review of the classification of the Mineral Resources was completed, which resulted in a slight increase to the proportion of Measured Mineral Resources, some of which were depleted through mining during the year.
• Open Pit Measured Resources have been converted to Proved Reserves
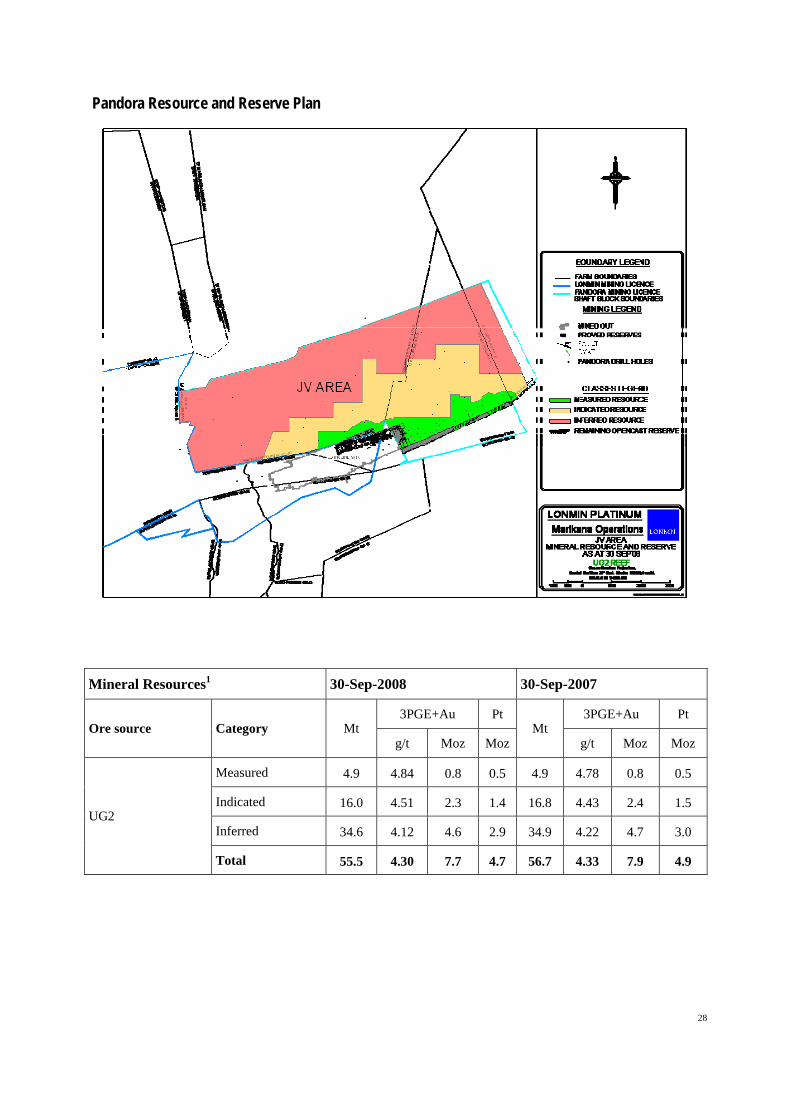
Pandora Resource and Reserve Plan
Mineral Resources1 30-Sep-2008 30-Sep-2007
3PGE+Au Pt 3PGE+Au Pt Ore source Category Mt
g/t Moz Moz Mt
g/t Moz Moz
Measured 4.9 4.84 0.8 0.5 4.9 4.78 0.8 0.5
Indicated 16.0 4.51 2.3 1.4 16.8 4.43 2.4 1.5
Inferred 34.6 4.12 4.6 2.9 34.9 4.22 4.7
28
3.0 UG2
Total 55.5 4.30 7.7 4.7 56.7 4.33 7.9 4.9
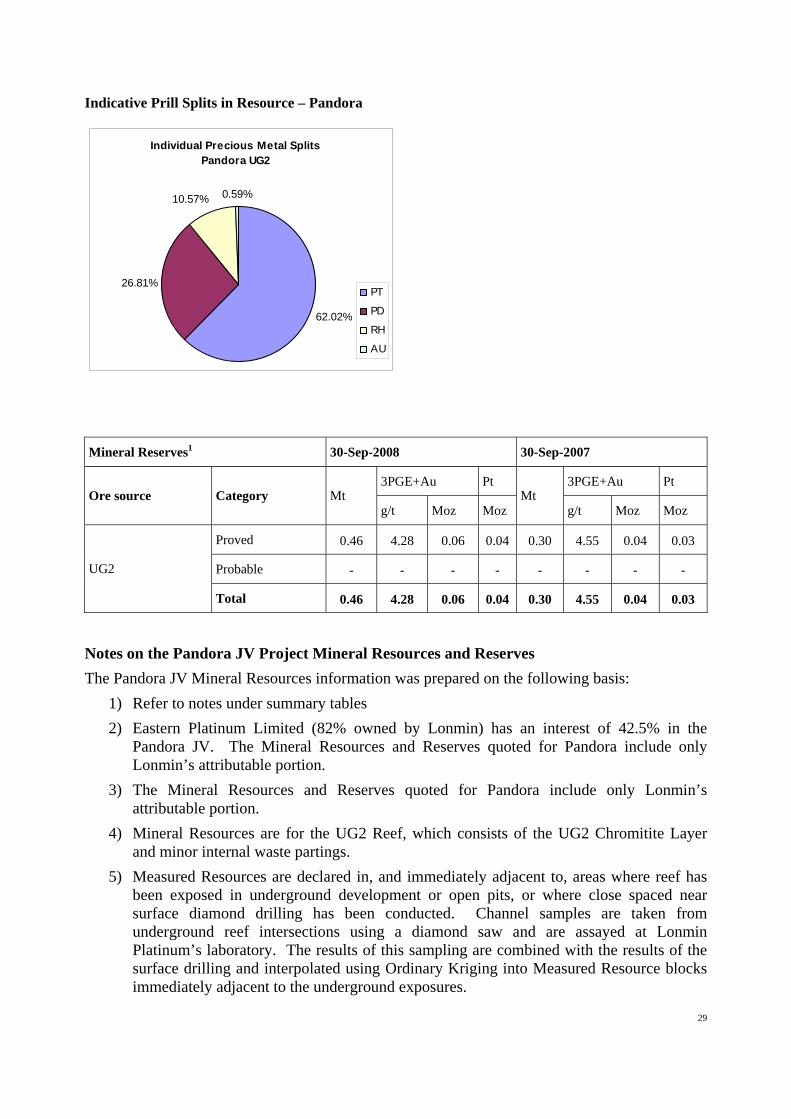
Indicative Prill Splits in Resource – Pandora
Individual Precious Metal SplitsPandora UG2
62.02%
26.81%
10.57% 0.59%
PT
PD
RH
AU
Mineral Reserves1 30-Sep-2008 30-Sep-2007
3PGE+Au Pt 3PGE+Au Pt Ore source Category Mt
g/t Moz Moz Mt
g/t Moz Moz
Proved 0.46 4.28 0.06 0.04 0.30 4.55 0.04 0.03
Probable - - - - - - -
29
- UG2
Total 0.46 4.28 0.06 0.04 0.30 4.55 0.04 0.03
Notes on the Pandora JV Project Mineral Resources and Reserves The Pandora JV Mineral Resources information was prepared on the following basis:
1) Refer to notes under summary tables 2) Eastern Platinum Limited (82% owned by Lonmin) has an interest of 42.5% in the
Pandora JV. The Mineral Resources and Reserves quoted for Pandora include only Lonmin’s attributable portion.
3) The Mineral Resources and Reserves quoted for Pandora include only Lonmin’s attributable portion.
4) Mineral Resources are for the UG2 Reef, which consists of the UG2 Chromitite Layer and minor internal waste partings.
5) Measured Resources are declared in, and immediately adjacent to, areas where reef has been exposed in underground development or open pits, or where close spaced near surface diamond drilling has been conducted. Channel samples are taken from underground reef intersections using a diamond saw and are assayed at Lonmin Platinum’s laboratory. The results of this sampling are combined with the results of the surface drilling and interpolated using Ordinary Kriging into Measured Resource blocks immediately adjacent to the underground exposures.
30
6) Indicated and Inferred Resources are estimated from the results of surface diamond drilling. Currently, at least four reef intersections are drilled from each drillhole and three of these intersections are sampled and assayed at a commercial laboratory. The individual reef composites are estimated into block models using Ordinary Kriging.
7) Confidence in the geological model, reef continuity, drilling density and geostatistical analysis is used to define resource classes. Indicated Resources at Pandora are typically declared in areas where drill spacing is less than 800 metres. Inferred Mineral Resources are declared in areas where drilling is sparser than 800 metres and are extrapolated less than 2,000 metres from the closest drillhole.
8) The Mineral Resources at Pandora occur from surface to approximately 1,200 m below surface. The average width of the UG2 is approximately 1.23 m.
9) An average of 23% geological losses has been removed. Geological losses include those from dykes, fault loss, potholes and Iron Rich Ultramafic Pegmatoid.
10) Proved Reserves are converted from fully developed Measured Resources. Modifying factors applied to convert Mineral Resources to Mineral Reserves are derived from the Mineral Resource Management system on Lonmin Platinum’s current operations. All survey, sampling, stope-width control and geological data are stored in electronic databases and mine plans are captured electronically in a 3 dimensional geographical information system.
11) For Mineral Reserve estimation, the Pandora Mineral Resources have been diluted by an average of approximately 15%. Average losses as a result of mining losses and underground pillar design are approximately 17%.
The following Competent Persons assisted in the preparation of the Pandora JV Mineral Resources and Mineral Reserves: Jeremy Witley – Mineral Resources Paul Stevenson (Anglo Platinum) – Mineral Resources Mike Freer – Mineral Reserves Mineral Rights A Lodgement for Conversion of Mining Right was submitted in respect of Pandora in mid-2006. Arising from an amendment to the mining plan to be implemented at Pandora, the Mine Work Program and consequently the Social and Labour Plan were significantly amended. These amended documents were then lodged with the DME in mid-2007 as replacements for the original Mine Work Programme and Social and Labour Plan submitted. The DME is currently assessing the Application. A separate Application for Mining Right is still to be compiled and submitted in respect of certain areas excluded from the Pandora mining licence area.
Loskop Joint Venture Mineral Resources and Reserves 30 September 2008
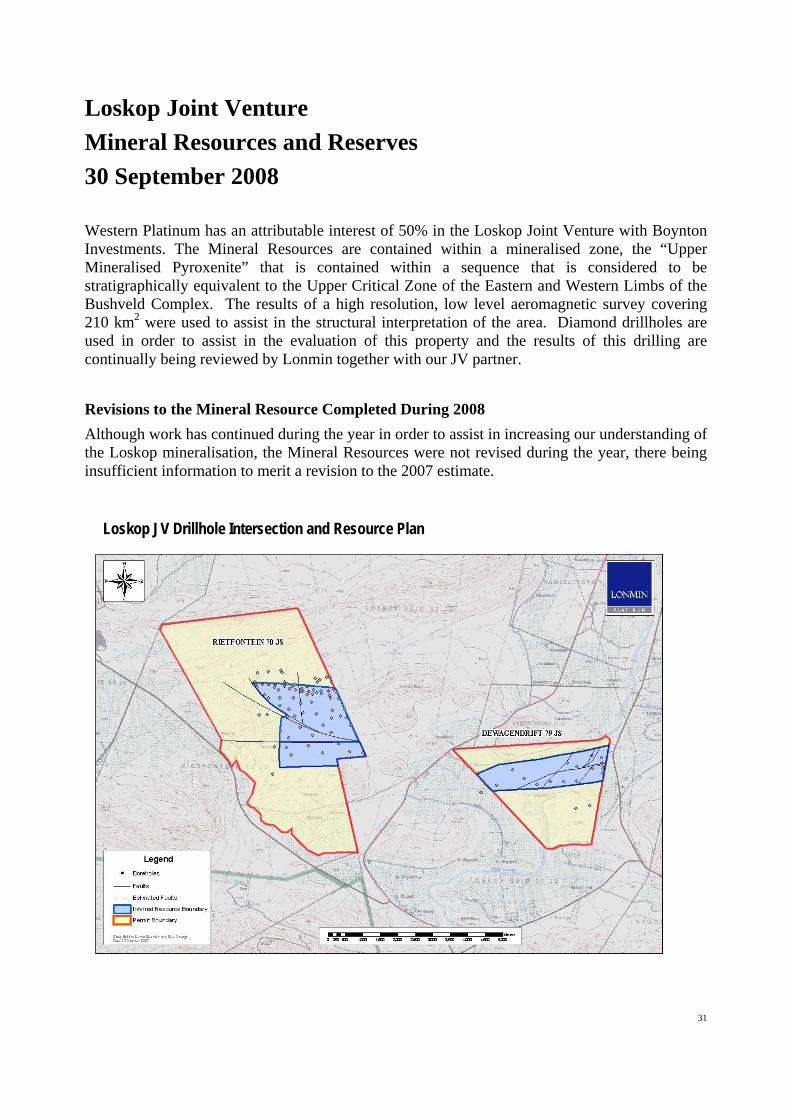
Western Platinum has an attributable interest of 50% in the Loskop Joint Venture with Boynton Investments. The Mineral Resources are contained within a mineralised zone, the “Upper Mineralised Pyroxenite” that is contained within a sequence that is considered to be stratigraphically equivalent to the Upper Critical Zone of the Eastern and Western Limbs of the Bushveld Complex. The results of a high resolution, low level aeromagnetic survey covering 210 km2 were used to assist in the structural interpretation of the area. Diamond drillholes are used in order to assist in the evaluation of this property and the results of this drilling are continually being reviewed by Lonmin together with our JV partner. Revisions to the Mineral Resource Completed During 2008 Although work has continued during the year in order to assist in increasing our understanding of the Loskop mineralisation, the Mineral Resources were not revised during the year, there being insufficient information to merit a revision to the 2007 estimate.
Loskop JV Drillhole Intersection and Resource Plan
31
32
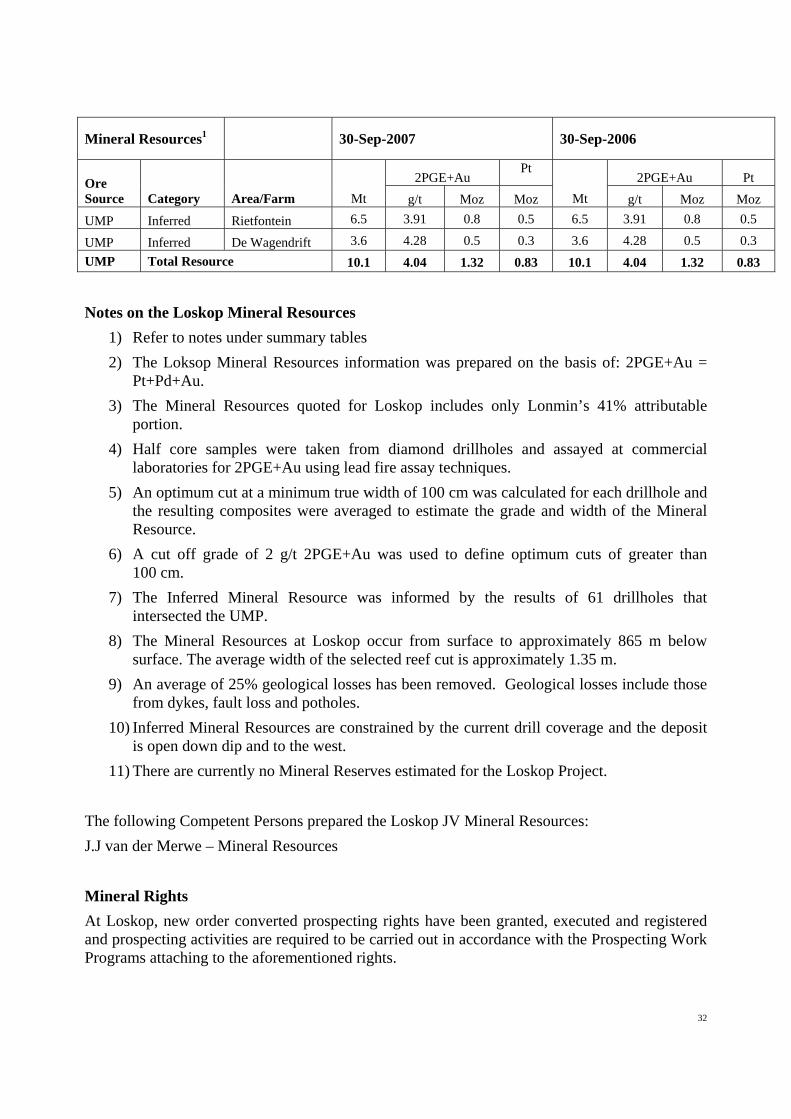
Mineral Resources1 30-Sep-2007 30-Sep-2006
2PGE+Au Pt
2PGE+Au Pt Ore Source Category Area/Farm Mt g/t Moz Moz Mt g/t Moz Moz UMP Inferred Rietfontein 6.5 3.91 0.8 0.5 6.5 3.91 0.8 0.5
UMP Inferred De Wagendrift 3.6 4.28 0.5 0.3 3.6 4.28 0.5 0.3 UMP Total Resource 10.1 4.04 1.32 0.83 10.1 4.04 1.32 0.83
Notes on the Loskop Mineral Resources 1) Refer to notes under summary tables 2) The Loksop Mineral Resources information was prepared on the basis of: 2PGE+Au =
Pt+Pd+Au. 3) The Mineral Resources quoted for Loskop includes only Lonmin’s 41% attributable
portion. 4) Half core samples were taken from diamond drillholes and assayed at commercial
laboratories for 2PGE+Au using lead fire assay techniques. 5) An optimum cut at a minimum true width of 100 cm was calculated for each drillhole and
the resulting composites were averaged to estimate the grade and width of the Mineral Resource.
6) A cut off grade of 2 g/t 2PGE+Au was used to define optimum cuts of greater than 100 cm.
7) The Inferred Mineral Resource was informed by the results of 61 drillholes that intersected the UMP.
8) The Mineral Resources at Loskop occur from surface to approximately 865 m below surface. The average width of the selected reef cut is approximately 1.35 m.
9) An average of 25% geological losses has been removed. Geological losses include those from dykes, fault loss and potholes.
10) Inferred Mineral Resources are constrained by the current drill coverage and the deposit is open down dip and to the west.
11) There are currently no Mineral Reserves estimated for the Loskop Project. The following Competent Persons prepared the Loskop JV Mineral Resources: J.J van der Merwe – Mineral Resources Mineral Rights At Loskop, new order converted prospecting rights have been granted, executed and registered and prospecting activities are required to be carried out in accordance with the Prospecting Work Programs attaching to the aforementioned rights.