long-term no tillage effects on particulate and mineral...
TRANSCRIPT
Long-term no tillage effects on POM and Min
Long-term no tillage effects on particulate and mineral-associated soil 1
organic matter under rainfed Mediterranean conditions 2
3
4
5
N. BLANCO-MOURE, R. GRACIA, A. C. BIELSA & M. V. LÓPEZ 6
7
8
9
10
Departamento de Suelo y Agua, Estación Experimental de Aula Dei, Consejo Superior de 11
Investigaciones Científicas (EEAD-CSIC), POB 13034, 50080-Zaragoza (Spain) 12
13
Correspondence: M.V. López. E-mail: [email protected] 14
15
16
Running title: Long-term no tillage effects on soil organic matter fractions 17
18
Long-term no tillage effects on POM and Min
2
Summary 19
Soil organic carbon (SOC) plays an essential role in the sustainability of natural and 20
agricultural systems. The identification of sensitive SOC fractions can be crucial for an 21
understanding of SOC dynamics and stabilization. The objective of this study was to assess 22
the effect of long-term no tillage (NT) on SOC content and its distribution between particulate 23
organic matter (POM) and mineral-associated organic matter (Min) fractions in five different 24
cereal production areas of Aragon (north east Spain). The study was conducted under on-farm 25
conditions where pairs of adjacent fields under NT and conventional tillage (CT) were 26
compared. An undisturbed soil nearby under native vegetation was included. The results 27
indicate that SOC was significantly affected by tillage in the first 5 cm with the greatest 28
concentrations found in NT (1.5 - 43% more than in CT). Below 40 cm, SOC under NT 29
decreased (20 - 40%) to values similar or less than those under CT. However, the stratification 30
ratio (SR) never reached the threshold value of 2. The POM-C fraction, disproportionate to its 31
small contribution to total SOC (10-30%), was greatly affected by soil management. The 32
pronounced stratification in this fraction (SR>2 in NT) and its usefulness for differentiating 33
the study sites in terms of response to NT make POM-C a good indicator of changes in soil 34
management under the study conditions. Results from this on-farm study indicate that NT can 35
be recommended as an alternative strategy to increase organic carbon at the soil surface in the 36
cereal production areas of Aragon and in other analogous areas. 37
38
39
Keywords: Soil organic carbon (SOC), agriculture, tillage, carbon storage, land use, soil 40
management 41
Blanco-Moure et al.
3
Introduction 42
Soil organic matter (SOM) plays an essential role in maintaining the necessary chemical, 43
physical and biological conditions for sustainability and environmental integrity of 44
ecosystems (Lal, 2004). Unfortunately, 20th century tillage practices have caused a 45
worldwide decline in SOM with serious environmental and agricultural implications. 46
According to the Thematic Strategy for Soil Protection (European Commission, 2006), the 47
decrease of SOM is one of the main processes of soil degradation in Europe. Besides climatic 48
reasons, human activities are the most relevant driving forces. The need to adopt sustainable 49
management practices that can contribute to improving SOM, such as conservation tillage, is 50
of particular relevance to the Mediterranean region where 74% of the land has a surface soil 51
horizon (0-30 cm) with <20 g kg-1 of organic carbon (Van-Camp et al., 2004). 52
Many studies have shown the potential of conservation tillage, and especially of no tillage 53
(NT), to increase SOM and improve soil quality (Govaerts et al., 2009) though the rate of 54
adoption of these alternative systems has been relatively slow in Europe. No tillage is 55
practised on about 117 million ha throughout the world but only 1.15 million ha are in Europe 56
(Derpsch & Friedrich, 2010). For Spain, 650,000 ha of agricultural land are under NT. This 57
indicates that NT adoption is still low in Spain. A recent on-farm study in Aragon (north east 58
Spain) has shown the increasing interest of farmers in NT systems but, at the same time, there 59
is lack of knowledge about the soils on which these techniques are being applied (López et 60
al., 2012). A greater adoption rate of NT could help to reduce the high risk of land 61
degradation by wind and water erosion in this semiarid region of Aragon (López et al., 2001; 62
García-Ruiz, 2010). 63
Total soil organic C (SOC) is not always the best indicator of changes in soil 64
management, especially under semiarid climatic conditions where low soil moisture and high 65
temperature are limiting factors for SOC accumulation (Chan et al., 2003; Moreno et al., 66
Long-term no tillage effects on POM and Min
4
2006; Melero et al., 2012). Under these conditions significant changes in SOC are only to be 67
expected after several years of NT adoption. The advance in SOM fractionation techniques 68
has made possible the separation of the heterogeneous organic material into labile and 69
recalcitrant pools defined not only on the basis of their composition and turnover rates but 70
also in their response to soil management (Cambardella & Elliot, 1992; Six et al., 2002a; 71
Haynes, 2005). Thus, while labile SOC pools seem to be influenced by management 72
practices, the recalcitrant SOC fractions may or may not be affected by the tillage system 73
(Álvaro-Fuentes et al., 2008; Jagadamma & Lal, 2010). The reasons for this variable response 74
seem to be complex and can involve not only many influential factors (such as soil texture 75
and mineralogy), but also the inherent nature of the fraction and the different mechanisms of 76
C stabilization (biochemical recalcitrance and organo-mineral associations) (Six et al., 2002b; 77
Moni et al., 2010). Thus research into the characterization of the different SOC fractions is 78
needed to increase our understanding of the specific contribution of each fraction to soil 79
function and quality. 80
The few available data on SOC fractions in agricultural soils of Aragon have been derived 81
from small research plots and from single soil types (Álvaro-Fuentes et al., 2008). However, 82
direct measurements under on-farm conditions across different soils, microclimates and 83
agronomic practices are necessary since farming practices are very diverse and can differ 84
from those in experimental plots (López et al., 2012). The objective of this study was to 85
assess the effect of long-term NT on SOC content and its distribution between particulate 86
organic matter-C (POM-C) and mineral-associated organic C (Min-C) fractions under rainfed 87
Mediterranean conditions. With this aim, six fields of NT were compared with adjacent 88
conventional tillage fields and with undisturbed soils under native vegetation in different 89
cereal production areas of Aragon. 90
91
Blanco-Moure et al.
5
Materials and methods 92
Description of the study sites 93
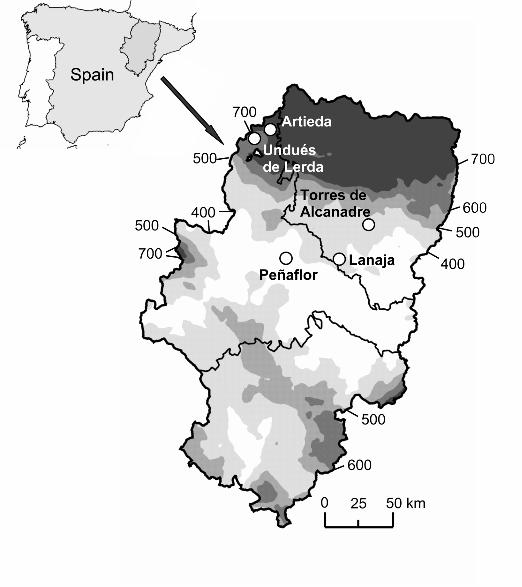
The study was based on six long-term NT fields (9 - 21 yr) representative of the different 94
scenarios of NT in Aragon and located in areas receiving between 350 and 740 mm mean 95
annual rainfall (Table 1 and Figure 1). These fields were selected from a previous study 96
where 22 soils under NT were characterized across different rainfed cereal areas in the region 97
(Lopez et al., 2012). With the exception of the Peñaflor site, the study was carried out under 98
on-farm conditions using fields of collaborating farmers where pairs of adjacent fields under 99
NT and conventional tillage (CT) were compared. In Peñaflor, the study used research plots 100
from a long-term tillage experiment at the dryland research farm of the Estación Experimental 101
de Aula Dei (Consejo Superior de Investigaciones Científicas). In this case, tillage treatments 102
(NT, CT and reduced tillage, RT) were arranged in a randomized complete block design with 103
3 replicates. In all sites, an undisturbed soil under native vegetation (NAT) and close to the 104
NT and CT fields was included in the study for comparative purposes. 105
Information on location and soil management characteristics for each site are shown in 106
Table 1 and detailed in a previous study (Blanco-Moure et al., 2012). The site at Artieda has 107
the highest rainfall and hence highest agricultural production. A common practice in the area 108
is for farmers to remove the straw from NT and CT fields to prevent later problems with 109
seeding. The information in Table 1 reflects the diversity of cropping systems and 110
conservation agriculture in the region (López et al., 2012). Therefore, the results from the 111
present study provide data on the effect of NT- and CT-based cropping systems on SOC 112
rather than on tillage alone. 113
The soils were medium-textured (sandy loam to silty clay loam), alkaline (pH>8; CaCO3 114
contents of 60-560 g kg-1) and generally low in OC (<20 g kg-1) (Table 2). At each site, both 115
NT and CT fields were contiguous and the NAT soil close to them, thus ensuring that soil 116
Long-term no tillage effects on POM and Min
6
type and topography were as similar as possible. All fields were nearly level with the 117
exception of those of Torres de Alcanadre (hereafter, Torres) where there was a slight slope 118
(3-4%). 119
120
Soil sampling and analyses 121
Soil samples for OC analysis were collected at three depths (0-5, 5-20 and 20-40 cm) and 122
from three different zones within each field (NT, CT and NAT) where two samples per depth 123
were collected and mixed to form a composite sample. At the Peñaflor site, each of the 124
composite samples came from each of the 3 tillage plots per treatment. Thus, a total of 27 125
composite samples were obtained from each site (36 in Peñaflor) (3 or 4 treatments x 3 depths 126
x 3 replicates). Six undisturbed soil samples were also taken per depth and field (2 in each of 127
the 3 sampling zones per field) to determine the dry bulk density by the core method. The 128
study was over two growing seasons (2009-2010 and 2010-2011), with sampling done in 129
similar periods. Thus, at the sites where there was continuous cropping, sampling was after 130
planting during the fallow period and at the fields under the cereal-fallow rotation during the 131
early fallow phase after the cereal harvest in June. At each site all soil samples were collected 132
on the same day. 133
In the lab visible roots and organic debris were removed by hand and then air-dry soil (<2 134
mm) from each depth, field and site, was physically fractionated following the Cambardella 135
& Elliot (1992) procedure. With this method using soil dispersion and sieving, particulate 136
organic matter (POM, >53 µm) and mineral-associated organic matter (Min, <53 µm) were 137
isolated. 138
The OC concentration in both SOM fractions was determined by dry combustion with a 139
LECO analyser (RC-612 model). Total SOC content was calculated as the sum of the POM-C 140
and Min-C contents and expressed on a mass per unit area basis by multiplying the OC 141
Blanco-Moure et al.
7
concentration value by the corresponding soil bulk density. Soil particle size was obtained by 142
laser diffraction analysis (Coulter LS230), CaCO3 content by dry combustion with the LECO 143
analyser, and electrical conductivity (EC), pH and gypsum content by standard methods. 144
145
Statistical analyses 146
Since the study was conducted under farm conditions, the NT, CT, and NAT treatments were 147
not field replicated. However, in each of the sites, the fields were contiguous and sited on 148
similar landscape positions and soil. Therefore, the three sampling locations within each field 149
were used as pseudoreplicates and statistical comparisons among treatments were made using 150
one-way ANOVA assuming a randomized experiment (Christopher et al., 2009). In the case 151
of the Peñaflor site, the randomized complete block design with three replicates per tillage 152
treatment was also applied and statistical results were compared with those obtained from the 153
pseudoreplicate analysis. Treatments means were compared by the Duncan's multiple range 154
test (P<0.05). When data showed non-normality, transformations were made and ANOVA 155
conducted with the transformed data. Computations were performed using SPSS 19.0 156
statistical software. 157
158
Results and discussion 159
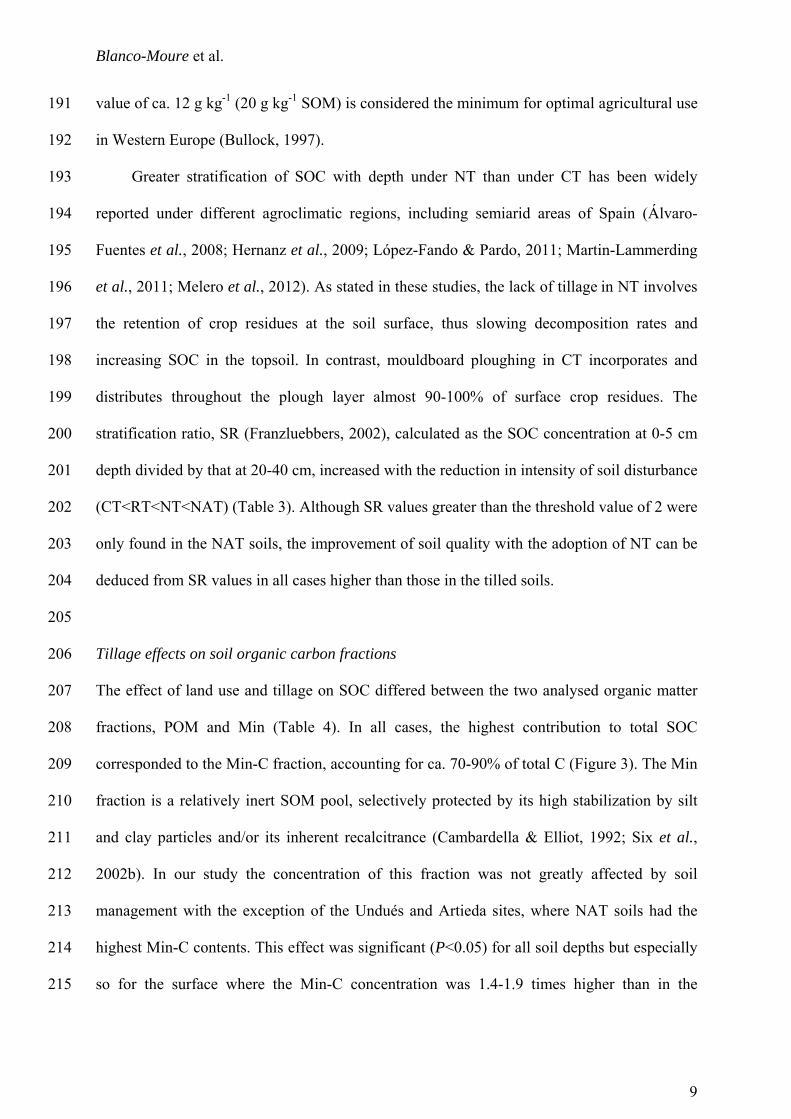
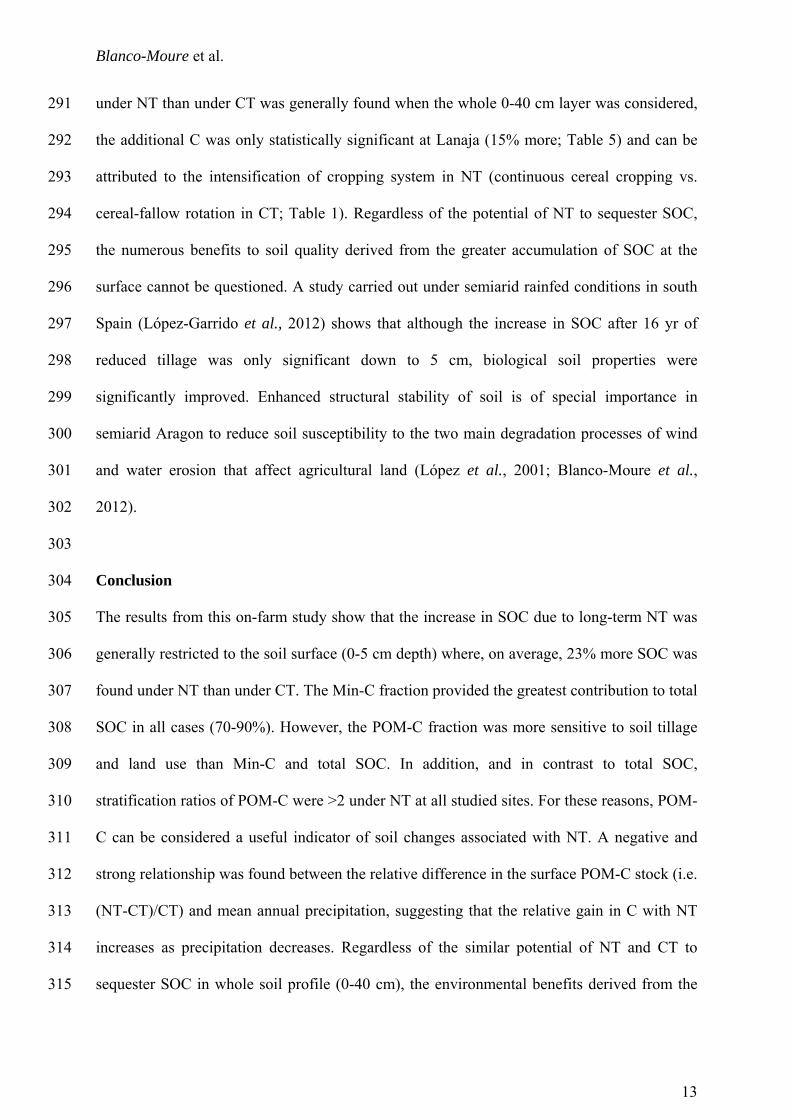
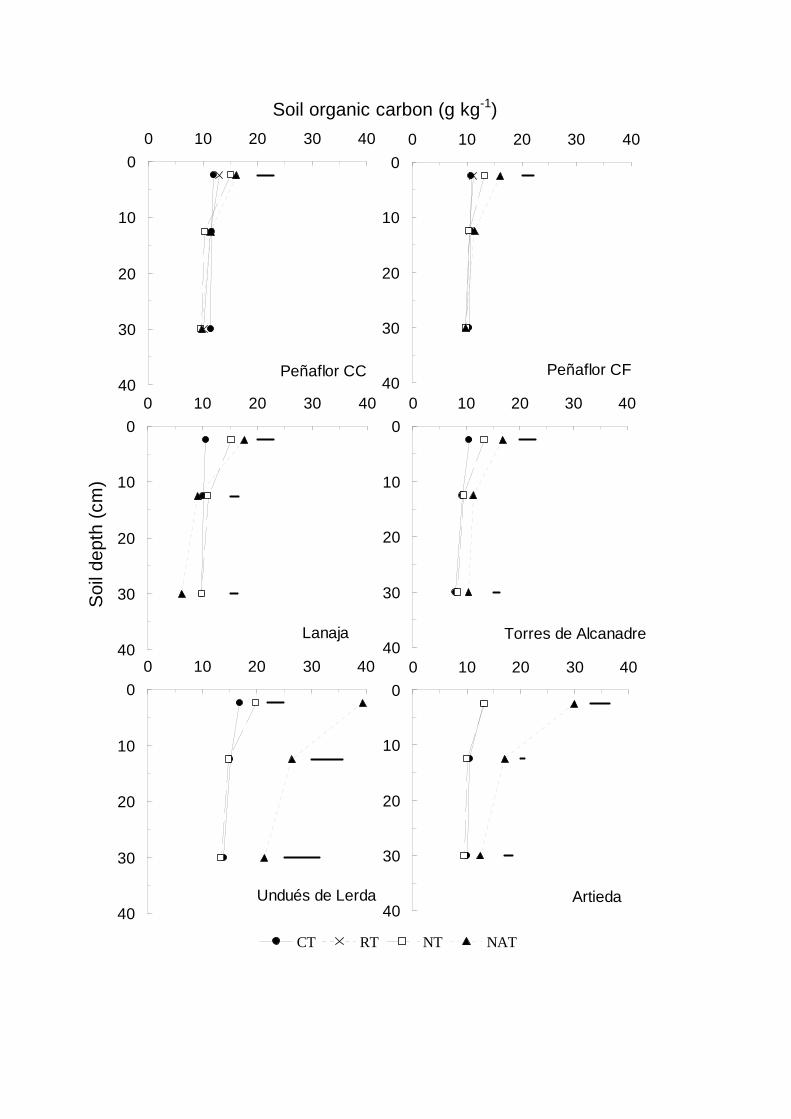
Tillage effects on total soil organic carbon 160
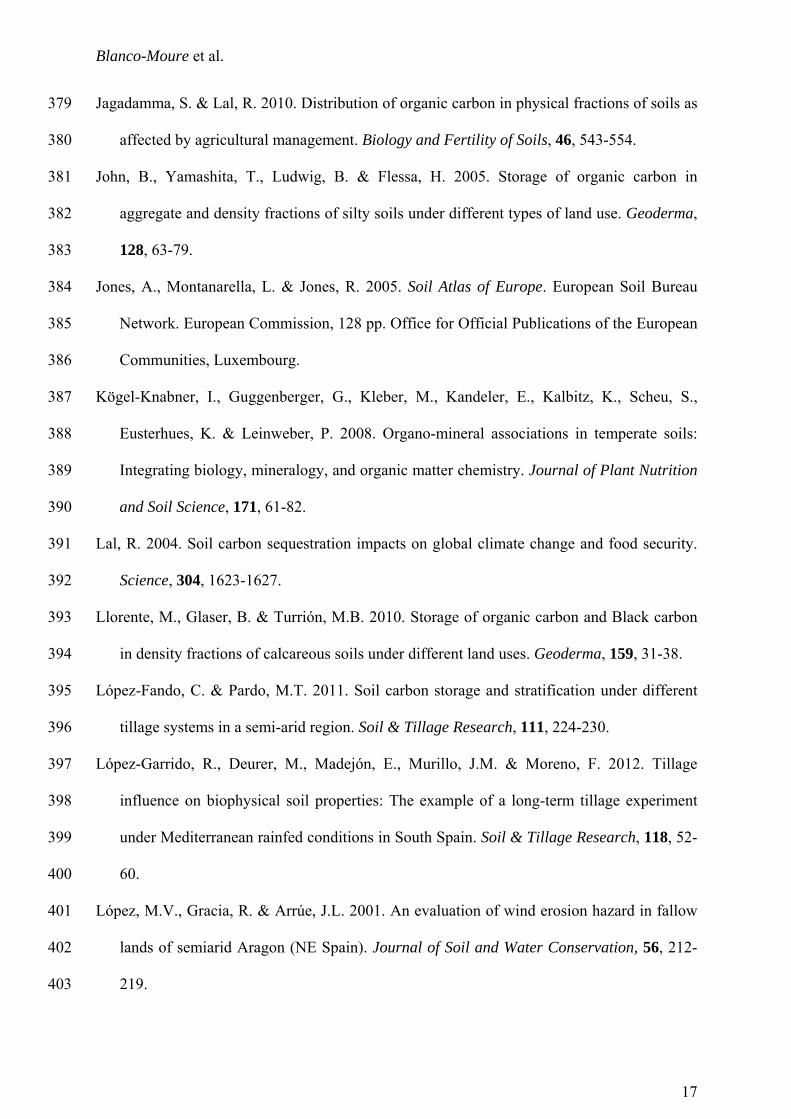
With the exception of the NAT soil of Undués and Artieda, total SOC contents in the 0-40 cm 161
layer were <20 g kg-1 (Figure 2), in agreement with SOC as estimated for this region in the 162
Map of Topsoil Organic Carbon in Europe (Jones et al., 2005). Although this range is less 163
than for other European regions, it corresponds well to estimated data for Southern Europe 164
where 74% of the land has a surface soil horizon (0-30 cm) with <20 g kg-1 of organic C 165
(Van-Camp et al., 2004). 166
Long-term no tillage effects on POM and Min
8
At the most humid sites (Artieda and Undués) the greatest SOC contents were in the NAT 167
soils, and in the driest ones they were similar (1 and 7% more in NAT at Peñaflor CF and 168
Peñaflor CC, respectively) or even less than those in the agricultural soils (nearly 20% less at 169
Lanaja). These relatively small SOC contents of the NAT soils in the driest areas are due to 170
these fields often being in the marginal lands and are not suitable for crop production due to 171
limited depth or excessive stoniness. In the case of the Lanaja site, the lowest SOC 172
concentration of the NAT field is due to their semi-natural conditions since it is 173
in an abandoned agricultural terrace (>40 yr) that is frequently grazed by livestock (Table 1). 174
From a comprehensive database on Spanish grassland and agricultural soils, Romanyà & 175
Rovira (2011) also found greater differences in SOC concentration between grassland and 176
arable areas as the climate became wetter. 177
For cultivated soils, SOC was significantly affected by tillage only in the first 5 cm of soil 178
with the highest concentrations found generally in NT (Figure 2). The magnitude of this 179
increase with respect to CT varied considerably between sites, ranging from only 1.5% at 180
Artieda to 43% at Lanaja. At the other sites, this increase varied between 18 and 28%. Below 181
5 cm depth, SOC concentrations under NT decreased considerably (22-38%) up to values 182
similar to those under CT or slightly lower (Figure 2). Thus, the greater SOC at the soil 183
surface in NT was offset by the lower concentration at depth, so that the average SOC 184
concentration in the 0-40 cm profile was not significantly different from that of CT. At 185
Artieda, the lack of difference between tillage systems even in the top layer (Figure 2) can be 186
explained by the farmer’s practice of removing crop residues from the NT field (Table 1); this 187
negated the expected increase in SOC associated with conservation tillage. SOC contents 188
under NT were nearly or greater than 12 g kg-1 in the 0-20 cm depth. Although there is no 189
clear evidence of a unique threshold/critical level in SOC (Loveland & Webb, 2003), the 190
Blanco-Moure et al.
9
value of ca. 12 g kg-1 (20 g kg-1 SOM) is considered the minimum for optimal agricultural use 191
in Western Europe (Bullock, 1997). 192
Greater stratification of SOC with depth under NT than under CT has been widely 193
reported under different agroclimatic regions, including semiarid areas of Spain (Álvaro-194
Fuentes et al., 2008; Hernanz et al., 2009; López-Fando & Pardo, 2011; Martin-Lammerding 195
et al., 2011; Melero et al., 2012). As stated in these studies, the lack of tillage in NT involves 196
the retention of crop residues at the soil surface, thus slowing decomposition rates and 197
increasing SOC in the topsoil. In contrast, mouldboard ploughing in CT incorporates and 198
distributes throughout the plough layer almost 90-100% of surface crop residues. The 199
stratification ratio, SR (Franzluebbers, 2002), calculated as the SOC concentration at 0-5 cm 200
depth divided by that at 20-40 cm, increased with the reduction in intensity of soil disturbance 201
(CT<RT<NT<NAT) (Table 3). Although SR values greater than the threshold value of 2 were 202
only found in the NAT soils, the improvement of soil quality with the adoption of NT can be 203
deduced from SR values in all cases higher than those in the tilled soils. 204
205
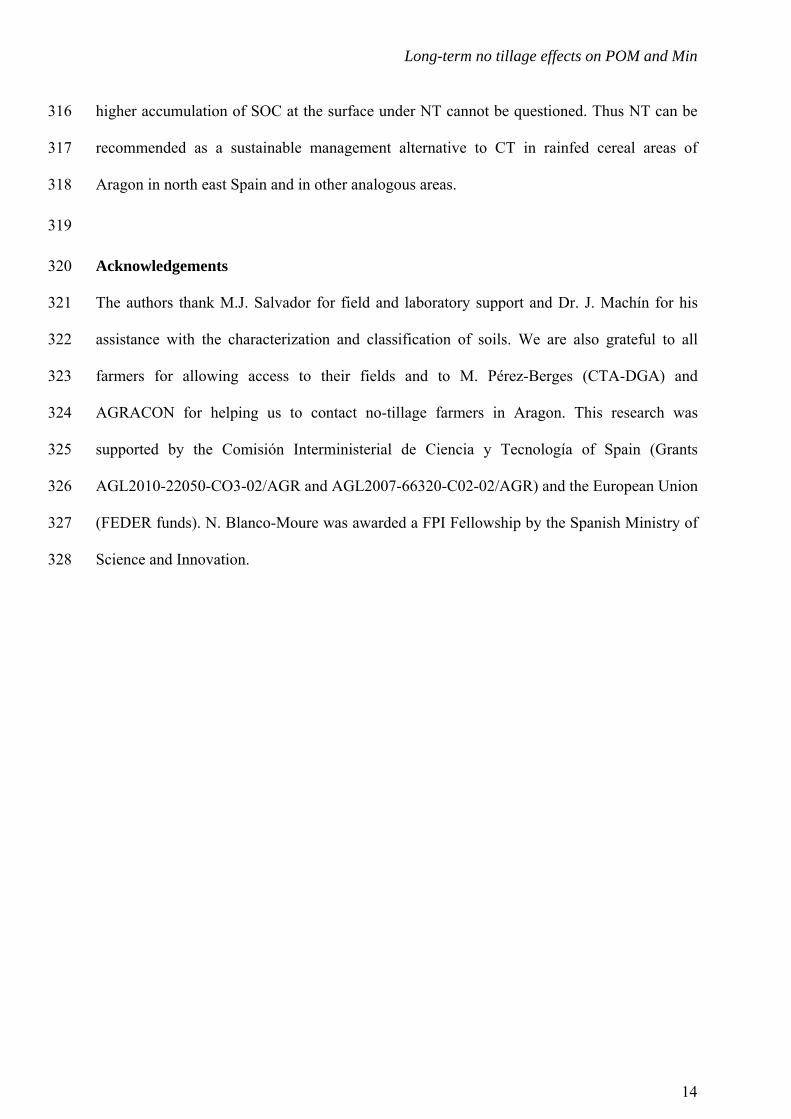
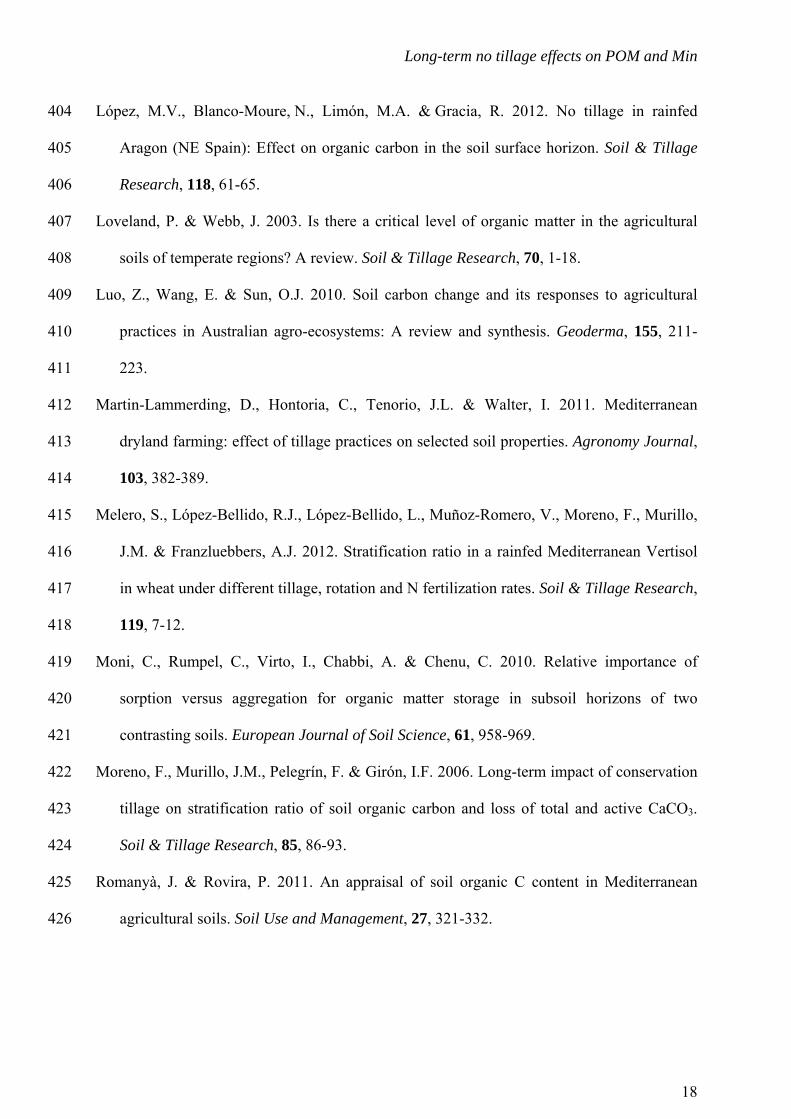
Tillage effects on soil organic carbon fractions 206
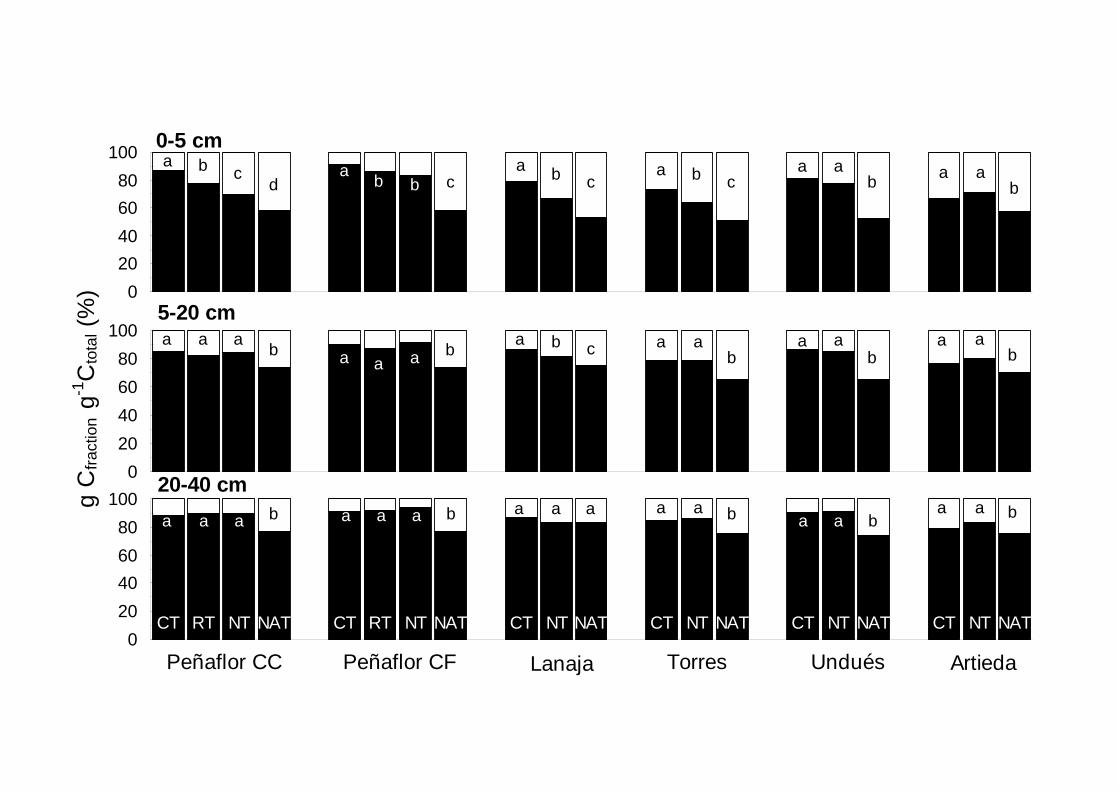
The effect of land use and tillage on SOC differed between the two analysed organic matter 207
fractions, POM and Min (Table 4). In all cases, the highest contribution to total SOC 208
corresponded to the Min-C fraction, accounting for ca. 70-90% of total C (Figure 3). The Min 209
fraction is a relatively inert SOM pool, selectively protected by its high stabilization by silt 210
and clay particles and/or its inherent recalcitrance (Cambardella & Elliot, 1992; Six et al., 211
2002b). In our study the concentration of this fraction was not greatly affected by soil 212
management with the exception of the Undués and Artieda sites, where NAT soils had the 213
highest Min-C contents. This effect was significant (P<0.05) for all soil depths but especially 214
so for the surface where the Min-C concentration was 1.4-1.9 times higher than in the 215
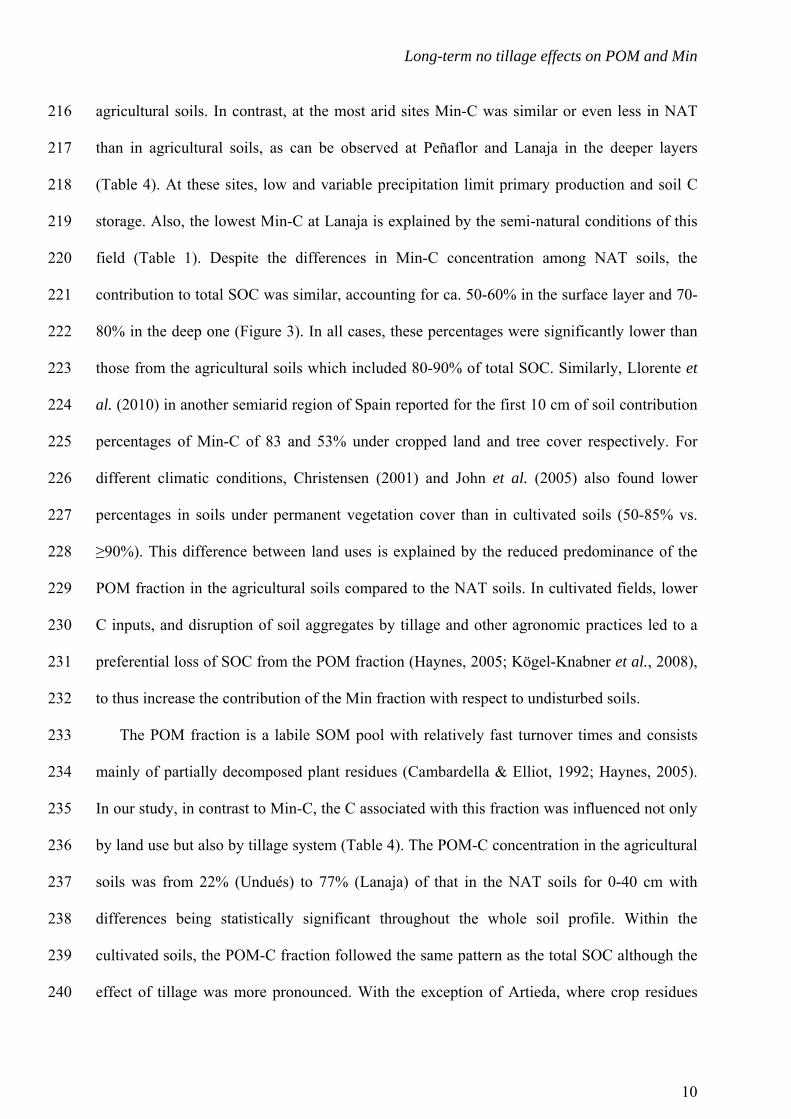
Long-term no tillage effects on POM and Min
10
agricultural soils. In contrast, at the most arid sites Min-C was similar or even less in NAT 216
than in agricultural soils, as can be observed at Peñaflor and Lanaja in the deeper layers 217
(Table 4). At these sites, low and variable precipitation limit primary production and soil C 218
storage. Also, the lowest Min-C at Lanaja is explained by the semi-natural conditions of this 219
field (Table 1). Despite the differences in Min-C concentration among NAT soils, the 220
contribution to total SOC was similar, accounting for ca. 50-60% in the surface layer and 70-221
80% in the deep one (Figure 3). In all cases, these percentages were significantly lower than 222
those from the agricultural soils which included 80-90% of total SOC. Similarly, Llorente et 223
al. (2010) in another semiarid region of Spain reported for the first 10 cm of soil contribution 224
percentages of Min-C of 83 and 53% under cropped land and tree cover respectively. For 225
different climatic conditions, Christensen (2001) and John et al. (2005) also found lower 226
percentages in soils under permanent vegetation cover than in cultivated soils (50-85% vs. 227
≥90%). This difference between land uses is explained by the reduced predominance of the 228
POM fraction in the agricultural soils compared to the NAT soils. In cultivated fields, lower 229
C inputs, and disruption of soil aggregates by tillage and other agronomic practices led to a 230
preferential loss of SOC from the POM fraction (Haynes, 2005; Kögel-Knabner et al., 2008), 231
to thus increase the contribution of the Min fraction with respect to undisturbed soils. 232
The POM fraction is a labile SOM pool with relatively fast turnover times and consists 233
mainly of partially decomposed plant residues (Cambardella & Elliot, 1992; Haynes, 2005). 234
In our study, in contrast to Min-C, the C associated with this fraction was influenced not only 235
by land use but also by tillage system (Table 4). The POM-C concentration in the agricultural 236
soils was from 22% (Undués) to 77% (Lanaja) of that in the NAT soils for 0-40 cm with 237
differences being statistically significant throughout the whole soil profile. Within the 238
cultivated soils, the POM-C fraction followed the same pattern as the total SOC although the 239
effect of tillage was more pronounced. With the exception of Artieda, where crop residues 240
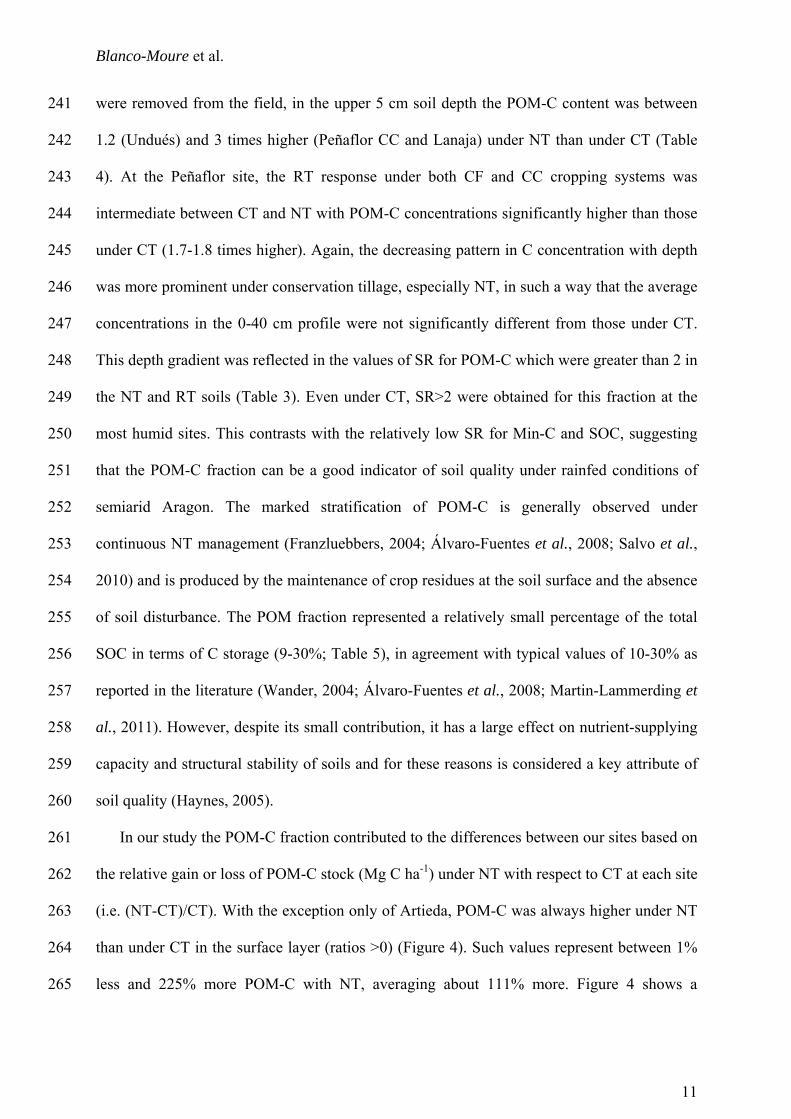
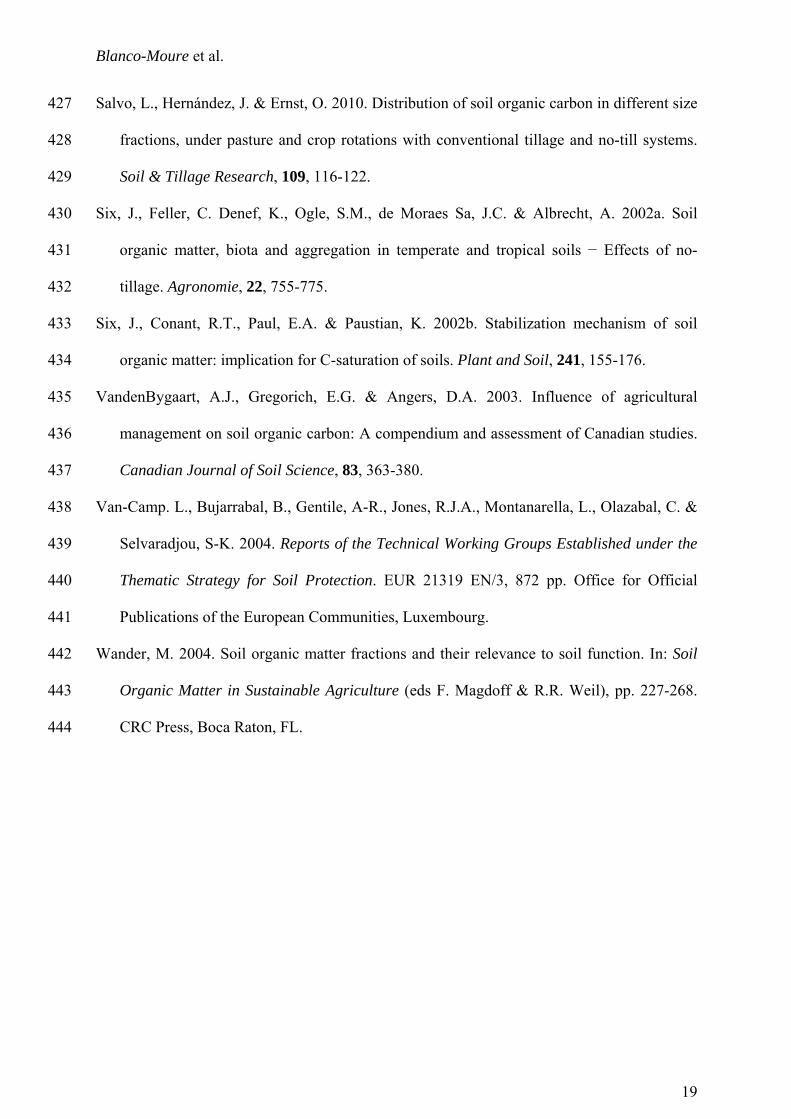
Blanco-Moure et al.
11
were removed from the field, in the upper 5 cm soil depth the POM-C content was between 241
1.2 (Undués) and 3 times higher (Peñaflor CC and Lanaja) under NT than under CT (Table 242
4). At the Peñaflor site, the RT response under both CF and CC cropping systems was 243
intermediate between CT and NT with POM-C concentrations significantly higher than those 244
under CT (1.7-1.8 times higher). Again, the decreasing pattern in C concentration with depth 245
was more prominent under conservation tillage, especially NT, in such a way that the average 246
concentrations in the 0-40 cm profile were not significantly different from those under CT. 247
This depth gradient was reflected in the values of SR for POM-C which were greater than 2 in 248
the NT and RT soils (Table 3). Even under CT, SR>2 were obtained for this fraction at the 249
most humid sites. This contrasts with the relatively low SR for Min-C and SOC, suggesting 250
that the POM-C fraction can be a good indicator of soil quality under rainfed conditions of 251
semiarid Aragon. The marked stratification of POM-C is generally observed under 252
continuous NT management (Franzluebbers, 2004; Álvaro-Fuentes et al., 2008; Salvo et al., 253
2010) and is produced by the maintenance of crop residues at the soil surface and the absence 254
of soil disturbance. The POM fraction represented a relatively small percentage of the total 255
SOC in terms of C storage (9-30%; Table 5), in agreement with typical values of 10-30% as 256
reported in the literature (Wander, 2004; Álvaro-Fuentes et al., 2008; Martin-Lammerding et 257
al., 2011). However, despite its small contribution, it has a large effect on nutrient-supplying 258
capacity and structural stability of soils and for these reasons is considered a key attribute of 259
soil quality (Haynes, 2005). 260
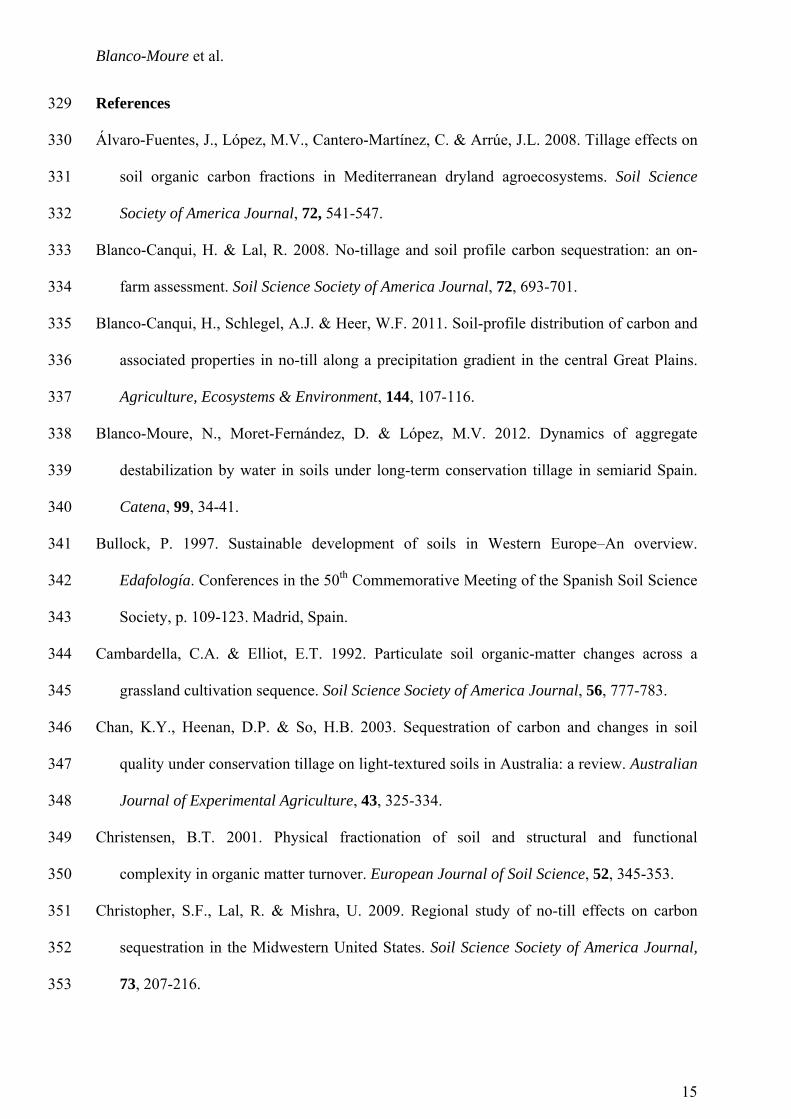
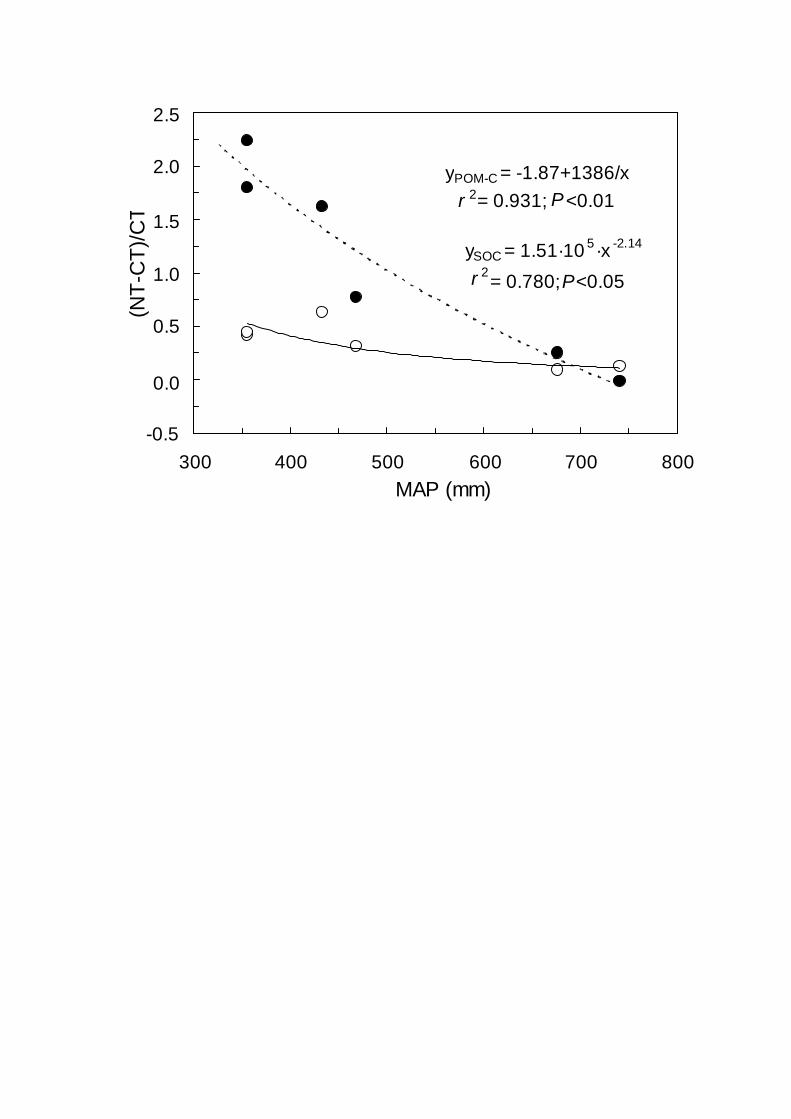
In our study the POM-C fraction contributed to the differences between our sites based on 261
the relative gain or loss of POM-C stock (Mg C ha-1) under NT with respect to CT at each site 262
(i.e. (NT-CT)/CT). With the exception only of Artieda, POM-C was always higher under NT 263
than under CT in the surface layer (ratios >0) (Figure 4). Such values represent between 1% 264
less and 225% more POM-C with NT, averaging about 111% more. Figure 4 shows a 265
Long-term no tillage effects on POM and Min
12
negative and strong relationship (P<0.01) between the relative difference in POM-C stock at 266
0-5 cm depth and the mean annual precipitation at each site and indicates that the relative 267
gain of C with the adoption of NT decreases as precipitation increases. A significant 268
relationship was also obtained for total SOC but this property was not as responsive to 269
precipitation as POM-C (Figure 4). For the Min-C fraction, no significant influence of 270
precipitation was observed at any of the soil depths. Although climatic factors such as 271
precipitation have been shown to exert a control on the potential of NT to store SOC, the 272
direction and magnitude of this potential with respect to CT systems can vary widely 273
(VandenBygaart et al., 2003; Franzluebbers, 2004; Govaerts et al., 2009; Blanco-Canqui et 274
al., 2011). The increase in the relative benefit of NT with reduction in precipitation is also 275
reported by Gregorich et al. (2009) who compare SOC storage in different Canadian regions. 276
Similar conclusions are made by Luo et al. (2010) for agricultural soils in Australia. In these 277
studies the authors suggest that compared to low rainfall areas, the faster decomposition of 278
SOM in the surface layer under a more humid environment minimizes the overall change of 279
SOC balance between input and output under NT and, therefore, the relative C gain with 280
respect to CT. 281
In a similar way to previous studies, the differences between treatments in C storage at the 282
soil surface are reduced when the whole soil profile (0-40 cm) is considered (Table 5). The 283
depth of soil sampling can greatly affect conclusions on SOC sequestration rates (Blanco-284
Canqui & Lal, 2008; Christopher et al., 2009). At the most arid sites, Peñaflor and Lanaja, C 285
stocks in the NAT soils were similar or even lower than those in cultivated soils, supporting 286
the idea that native SOC levels do not necessarily represent the upper limit for SOC storage 287
and can be exceeded by those under agricultural management (Six et al., 2002b; 288
VandenBygaart et al., 2003). In contrast, in the more humid areas, C stocks were enhanced in 289
the NAT soils (Table 5). Within the cultivated soils, although a trend of higher SOC stored 290
Blanco-Moure et al.
13
under NT than under CT was generally found when the whole 0-40 cm layer was considered, 291
the additional C was only statistically significant at Lanaja (15% more; Table 5) and can be 292
attributed to the intensification of cropping system in NT (continuous cereal cropping vs. 293
cereal-fallow rotation in CT; Table 1). Regardless of the potential of NT to sequester SOC, 294
the numerous benefits to soil quality derived from the greater accumulation of SOC at the 295
surface cannot be questioned. A study carried out under semiarid rainfed conditions in south 296
Spain (López-Garrido et al., 2012) shows that although the increase in SOC after 16 yr of 297
reduced tillage was only significant down to 5 cm, biological soil properties were 298
significantly improved. Enhanced structural stability of soil is of special importance in 299
semiarid Aragon to reduce soil susceptibility to the two main degradation processes of wind 300
and water erosion that affect agricultural land (López et al., 2001; Blanco-Moure et al., 301
2012). 302
303
Conclusion 304
The results from this on-farm study show that the increase in SOC due to long-term NT was 305
generally restricted to the soil surface (0-5 cm depth) where, on average, 23% more SOC was 306
found under NT than under CT. The Min-C fraction provided the greatest contribution to total 307
SOC in all cases (70-90%). However, the POM-C fraction was more sensitive to soil tillage 308
and land use than Min-C and total SOC. In addition, and in contrast to total SOC, 309
stratification ratios of POM-C were >2 under NT at all studied sites. For these reasons, POM-310
C can be considered a useful indicator of soil changes associated with NT. A negative and 311
strong relationship was found between the relative difference in the surface POM-C stock (i.e. 312
(NT-CT)/CT) and mean annual precipitation, suggesting that the relative gain in C with NT 313
increases as precipitation decreases. Regardless of the similar potential of NT and CT to 314
sequester SOC in whole soil profile (0-40 cm), the environmental benefits derived from the 315
Long-term no tillage effects on POM and Min
14
higher accumulation of SOC at the surface under NT cannot be questioned. Thus NT can be 316
recommended as a sustainable management alternative to CT in rainfed cereal areas of 317
Aragon in north east Spain and in other analogous areas. 318
319
Acknowledgements 320
The authors thank M.J. Salvador for field and laboratory support and Dr. J. Machín for his 321
assistance with the characterization and classification of soils. We are also grateful to all 322
farmers for allowing access to their fields and to M. Pérez-Berges (CTA-DGA) and 323
AGRACON for helping us to contact no-tillage farmers in Aragon. This research was 324
supported by the Comisión Interministerial de Ciencia y Tecnología of Spain (Grants 325
AGL2010-22050-CO3-02/AGR and AGL2007-66320-C02-02/AGR) and the European Union 326
(FEDER funds). N. Blanco-Moure was awarded a FPI Fellowship by the Spanish Ministry of 327
Science and Innovation. 328
Blanco-Moure et al.
15
References 329
Álvaro-Fuentes, J., López, M.V., Cantero-Martínez, C. & Arrúe, J.L. 2008. Tillage effects on 330
soil organic carbon fractions in Mediterranean dryland agroecosystems. Soil Science 331
Society of America Journal, 72, 541-547. 332
Blanco-Canqui, H. & Lal, R. 2008. No-tillage and soil profile carbon sequestration: an on-333
farm assessment. Soil Science Society of America Journal, 72, 693-701. 334
Blanco-Canqui, H., Schlegel, A.J. & Heer, W.F. 2011. Soil-profile distribution of carbon and 335
associated properties in no-till along a precipitation gradient in the central Great Plains. 336
Agriculture, Ecosystems & Environment, 144, 107-116. 337
Blanco-Moure, N., Moret-Fernández, D. & López, M.V. 2012. Dynamics of aggregate 338
destabilization by water in soils under long-term conservation tillage in semiarid Spain. 339
Catena, 99, 34-41. 340
Bullock, P. 1997. Sustainable development of soils in Western Europe–An overview. 341
Edafología. Conferences in the 50th Commemorative Meeting of the Spanish Soil Science 342
Society, p. 109-123. Madrid, Spain. 343
Cambardella, C.A. & Elliot, E.T. 1992. Particulate soil organic-matter changes across a 344
grassland cultivation sequence. Soil Science Society of America Journal, 56, 777-783. 345
Chan, K.Y., Heenan, D.P. & So, H.B. 2003. Sequestration of carbon and changes in soil 346
quality under conservation tillage on light-textured soils in Australia: a review. Australian 347
Journal of Experimental Agriculture, 43, 325-334. 348
Christensen, B.T. 2001. Physical fractionation of soil and structural and functional 349
complexity in organic matter turnover. European Journal of Soil Science, 52, 345-353. 350
Christopher, S.F., Lal, R. & Mishra, U. 2009. Regional study of no-till effects on carbon 351
sequestration in the Midwestern United States. Soil Science Society of America Journal, 352
73, 207-216. 353
Long-term no tillage effects on POM and Min
16
Derpsch, R. & Friedrich, T. 2010. Sustainable crop production intensification -The adoption 354
of conservation agriculture worldwide-. In: Proceedings of the 16th ISCO Conference, pp. 355
265-293. Santiago, Chile. http://www.rolf-derpsch.com/sustainablecropproduction.pdf 356
(consulted in November 2012). 357
European Commission. 2006. Thematic Strategy for Soil Protection. Communication 358
(COM(2006) 231), EU Brussels. http://ec.europa.eu/environment/soil/three_en.htm 359
(consulted in November 2012). 360
Franzluebbers, A.J. 2002. Soil organic matter stratification ratio as an indicator of soil 361
quality. Soil & Tillage Research, 66, 95-106. 362
Franzluebbers, A.J. 2004. Tillage and residue management effects on soil organic matter. In: 363
Soil Organic Matter in Sustainable Agriculture (eds F. Magdoff & R.R. Weil), pp. 227-364
268. CRC Press, Boca Raton, FL. 365
García-Ruiz, J.M. 2010. The effects of land uses on soil erosion in Spain: a review. Catena, 366
81, 1-11. 367
Gregorich, E.G., Carter, M.R., Angers, D.A. & Drury, C.F. 2009. Using a sequential density 368
and particle-size fractionation to evaluate carbon and nitrogen storage in the profile of 369
tilled and no-till soils in eastern Canada. Canadian Journal of Soil Science, 89, 255-267. 370
Govaerts, B., Verhulst, N., Castellanos-Navarrete, A., Sayre, K.D., Dixon, J. & Dendooven, 371
L. 2009. Conservation agriculture and soil carbon sequestration: between myth and farmer 372
reality. Critical Reviews in Plant Sciences, 28, 97-122. 373
Haynes, R.J. 2005. Labile organic matter fractions as central components of the quality of 374
agricultural soils: an overview. Advances in Agronomy, 85, 221-268. 375
Hernanz, J.L., Sánchez-Girón, V. & Navarrete, L. 2009. Soil carbon sequestration and 376
stratification in a cereal/leguminous crop rotation with three tillage systems in semiarid 377
conditions. Agriculture, Ecosystems & Environment, 133, 114-122. 378
Blanco-Moure et al.
17
Jagadamma, S. & Lal, R. 2010. Distribution of organic carbon in physical fractions of soils as 379
affected by agricultural management. Biology and Fertility of Soils, 46, 543-554. 380
John, B., Yamashita, T., Ludwig, B. & Flessa, H. 2005. Storage of organic carbon in 381
aggregate and density fractions of silty soils under different types of land use. Geoderma, 382
128, 63-79. 383
Jones, A., Montanarella, L. & Jones, R. 2005. Soil Atlas of Europe. European Soil Bureau 384
Network. European Commission, 128 pp. Office for Official Publications of the European 385
Communities, Luxembourg. 386
Kögel-Knabner, I., Guggenberger, G., Kleber, M., Kandeler, E., Kalbitz, K., Scheu, S., 387
Eusterhues, K. & Leinweber, P. 2008. Organo-mineral associations in temperate soils: 388
Integrating biology, mineralogy, and organic matter chemistry. Journal of Plant Nutrition 389
and Soil Science, 171, 61-82. 390
Lal, R. 2004. Soil carbon sequestration impacts on global climate change and food security. 391
Science, 304, 1623-1627. 392
Llorente, M., Glaser, B. & Turrión, M.B. 2010. Storage of organic carbon and Black carbon 393
in density fractions of calcareous soils under different land uses. Geoderma, 159, 31-38. 394
López-Fando, C. & Pardo, M.T. 2011. Soil carbon storage and stratification under different 395
tillage systems in a semi-arid region. Soil & Tillage Research, 111, 224-230. 396
López-Garrido, R., Deurer, M., Madejón, E., Murillo, J.M. & Moreno, F. 2012. Tillage 397
influence on biophysical soil properties: The example of a long-term tillage experiment 398
under Mediterranean rainfed conditions in South Spain. Soil & Tillage Research, 118, 52-399
60. 400
López, M.V., Gracia, R. & Arrúe, J.L. 2001. An evaluation of wind erosion hazard in fallow 401
lands of semiarid Aragon (NE Spain). Journal of Soil and Water Conservation, 56, 212-402
219. 403
Long-term no tillage effects on POM and Min
18
López, M.V., Blanco-Moure, N., Limón, M.A. & Gracia, R. 2012. No tillage in rainfed 404
Aragon (NE Spain): Effect on organic carbon in the soil surface horizon. Soil & Tillage 405
Research, 118, 61-65. 406
Loveland, P. & Webb, J. 2003. Is there a critical level of organic matter in the agricultural 407
soils of temperate regions? A review. Soil & Tillage Research, 70, 1-18. 408
Luo, Z., Wang, E. & Sun, O.J. 2010. Soil carbon change and its responses to agricultural 409
practices in Australian agro-ecosystems: A review and synthesis. Geoderma, 155, 211-410
223. 411
Martin-Lammerding, D., Hontoria, C., Tenorio, J.L. & Walter, I. 2011. Mediterranean 412
dryland farming: effect of tillage practices on selected soil properties. Agronomy Journal, 413
103, 382-389. 414
Melero, S., López-Bellido, R.J., López-Bellido, L., Muñoz-Romero, V., Moreno, F., Murillo, 415
J.M. & Franzluebbers, A.J. 2012. Stratification ratio in a rainfed Mediterranean Vertisol 416
in wheat under different tillage, rotation and N fertilization rates. Soil & Tillage Research, 417
119, 7-12. 418
Moni, C., Rumpel, C., Virto, I., Chabbi, A. & Chenu, C. 2010. Relative importance of 419
sorption versus aggregation for organic matter storage in subsoil horizons of two 420
contrasting soils. European Journal of Soil Science, 61, 958-969. 421
Moreno, F., Murillo, J.M., Pelegrín, F. & Girón, I.F. 2006. Long-term impact of conservation 422
tillage on stratification ratio of soil organic carbon and loss of total and active CaCO3. 423
Soil & Tillage Research, 85, 86-93. 424
Romanyà, J. & Rovira, P. 2011. An appraisal of soil organic C content in Mediterranean 425
agricultural soils. Soil Use and Management, 27, 321-332. 426
Blanco-Moure et al.
19
Salvo, L., Hernández, J. & Ernst, O. 2010. Distribution of soil organic carbon in different size 427
fractions, under pasture and crop rotations with conventional tillage and no-till systems. 428
Soil & Tillage Research, 109, 116-122. 429
Six, J., Feller, C. Denef, K., Ogle, S.M., de Moraes Sa, J.C. & Albrecht, A. 2002a. Soil 430
organic matter, biota and aggregation in temperate and tropical soils − Effects of no-431
tillage. Agronomie, 22, 755-775. 432
Six, J., Conant, R.T., Paul, E.A. & Paustian, K. 2002b. Stabilization mechanism of soil 433
organic matter: implication for C-saturation of soils. Plant and Soil, 241, 155-176. 434
VandenBygaart, A.J., Gregorich, E.G. & Angers, D.A. 2003. Influence of agricultural 435
management on soil organic carbon: A compendium and assessment of Canadian studies. 436
Canadian Journal of Soil Science, 83, 363-380. 437
Van-Camp. L., Bujarrabal, B., Gentile, A-R., Jones, R.J.A., Montanarella, L., Olazabal, C. & 438
Selvaradjou, S-K. 2004. Reports of the Technical Working Groups Established under the 439
Thematic Strategy for Soil Protection. EUR 21319 EN/3, 872 pp. Office for Official 440
Publications of the European Communities, Luxembourg. 441
Wander, M. 2004. Soil organic matter fractions and their relevance to soil function. In: Soil 442
Organic Matter in Sustainable Agriculture (eds F. Magdoff & R.R. Weil), pp. 227-268. 443
CRC Press, Boca Raton, FL. 444
Long-term no tillage effects on POM and Min
20
Figure legends 445
Figure 1. Location of the study sites and average annual rainfall isohyets (mm). 446
447
Figure 2. Depth distribution of soil organic carbon concentration under different tillage and 448
management systems (CT, conventional tillage; RT, reduced tillage; NT, no tillage; NAT, 449
natural soil). In Peñaflor, CC refers to the continuous cropping system and CF to the 450
cereal-fallow rotation. Horizontal bars indicate LSD (P<0.05) for comparisons at the same 451
soil depth, where significant differences were found. 452
453
Figure 3. Relative proportion of particulate organic carbon (POM-C, □) and mineral-454
associated organic carbon (Min-C, ■) to total soil organic carbon (SOC) at different soil 455
depths as affected by soil management and tillage (CT, conventional tillage; RT, reduced 456
tillage; NT, no tillage; NAT, natural soil). In Peñaflor, CC refers to the continuous 457
cropping system and CF to the cereal-fallow rotation. For the same study site and soil 458
depth, different letters indicate significant differences at P<0.05. 459
460
Figure 4. Relative difference between no tillage (NT) and conventional tillage (CT) in total 461
soil organic carbon content (SOC, —○—; Mg ha-1) and particulate organic carbon content 462
(POM-C, ---●---) at 0-5 cm soil depth as a function of mean annual precipitation (MAP). 463
Peñaflor CC
0
10
20
30
0 10 20 30 40
40Peñaflor CF
0
10
20
30
0 10 20 30 40
40
Lanaja
0
10
20
30
40
0 10 20 30 40
Torres de Alcanadre
0 20 30 40
0
10
20
30
40
0 1
Undués de Lerda
10
20
30
40
0
0 10 20 30 40
Artieda
0
0 10 20 30 40
Soil organic carbon (g kg-1)
10
20
30
40
)m
h (c
Soi
l dep
t
CT RT NT NAT
0
20
40
60
80
100 a b cd
ab b c
a b ca b c b
a ab
a a
0
20
40
60
80
100 ab
a aa b
a aa b c b
a ab
a ab
a a
1
NATNTCTNATNTCTNATNTCTNATNT
Undués ArtiedaLanaja Torres
a a a ba aba a ba ag
Cfr
actio
n g
-
CTNATNTRTCTNATNTRTCT0
20
40
60
80
100
Peñaflor CC Peñaflor CF
a ba a a ba a
Cto
tal (
%)
0-5 cm
5-20 cm
20-40 cm
yPOM-C = -1.87+1386/x
r 2= 0.931; P<0.01
ySOC = 1.51·10 5 ·x -2.14
r 2= 0.780; P<0.05
-0.5
0.0
0.5
1.0
1.5
2.0
2.5
300 400 500 600 700 800
MAP (mm)
(NT
-CT
)/C
T
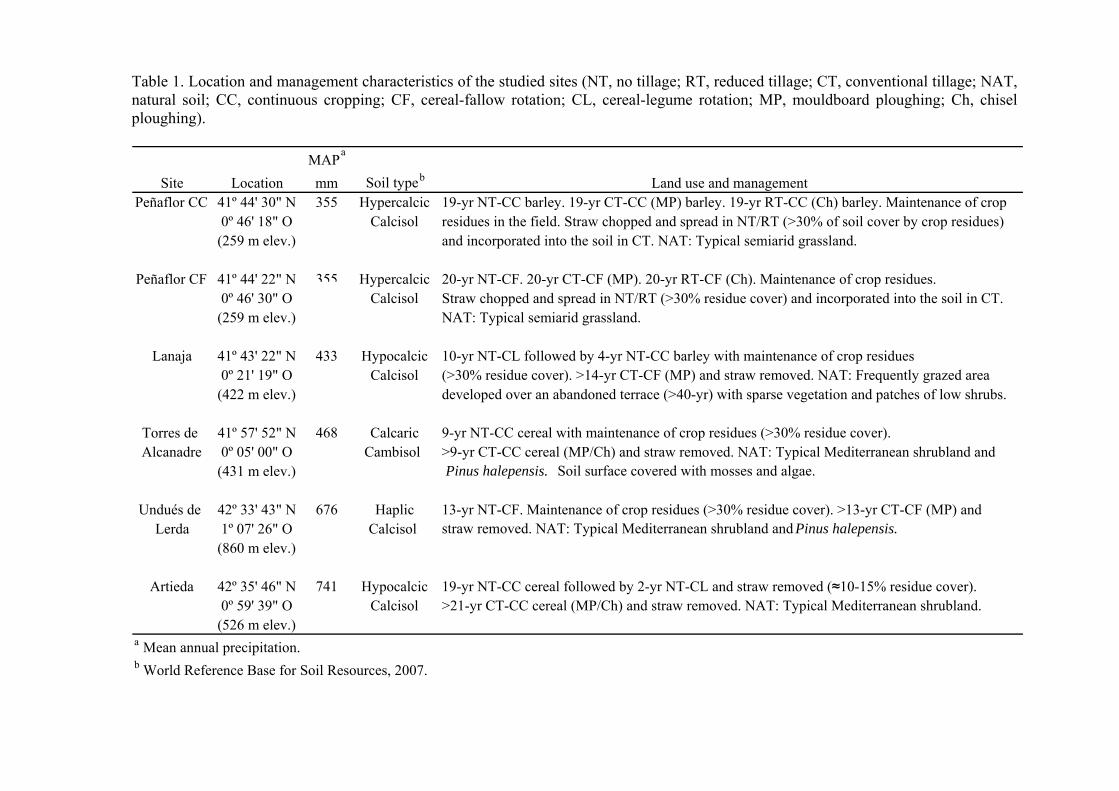
Table 1. Location and management characteristics of the studied sites (NT, no tillage; RT, reduced tillage; CT, conventional tillage; NAT, natural soil; CC, continuous cropping; CF, cereal-fallow rotation; CL, cereal-legume rotation; MP, mouldboard ploughing; Ch, chisel ploughing).
MAPa
Site Location mm Soil typeb Land use and managementPeñaflor CC 41º 44' 30" N 355 Hypercalcic 19-yr NT-CC barley. 19-yr CT-CC (MP) barley. 19-yr RT-CC (Ch) barley. Maintenance of crop
0º 46' 18" O Calcisol residues in the field. Straw chopped and spread in NT/RT (>30% of soil cover by crop residues) (259 m elev.) and incorporated into the soil in CT. NAT: Typical semiarid grassland.
Peñaflor CF 41º 44' 22" N 355 Hypercalcic 20-yr NT-CF. 20-yr CT-CF (MP). 20-yr RT-CF (Ch). Maintenance of crop residues. 0º 46' 30" O Calcisol Straw chopped and spread in NT/RT (>30% residue cover) and incorporated into the soil in CT.
(259 m elev.) NAT: Typical semiarid grassland.
Lanaja 41º 43' 22" N 433 Hypocalcic 10-yr NT-CL followed by 4-yr NT-CC barley with maintenance of crop residues 0º 21' 19" O Calcisol (>30% residue cover). >14-yr CT-CF (MP) and straw removed. NAT: Frequently grazed area
(422 m elev.) developed over an abandoned terrace (>40-yr) with sparse vegetation and patches of low shrubs.
Torres de 41º 57' 52" N 468 Calcaric 9-yr NT-CC cereal with maintenance of crop residues (>30% residue cover). Alcanadre 0º 05' 00" O Cambisol >9-yr CT-CC cereal (MP/Ch) and straw removed. NAT: Typical Mediterranean shrubland and
(431 m elev.) Pinus halepensis. Soil surface covered with mosses and algae.
Undués de 42º 33' 43" N 676 Haplic 13-yr NT-CF. Maintenance of crop residues (>30% residue cover). >13-yr CT-CF (MP) and Lerda 1º 07' 26" O Calcisol straw removed. NAT: Typical Mediterranean shrubland and Pinus halepensis.
(860 m elev.)
Artieda 42º 35' 46" N 741 Hypocalcic 19-yr NT-CC cereal followed by 2-yr NT-CL and straw removed (≈10-15% residue cover). 0º 59' 39" O Calcisol >21-yr CT-CC cereal (MP/Ch) and straw removed. NAT: Typical Mediterranean shrubland.
(526 m elev.) a Mean annual precipitation. b World Reference Base for Soil Resources, 2007.

Table 2. Selected properties of the studied soils in the 0-40 cm depth (CT, conventional tillage; RT, reduced tillage; NT, no tillage; NAT, natural soil). In Peñaflor, CC refers to the continuous cropping system and CF to the cereal-fallow rotation.
pH EC (1:5)a CO3Ca Gypsum Organic carbon Sand Silt Clay
Site Treatment (H2O, 1:2.5) dS m-1
Peñaflor CC CT 8.2 0.46 453 48 11.5 320 436 244RT 8.5 0.16 460 46 11.0 340 440 220NT 8.5 0.17 467 43 10.6 367 422 211
NAT 8.3 0.79 560 44 11.2 492 351 157
Peñaflor CF CT 8.4 0.18 471 46 10.6 333 433 234RT 8.4 0.16 482 46 10.2 316 445 239NT 8.4 0.18 485 47 10.5 318 445 237
NAT 8.3 0.79 560 44 11.2 492 351 157
Lanaja CT 8.3 0.31 439 34 10.0 117 600 283NT 8.4 0.23 405 34 10.9 125 608 266
NAT 8.3 0.64 324 40 8.7 272 537 191
Torres CT 8.5 0.12 237 29 8.8 576 284 140de Alcanadre NT 8.6 0.13 229 28 9.4 571 294 135
NAT 8.5 0.14 245 29 11.5 619 264 118
Undués CT 8.3 0.13 56 66 14.7 106 531 363de Lerda NT 8.3 0.13 89 65 14.5 115 533 352
NAT 8.2 0.20 119 64 25.2 209 487 303
Artieda CT 8.1 0.19 177 46 10.6 370 394 236NT 8.2 0.18 239 44 10.2 314 451 235
NAT 8.2 0.15 84 65 16.4 308 416 276a EC, electrical conductivity
g kg-1
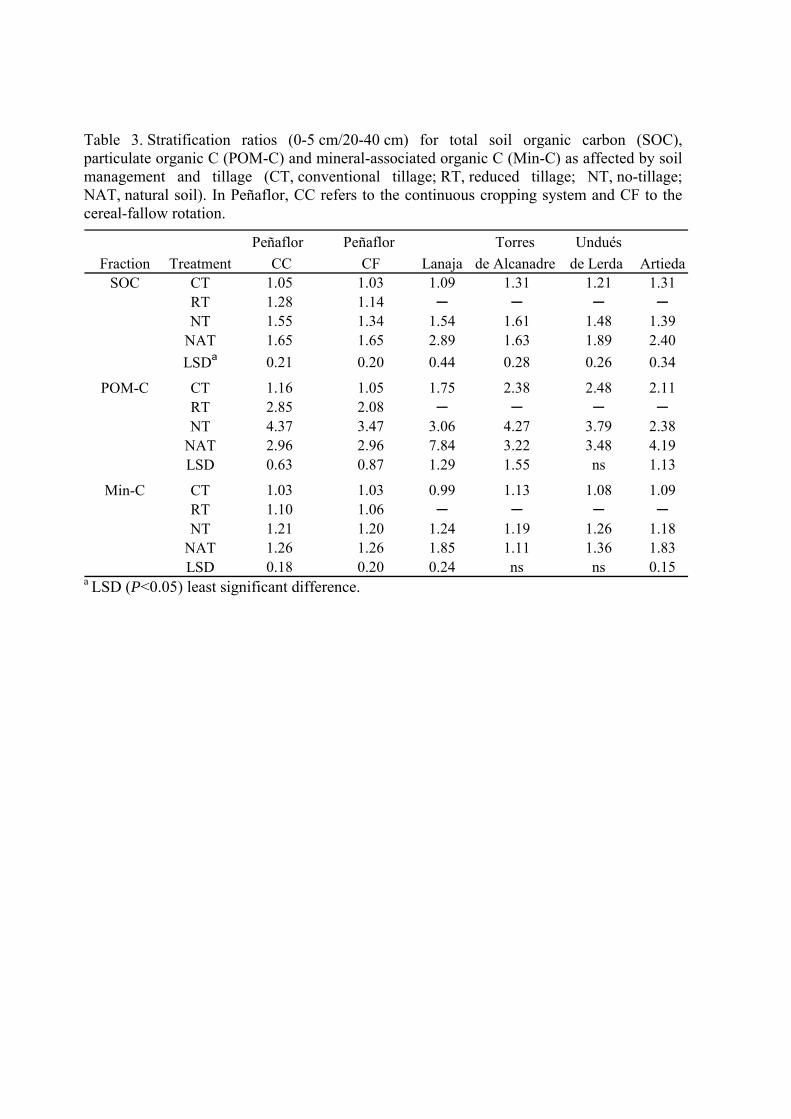
Table 3. Stratification ratios (0-5 cm/20-40 cm) for total soil organic carbon (SOC), particulate organic C (POM-C) and mineral-associated organic C (Min-C) as affected by soil management and tillage (CT, conventional tillage; RT, reduced tillage; NT, no-tillage; NAT, natural soil). In Peñaflor, CC refers to the continuous cropping system and CF to the cereal-fallow rotation.
Peñaflor Peñaflor Torres Undués
Fraction Treatment CC CF Lanaja de Alcanadre de Lerda ArtiedaSOC CT 1.05 1.03 1.09 1.31 1.21 1.31
RT 1.28 1.14 ─ ─ ─ ─NT 1.55 1.34 1.54 1.61 1.48 1.39
NAT 1.65 1.65 2.89 1.63 1.89 2.40
LSDa 0.21 0.20 0.44 0.28 0.26 0.34
POM-C CT 1.16 1.05 1.75 2.38 2.48 2.11RT 2.85 2.08 ─ ─ ─ ─NT 4.37 3.47 3.06 4.27 3.79 2.38
NAT 2.96 2.96 7.84 3.22 3.48 4.19LSD 0.63 0.87 1.29 1.55 ns 1.13
Min-C CT 1.03 1.03 0.99 1.13 1.08 1.09RT 1.10 1.06 ─ ─ ─ ─NT 1.21 1.20 1.24 1.19 1.26 1.18
NAT 1.26 1.26 1.85 1.11 1.36 1.83LSD 0.18 0.20 0.24 ns ns 0.15
a LSD (P<0.05) least significant difference.
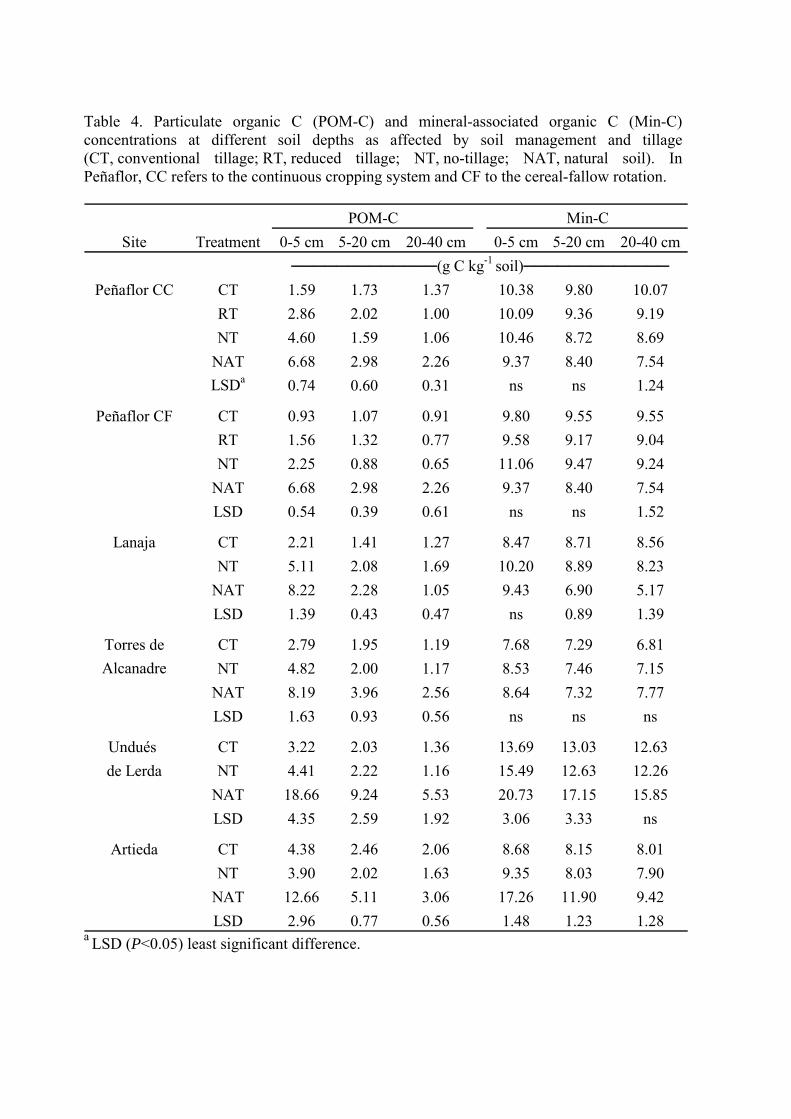
Table 4. Particulate organic C (POM-C) and mineral-associated organic C (Min-C) concentrations at different soil depths as affected by soil management and tillage (CT, conventional tillage; RT, reduced tillage; NT, no-tillage; NAT, natural soil). In Peñaflor, CC refers to the continuous cropping system and CF to the cereal-fallow rotation.
Site Treatment 0-5 cm 5-20 cm 20-40 cm 0-5 cm 5-20 cm 20-40 cm
Peñaflor CC CT 1.59 1.73 1.37 10.38 9.80 10.07
RT 2.86 2.02 1.00 10.09 9.36 9.19
NT 4.60 1.59 1.06 10.46 8.72 8.69
NAT 6.68 2.98 2.26 9.37 8.40 7.54
LSDa 0.74 0.60 0.31 ns ns 1.24
Peñaflor CF CT 0.93 1.07 0.91 9.80 9.55 9.55
RT 1.56 1.32 0.77 9.58 9.17 9.04
NT 2.25 0.88 0.65 11.06 9.47 9.24
NAT 6.68 2.98 2.26 9.37 8.40 7.54
LSD 0.54 0.39 0.61 ns ns 1.52
Lanaja CT 2.21 1.41 1.27 8.47 8.71 8.56
NT 5.11 2.08 1.69 10.20 8.89 8.23
NAT 8.22 2.28 1.05 9.43 6.90 5.17
LSD 1.39 0.43 0.47 ns 0.89 1.39
Torres de CT 2.79 1.95 1.19 7.68 7.29 6.81
Alcanadre NT 4.82 2.00 1.17 8.53 7.46 7.15
NAT 8.19 3.96 2.56 8.64 7.32 7.77
LSD 1.63 0.93 0.56 ns ns ns
Undués CT 3.22 2.03 1.36 13.69 13.03 12.63
de Lerda NT 4.41 2.22 1.16 15.49 12.63 12.26
NAT 18.66 9.24 5.53 20.73 17.15 15.85
LSD 4.35 2.59 1.92 3.06 3.33 ns
Artieda CT 4.38 2.46 2.06 8.68 8.15 8.01
NT 3.90 2.02 1.63 9.35 8.03 7.90
NAT 12.66 5.11 3.06 17.26 11.90 9.42
LSD 2.96 0.77 0.56 1.48 1.23 1.28
POM-C Min-C
─────────────(g C kg-1 soil)─────────────
a LSD (P<0.05) least significant difference.
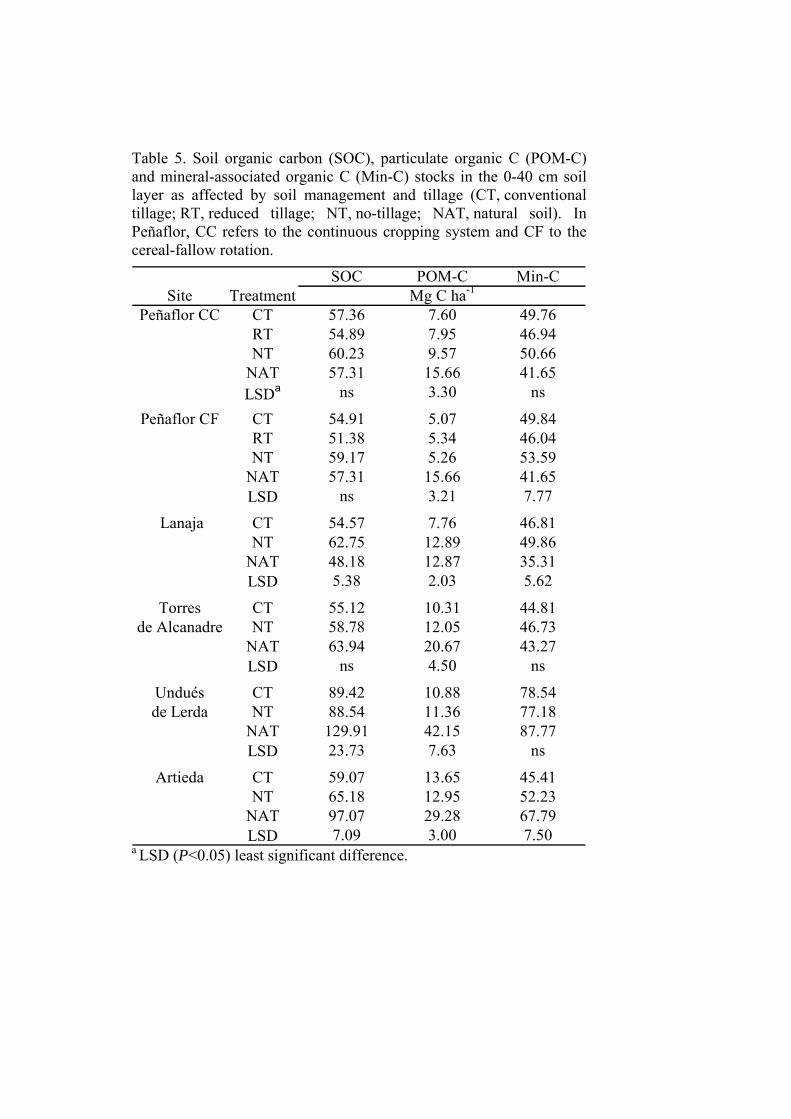
Table 5. Soil organic carbon (SOC), particulate organic C (POM-C) and mineral-associated organic C (Min-C) stocks in the 0-40 cm soil layer as affected by soil management and tillage (CT, conventional tillage; RT, reduced tillage; NT, no-tillage; NAT, natural soil). In Peñaflor, CC refers to the continuous cropping system and CF to the cereal-fallow rotation.
SOC POM-C Min-CSite Treatment
Peñaflor CC CT 57.36 7.60 49.76RT 54.89 7.95 46.94NT 60.23 9.57 50.66
NAT 57.31 15.66 41.65LSDa ns 3.30 ns
Peñaflor CF CT 54.91 5.07 49.84RT 51.38 5.34 46.04NT 59.17 5.26 53.59
NAT 57.31 15.66 41.65LSD ns 3.21 7.77
Lanaja CT 54.57 7.76 46.81NT 62.75 12.89 49.86
NAT 48.18 12.87 35.31LSD 5.38 2.03 5.62
Torres CT 55.12 10.31 44.81de Alcanadre NT 58.78 12.05 46.73
NAT 63.94 20.67 43.27LSD ns 4.50 ns
Undués CT 89.42 10.88 78.54de Lerda NT 88.54 11.36 77.18
NAT 129.91 42.15 87.77LSD 23.73 7.63 ns
Artieda CT 59.07 13.65 45.41NT 65.18 12.95 52.23
NAT 97.07 29.28 67.79LSD 7.09 3.00 7.50
Mg C ha-1
a LSD (P<0.05) least significant difference.