long-term application of organic manure and nitrogen fertilizer on n2o emissions, soil quality and...
TRANSCRIPT
Long-term application of organic manure and nitrogen fertilizer on N2O
emissions, soil quality and crop production in a sandy loam soil
Lei Meng, Weixin Ding*, Zucong Cai
State Key Laboratory of Soil and Sustainable Agriculture, Institute of Soil Science, Chinese Academy of Sciences,
71# East Beijing Road, Nanjing 210008, China
Received 7 March 2004; received in revised form 21 January 2005; accepted 23 March 2005
Abstract
A long-term field experiment was established to determine the influence of mineral fertilizer (NPK) or organic manure (composed of wheat
straw, oil cake and cottonseed cake) on soil fertility. A tract of calcareous fluvo-aquic soil (aquic inceptisol) in the Fengqiu State Key
Experimental Station for Ecological Agriculture (Fengqiu county, Henan province, China) was fertilized beginning in September 1989 and
N2O emissions were examined during the maize and wheat growth seasons of 2002–2003. The study involved seven treatments: organic
manure (OM), half-organic manure plus half-fertilizer N (1/2 OMN), fertilizer NPK (NPK), fertilizer NP (NP), fertilizer NK (NK), fertilizer
PK (PK) and control (CK). Manured soils had higher organic C and N contents, but lower pH and bulk densities than soils receiving the
various mineralized fertilizers especially those lacking P, indicating that long-term application of manures could efficiently prevent the
leaching of applied N from and increase N content in the plowed layer. The application of manures and fertilizers at a rate of 300 kg N haK1
yearK1 significantly increased N2O emissions from 150 g N2O-N haK1 yearK1 in the CK treatment soil to 856 g N2O-N haK1 yearK1 in the
OM treatment soil; however, there was no significant difference between the effect of fertilizer and manure on N2O emission. More N2O was
released during the 102-day maize growth season than during the 236-day wheat growth season in the N-fertilized soils but not in
N-unfertilized soils. N2O emission was significantly affected by soil moisture during the maize growth season and by soil temperature during
the wheat growth season. In sum, this study showed that manure added to a soil tested did not result in greater N2O emission than treatment
with a N-containing fertilizer, but did confer greater benefits for soil fertility and the environment.
q 2005 Elsevier Ltd. All rights reserved.
Keywords: Nitrous oxide; Manures; Mineral fertilizers; Soil fertility
1. Introduction
Agricultural soils are a major source of N2O, amounting
to 6.3 Tg N yearK1 assessed by IPCC Phase II methodology
(Mosier et al., 1998), which is 35% of the global annual
emission (Kroeze et al., 1999). The N2O emission from
agriculture is mainly derived from the microbial processes
of nitrification and denitrification in soils. The major
controlling factors for N2O production are temperature,
and the amount of NHC4 -N, NOK
3 -N, water, and organic
matter in the soil. Many studies have shown that addition
0038-0717/$ - see front matter q 2005 Elsevier Ltd. All rights reserved.
doi:10.1016/j.soilbio.2005.03.007
* Corresponding author. Tel.: C86 25 8688 1105; fax: C86 25 8688
1000.
E-mail addresses: [email protected] (W. Ding), wxding@
issas.ac.cn (W. Ding).
of N increases the N2O emission from arable soils (Kaiser
et al., 1998; Smith et al., 1998). To meet the food demands
of an increasing population in China, more and more
mineral fertilizer N is being applied to the soils for
enhancement of crop yields; this use accounts for more
than one quarter of the total N fertilizer used around the
world (FAO, 1998). However, a low ratio of mineral
fertilizer N is taken up by crops (Zhu, 1997) so that up to
41% of N applied during the growth season was found to
leach down into the subsoil in a fluvo-aquic soil (Cai et al.,
2002). Xing and Zhu (2001) reported that N2O emissions
from agricultural fields in China have increased from 26 Gg
in 1949 to 373 Gg in 1999. Hence, it is essential that we
develop methods to enhance the recycling of N in the
agricultural ecosystem and reduce the amount of mineral
fertilizer N dispensed to fields.
In China, as much as 60 Pg yearK1 of straw was
produced from 1000 million hectares of cultivated soil in
Soil Biology & Biochemistry 37 (2005) 2037–2045
www.elsevier.com/locate/soilbio
L. Meng et al. / Soil Biology & Biochemistry 37 (2005) 2037–20452038
the 1980s; up to 80% of this was burned either in the field or
for cooking (Cheng and He, 1990). However, straw burning
is becoming less common due to increasing environmental
concerns and the availability of fossil energy, i.e. coal and
natural/coal gas in rural areas. Composting straw as a
beneficial additive to agricultural soils is an attractive
alternative to burning; straw is a potentially valuable soil
conditioner, as it can be used as a source of crop nutrients,
including N, P, K, and all the essential trace elements
required by plants (Dalzell et al., 1987; Edmeades, 2003).
Compost additions were found to not only increase crop
yields (McSorley and Gallaher, 1996; Mamo et al., 1998),
but also to improve soil fertility in terms of organic C and N
content, permeability, plant available water capacity, and
air-filled porosity (Stratfon and Rechcigl, 1998; Keener
et al., 2000).
In general, when organic manures are added to soil, an
ideal condition for denitrification will develop: labile forms
of organic C is used as an energy source by the large
populations of heterotrophic microbes, when biological O2
demand by microbes exceeds the supply, the anaerobic
microenvironment necessary for denitrification is created.
In addition, the application of organic manures stimulates
N2O production through nitrification, as this process also
increases when aeration becomes restricted (Anderson and
Levine, 1986). Together, these observations explain why
manures with low C/N ratios generated more total N2O than
did mineral fertilizer N, but application of wheat, barley and
maize straws with high C/N ratios did not change N2O
emission in comparison to the control (Velthof et al., 1997,
2002). The objective of this study was to evaluate the effects
of long-term application of mineral fertilizers and organic
manures on N2O emission from a calcareous fluvo-aquic
soil under the maize and wheat growth seasons.
2. Materials and methods
2.1. Study site
The field experiment was conducted in a well-drained
field where wheat (Triticum aestivum L.) was grown in
winter and maize (Zea mays L.) was cultivated in summer.
The site was part of the Fengqiu State Key Experimental
Station for Ecological Agriculture, Fengqiu county, Henan
province, China (35800 0N, 114824 0E). During the course of
the study, the mean annual temperature was 13.9 8C, and the
lowest and highest mean monthly values were K1.0 8C in
January and 27.2 8C in July, respectively. The average
precipitation was 615 mm, two-thirds of which fell during
June–September. The soil, derived from alluvial sediments
of the Yellow River and classified as aquic inceptisol, had a
sandy loam texture and an average pHH2O of 8.65. In terms of
composition, the soil contained 5.83 g organic C kgK1,
0.45 g total N kgK1, 0.50 g total P kgK1, 18.6 g total K kgK1
and 9.51 mg inorganic N kgK1 in September 1989, prior to
inception of the experiment.
2.2. Experimental design
Four replicates of seven treatments, organic manure
(OM), half-organic manure plus half-fertilizer N (1/2
OMN), fertilizer NPK (NPK), fertilizer NP (NP), fertilizer
NK (NK), fertilizer PK (PK) and control (CK), were laid out
in a randomized block design in September 1989 to monitor
the influence of the long-term application of mineral
fertilizers, organic manures and their combination on crop
yield and soil properties. Each plot measured 9.5!5 m2. All
phosphorus, potassium and organic manure fertilizers were
applied as basal fertilizers, whereas urea was added in two
applications as both the basal and supplementary fertilizer.
Fertilizers and manures were evenly broadcast onto the soil
surface by hand and immediately incorporated into the
plowed soil (0–20 cm depth) by tillage before sowing. N2O
emissions were measured during the years 2002–2003, with
crops sown on June 11 (maize) and October 11 (wheat) of
2002. The prescribed annual amount of fertilizers added
since 1989 as summarized in Table 1 resembled the locally
recommended doses for cereal crops.
For experiments, the organic manure contained wheat
straw, oil cake and cotton cake in a ratio of 100:40:45. This
proportion was based on the C and N contents of the
components with a goal of applying a total amount of
organic C and N in manures (per hectare per season) equal
to that in the wheat straw harvested per hectare and
150 kg N haK1, respectively. These materials were machine
ground into 3–5 mm lengths, mixed completely with limited
water and composted for 2 months. The oil cakes and cotton
cakes were the machine-dried residues of oil-harvested
rapeseeds and cottonseeds, respectively, and were obtained
from a commercial cooking oil company. The chemical
properties of the organic manures after composting are
shown in Table 2. The amounts of P and K were generally
less than the prescribed doses, so the manures were
supplemented with superphosphate and potassium sulfate
(Table 1). To reduce ammoniacal volatilization in the
alkaline soil, supplementary fertilizer urea was also surface
applied by hand and then brought into the plowed layer with
20-mm irrigation water for maize (26 July 2002) and wheat
(28 February 2003).
Maize was directly sown into each plot on 12 June 2002.
The distances between rows and hills were 70 and 25 cm,
respectively. After 2 weeks, the seedlings were thinned to
about 50,000 per hectare, and the mature maize was
harvested on 23 September 2002. Wheat was directly
sown on 11 October 2002 (row distanceZ15 cm) and
harvested on 3 June 2003. During the experimental period
(1989–2003), the herbicide was generally sprayed about
20 days after sowing and visible weeds were pulled by hand
during the growing period.
Table 1
Experimental design and application amount of mineral fertilizers and organic manures
Treatment Basal fertilizers Supplementary
fertilizer urea
(kg N haK1)N (kg N haK1) P (kg P2O5 haK1) K (kg K2O haK1)
Total Manure Urea Total Manure Super
phosphate
Total Manure Potassium
sulfate
Maize
Control (CK) 0 0 0 0 0 0 0 0 0 0
Manure (OM) 150 150 0 75 51 24 150 65 85 0
Half-manure N plus
fertilizer N (1/2 OMN)
75 75 0 75 25.5 49.5 150 32.5 117.5 75
Fertilizer NPK (NPK) 60 0 60 75 0 75 150 0 150 90
Fertilizer NP (NP) 60 0 60 75 0 75 0 0 0 90
Fertilizer NK (NK) 60 0 60 0 0 0 150 0 150 90
Fertilizer PK (PK) 0 0 0 75 0 75 150 0 150 0
Wheat
Control (CK) 0 0 0 0 0 0 0 0 0 0
Manure (OM) 150 150 0 75 45 30 150 63 87 0
Half-manure N plus
fertilizer N (1/2 OMN)
90 75 15 75 22.5 52.5 150 31.5 118.5 60
Fertilizer NPK (NPK) 90 0 90 75 0 75 150 0 150 60
Fertilizer NP (NP) 90 0 90 75 0 75 0 0 0 60
Fertilizer NK (NK) 90 0 90 0 0 0 150 0 150 60
Fertilizer PK (PK) 0 0 0 75 0 75 150 0 150 0
L. Meng et al. / Soil Biology & Biochemistry 37 (2005) 2037–2045 2039
2.3. Gas flux measurements
A close-chamber method was used to determine fluxes of
N2O and CO2 in three of the four replicate plots of each
treatment. Immediately after sowing, a PVC chamber base
(30!30 cm) was inserted into the soil about 5 cm deep
between the maize or wheat plants in the row at the center of
each plot. The PVC chambers (15 cm high as measured from
the soil for each plot, enclosing a surface area of 30!30 cm2)
were tightly fitted atop the base by inserting the flange of the
chamber into the water trough at the upper end of the chamber
base. The chamber top included a small, silicon-sealed vent
for sampling. Samples were taken daily for a week
immediately after fertilization, for 2–3 days after rainfall or
irrigation, twice weekly during the maize growth season and
for part of the wheat growth season, and weekly or fortnightly
in winter. Sampling was done in the morning between 09:00
and 12:00 in order to minimize diurnal variation in flux
patterns. Each time, four samples of the chamber air were
manually pulled into 50 ml syringes at 0, 10, 20 and 30 min
after closure, injected into pre-evacuated vials fitted with
butyl rubber stoppers, and taken to our laboratory for
analysis. The air temperature inside the chamber was
measured with a mercury thermometer and the air and soil
Table 2
N and C contents in the applied organic manures produced
Crop Moisture
(g kgK1)
Total N
(g kgK1 DW)
Total C
(g kgK1 DW)
C
Maize 703G4 54.4G2.0 422G14 7
Wheat 703G4 54.3G2.0 422G14 7
MeansGSD (nZ4). DWZdry weight.
temperatures at 5, 10 and 20 cm depths of the vertical profile
were measured with a digital thermometer (Model 2455,
Yokogawa, Japan).
N2O concentrations were obtained by gas chromato
graphy with an electron capture detector (Shimadzu,
GC14-B, Japan). The standard N2O gas was provided by
the National Institute for Agro-Environmental Sciences,
Japan. The rate of N2O increase in the chamber air was
calculated from a linear regression of concentration versus
time using an average chamber temperature. CO2 concen-
tration was determined by gas chromatography equipped
with a thermal conductivity detector (Shimadzu GC-14B,
Japan). Different concentrations of CO2 gas standards were
supplied by BOC, Inc. (Shanghai, China).
2.4. Soil sampling and analysis
Immediately after each gas sampling, the bulk density of
the soil was measured by the core method. Soil moisture
was determined by drying the soils at 105 8C for 24 h. After
each crop was harvested, soil samples were taken from
depths of 0–20 cm for soil property analyses. Soil pH was
measured from soil-water suspensions (1:2.5 v/v). Total soil
C and N contents were determined with a Series II CHNS/O
/N ratio P2O5
(g kgK1 DW)
K2O
(g kgK1 DW)
Applied amount
(kg haK1 DW)
.75 18.5G5.5 23.5G1.0 2758
.75 16.3G2.5 22.8G1.1 2758
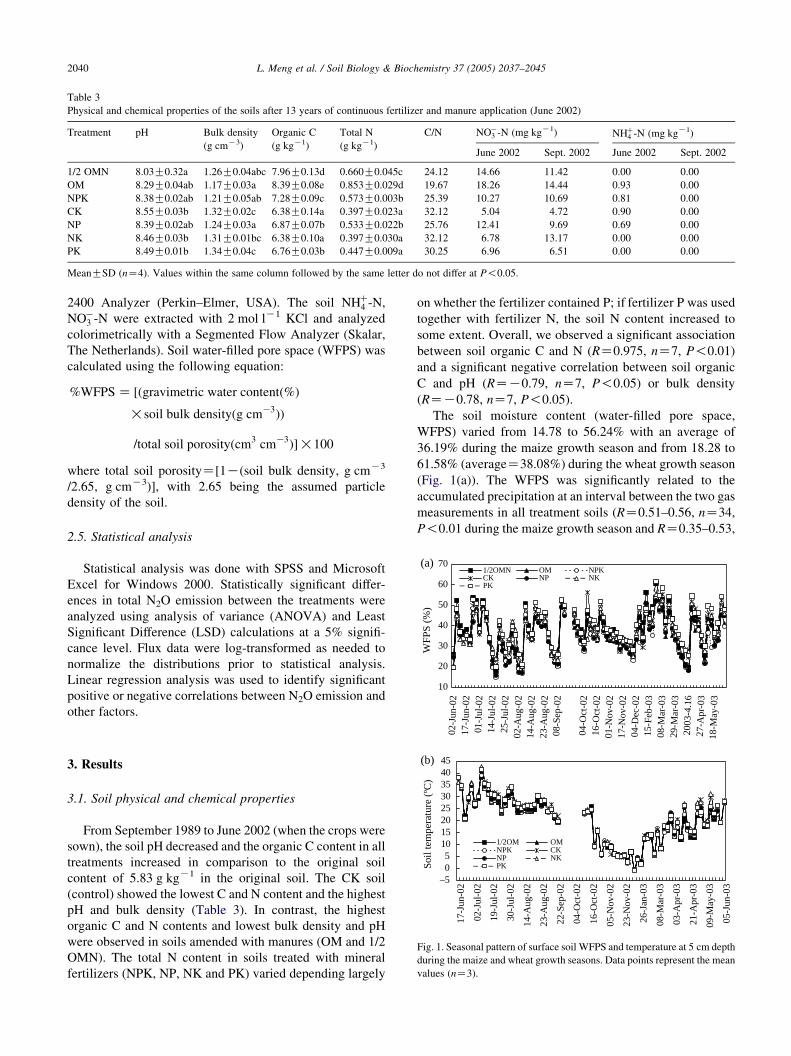
Table 3
Physical and chemical properties of the soils after 13 years of continuous fertilizer and manure application (June 2002)
Treatment pH Bulk density
(g cmK3)
Organic C
(g kgK1)
Total N
(g kgK1)
C/N NOK3 -N (mg kgK1) NHC
4 -N (mg kgK1)
June 2002 Sept. 2002 June 2002 Sept. 2002
1/2 OMN 8.03G0.32a 1.26G0.04abc 7.96G0.13d 0.660G0.045c 24.12 14.66 11.42 0.00 0.00
OM 8.29G0.04ab 1.17G0.03a 8.39G0.08e 0.853G0.029d 19.67 18.26 14.44 0.93 0.00
NPK 8.38G0.02ab 1.21G0.05ab 7.28G0.09c 0.573G0.003b 25.39 10.27 10.69 0.81 0.00
CK 8.55G0.03b 1.32G0.02c 6.38G0.14a 0.397G0.023a 32.12 5.04 4.72 0.90 0.00
NP 8.39G0.02ab 1.24G0.03a 6.87G0.07b 0.533G0.022b 25.76 12.41 9.69 0.69 0.00
NK 8.46G0.03b 1.31G0.01bc 6.38G0.10a 0.397G0.030a 32.12 6.78 13.17 0.00 0.00
PK 8.49G0.01b 1.34G0.04c 6.76G0.03b 0.447G0.009a 30.25 6.96 6.51 0.00 0.00
MeanGSD (nZ4). Values within the same column followed by the same letter do not differ at P!0.05.
10
20
30
40
50
60
70(a)
Jun-
02Ju
n-02
-Jul
-02
-Jul
-02
-Jul
-02
ug-0
2ug
-02
ug-0
2Se
p-02
Oct
-02
Oct
-02
ov-0
2ov
-02
ec-0
2Fe
b-03
ar-0
3ar
-03
3-4.
16pr
-03
ay-0
3
WFP
S (%
)
1/2OMN OM NPKCK NP NKPK
L. Meng et al. / Soil Biology & Biochemistry 37 (2005) 2037–20452040
2400 Analyzer (Perkin–Elmer, USA). The soil NHC4 -N,
NOK3 -N were extracted with 2 mol lK1 KCl and analyzed
colorimetrically with a Segmented Flow Analyzer (Skalar,
The Netherlands). Soil water-filled pore space (WFPS) was
calculated using the following equation:
%WFPS Z ½ðgravimetric water contentð%Þ
!soil bulk densityðg cmK3ÞÞ
=total soil porosityðcm3 cmK3Þ�!100
where total soil porosityZ[1K(soil bulk density, g cmK3
/2.65, g cmK3)], with 2.65 being the assumed particle
density of the soil.
2.5. Statistical analysis
Statistical analysis was done with SPSS and Microsoft
Excel for Windows 2000. Statistically significant differ-
ences in total N2O emission between the treatments were
analyzed using analysis of variance (ANOVA) and Least
Significant Difference (LSD) calculations at a 5% signifi-
cance level. Flux data were log-transformed as needed to
normalize the distributions prior to statistical analysis.
Linear regression analysis was used to identify significant
positive or negative correlations between N2O emission and
other factors.
(b)
02-
17-
01 14 25 02-A
14-A
23-A
08-
04-
16-
01-N
17-N
04-D
15-
08-M
29-M
200
27-A
18-M
–505
1015202530354045
17-J
un-0
2
02-J
ul-0
2
19-J
ul-0
2
30-J
ul-0
2
14-A
ug-0
2
23-A
ug-0
2
22-S
ep-0
2
04-O
ct-0
2
16-O
ct-0
2
05-N
ov-0
2
23-N
ov-0
2
26-J
an-0
3
08-M
ar-0
3
03-A
pr-0
3
21-A
pr-0
3
09-M
ay-0
3
05-J
un-0
3
Soil
tem
pera
ture
(ºC
)
1/2OM OMNPK CKNP NKPK
Fig. 1. Seasonal pattern of surface soil WFPS and temperature at 5 cm depth
during the maize and wheat growth seasons. Data points represent the mean
values (nZ3).
3. Results
3.1. Soil physical and chemical properties
From September 1989 to June 2002 (when the crops were
sown), the soil pH decreased and the organic C content in all
treatments increased in comparison to the original soil
content of 5.83 g kgK1 in the original soil. The CK soil
(control) showed the lowest C and N content and the highest
pH and bulk density (Table 3). In contrast, the highest
organic C and N contents and lowest bulk density and pH
were observed in soils amended with manures (OM and 1/2
OMN). The total N content in soils treated with mineral
fertilizers (NPK, NP, NK and PK) varied depending largely
on whether the fertilizer contained P; if fertilizer P was used
together with fertilizer N, the soil N content increased to
some extent. Overall, we observed a significant association
between soil organic C and N (RZ0.975, nZ7, P!0.01)
and a significant negative correlation between soil organic
C and pH (RZK0.79, nZ7, P!0.05) or bulk density
(RZK0.78, nZ7, P!0.05).
The soil moisture content (water-filled pore space,
WFPS) varied from 14.78 to 56.24% with an average of
36.19% during the maize growth season and from 18.28 to
61.58% (averageZ38.08%) during the wheat growth season
(Fig. 1(a)). The WFPS was significantly related to the
accumulated precipitation at an interval between the two gas
measurements in all treatment soils (RZ0.51–0.56, nZ34,
P!0.01 during the maize growth season and RZ0.35–0.53,
–50
0
50
100
150
200
250
300(a)
(b)
08-J
un-0
213
-Jun
-02
18-J
un-0
223
-Jun
-02
28-J
un-0
203
-Jul
-02
08-J
ul-0
213
-Jul
-02
18-J
ul-0
223
-Jul
-02
28-J
ul-0
202
-Aug
-02
07-A
ug-0
212
-Aug
-02
17-A
ug-0
222
-Aug
-02
27-A
ug-0
201
-Sep
-02
06-S
ep-0
211
-Sep
-02
16-S
ep-0
221
-Sep
-02
N2O
flu
x (µ
g N
2O-N
m–2
h–1
)N
2O f
lux
(µg
N2O
-N m
–2 h
–1)
1/2OMNOMNPKCKNPNKPK
–500
50100150200250300350400450
12-O
ct-0
216
-Oct
-02
24-O
ct-0
201
-Nov
-02
09-N
ov-0
217
-Nov
-02
23-N
ov-0
204
-Dec
-02
10-J
an-0
315
-Feb
-03
02-M
ar-0
308
-Mar
-03
18-M
ar-0
329
-Mar
-03
08-A
pr-0
316
-Apr
-03
21-A
pr-0
327
-Apr
-03
04-M
ay-0
318
-May
-03
28-M
ay-0
305
-Jun
-03
1/2OMN OMNPK CKNP NKPK
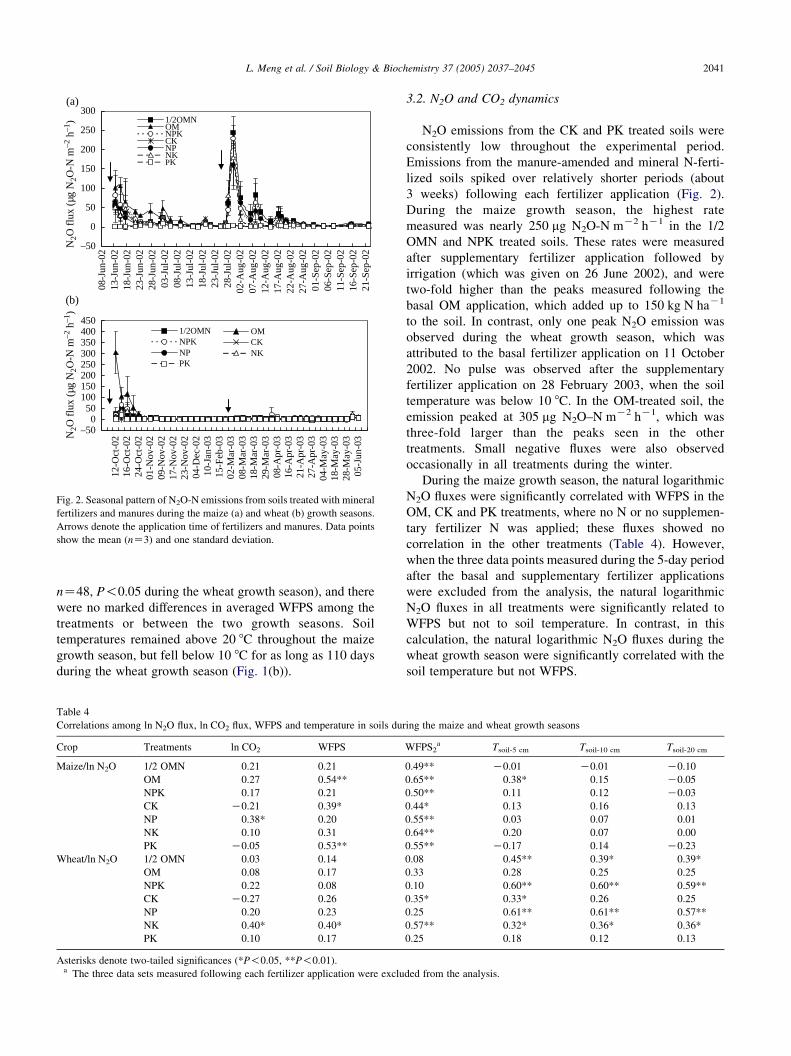
Fig. 2. Seasonal pattern of N2O-N emissions from soils treated with mineral
fertilizers and manures during the maize (a) and wheat (b) growth seasons.
Arrows denote the application time of fertilizers and manures. Data points
show the mean (nZ3) and one standard deviation.
L. Meng et al. / Soil Biology & Biochemistry 37 (2005) 2037–2045 2041
nZ48, P!0.05 during the wheat growth season), and there
were no marked differences in averaged WFPS among the
treatments or between the two growth seasons. Soil
temperatures remained above 20 8C throughout the maize
growth season, but fell below 10 8C for as long as 110 days
during the wheat growth season (Fig. 1(b)).
Table 4
Correlations among ln N2O flux, ln CO2 flux, WFPS and temperature in soils dur
Crop Treatments ln CO2 WFPS
Maize/ln N2O 1/2 OMN 0.21 0.21
OM 0.27 0.54**
NPK 0.17 0.21
CK K0.21 0.39*
NP 0.38* 0.20
NK 0.10 0.31
PK K0.05 0.53**
Wheat/ln N2O 1/2 OMN 0.03 0.14
OM 0.08 0.17
NPK 0.22 0.08
CK K0.27 0.26
NP 0.20 0.23
NK 0.40* 0.40*
PK 0.10 0.17
Asterisks denote two-tailed significances (*P!0.05, **P!0.01).a The three data sets measured following each fertilizer application were exclu
3.2. N2O and CO2 dynamics
N2O emissions from the CK and PK treated soils were
consistently low throughout the experimental period.
Emissions from the manure-amended and mineral N-ferti-
lized soils spiked over relatively shorter periods (about
3 weeks) following each fertilizer application (Fig. 2).
During the maize growth season, the highest rate
measured was nearly 250 mg N2O-N mK2 hK1 in the 1/2
OMN and NPK treated soils. These rates were measured
after supplementary fertilizer application followed by
irrigation (which was given on 26 June 2002), and were
two-fold higher than the peaks measured following the
basal OM application, which added up to 150 kg N haK1
to the soil. In contrast, only one peak N2O emission was
observed during the wheat growth season, which was
attributed to the basal fertilizer application on 11 October
2002. No pulse was observed after the supplementary
fertilizer application on 28 February 2003, when the soil
temperature was below 10 8C. In the OM-treated soil, the
emission peaked at 305 mg N2O–N mK2 hK1, which was
three-fold larger than the peaks seen in the other
treatments. Small negative fluxes were also observed
occasionally in all treatments during the winter.
During the maize growth season, the natural logarithmic
N2O fluxes were significantly correlated with WFPS in the
OM, CK and PK treatments, where no N or no supplemen-
tary fertilizer N was applied; these fluxes showed no
correlation in the other treatments (Table 4). However,
when the three data points measured during the 5-day period
after the basal and supplementary fertilizer applications
were excluded from the analysis, the natural logarithmic
N2O fluxes in all treatments were significantly related to
WFPS but not to soil temperature. In contrast, in this
calculation, the natural logarithmic N2O fluxes during the
wheat growth season were significantly correlated with the
soil temperature but not WFPS.
ing the maize and wheat growth seasons
WFPS2a Tsoil-5 cm Tsoil-10 cm Tsoil-20 cm
0.49** K0.01 K0.01 K0.10
0.65** 0.38* 0.15 K0.05
0.50** 0.11 0.12 K0.03
0.44* 0.13 0.16 0.13
0.55** 0.03 0.07 0.01
0.64** 0.20 0.07 0.00
0.55** K0.17 0.14 K0.23
0.08 0.45** 0.39* 0.39*
0.33 0.28 0.25 0.25
0.10 0.60** 0.60** 0.59**
0.35* 0.33* 0.26 0.25
0.25 0.61** 0.61** 0.57**
0.57** 0.32* 0.36* 0.36*
0.25 0.18 0.12 0.13
ded from the analysis.
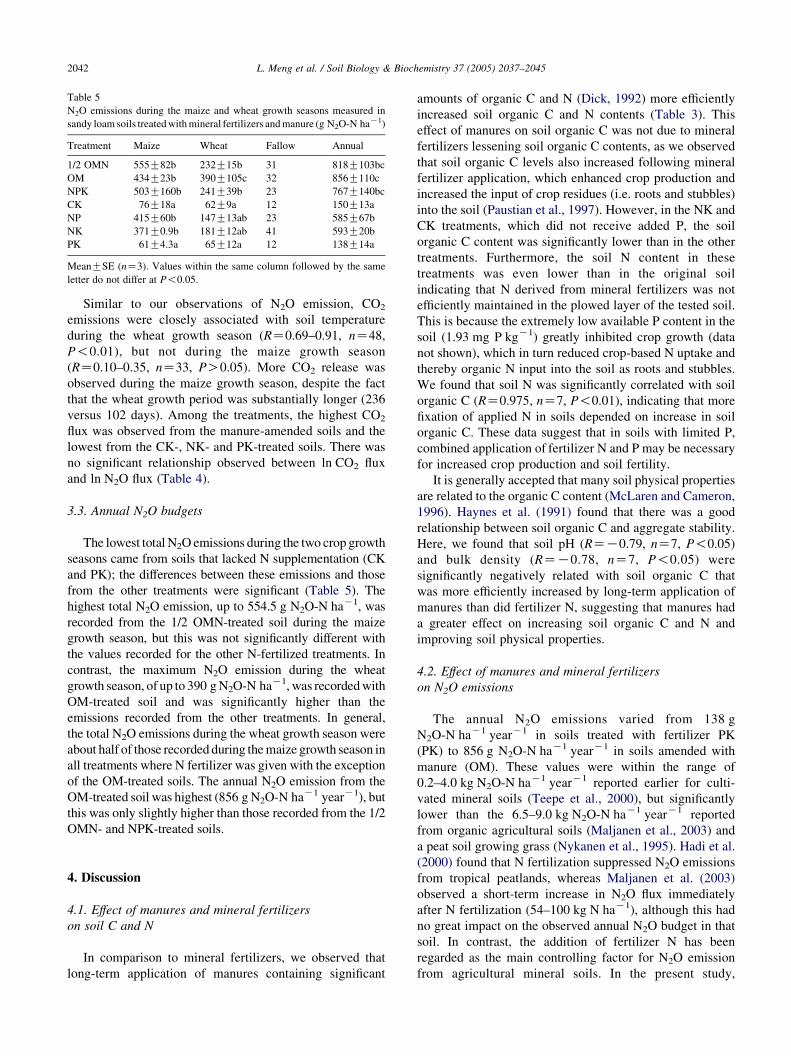
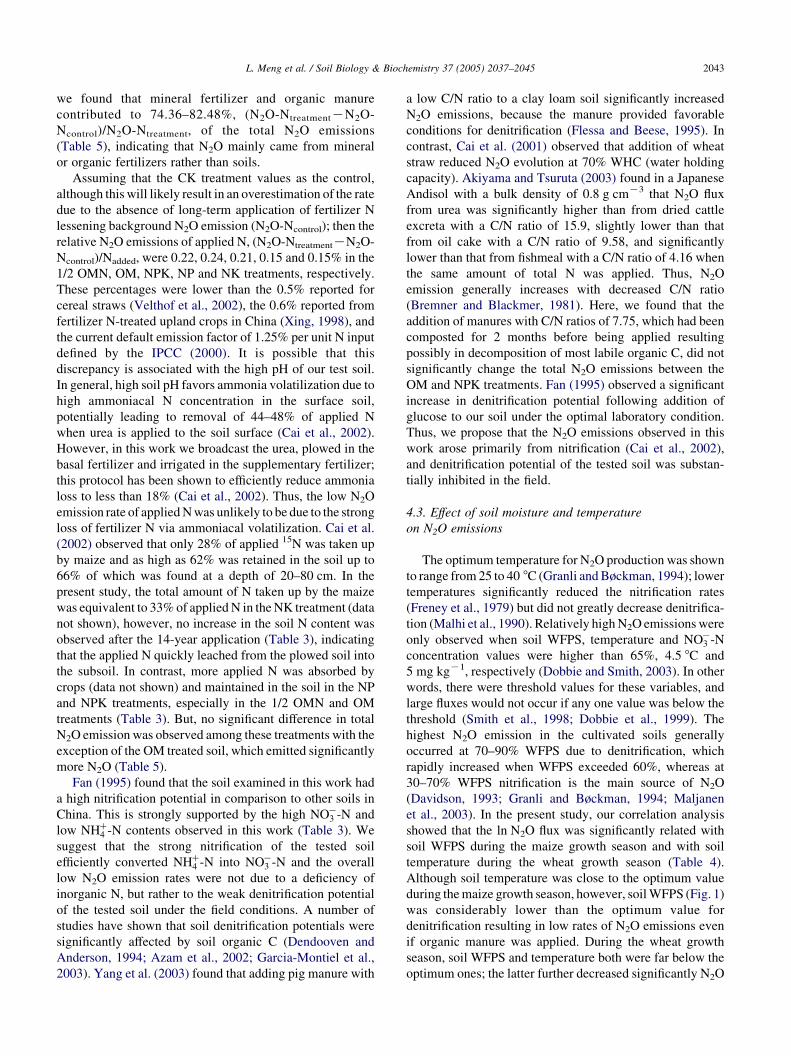
Table 5
N2O emissions during the maize and wheat growth seasons measured in
sandy loam soils treated with mineral fertilizers and manure (g N2O-N haK1)
Treatment Maize Wheat Fallow Annual
1/2 OMN 555G82b 232G15b 31 818G103bc
OM 434G23b 390G105c 32 856G110c
NPK 503G160b 241G39b 23 767G140bc
CK 76G18a 62G9a 12 150G13a
NP 415G60b 147G13ab 23 585G67b
NK 371G0.9b 181G12ab 41 593G20b
PK 61G4.3a 65G12a 12 138G14a
MeanGSE (nZ3). Values within the same column followed by the same
letter do not differ at P!0.05.
L. Meng et al. / Soil Biology & Biochemistry 37 (2005) 2037–20452042
Similar to our observations of N2O emission, CO2
emissions were closely associated with soil temperature
during the wheat growth season (RZ0.69–0.91, nZ48,
P!0.01), but not during the maize growth season
(RZ0.10–0.35, nZ33, PO0.05). More CO2 release was
observed during the maize growth season, despite the fact
that the wheat growth period was substantially longer (236
versus 102 days). Among the treatments, the highest CO2
flux was observed from the manure-amended soils and the
lowest from the CK-, NK- and PK-treated soils. There was
no significant relationship observed between ln CO2 flux
and ln N2O flux (Table 4).
3.3. Annual N2O budgets
The lowest total N2O emissions during the two crop growth
seasons came from soils that lacked N supplementation (CK
and PK); the differences between these emissions and those
from the other treatments were significant (Table 5). The
highest total N2O emission, up to 554.5 g N2O-N haK1, was
recorded from the 1/2 OMN-treated soil during the maize
growth season, but this was not significantly different with
the values recorded for the other N-fertilized treatments. In
contrast, the maximum N2O emission during the wheat
growth season, of up to 390 g N2O-N haK1, was recorded with
OM-treated soil and was significantly higher than the
emissions recorded from the other treatments. In general,
the total N2O emissions during the wheat growth season were
about half of those recorded during the maize growth season in
all treatments where N fertilizer was given with the exception
of the OM-treated soils. The annual N2O emission from the
OM-treated soil was highest (856 g N2O-N haK1 yearK1), but
this was only slightly higher than those recorded from the 1/2
OMN- and NPK-treated soils.
4. Discussion
4.1. Effect of manures and mineral fertilizers
on soil C and N
In comparison to mineral fertilizers, we observed that
long-term application of manures containing significant
amounts of organic C and N (Dick, 1992) more efficiently
increased soil organic C and N contents (Table 3). This
effect of manures on soil organic C was not due to mineral
fertilizers lessening soil organic C contents, as we observed
that soil organic C levels also increased following mineral
fertilizer application, which enhanced crop production and
increased the input of crop residues (i.e. roots and stubbles)
into the soil (Paustian et al., 1997). However, in the NK and
CK treatments, which did not receive added P, the soil
organic C content was significantly lower than in the other
treatments. Furthermore, the soil N content in these
treatments was even lower than in the original soil
indicating that N derived from mineral fertilizers was not
efficiently maintained in the plowed layer of the tested soil.
This is because the extremely low available P content in the
soil (1.93 mg P kgK1) greatly inhibited crop growth (data
not shown), which in turn reduced crop-based N uptake and
thereby organic N input into the soil as roots and stubbles.
We found that soil N was significantly correlated with soil
organic C (RZ0.975, nZ7, P!0.01), indicating that more
fixation of applied N in soils depended on increase in soil
organic C. These data suggest that in soils with limited P,
combined application of fertilizer N and P may be necessary
for increased crop production and soil fertility.
It is generally accepted that many soil physical properties
are related to the organic C content (McLaren and Cameron,
1996). Haynes et al. (1991) found that there was a good
relationship between soil organic C and aggregate stability.
Here, we found that soil pH (RZK0.79, nZ7, P!0.05)
and bulk density (RZK0.78, nZ7, P!0.05) were
significantly negatively related with soil organic C that
was more efficiently increased by long-term application of
manures than did fertilizer N, suggesting that manures had
a greater effect on increasing soil organic C and N and
improving soil physical properties.
4.2. Effect of manures and mineral fertilizers
on N2O emissions
The annual N2O emissions varied from 138 g
N2O-N haK1 yearK1 in soils treated with fertilizer PK
(PK) to 856 g N2O-N haK1 yearK1 in soils amended with
manure (OM). These values were within the range of
0.2–4.0 kg N2O-N haK1 yearK1 reported earlier for culti-
vated mineral soils (Teepe et al., 2000), but significantly
lower than the 6.5–9.0 kg N2O-N haK1 yearK1 reported
from organic agricultural soils (Maljanen et al., 2003) and
a peat soil growing grass (Nykanen et al., 1995). Hadi et al.
(2000) found that N fertilization suppressed N2O emissions
from tropical peatlands, whereas Maljanen et al. (2003)
observed a short-term increase in N2O flux immediately
after N fertilization (54–100 kg N haK1), although this had
no great impact on the observed annual N2O budget in that
soil. In contrast, the addition of fertilizer N has been
regarded as the main controlling factor for N2O emission
from agricultural mineral soils. In the present study,
L. Meng et al. / Soil Biology & Biochemistry 37 (2005) 2037–2045 2043
we found that mineral fertilizer and organic manure
contributed to 74.36–82.48%, (N2O-NtreatmentKN2O-
Ncontrol)/N2O-Ntreatment, of the total N2O emissions
(Table 5), indicating that N2O mainly came from mineral
or organic fertilizers rather than soils.
Assuming that the CK treatment values as the control,
although this will likely result in an overestimation of the rate
due to the absence of long-term application of fertilizer N
lessening background N2O emission (N2O-Ncontrol); then the
relative N2O emissions of applied N, (N2O-NtreatmentKN2O-
Ncontrol)/Nadded, were 0.22, 0.24, 0.21, 0.15 and 0.15% in the
1/2 OMN, OM, NPK, NP and NK treatments, respectively.
These percentages were lower than the 0.5% reported for
cereal straws (Velthof et al., 2002), the 0.6% reported from
fertilizer N-treated upland crops in China (Xing, 1998), and
the current default emission factor of 1.25% per unit N input
defined by the IPCC (2000). It is possible that this
discrepancy is associated with the high pH of our test soil.
In general, high soil pH favors ammonia volatilization due to
high ammoniacal N concentration in the surface soil,
potentially leading to removal of 44–48% of applied N
when urea is applied to the soil surface (Cai et al., 2002).
However, in this work we broadcast the urea, plowed in the
basal fertilizer and irrigated in the supplementary fertilizer;
this protocol has been shown to efficiently reduce ammonia
loss to less than 18% (Cai et al., 2002). Thus, the low N2O
emission rate of applied N was unlikely to be due to the strong
loss of fertilizer N via ammoniacal volatilization. Cai et al.
(2002) observed that only 28% of applied 15N was taken up
by maize and as high as 62% was retained in the soil up to
66% of which was found at a depth of 20–80 cm. In the
present study, the total amount of N taken up by the maize
was equivalent to 33% of applied N in the NK treatment (data
not shown), however, no increase in the soil N content was
observed after the 14-year application (Table 3), indicating
that the applied N quickly leached from the plowed soil into
the subsoil. In contrast, more applied N was absorbed by
crops (data not shown) and maintained in the soil in the NP
and NPK treatments, especially in the 1/2 OMN and OM
treatments (Table 3). But, no significant difference in total
N2O emission was observed among these treatments with the
exception of the OM treated soil, which emitted significantly
more N2O (Table 5).
Fan (1995) found that the soil examined in this work had
a high nitrification potential in comparison to other soils in
China. This is strongly supported by the high NOK3 -N and
low NHC4 -N contents observed in this work (Table 3). We
suggest that the strong nitrification of the tested soil
efficiently converted NHC4 -N into NOK
3 -N and the overall
low N2O emission rates were not due to a deficiency of
inorganic N, but rather to the weak denitrification potential
of the tested soil under the field conditions. A number of
studies have shown that soil denitrification potentials were
significantly affected by soil organic C (Dendooven and
Anderson, 1994; Azam et al., 2002; Garcia-Montiel et al.,
2003). Yang et al. (2003) found that adding pig manure with
a low C/N ratio to a clay loam soil significantly increased
N2O emissions, because the manure provided favorable
conditions for denitrification (Flessa and Beese, 1995). In
contrast, Cai et al. (2001) observed that addition of wheat
straw reduced N2O evolution at 70% WHC (water holding
capacity). Akiyama and Tsuruta (2003) found in a Japanese
Andisol with a bulk density of 0.8 g cmK3 that N2O flux
from urea was significantly higher than from dried cattle
excreta with a C/N ratio of 15.9, slightly lower than that
from oil cake with a C/N ratio of 9.58, and significantly
lower than that from fishmeal with a C/N ratio of 4.16 when
the same amount of total N was applied. Thus, N2O
emission generally increases with decreased C/N ratio
(Bremner and Blackmer, 1981). Here, we found that the
addition of manures with C/N ratios of 7.75, which had been
composted for 2 months before being applied resulting
possibly in decomposition of most labile organic C, did not
significantly change the total N2O emissions between the
OM and NPK treatments. Fan (1995) observed a significant
increase in denitrification potential following addition of
glucose to our soil under the optimal laboratory condition.
Thus, we propose that the N2O emissions observed in this
work arose primarily from nitrification (Cai et al., 2002),
and denitrification potential of the tested soil was substan-
tially inhibited in the field.
4.3. Effect of soil moisture and temperature
on N2O emissions
The optimum temperature for N2O production was shown
to range from 25 to 40 8C (Granli and Bøckman, 1994); lower
temperatures significantly reduced the nitrification rates
(Freney et al., 1979) but did not greatly decrease denitrifica-
tion (Malhi et al., 1990). Relatively high N2O emissions were
only observed when soil WFPS, temperature and NOK3 -N
concentration values were higher than 65%, 4.5 8C and
5 mg kgK1, respectively (Dobbie and Smith, 2003). In other
words, there were threshold values for these variables, and
large fluxes would not occur if any one value was below the
threshold (Smith et al., 1998; Dobbie et al., 1999). The
highest N2O emission in the cultivated soils generally
occurred at 70–90% WFPS due to denitrification, which
rapidly increased when WFPS exceeded 60%, whereas at
30–70% WFPS nitrification is the main source of N2O
(Davidson, 1993; Granli and Bøckman, 1994; Maljanen
et al., 2003). In the present study, our correlation analysis
showed that the ln N2O flux was significantly related with
soil WFPS during the maize growth season and with soil
temperature during the wheat growth season (Table 4).
Although soil temperature was close to the optimum value
during the maize growth season, however, soil WFPS (Fig. 1)
was considerably lower than the optimum value for
denitrification resulting in low rates of N2O emissions even
if organic manure was applied. During the wheat growth
season, soil WFPS and temperature both were far below the
optimum ones; the latter further decreased significantly N2O
L. Meng et al. / Soil Biology & Biochemistry 37 (2005) 2037–20452044
emission. Thus, more N2O was released during the maize
growth season than during the wheat growth period from the
N-fertilized soils in spite of the fact that the same amount of N
was applied throughout (Table 5). Our results suggest that
N2O emission was significantly affected by soil WFPS when
soil temperature was close to the optimum value such as
higher than 20 8C during the maize growth season, but by soil
temperature when it was below the optimum one, and that the
low rates of N2O emission from the tested soil could mainly
be attributable to low soil WFPS.
5. Conclusion
Manures and mineral fertilizers had similar and very
large effects on soil fertility, so the addition of nutrients in
either form must be regarded as essential for the improve-
ment of soil fertility. Here we showed that manures had a
greater effect on increasing soil organic C and N levels.
Addition of manures with a C/N ratio of 7.75 to a sandy
loam soil did not lead to significantly more N2O emission
compared to mineral fertilizer N due to low soil WFPS that
inhibited denitrification. N2O emission was significantly
related to soil WFPS during the maize growth season when
the soil temperatures were higher than 20 8C, and to soil
temperature during the growth of wheat over the cooler
winter season. Low temperatures in winter inhibited N2O
emission pulses following supplementary fertilizer appli-
cation, resulting in much less total N2O emission during the
wheat growth season versus the shorter maize growth
season. Annual N2O emissions in the OM and 1/2 OMN
treatments were higher than that in the NPK treatment, but
not to a significant degree. Based on the comprehensive
consideration of soil fertility and environment, the com-
bined application of mineral fertilizer N and organic
manures is the best choice for tested soil.
Acknowledgements
This work was funded in part by National Natural
Science Foundation of China (NSFC40331014). We would
like to thank Prof. Shengwu Qin, Mr Qiao Jiang, and
Mrs Xiaoping Li and Chunli Sun for their technical
assistance and two anonymous referees for their helpful
comments and suggestions that improved the manuscript
greatly.
References
Akiyama, H., Tsuruta, H., 2003. Effect of organic matter application on
N2O, NO and NO2 fluxes from an andisol field. Global Biogeochemical
Cycles 17 (4), 1100.
Anderson, I.C., Levine, J.S., 1986. Relative rates of nitric oxide and nitrous
oxide production by nitrifiers, denitrifiers, and nitrate respires. Applied
and Environmental Microbiology 51, 938–945.
Azam, F., Muller, C., Weiske, A., Benekiser, G., Ottow, J.C.G., 2002.
Nitrification and denitrification as sources of atmospheric nitrous
oxide—role oxidizable C and applied nitrogen. Biology and Fertility of
Soils 35, 54–61.
Bremner, J.M., Blackmer, A.M., 1981. Terrestrial nitrification as a source
of atmospheric nitrous oxide. In: Delwiche, C.C. (Ed.), Denitrification,
Nitrification and Atmospheric Nitrous Oxide. Wiley, New York,
pp. 151–170.
Cai, Z.C., Laughlin, R.J., Stevens, R.J., 2001. Nitrous oxide and dinitrogen
emissions from soil under different water regimes and straw amend-
ment. Chemosphere 42, 113–121.
Cai, G., Chen, D., White, R.E., Fan, X.H., Pacholski, A., Zhu, Z.L.,
Ding, H., 2002. Gaseous nitrogen losses from urea applied to maize on a
calcareous fluvo-aquic soil in the North China Plain. Australian Journal
of Soil Research 40, 737–748.
Cheng, H., He, X.W., 1990. Handbook of Natural Resources in China.
Science Press, Beijing.
Dalzell, H.W., Biddlestone, A.J., Gray, K.R., Thurairajan, K., 1987. Soil
management: compost production and use in tropical and subtropical
environments. FAO Soils Bulletin 56, Food and Agriculture Organiz-
ation of the United Nations, Rome, Italy.
Davidson, E.A., 1993. Soil water content and the ratio of nitrous oxide to
nitric oxide emitted from soil. In: Oremland, R.S. (Ed.), Biogeochem-
istry of Global Change, Radioactively Active Trace Gases. Chapman &
Hall, New York, pp. 369–383.
Dendooven, L., Anderson, J.M., 1994. Dynamics of reduction enzymes
involved in the denitrification process in pasture soil. Soil Biology &
Biochemistry 26, 1501–1506.
Dick, R.P., 1992. A review: long-term effects of agricultural systems on soil
biochemical and microbial parameters. Agriculture, Ecosystems and
Environment 40, 25–36.
Dobbie, K.E., Smith, K.A., 2003. Impact of different forms of N fertilizer
on N2O emissions from intensive grassland. Nutrient Cycling in
Agroecosystems 67, 37–46.
Dobbie, K.E., McTaggart, I.P., Smith, K.A., 1999. Nitrous oxide emissions
from intensive agricultural systems: variations between crops and
seasons, key driving variables, and mean emission factors. Journal of
Geophysical Research 104, 26891–26899.
Edmeades, D.C., 2003. The long-term effects of manures and fertilizers on
soil productivity and quality: a review. Nutrient Cycling in Agroeco-
systems 66, 165–180.
Fan, X.H., 1995. Investigations on Nitrification and Denitrification
Potential in Agricultural Soils of China. A PhD dissertation of Institute
of Soil Science, Chinese Academy of Sciences, Nanjing, China.
Flessa, H., Beese, F., 1995. Effects of sugarbeet residues on soil redox
potential and nitrous oxide emission. Soil Science Society of America
Journal 59, 1044–1051.
Food and Agriculture Organization of the United Nations (FAO), 1998.
Fertilizer, FAO Yearbook, vol. 48. FAO, Rome, Italy.
Freney, J.R., Denmead, O.T., Simpson, J.R., 1979. Nitrous oxide emissions
from soil at low moisture contents. Soil Biology & Biochemistry 11,
167–173.
Garcia-Montiel, D.C., Melilo, J.M., Steudler, P.A., Cerri, C.C.,
Piccolo, M.C., 2003. Carbon limitations to nitrous oxide emissions in
a humid tropical forest of the Brazilian Amazon. Biology & Fertility of
Soils 38, 267–272.
Granli, T., Bøckman, O.C., 1994. Nitrous oxide from agriculture.
Norwegian Journal of Agricultural Science 12 (Suppl), 1–128.
Hadi, A., Inubushi, K., Puronomo, E., Razie, F., Yamakawa, K.,
Tsuruta, H., 2000. Effect of land-use changes on nitrous oxide
emission from tropical peatlands. Chemosphere-Global Change
Science 2, 347–358.
Haynes, R.J., Swift, R.S., Stephen, R.C., 1991. Influence of mixed cropping
rotations (pasture-arable) on organic matter content, water stable
aggregation and clod porosity in a group of soils. Soil and Tillage
Research 19, 77–87.
L. Meng et al. / Soil Biology & Biochemistry 37 (2005) 2037–2045 2045
Intergovernmental Panel on Climate Change (IPCC), 2000. IPCC Good
Practice Guidance and Uncertainty Management in National Green-
house Gas Inventories. IGES, Tokyo pp. 4.59–4.64.
Kaiser, E.A., Kohrs, K., Kucke, M., Schnug, E., Heinemeyer, O.,
Munch, J.C., 1998. Nitrous oxide release from arable soil: importance
of N-fertilization, crops and temporal variation. Soil Biology &
Biochemistry 30, 1553–1563.
Keener, H.M., Dick, W.A., Hoitink, H.A.J., 2000. Composting and
beneficial utilization of composted by-product materials. In:
Power, J.F., Dick, W.A. (Eds.), Land Application of Agricultural,
Industrial, and Municipal By-products. Soil Science Society of
America, Madison, WI, pp. 315–341.
Kroeze, C., Mosier, A., Bouwman, L., 1999. Closing the global N2O
budget: a retrospective analysis 1500–1994. Global Biogeochemical
Cycles 13, 1–8.
Malhi, S.S., McGill, W.B., Nyborg, M., 1990. Nitrate losses in soils: effects
of temperature, moisture and substrate concentration. Soil Biology &
Biochemistry 22, 733–737.
Maljanen, M., Liikanen, A., Silvola, J., Martikainen, P.J., 2003. Nitrous
oxide emissions from boreal organic soil under different land-use. Soil
Biology & Biochemistry 35, 689–700.
Mamo, M., Rosen, C.J., Hallbach, T.R., Moncrief, J.F., 1998. Corn yield
and nitrogen uptake in sandy soils amended with municipal solid waste
compost. Journal of Production Agriculture 11, 469–475.
McLaren, R.G., Cameron, K.C., 1996. Soil Science: Sustainable Production
and Environmental Protection. Oxford University Press, Auckland,
New Zealand.
McSorley, R., Gallaher, R.N., 1996. Effect of yard waste compost
on nematode densities and maize yield. Journal of Nematology 28,
655–660.
Mosier, A., Kroeze, C., Nevison, C., Oenema, O., Seitzinger, S., Van
Cleemput, O., 1998. Closing the global N2O budget: nitrous oxide
emissions through the agricultural nitrogen cycle. Nutrient Cycling in
Agroecosystems 52, 225–248.
Nykanen, H., Alm, J., Lang, K., Silvola, J., Martikainen, P.J., 1995.
Emissions of CH4, N2O and CO2 from a virgin fen and a fen drained for
grassland in Finland. Journal of Biogeography 22, 351–357.
Paustian, K., Collins, H.P., Paul, E.A., 1997. Management controls on soil
carbon. In: Paul, E.A., Paustian, K., Elliot, E.T., Cole, C.V. (Eds.), Soil
Organic Matter in Temperate Agroecosystems: Long-term Experiments
in North America. CRC Press, Boca Raton, FL, pp. 15–49.
Smith, K.A., McTaggart, I.P., Dobbie, K.E., Conen, F., 1998. Emissions of
N2O from Scottish agricultural soils as a function of fertilizer N.
Nutrient Cycling in Agroecosystems 52, 123–130.
Stratfon, M.L., Rechcigl, J.E., 1998. Organic muches, wood products and
composts as soil amendments and conditioners. In: Wallace, A.,
Terry, R.E. (Eds.), Handbook of Soil Conditioners. Marcel Dekker,
New York, NY, pp. 43–95.
Teepe, R., Brumme, R., Beese, F., 2000. Nitrous oxide from frozen soils
under agricultural, fallow and forest. Soil Biology & Biochemistry 32,
1807–1810.
Velthof, G.L., Oenema, O., Postma, R., Van Beutsichem, M.L., 1997.
Effects of type and amount of applied nitrogen fertilizer on nitrous
oxide fluxes from intensively managed grassland. Nutrient Cycling in
Agroecosystems 46, 257–267.
Velthof, G.L., Kuikman, P.J., Oenema, O., 2002. Nitrous oxide emission
from soils amended with crop residues. Nutrient Cycling in Agroeco-
systems 62, 249–261.
Xing, G.X., 1998. N2O emission from cropland in China. Nutrient Cycling
in Agroecosystems 52, 249–254.
Xing, G.X., Zhu, Z.L., 2001. The environmental consequences of altered
nitrogen cycling resulting from industrial activity, agricultural pro-
duction and population growth in China. In: Galloway, J., Cowling, E.,
Erisman, J.W., Wisniewski, J., Jordan, C. (Eds.), Optimizing Nitrogen
Management in Food and Energy Production and Environmental
Protection. A.A. Balkema, Tokyo, pp. 70–80.
Yang, X.M., Drury, C.F., Reynolds, W.D., Tan, C.S., McKenney, D.J.,
2003. Interactive effects of composts and liquid pig manure with added
nitrate on soil carbon dioxide and nitrous oxide emissions from soil
under aerobic and anaerobic conditions. Canadian Journal of Soil
Science 83, 343–352.
Zhu, Z.L., 1997. Fate and management of fertilizer nitrogen in
agro-ecosystems. In: Zhu, Z.L., Wen, Q.X., Freney, J.R. (Eds.),
Nitrogen in Soils of China. Kluwer Academic Publishers, Dordrecht,
pp. 239–279.