long-haul shipment optimization for less-than-truckload carriers
TRANSCRIPT
12
haul network has been studied extensively as an optimization prob-lem of terminal location and network design (2). O’Kelly developeda quadratic integer model to identify the optimal location of p hubsand the assignment of each flow between distribution centers (5).The model has been complemented by different authors providing newtechnique optimizations and improvements (6, 7). These approachesare based on a commodity flow approach without any tracking ofvehicle routes. The cost parameters of these models are estimated asan average value, and they do not consider the number of vehiclesor load factors. Identifying this fact, O’Kelly and Bryan proposeda variable unit cost depending on the percentage of flow shippedbetween two terminals (8).
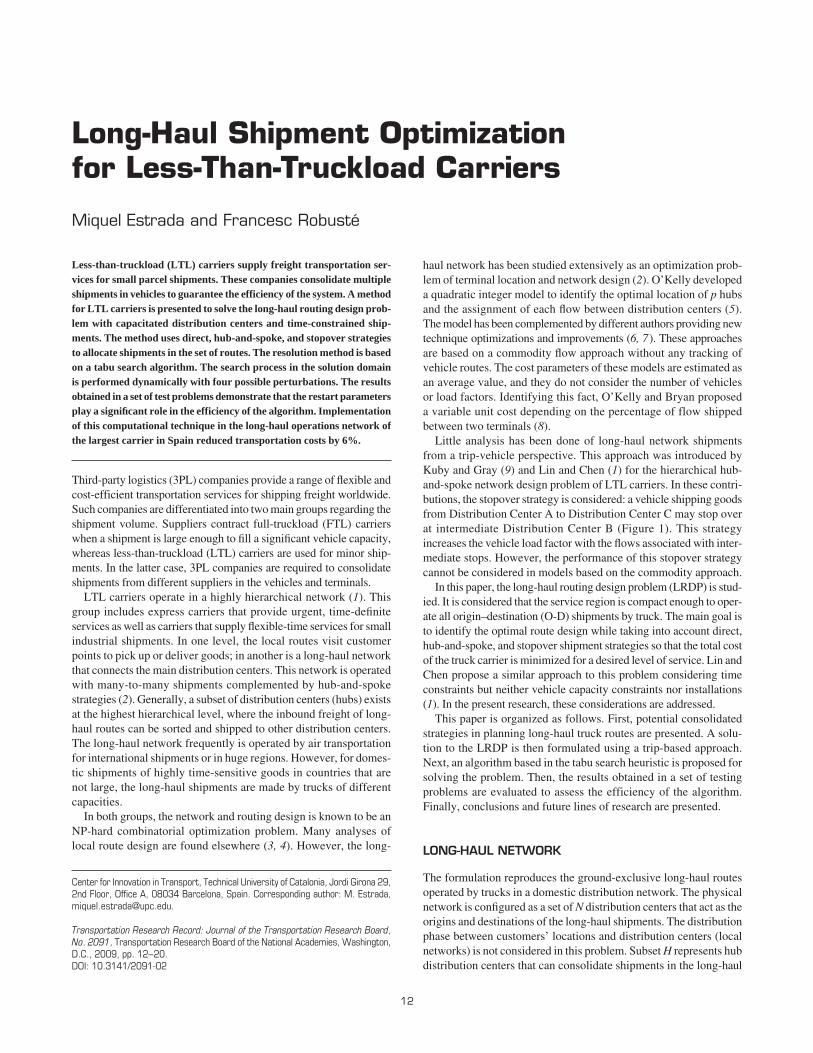
Little analysis has been done of long-haul network shipmentsfrom a trip-vehicle perspective. This approach was introduced byKuby and Gray (9) and Lin and Chen (1) for the hierarchical hub-and-spoke network design problem of LTL carriers. In these contri-butions, the stopover strategy is considered: a vehicle shipping goodsfrom Distribution Center A to Distribution Center C may stop overat intermediate Distribution Center B (Figure 1). This strategyincreases the vehicle load factor with the flows associated with inter-mediate stops. However, the performance of this stopover strategycannot be considered in models based on the commodity approach.
In this paper, the long-haul routing design problem (LRDP) is stud-ied. It is considered that the service region is compact enough to oper-ate all origin–destination (O-D) shipments by truck. The main goal isto identify the optimal route design while taking into account direct,hub-and-spoke, and stopover shipment strategies so that the total costof the truck carrier is minimized for a desired level of service. Lin andChen propose a similar approach to this problem considering timeconstraints but neither vehicle capacity constraints nor installations(1). In the present research, these considerations are addressed.
This paper is organized as follows. First, potential consolidatedstrategies in planning long-haul truck routes are presented. A solu-tion to the LRDP is then formulated using a trip-based approach.Next, an algorithm based in the tabu search heuristic is proposed forsolving the problem. Then, the results obtained in a set of testingproblems are evaluated to assess the efficiency of the algorithm.Finally, conclusions and future lines of research are presented.
LONG-HAUL NETWORK
The formulation reproduces the ground-exclusive long-haul routesoperated by trucks in a domestic distribution network. The physicalnetwork is configured as a set of N distribution centers that act as theorigins and destinations of the long-haul shipments. The distributionphase between customers’ locations and distribution centers (localnetworks) is not considered in this problem. Subset H represents hubdistribution centers that can consolidate shipments in the long-haul
Long-Haul Shipment Optimization for Less-Than-Truckload Carriers
Miquel Estrada and Francesc Robusté
Less-than-truckload (LTL) carriers supply freight transportation ser-vices for small parcel shipments. These companies consolidate multipleshipments in vehicles to guarantee the efficiency of the system. A methodfor LTL carriers is presented to solve the long-haul routing design prob-lem with capacitated distribution centers and time-constrained ship-ments. The method uses direct, hub-and-spoke, and stopover strategiesto allocate shipments in the set of routes. The resolution method is basedon a tabu search algorithm. The search process in the solution domainis performed dynamically with four possible perturbations. The resultsobtained in a set of test problems demonstrate that the restart parametersplay a significant role in the efficiency of the algorithm. Implementationof this computational technique in the long-haul operations network ofthe largest carrier in Spain reduced transportation costs by 6%.
Third-party logistics (3PL) companies provide a range of flexible andcost-efficient transportation services for shipping freight worldwide.Such companies are differentiated into two main groups regarding theshipment volume. Suppliers contract full-truckload (FTL) carrierswhen a shipment is large enough to fill a significant vehicle capacity,whereas less-than-truckload (LTL) carriers are used for minor ship-ments. In the latter case, 3PL companies are required to consolidateshipments from different suppliers in the vehicles and terminals.
LTL carriers operate in a highly hierarchical network (1). Thisgroup includes express carriers that provide urgent, time-definiteservices as well as carriers that supply flexible-time services for smallindustrial shipments. In one level, the local routes visit customerpoints to pick up or deliver goods; in another is a long-haul networkthat connects the main distribution centers. This network is operatedwith many-to-many shipments complemented by hub-and-spokestrategies (2). Generally, a subset of distribution centers (hubs) existsat the highest hierarchical level, where the inbound freight of long-haul routes can be sorted and shipped to other distribution centers.The long-haul network frequently is operated by air transportationfor international shipments or in huge regions. However, for domes-tic shipments of highly time-sensitive goods in countries that arenot large, the long-haul shipments are made by trucks of differentcapacities.
In both groups, the network and routing design is known to be anNP-hard combinatorial optimization problem. Many analyses oflocal route design are found elsewhere (3, 4). However, the long-
Center for Innovation in Transport, Technical University of Catalonia, Jordi Girona 29,2nd Floor, Office A, 08034 Barcelona, Spain. Corresponding author: M. Estrada,[email protected].
Transportation Research Record: Journal of the Transportation Research Board,No. 2091, Transportation Research Board of the National Academies, Washington,D.C., 2009, pp. 12–20.DOI: 10.3141/2091-02
network (⎟ H⎟ = h; H ⊆ N). Dij is the length of the link connecting eachdistribution center pair (i,j) and vij the constant speed between dis-tribution centers i, j, ∈ N. These links constitute the set A so thatthe long-haul transportation network can be represented by thecomplete graph G(N,A).
The long-haul demand flow between distribution centers i, j, ∈ Nis represented by the variable Wij. This flow is the aggregation ofshipments from all origins in the parcel associated with distribu-tion center i to all customer points served by distribution center j.The time headway of shipments between distribution centers, Pf, ishomogeneous in the whole physical system.
The operational cost depends on the number of vehicles and routesmade by the fleet and the handling operations performed at the ter-minals. In the former group, these costs are assessed by means of thecost of dispatching each vehicle (F, in euros [EUR]/day), the distanceunit cost (cd, in EUR/km), and the stopping cost (cs, in EUR/stop).The latter group is assessed by the transshipment volume–weightcost (ct,i, in EUR/m3 or EUR/ton) in each terminal, i ∈ H. The overallconstraints of the distribution problem are
• Vehicle capacity (C ) of a homogeneous fleet,• Operating time windows (h1,i; h2,i) of each distribution center
i ∈ N,• Customer’s delivery time within the period Pf, and• Finite number of loading and unloading docks in distribution
centers (mi).
Estrada and Robusté 13
If the aggregated demand between distribution centers (i,j) isgreater than capacity (Wij > C ), then two or more shipments are nec-essary. Therefore, the whole Wij demand is split into (nij − 1) ship-ments in a full load and one LTL shipment. The variable nij is definedin Equation 1, where the operator [x]+ means the upper integer valueof x. Hence, each shipment k (k = 1, . . . , nij) between nodes i and jis represented by the variable wk
ij (0 < wkij ≤ C ) so that Equation 2 is
verified. Each shipment with wkij > 0 is grouped in the set Ag.
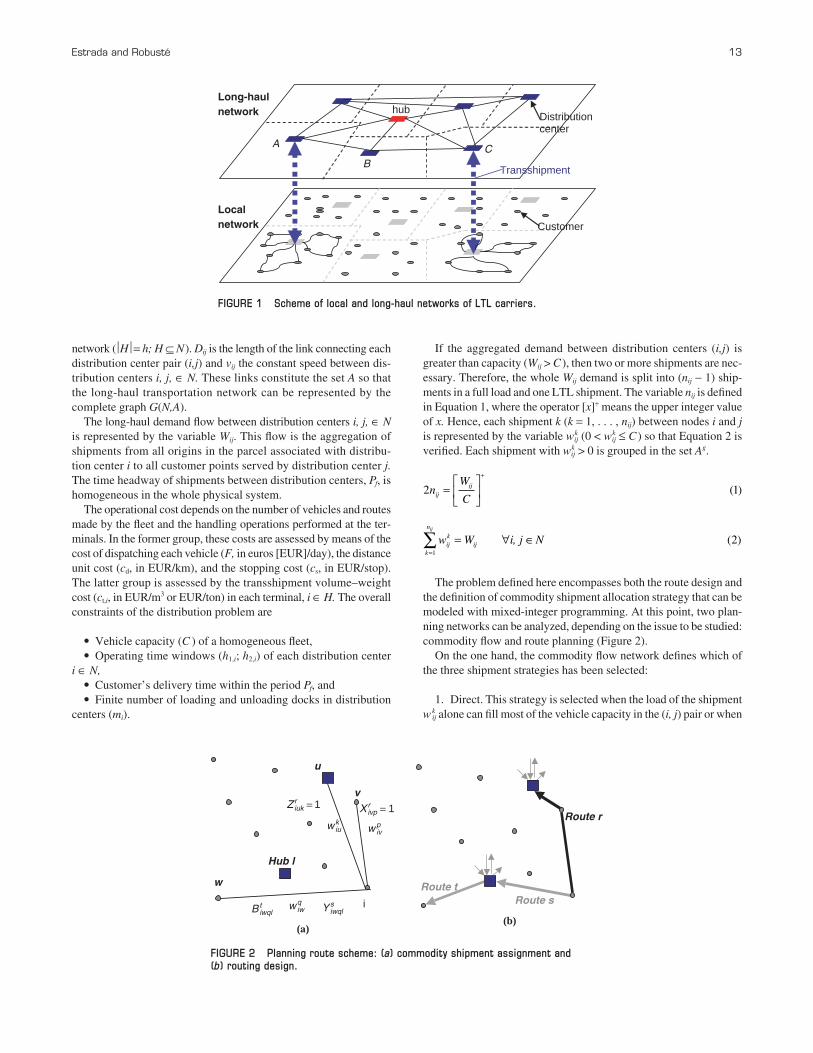
The problem defined here encompasses both the route design andthe definition of commodity shipment allocation strategy that can bemodeled with mixed-integer programming. At this point, two plan-ning networks can be analyzed, depending on the issue to be studied:commodity flow and route planning (Figure 2).
On the one hand, the commodity flow network defines which ofthe three shipment strategies has been selected:
1. Direct. This strategy is selected when the load of the shipmentwk
ij alone can fill most of the vehicle capacity in the (i, j) pair or when
w W i, j Nijk
k
n
ij
ij
=∑ = ∀ ∈
1
( )2
2 1nW
Cijij=
⎡
⎣⎢
⎤
⎦⎥
+
( )
Long-haulnetwork
Local network
A C B
Distributioncenter
Transshipment
Customer
hub
FIGURE 1 Scheme of local and long-haul networks of LTL carriers.
i
u
v
w
Hub l
wkiu w p
iv
wqiw
Xrivp = 1Zr
iuk = 1
Btiwql Ys
iwql
(a)
Route sRoute t
Route r
(b)
FIGURE 2 Planning route scheme: (a) commodity shipment assignment and (b) routing design.
consolidation strategies are not available. In this way, the freight isloaded at distribution center i in a vehicle covering any route r ∈ Rthat will carry it directly to destination j. The allocation of shipmentwk
ij in route r ∈ R with a direct strategy is identified by the semipositiveinteger variable Xr
ijk = 1.2. Hub-and-spoke. This strategy reduces the number of under-
utilized point-to-point direct loads. The shipment wkij is loaded at the
distribution center i in the vehicle of route s ∈ R and instead of goingdirectly to distribution center j, it is unloaded at the terminal l (l ∈ H).In this terminal, the shipment load wk
ij is sorted and reloaded in avehicle of another route t ∈ R that carries it to the final distributioncenter j. When the integer binary variable Ys
ijkl = 1, it determines thefirst phase of the transportation chain (distribution center i-hub)whereas Bt
ijkl = 1 indicates the transportation phase between hub l anddistribution center j.
3. Stopover. This strategy aims a vehicle load factor increase bymeans of the introduction of intermediate stops over direct trips. Inthis case, the integer variable Zr
ijk is equal to 1 if the shipment wkij is
allocated on a route r ∈ R stopping over intermediate nodes.
On the other hand, the route-planning network defines thesequence of br links that constitutes each route r ∈ R to serve thephysical demands within the service period Pf. Each arc b (b =1, . . . , br) is composed of a pair of nodes (i, j) that are grouped inthe set Lr. The integer variable Sr
ij,b is used to identify the relativeposition of nodes i,j ∈ N in the route r ∈ R. This variable is equal to 1 when i and j are the origin and destination nodes of link b(b = 1, . . . , br), respectively, and 0 in other cases. The relation-ship between two planning networks—that is, the tracing of ashipment wk
ij in the routing network—could be done by means ofvariables Iijk,b and Oijk,b′. The integer variable Iijk,b is equal to 1when wk
ij is shipped by link b of route r ∈ R and 0 in other cases.The shipment strategy may be direct (Xr
ijk = 1) or stopover (Z rijk = 1).
It also may be a hub-and-spoke strategy if the shipment is madebetween its origin i and the hub l (Iijkl = 1). When the shipment w k
ij
is made with a consolidation at hub l (hub-and-spoke strategy),the links b′ used to distribute its freight in the second transporta-tion phase (i.e., from hub l to distribution center j) are identifiedby the variable Oijk,b′.
MATHEMATICAL MODEL
The optimization of a carrier’s operation must consider the wholetransportation cost derived from the service supply. The objectivefunction presented in Equation 3 responds to the minimization ofdistribution costs of a carrier that uses direct, hub-and-spoke, andstopover strategies in a line-haul network. In this research, holdingand inventory costs associated with freight are not considered.
subject to
X ZY B
ijkr
ijkr ijko
rijkor
o Nr
+ ++⎛
⎝⎜⎞⎠⎟
⎛⎝⎜
⎞⎠⎟∈
∑ 2∈∈∑ = ∀ ∈
Rijk gw A1 ( )4
min,
,
Z
F c D S
c Y
d b ij br
j Ni Nb
b
t o
rr
r
11=
+ ( )
+
∈∈=∑∑∑
iijkor
ijk
o Nj Ni N
pb
b
w crrr
r
∈∈∈ =
+
∑∑∑ ∑+
⎛
⎝
⎜⎜⎜⎜
⎞
1
1
⎠⎠
⎟⎟⎟⎟
∈∑ ( )3r R
14 Transportation Research Record 2091
where
where
The terms of the objective function (Equation 3, from left to right)are the fixed cost of dispatching one vehicle, the costs that dependon the distance covered by any route, the handling costs at hubs, andthe costs associated with total stops made in each route r. According
X Z Y Bijkr
ijkr
ijkor
ijkor∈{ } ∈{ } ∈{ }0 1 0 1 0 1, ; , ; , ; ∈∈{ }
∈{ } ∈{ } ∈
0 1
0 1 0 1 0
, ;
, ; , ; ,, , ,I O Sijk b ijk b ij br 11
1 11
{ }∀ ∈ ∀ ∈ = ∀ ∈
;
, . . . , ( )r R w A b b o Hijk g
r
HT l S T S
b i v c jr s b
rbr
iv br
cs
, , , ,, * ,
*
=+( ) −1 if iij c
s,*( ) >⎧
⎨⎪
⎩⎪
0
0 otherwise
HT S T S
c i j b vs r c
sij cs
br
iv br
, , , ,*,
*, ,
=−∗1 if (( ) >⎧
⎨⎪
⎩⎪
0
0 otherwise
r R s H H mc i j b i vs r
b i v c i jr s∈ − { } ≤* (, , , , ,
*,, , , , ,, *
ii
i v Li j L
r
rs
s R b b c
−
∀ ∈ = =
∈( )∈∑∑∑ 1
1 1
)( , ),
* , . . . , , .. . . , ( )cs 10
∀ ∈ = = ∀ ∈
∀
r s R b b c b o H
w Y S
r s
ijk
ijk or
, , . . . , , . . . ,
,
1 1
iio br
ijk b ijk os
oj cs
ijk cI B S O, , , , ,; ( )= ={ }1 1 9
T lD
vu p Tb
rbr b
bbr
br
cs+ + + +
⎛⎝⎜
⎞⎠⎟
≤
Φijkrb
ijkr
ijk b ijkr
ijk b ijk bX I Z I I=
+ −( )+
−, , ,1 1
YY I I B Oijk or
ijk b ijk b ijkor
ijk b, , , ,1 11−⎡⎣ ⎤⎦ + −− IIijk bo N
, −∈
⎡⎣ ⎤⎦( )⎛⎝⎜
⎞⎠⎟
⎛
⎝
⎜⎜
⎞
⎠
⎟⎟∑ 1
u S wbr
ij br
j ijk
ijkrb
i j Lw A rijk g
=∈∈
∑∑ ,
( , )
τu, Φ
l S wbr
ij br
i ijk
ijkrb
i j Lw A rijk g
=( )∈∈∑∑ ,
,
τ l, Φ
h S T l uD
vpj ij b
rbr
br
br b
bbr
i j
1, ,* * * * *
( , )
≤ + + + + ≤∈LL
j
i j L
ij br
r
r r
h S
r R b b
∑ ∑∈
∀ ∈ =
2
1 8
,
( , )
,*
** , . . . , ( ))
h S T l h Si ij br
br
br
i j L
i ij br
ir1 2, ,
* *
( , )
, ,*
(
≤ + ≤∈
∑,, )
* , . . . , ( )j L
rr
r R b b∈
∑ ∀ ∈ = 1 7
w X I Z I Y Iijk
ijkr
ijk b ijkr
ijk b ijk or
ijk*
,*
, ,*
,+ + bb ijk or
ijk bo Nw A
B Oijk g
+( )⎛⎝⎜
⎞⎠⎟
⎛⎝⎜
⎞⎠⎟∀ ∈∈
∑ ,*
,∑∑ ≤
∀ ∈ =
C
r R b br* , . . . , ( )1 6
S S r R bjq br
j q L
ij br
i j Lr r,
( , )
,
( , )
,+∈ ∈
− = ∀ ∈ =∑ ∑1 0 1 .. . . , ( )br − 1 5
to Equation 4, each shipment w kij can be uniquely served by a single
shipment strategy. Equation 5 is a routing constraint that obliges twoconsecutive links to share the intermediate node.
The vehicle capacity constraint is pointed out in Equation 6, andEquations 7 and 8 refer to time constraints in routes and terminals.The variable Tr
b is the initial time of loading operations at the origindistribution center of link b on route r, the variable lr
b is the totalloading time at the origin distribution center of link b, and ur
b is theunloading time at the destination distribution center of link b onroute r ∈ R. Finally, the parameters τl
i and τui are the unit loading
and unloading times, respectively, at distribution center i ∈ N.Equation 9 specifies that an inbound route should arrive before an
outbound route at hub o ∈ H if they share a specific shipment with ahub-and-spoke strategy. Equation 10 states that the number of trucksloaded or unloaded in a specific time is less than the number of load-ing docks at a distribution center. Finally, all decision variables arebinary, according to Equation 11.
These formulations are more complex than those expressed byAykin about hub location or freight route design problems becauseof the trip-based approach (6 ). In this case, both fleet size and thespecific routing design must be determined to meet the temporal andcapacity constraints (of vehicles and distribution centers) (10).
SOLUTION ALGORITHM
The resolution approach followed in this research is based on aheuristic algorithm based on tabu search. Exact resolution techniques(enumeration, or branch and bound) cannot obtain the optimal solu-tions in large problems because of computational capacity. Addi-tionally, Lagrangean relaxation approaches provide a lower boundto optimality but may not meet some constraints, resulting in aninfeasible solution.
The proposed algorithm determines feasible solutions and is struc-tured in three sequential levels depending on the nature of the ship-ment. In Level 1, each shipment with an associated load w k
ij = C isserved with a direct shipment strategy. In Level 2, a direct heuristiccalled LESS-TL is proposed to allocate LTL shipments to the fleet,considering the routes generated in Level 1. Finally, in Level 3, afine-tuning process is developed by using an adaptation of the tabusearch optimization technique.
Level 1. Heuristic FULL-TL
All shipments wkij = C are ordered decreasingly regarding the distance
Dij between distribution centers i, j ∈ N. Starting from the shipmentswith higher Dij, the heuristic FULL-TL analyzes the possibility to addthe shipment w k
ij at the end of existing route. If there is any route r* ∈ R for which its last distribution center is equal to the origin nodeof shipment wk
ij (node i) and time constraints are satisfied, the heuris-tic creates a new link at the end of the route r*. In other cases, theshipment wk
ij generates a new route ( �R � = �R �+ 1) unless it violatesany of the Equations 6 through 10. Finalizing this process creates aset of Rc routes and assigns a set of AC of full shipments.
Level 2. Heuristic LESS-TL
The LESS-TL algorithm uses hub-and-spoke and stopover strate-gies (in addition to traditional direct shipping) to address the two-
Estrada and Robusté 15
dimensional problem of shipment assignment and route construction.In this case, the direct strategy for a shipment w k
ij < C can show twovariations: direct strategy at the end of an existent route or directstrategy creating a new route. The LESS-TL algorithm is an iterativeprocedure that assigns shipments in the set AF = A − AC depending onthe marginal cost of each strategy and the feasibility of its inclusioninto new or existing routes. The LESS-TL algorithm operates asdescribed in the following steps.
1. List shipments in decreasing order depending on load w kij.Create
a new set of shipments AF* = AF and set k = 0.2. Update q = q + 1. The w k
ij shipment placed in the qth positionin set AF* is selected. The feasibility to assign wk
ij with the availableshipment strategies is verified. In each strategy, the route r* (and itscomplementary s* in the hub-and-spoke strategy) that minimizes themarginal cost of transportation and verifies Equations 4 through 10 is identified. If it exists, the extra costs to add the shipment withdirect strategy (Δc1), stopover strategy in distribution center m ∈ N(Δc2), and hub-and-spoke strategy at hub o ∈ H (Δc3) are assessedby Equations 12 through 14.
3. Choose the strategy for the qth shipment wkij that minimizes the
marginal transportation cost (i.e., ).
4. If the shipment strategy of Step 3 implies the creation of a newroute r* or s* (direct or hub-and-spoke strategy, respectively), thenR = R∪{r} or R = R∪{s}.
5. Update the distribution times (T, lb, ub); the decision variable(X r
ijk = 1 or Z rijk = 1 or Y r
ijk,o = 1, B sijk,o = 1, depending on the strategy
chosen); and the variables (Iijk,b, Oijk,b′) and Srij,b = 1, S s
ij,b′ = 1 = 1 toassign the nodes i,j ∈ N to the link b in route r or the link b′ inroute s, respectively.
6. Update the total cost.7. If q = �AF �, STOP. In other cases, go to Step 2.
Level 3. Tabu Search Algorithm
To solve the line-haul routing problem, this research used the tabusearch algorithm, adapting the work of Glover and Laguna (11) andGolden et al. (12). The iterative tabu search procedure proposed byGlover and Laguna defines at each iteration k a set M(x) of potentialmovements or perturbations that modify the attributes of the currentsolution x (11). The implementation of M(x) to the solution x gener-ates the neighborhood N*(x), where the solution of minimum costx ′ ∈ N*(x) will be selected for the next iteration k + 1. If f is the costfunction ( f : X → ℜ), then the search in N*(x) may consider a solutionx ′ with f (x ′) > f(x) as well as infeasible solutions x ′ that violates theconstraints of the problem. Moreover, the subset TL (TL ⊂ M) of thosemovements that modify attributes altered in the recent iterations is
mini ic= { }1 2 3, , Δ
Δc
c w r* R s* R
c w c D
o ijk
o ijk
i3 =
( ) ∈ ∈
( ) +
t,
t, d
if ,
,,
,
,h
o ijk
h j
F c r* R s* R
c w c D F
+ +[ ] ∉ ∈
( ) + +
2 s
t, d
if
++⎡⎣ ⎤⎦ ∈ ∉
⎧
⎨⎪⎪
⎩⎪⎪ 2
14
c r* s Rs if R *,
( )
Δc c D D Dim mj ij2 = + + −s (13)
Δc c D c F cr R
rij1
0= + + +[ ] =
∈d s s
if *
1 ifδ δ
** ∉
⎧⎨⎪
⎩⎪ R( )12
prohibited (tabu). These movements are not allowed to avoid acyclic behavior of the algorithm. In addition, a diversification mech-anism is implemented to reduce the likelihood of being trapped in alocal optimum.
Neighborhood Structure
A main important part of the procedure is defining the attributes thatconstitute the solution domain X and the movements M(x). A gen-eral solution x ∈ X is defined by the set of variables U(x) = {Xr
ijk, Zrijk,
Yrijk,o, Br
ijk,o} that determines the sort of shipment strategy and the setof variables V(x) = {S r
ij,b, I ijk,b, Oijk,b′} that defines each route segmentfor each shipment w k
ij ∈ Ag and route r ∈ R. The M(x) movementsconsidered in this process are
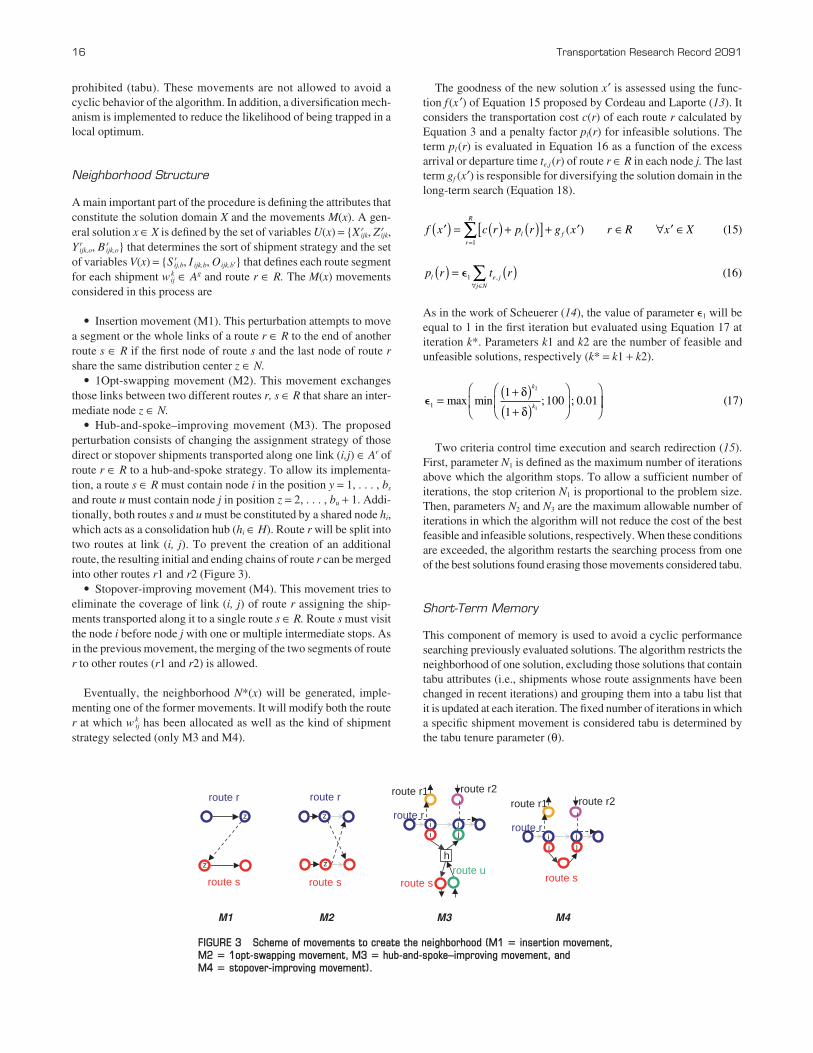
• Insertion movement (M1). This perturbation attempts to movea segment or the whole links of a route r ∈ R to the end of anotherroute s ∈ R if the first node of route s and the last node of route rshare the same distribution center z ∈ N.
• 1Opt-swapping movement (M2). This movement exchangesthose links between two different routes r, s ∈ R that share an inter-mediate node z ∈ N.
• Hub-and-spoke–improving movement (M3). The proposedperturbation consists of changing the assignment strategy of thosedirect or stopover shipments transported along one link (i,j) ∈ Ar ofroute r ∈ R to a hub-and-spoke strategy. To allow its implementa-tion, a route s ∈ R must contain node i in the position y = 1, . . . , bs
and route u must contain node j in position z = 2, . . . , bu + 1. Addi-tionally, both routes s and u must be constituted by a shared node hi,which acts as a consolidation hub (hi ∈ H). Route r will be split intotwo routes at link (i, j). To prevent the creation of an additionalroute, the resulting initial and ending chains of route r can be mergedinto other routes r1 and r2 (Figure 3).
• Stopover-improving movement (M4). This movement tries toeliminate the coverage of link (i, j) of route r assigning the ship-ments transported along it to a single route s ∈ R. Route s must visitthe node i before node j with one or multiple intermediate stops. Asin the previous movement, the merging of the two segments of router to other routes (r1 and r2) is allowed.
Eventually, the neighborhood N*(x) will be generated, imple-menting one of the former movements. It will modify both the router at which w k
ij has been allocated as well as the kind of shipmentstrategy selected (only M3 and M4).
16 Transportation Research Record 2091
The goodness of the new solution x′ is assessed using the func-tion f(x ′) of Equation 15 proposed by Cordeau and Laporte (13). Itconsiders the transportation cost c(r) of each route r calculated byEquation 3 and a penalty factor pl(r) for infeasible solutions. Theterm pl (r) is evaluated in Equation 16 as a function of the excessarrival or departure time te,j (r) of route r ∈ R in each node j. The lastterm gf (x′) is responsible for diversifying the solution domain in thelong-term search (Equation 18).
As in the work of Scheuerer (14), the value of parameter �1 will beequal to 1 in the first iteration but evaluated using Equation 17 atiteration k*. Parameters k1 and k2 are the number of feasible andunfeasible solutions, respectively (k* = k1 + k2).
Two criteria control time execution and search redirection (15).First, parameter N1 is defined as the maximum number of iterationsabove which the algorithm stops. To allow a sufficient number ofiterations, the stop criterion N1 is proportional to the problem size.Then, parameters N2 and N3 are the maximum allowable number ofiterations in which the algorithm will not reduce the cost of the bestfeasible and infeasible solutions, respectively. When these conditionsare exceeded, the algorithm restarts the searching process from oneof the best solutions found erasing those movements considered tabu.
Short-Term Memory
This component of memory is used to avoid a cyclic performancesearching previously evaluated solutions. The algorithm restricts theneighborhood of one solution, excluding those solutions that containtabu attributes (i.e., shipments whose route assignments have beenchanged in recent iterations) and grouping them into a tabu list thatit is updated at each iteration. The fixed number of iterations in whicha specific shipment movement is considered tabu is determined bythe tabu tenure parameter (θ).
�1
1
1100 0 01
2
1=
+( )+( )
⎛
⎝⎜
⎞
⎠⎟
⎛
⎝⎜
⎞
⎠max min ; ; .
δ
δ
k
k ⎟⎟ ( )17
p r t rl e jj N
( ) = ( )∀ ∈∑�1 16, ( )
f x c r p r g x r R x Xlr
R
f′( ) = ( ) + ( )[ ] + ′ ∈ ∀ ′ ∈=
∑1
15( ) ( )
M1 M2 M3 M4
route r
route s
z
z
route r
route s
z
z
route r1
route r
route s
i
h
i jj
route u
route r2
route s
route r1
route rii j
j
route r2
FIGURE 3 Scheme of movements to create the neighborhood (M1 � insertion movement,M2 � 1opt-swapping movement, M3 � hub-and-spoke–improving movement, and M4 � stopover-improving movement).
Long-Term Memory
The long-term memory component is used to diversify the search-ing process into solution domains that have not yet been explored.This process is conducted as a function of the repetition frequencyof the attributes contained in the solution. It is one of the most rele-vant components of the tabu search procedure to obtain good solu-tions. The diversification criterion is based on the work of Scheuerer(14), Cordeau et al. (16 ), and Crevier et al. (17 ). It establishes thateach solution x ′ ∈ N*(x) verifying f(x′) > f(x) is penalized with anextra cost factor gf(x ′):
where
λ = current number of iterations,N = number of distribution centers,
⎟ R⎟ = total number of routes,l = number of candidate shipments to be moved,
c(x′) = actual cost of the problem evaluated by Equation 3,ρijkr = number of iterations that shipment wk
ij is added or removedfrom route r, and
γ = a factor to be calibrated.
Aspiration Criteria
This component obliges each solution with the minimum cost withinthe process to be adopted as a current solution, regardless of the tabustatus of their attributes. It is a flexible procedure to focus the searchon low-cost solutions, even though they present attributes recentlymodified.
g xN R l c x f x f x
ff
ijkr
′( ) =′( ) ′( ) > ( )γ
ρλ
i if
0 if ′′( ) ≤ ( )
⎧
⎨⎪
⎩⎪ x f x
( )18
Estrada and Robusté 17
COMPUTATIONAL RESULTS
In this research, a set of different problems was randomly generatedto calibrate the algorithm and assess its efficiency. The algorithmwas implemented in the set of problems using several values of theN2, N3, γ, and θ parameters that constitute 180 simulation instances.The parameters that rule the restart process (i.e., N2 and N3) mostaffected algorithm efficiency. The best solutions were obtainedwhen N2 = N3 < 0.8N. The adoption of N2 = N3 > 2N results in anoverestimation of total cost because of the availability of too manyiterations without improving the best solution. In particular, the con-dition N2 = N3 < 35 is sufficient to allow the exploration in morecostly configurations and overpass local optimal solutions.
Moreover, the tabu tenure parameter (θ) does not significantlyalter the goodness of this solution. The suggested value of θ = 100provides the best results. Apart from that, the effect of parameter γ inEquation 18 is not as important as the effect of the restart parameters.The range γ = (0.1, 0.3) produced the best results.
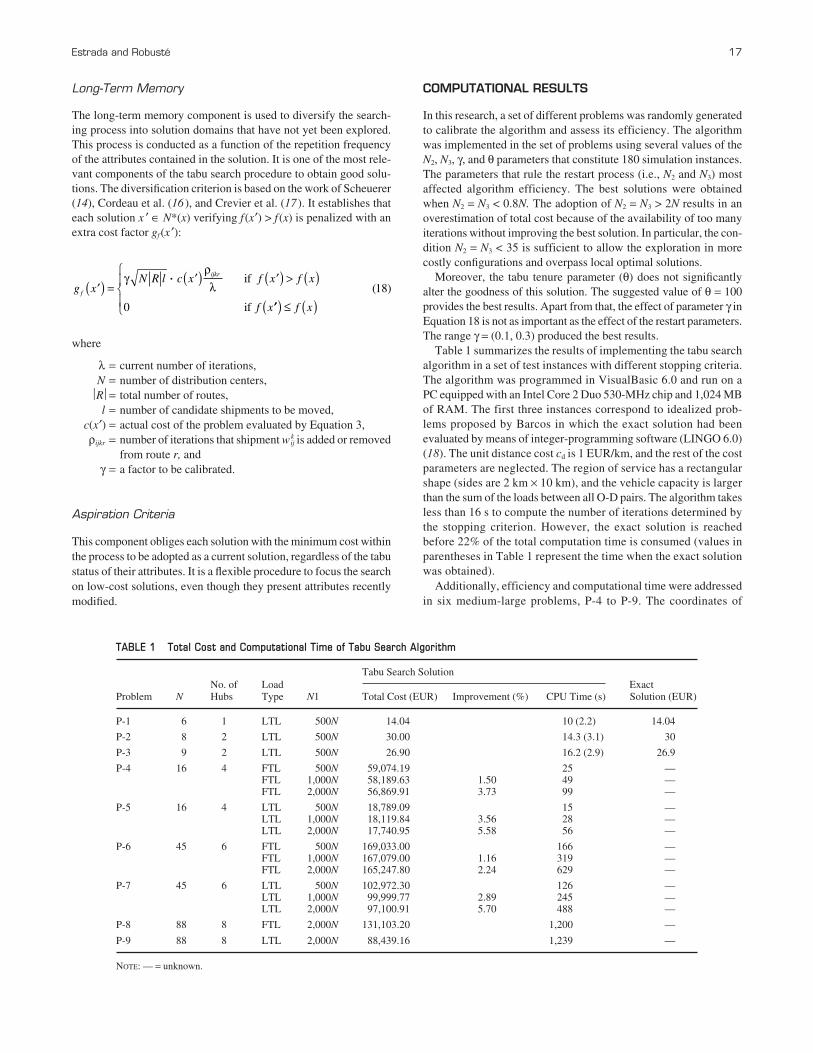
Table 1 summarizes the results of implementing the tabu searchalgorithm in a set of test instances with different stopping criteria.The algorithm was programmed in VisualBasic 6.0 and run on aPC equipped with an Intel Core 2 Duo 530-MHz chip and 1,024 MBof RAM. The first three instances correspond to idealized prob-lems proposed by Barcos in which the exact solution had beenevaluated by means of integer-programming software (LINGO 6.0)(18). The unit distance cost cd is 1 EUR/km, and the rest of the costparameters are neglected. The region of service has a rectangularshape (sides are 2 km × 10 km), and the vehicle capacity is largerthan the sum of the loads between all O-D pairs. The algorithm takesless than 16 s to compute the number of iterations determined bythe stopping criterion. However, the exact solution is reachedbefore 22% of the total computation time is consumed (values inparentheses in Table 1 represent the time when the exact solutionwas obtained).
Additionally, efficiency and computational time were addressedin six medium-large problems, P-4 to P-9. The coordinates of
TABLE 1 Total Cost and Computational Time of Tabu Search Algorithm
No. of LoadTabu Search Solution
ExactProblem N Hubs Type N1 Total Cost (EUR) Improvement (%) CPU Time (s) Solution (EUR)
P-1 6 1 LTL 500N 14.04 10 (2.2) 14.04
P-2 8 2 LTL 500N 30.00 14.3 (3.1) 30
P-3 9 2 LTL 500N 26.90 16.2 (2.9) 26.9
P-4 16 4 FTL 500N 59,074.19 25 —FTL 1,000N 58,189.63 1.50 49 —FTL 2,000N 56,869.91 3.73 99 —
P-5 16 4 LTL 500N 18,789.09 15 —LTL 1,000N 18,119.84 3.56 28 —LTL 2,000N 17,740.95 5.58 56 —
P-6 45 6 FTL 500N 169,033.00 166 —FTL 1,000N 167,079.00 1.16 319 —FTL 2,000N 165,247.80 2.24 629 —
P-7 45 6 LTL 500N 102,972.30 126 —LTL 1,000N 99,999.77 2.89 245 —LTL 2,000N 97,100.91 5.70 488 —
P-8 88 8 FTL 2,000N 131,103.20 1,200 —
P-9 88 8 LTL 2,000N 88,439.16 1,239 —
NOTE: — = unknown.
distribution centers were randomly scattered in a square regionwith side lengths ranging from 500 to 1,000 km. Fleet speed (ve)was assumed to be 80 km/h on all arcs. Moreover, homogeneousdelivery time was 12 h in the region, and loading and unload-ing unit time were constant (τl = 0.01 h/m3 and τu = 0.005 h/m3,∀i = 1, . . . , N ). The shipment size was distributed uniformly inthe domain [0,10] m3 for LTL problems and [0,100] m3 for FTLproblems with a vehicle capacity of 80 m3. Results were calcu-lated using the following parameters: F = 260 EUR/vehicle day,cd = 0.40 EUR/km, cs = 15 EUR/stop, ct = 10 EUR/m3, θ = 100, γ = 0.1, and N2 = N3 = 0.8N. The use of integer programming soft-ware was not addressed because of an excessive number of variablesand constraints.
The results of the tabu search algorithm highlight the variationin its performance efficiency depending on load type. In FTL prob-lems, fewer feasible shipment combinations are possible to opti-mize the vehicle load to satisfy capacity constraints. This fact givesa limited cost reduction (<2.3%) when the stopping criterion ischanged from N1 = 500N to 2,000N iterations. However, the opti-mization tool provides a higher improvement in LTL instanceswhen N1 is extended. In these problems, larger stopping criteria arerecommended to overcome the higher probability of complementaryshipment consolidation.
18 Transportation Research Record 2091
Sensitivity Analysis
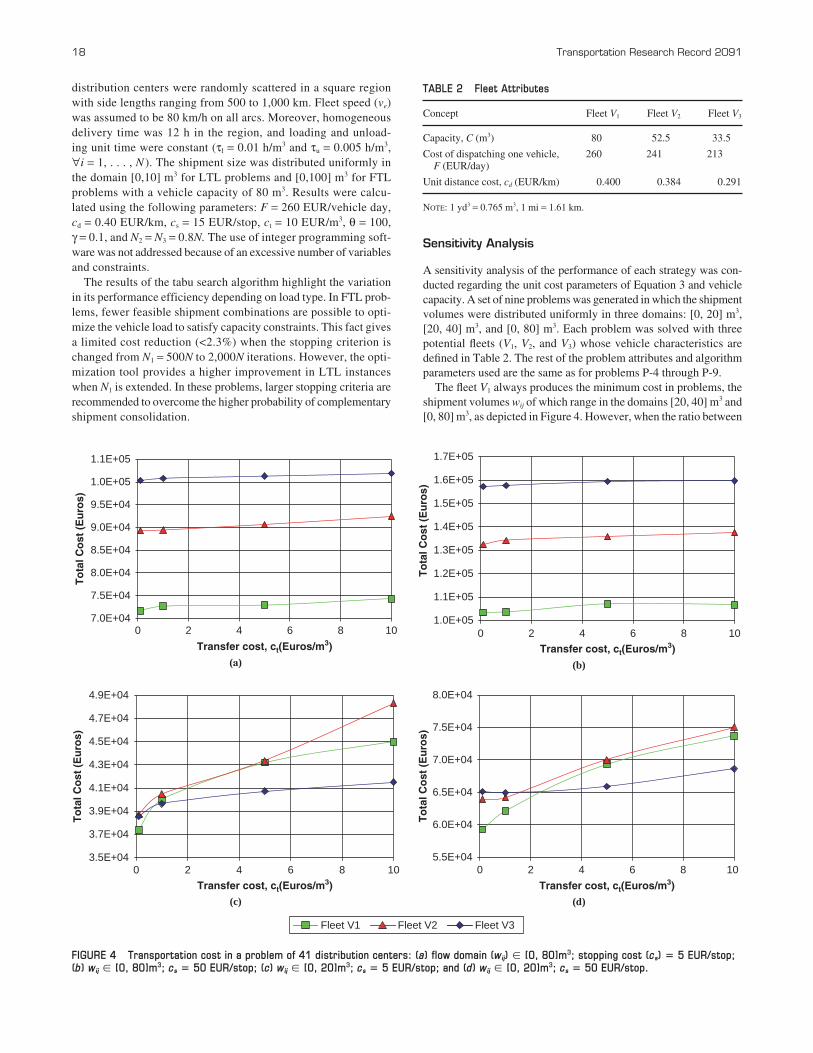
A sensitivity analysis of the performance of each strategy was con-ducted regarding the unit cost parameters of Equation 3 and vehiclecapacity. A set of nine problems was generated in which the shipmentvolumes were distributed uniformly in three domains: [0, 20] m3,[20, 40] m3, and [0, 80] m3. Each problem was solved with threepotential fleets (V1, V2, and V3) whose vehicle characteristics aredefined in Table 2. The rest of the problem attributes and algorithmparameters used are the same as for problems P-4 through P-9.
The fleet V1 always produces the minimum cost in problems, theshipment volumes wij of which range in the domains [20, 40] m3 and[0, 80] m3, as depicted in Figure 4. However, when the ratio between
TABLE 2 Fleet Attributes
Concept Fleet V1 Fleet V2 Fleet V3
Capacity, C (m3) 80 52.5 33.5
Cost of dispatching one vehicle, 260 241 213F (EUR/day)
Unit distance cost, cd (EUR/km) 0.400 0.384 0.291
NOTE: 1 yd3 = 0.765 m3, 1 mi = 1.61 km.
(a)
7.0E+04
7.5E+04
8.0E+04
8.5E+04
9.0E+04
9.5E+04
1.0E+05
1.1E+05
0 2 4 6 8 10
Transfer cost, ct(Euros/m3)
To
tal C
ost
(E
uro
s)
(b)
0 2 4 6 8 10
Transfer cost, ct(Euros/m3)
1.0E+05
1.1E+05
1.2E+05
1.3E+05
1.4E+05
1.5E+05
1.6E+05
1.7E+05
To
tal C
ost
(E
uro
s)
(c)
0 2 4 6 8 10
Transfer cost, ct(Euros/m3)
3.5E+04
3.7E+04
3.9E+04
4.1E+04
4.3E+04
4.5E+04
4.7E+04
4.9E+04
To
tal C
ost
(E
uro
s)
(d)
0 2 4 6 8 10
Transfer cost, ct(Euros/m3)
5.5E+04
6.0E+04
6.5E+04
7.0E+04
7.5E+04
8.0E+04
To
tal C
ost
(E
uro
s)
Fleet V1 Fleet V2 Fleet V3
FIGURE 4 Transportation cost in a problem of 41 distribution centers: (a) flow domain (w i j) � [0, 80]m3; stopping cost (cs) � 5 EUR/stop;(b) w i j � [0, 80]m3; cs � 50 EUR/stop; (c) w i j � [0, 20]m3; cs � 5 EUR/stop; and (d) w i j � [0, 20]m3; cs � 50 EUR/stop.
average shipment volume and vehicle capacity decreases, the con-solidation possibilities must be sufficient to fill the underutilizedcapacity with further shipments and justify the adoption of vehicleswith greater unit cost. This effect can be identified in problems withshipment volumes wij ∈ [0,20] m3, such as depicted in Figure 4. Inthis context, the fleet V3 (33.5 m3) is the most efficient, especiallyfor ct > 1 EUR/m3.
Nevertheless, when hub-and-spoke strategy is not penalized witha higher transfer cost (ct < 1 EUR/m3), fleets with greater capacity(V1 and V2) become more attractive because they allow the trans-portation of multiple-shipment loads. Additionally, the efficiencyimprovement of fleets V1 and V2 when ct < 1 EUR/m3 is more impor-tant for high values of stopping cost cs because the high stoppingcost significantly limits the implementation of a stopover strategy.Consolidation at a hub is the only available strategy to increase theload factor in these situations, and it is much more sensible thanvariations of ct when the stopping cost cs is 50 EUR/stop.
Network and Route Optimization of a Real Carrier
The proposed optimization model was implemented by one of thelargest line-haul freight carriers serving Spain and Portugal. Thisimplementation was focused on ground-exclusive domestic 1-dayservices. The carrier provided a complete list of the number of ship-ments (volume and freight) to be distributed in the same day amongO-D distribution centers as well as the vehicles and routes used inthe long-haul network. The company owns a total of 56 distributioncenters in a region of approximately 600,000 km2.
Estrada and Robusté 19
Each facility presents numerous (10 to 34) loading and unloadingdocks for long-haul fleets. However, a fleet of type V1 (Table 2) isused to operate the line-haul network. The operational service isgenerally provided between 7 pm and 7 am, allocating the rest of thetime for pickups and deliveries on the local network. The cost param-eters considered in the optimization were cs = 15 EUR/stop and ct = 2 EUR/m3. It is assumed that the average speed of vehicles is80 km/h and both unit loading and unloading times in the distributioncenters are 0.005 EUR/h-m3.
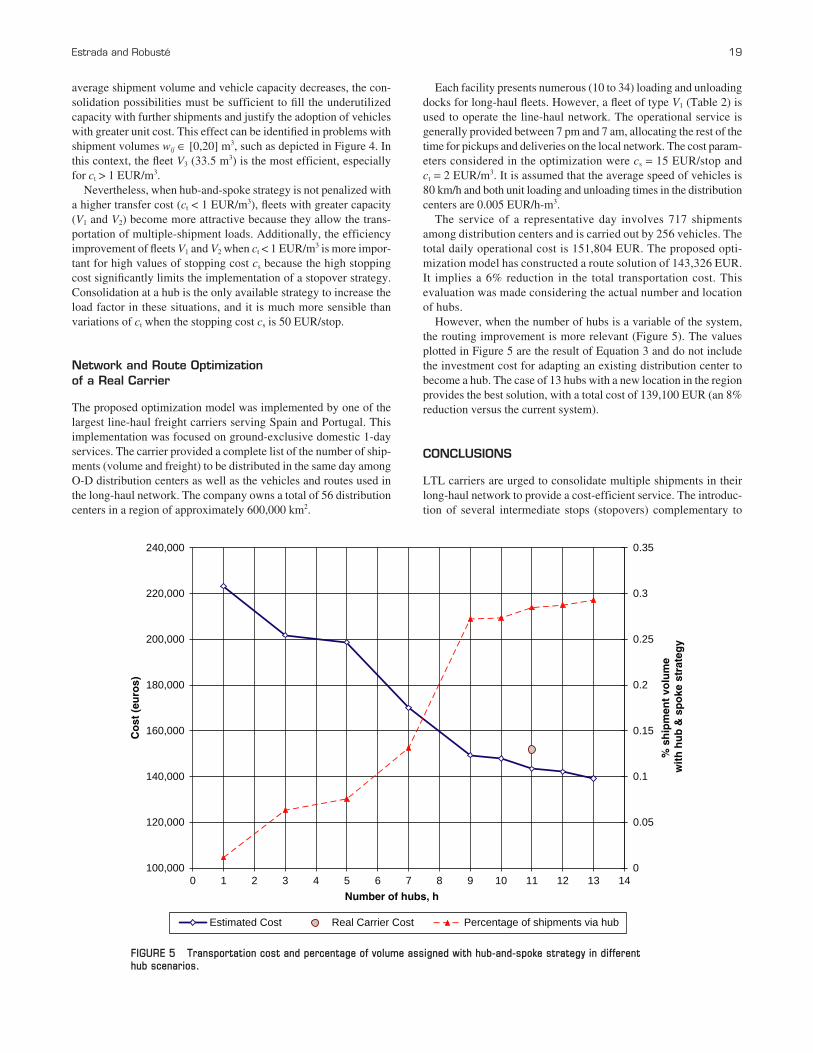
The service of a representative day involves 717 shipmentsamong distribution centers and is carried out by 256 vehicles. Thetotal daily operational cost is 151,804 EUR. The proposed opti-mization model has constructed a route solution of 143,326 EUR.It implies a 6% reduction in the total transportation cost. Thisevaluation was made considering the actual number and locationof hubs.
However, when the number of hubs is a variable of the system,the routing improvement is more relevant (Figure 5). The valuesplotted in Figure 5 are the result of Equation 3 and do not includethe investment cost for adapting an existing distribution center tobecome a hub. The case of 13 hubs with a new location in the regionprovides the best solution, with a total cost of 139,100 EUR (an 8%reduction versus the current system).
CONCLUSIONS
LTL carriers are urged to consolidate multiple shipments in theirlong-haul network to provide a cost-efficient service. The introduc-tion of several intermediate stops (stopovers) complementary to
100,000
120,000
140,000
160,000
180,000
200,000
220,000
240,000
0 1 2 3 4 5 6 7 8 9 10 11 12 13 14
Number of hubs, h
Co
st (
euro
s)
0
0.05
0.1
0.15
0.2
0.25
0.3
0.35
% s
hip
men
t vo
lum
e w
ith
hu
b &
sp
oke
str
ateg
y
Estimated Cost Real Carrier Cost Percentage of shipments via hub
FIGURE 5 Transportation cost and percentage of volume assigned with hub-and-spoke strategy in different hub scenarios.
hub-and-spoke operations on a particular route may reduce the totalsystem cost.
An optimization tool was proposed for the line-haul route designproblem with capacitated hubs and tight time constraints consideringdirect, hub-and-spoke, and stopover strategies. The solution tech-nique is based on the tabu search algorithm. Numerical test resultsindicated that the most influencing factors are the restart parametersand the diversification criterion. The results justify the suitability ofthis method for the route design of line-haul carriers. Implementationof the model to serve the domestic demands of a particular carrier hasreduced operational costs by 6%. Future research may address fleetbalancing and repositioning in a set of consecutive days.
REFERENCES
1. Lin, C.-C., and S.-H. Chen. The Hierarchical Network Design Problemfor Time-Definite Express Common Carriers. In Transportation Research,Part B, Vol. 38, No. 3, 2004, pp. 271–283.
2. Crainic, T. Long-Haul Freight Transportation. In Handbook in Trans-portation Science, 2nd ed. (Randolph W. Hall, ed.), Kluwer AcademicPublishers, Boston, Mass., 2003.
3. Golden, B. L., and A. A. Assad (eds.). Vehicle Routing: Methods andStudies. North-Holland, Amsterdam, Netherlands, 1988.
4. Robusté, F., C. F. Daganzo, and R. R. Souleyrette. Implementing Vehi-cle Routing Models. In Transportation Research, Part B, Vol. 24, No. 4,1990, pp. 263–286.
5. O’Kelly, M. E. The Location of Interacting Hub Facilities. TransportationScience, Vol. 20, No. 2, 1986, pp. 92–106.
6. Aykin, T. The Hub Location and Routing Problems. In European Journalof Operational Research, Vol. 83, No. 1, 1995, pp. 200–219.
7. Campbell, J. F. Hub Location and the P-Hub Median Problem. InOperations Research, Vol. 44, No. 6, 1996, pp. 923–935.
20 Transportation Research Record 2091
8. O’Kelly, M. E., and D. L. Bryan. Hub Location with Flow Economiesof Scale. In Transportation Research, Part B, Vol. 32, No. 8, 1998,pp. 605–616.
9. Kuby, M. J., and R. G. Gray. The Hub Network Design Problem withStopovers and Feeders: The Case of Federal Express. In TransportationResearch, Part A, Vol. 27, No. 1, 1993, pp. 1–12.
10. Desaulniers, G., J. Desrosiers, I. Ioachim, M. M. Solomon, F. Soumis, andD. Villeneuve. A Unified Framework for Deterministic Time ConstrainedVehicle Routing and Crew Scheduling Problems. In Fleet Managementand Logistics (T. G. Crainic and G. Laporte, eds.), Kluwer AcademicPublishers, Boston, Mass., 1998.
11. Glover, F., and M. Laguna. Tabu Search. Kluwer Academic Publishers,Boston, Mass., 1997.
12. Golden, B. L., E. A. Wasil, J. P. Kelly, and I.-M. Chao. The Impactof Metaheuristics on Solving the Vehicle Routing Problem: Algorithms,Problem Sets, and Computational Results. In Fleet Management andLogistics (T. G. Crainic and G. Laporte, eds.), Kluwer AcademicPublishers, Boston, Mass., 1998.
13. Cordeau, J. F., and G. Laporte. A Tabu Search Heuristic for the StaticMulti-Vehicle Dial-a-Ride Problem. In Transportation Research, Part B,Vol. 37, No. 3, 2003, pp. 579–594.
14. Scheuerer, S. A Tabu Search Heuristic for the Truck and Trailer Rout-ing Problem. In Computers and Operations Research, Vol. 33, No. 4,2006, pp. 894–909.
15. Brandão, J. A New Tabu Search Algorithm for the Vehicle Routing Prob-lem with Backhauls. In European Journal of Operational Research,Vol. 173, No. 2, 2006, pp. 540–555.
16. Cordeau, J.-F., M. Gendreau, and G. Laporte. A Tabu Search Heuristicfor Periodic and Multidepot Vehicle Routing Problems. In Networks,Vol. 30, No. 2, 1997, pp. 105–119.
17. Crevier, B., J. F. Cordeau, and G. Laporte. The Multi-Depot Vehicle Rout-ing Problem with Inter-Depot Routes. In European Journal of OperationalResearch, Vol. 176, No. 2, 2007, pp. 756–773.
18. Barcos, L. Ant Colony Optimization of Freight Shipments in Many-to-Many Networks. PhD thesis. Navarra University, Pamplona, Spain, 2002.
The Transportation Network Modeling Committee sponsored publication of this paper.