london tourist destination marketing roi case study
TRANSCRIPT
Some extracts from a recent key destination
Media Mix Model
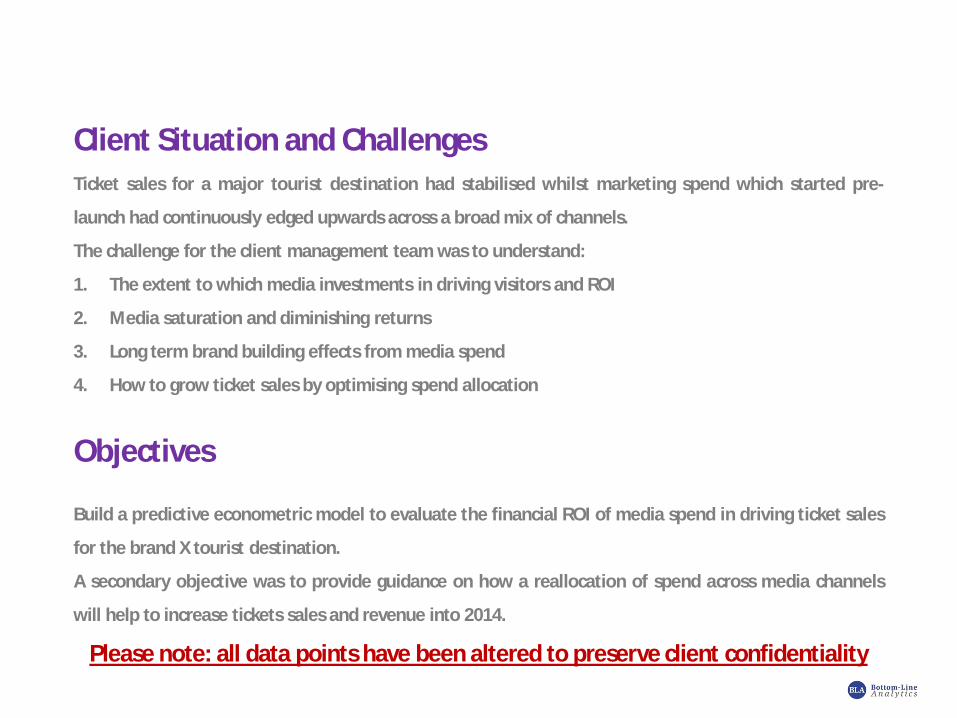
Client Situation and ChallengesTicket sales for a major tourist destination had stabilised whilst marketing spend which started pre-
launch had continuously edged upwards across a broad mix of channels.
The challenge for the client management team was to understand:
1. The extent to which media investments in driving visitors and ROI
2. Media saturation and diminishing returns
3. Long term brand building effects from media spend
4. How to grow ticket sales by optimising spend allocation
Objectives
Build a predictive econometric model to evaluate the financial ROI of media spend in driving ticket sales
for the brand X tourist destination.
A secondary objective was to provide guidance on how a reallocation of spend across media channels
will help to increase tickets sales and revenue into 2014.
Please note: all data points have been altered to preserve client confidentiality
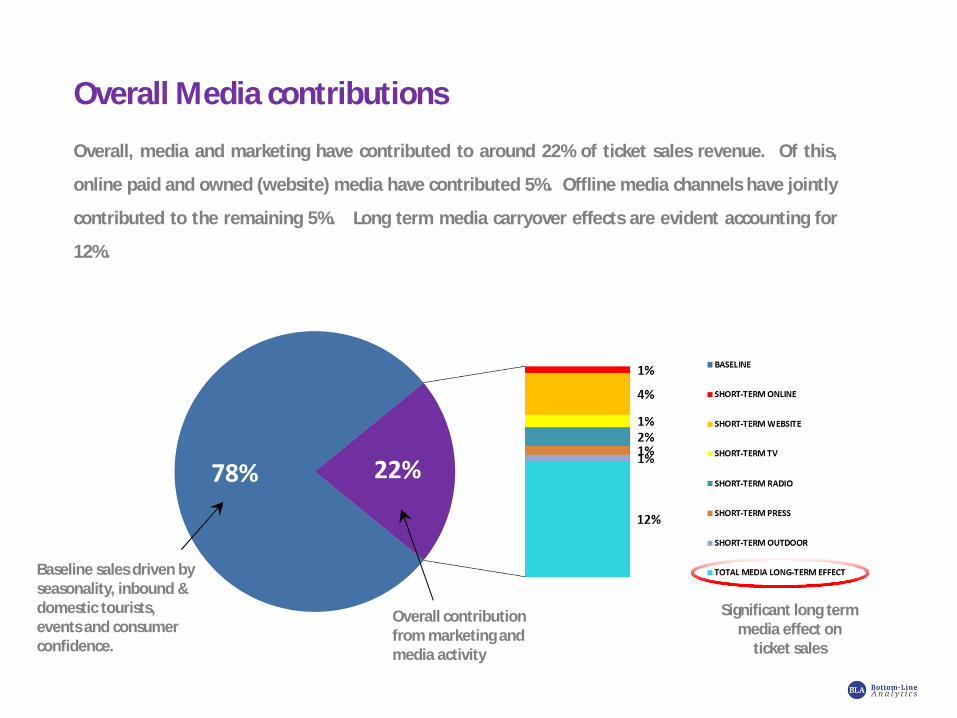
Overall Media contributions
Overall, media and marketing have contributed to around 22% of ticket sales revenue. Of this,
online paid and owned (website) media have contributed 5%. Offline media channels have jointly
contributed to the remaining 5%. Long term media carryover effects are evident accounting for
12%.
Baseline sales driven by seasonality, inbound & domestic tourists, events and consumer confidence.
Overall contribution from marketing and media activity
Significant long term media effect on
ticket sales
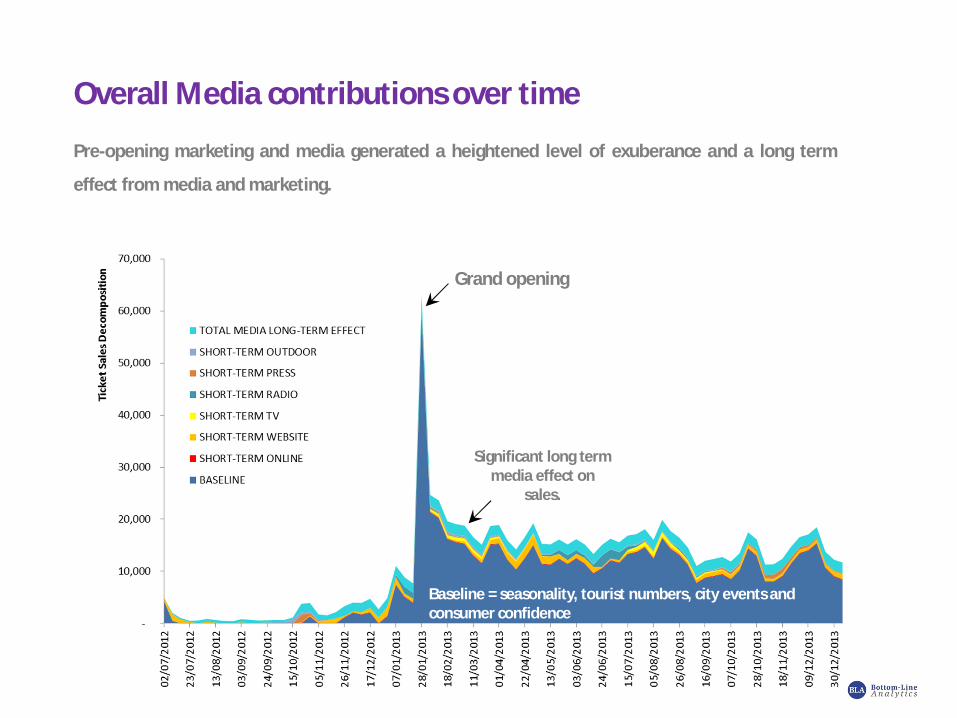
Overall Media contributions over time
Grand opening
Pre-opening marketing and media generated a heightened level of exuberance and a long term
effect from media and marketing.
Significant long term media effect on
sales.
Baseline = seasonality, tourist numbers, city events and consumer confidence
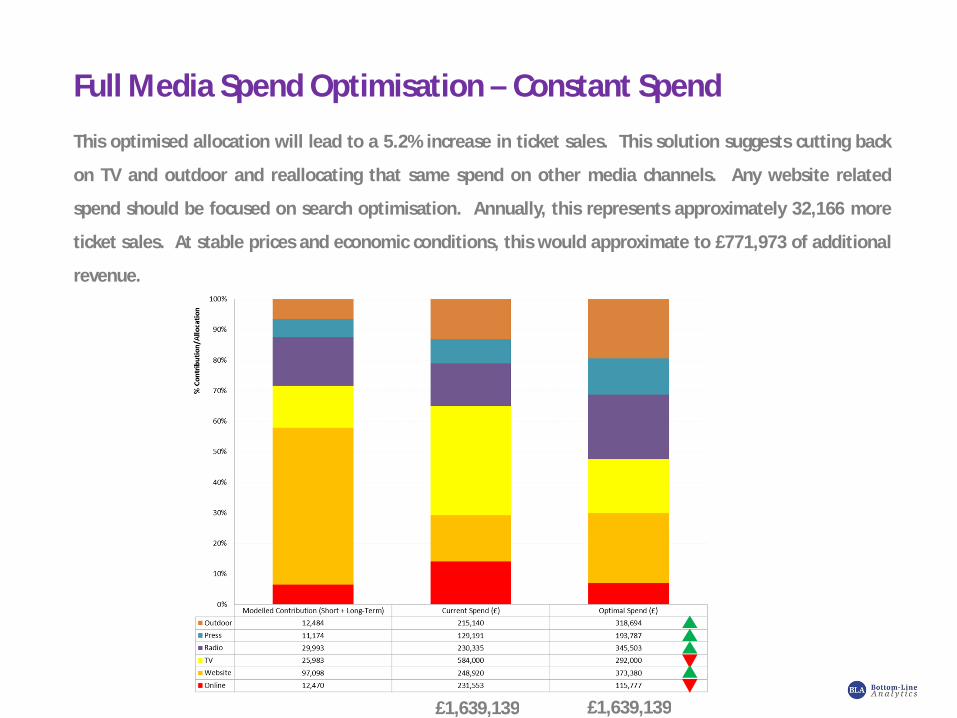
Full Media Spend Optimisation – Constant Spend
This optimised allocation will lead to a 5.2% increase in ticket sales. This solution suggests cutting back
on TV and outdoor and reallocating that same spend on other media channels. Any website related
spend should be focused on search optimisation. Annually, this represents approximately 32,166 more
ticket sales. At stable prices and economic conditions, this would approximate to £771,973 of additional
revenue.
£1,639,139 £1,639,139
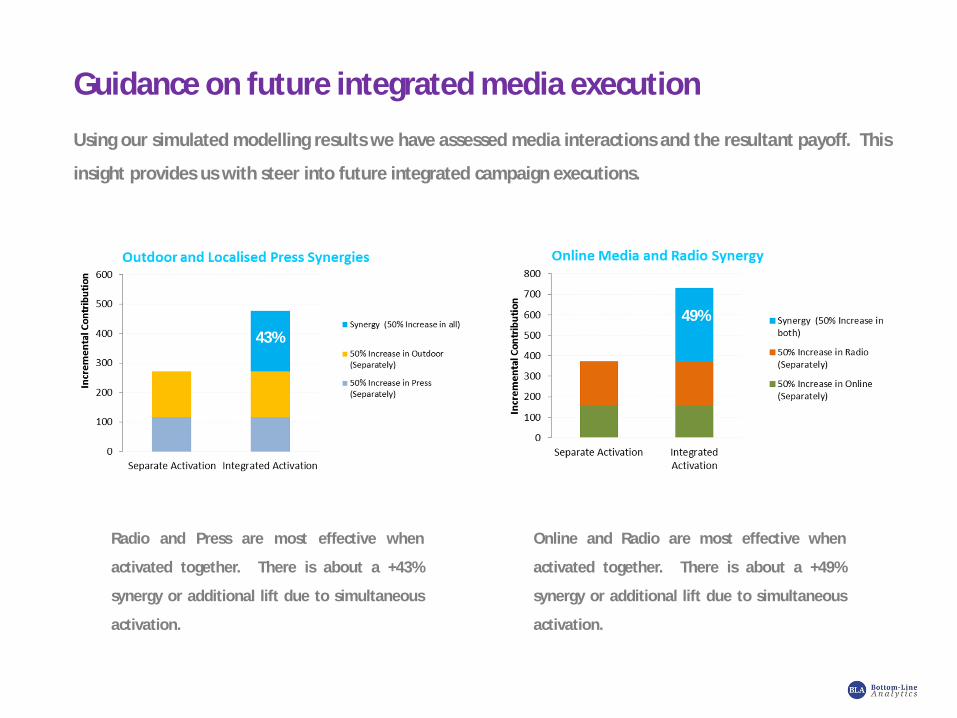
Guidance on future integrated media execution
43%
Using our simulated modelling results we have assessed media interactions and the resultant payoff. This
insight provides us with steer into future integrated campaign executions.
49%
Radio and Press are most effective when
activated together. There is about a +43%
synergy or additional lift due to simultaneous
activation.
Online and Radio are most effective when
activated together. There is about a +49%
synergy or additional lift due to simultaneous
activation.
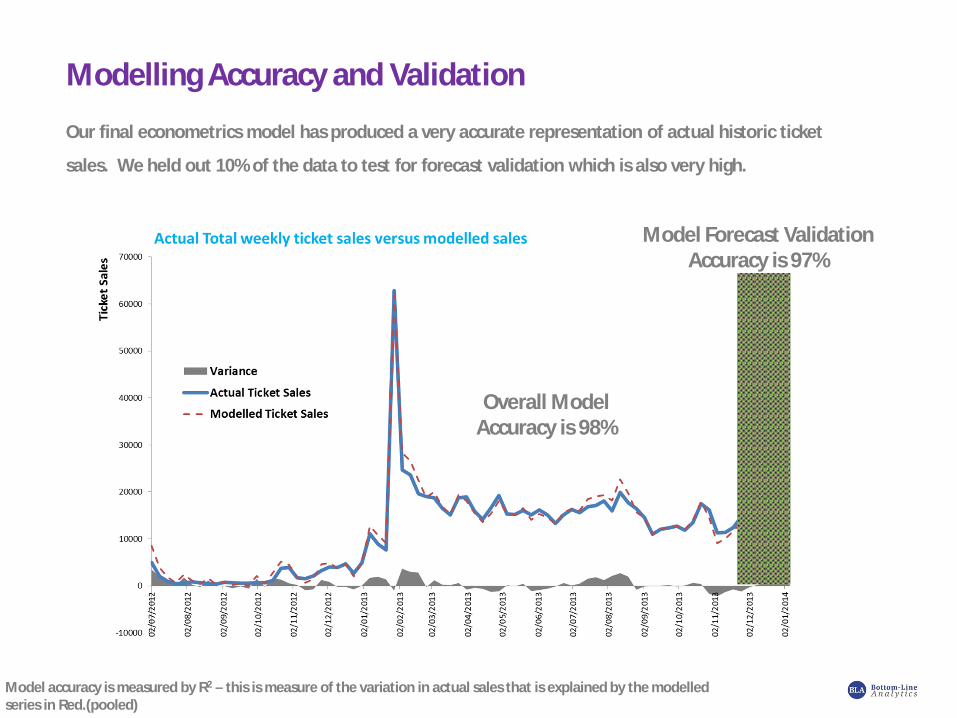
Modelling Accuracy and Validation
Model accuracy is measured by R2 – this is measure of the variation in actual sales that is explained by the modelled series in Red.(pooled)
Our final econometrics model has produced a very accurate representation of actual historic ticket
sales. We held out 10% of the data to test for forecast validation which is also very high.
Overall Model Accuracy is 98%
Model Forecast Validation Accuracy is 97%
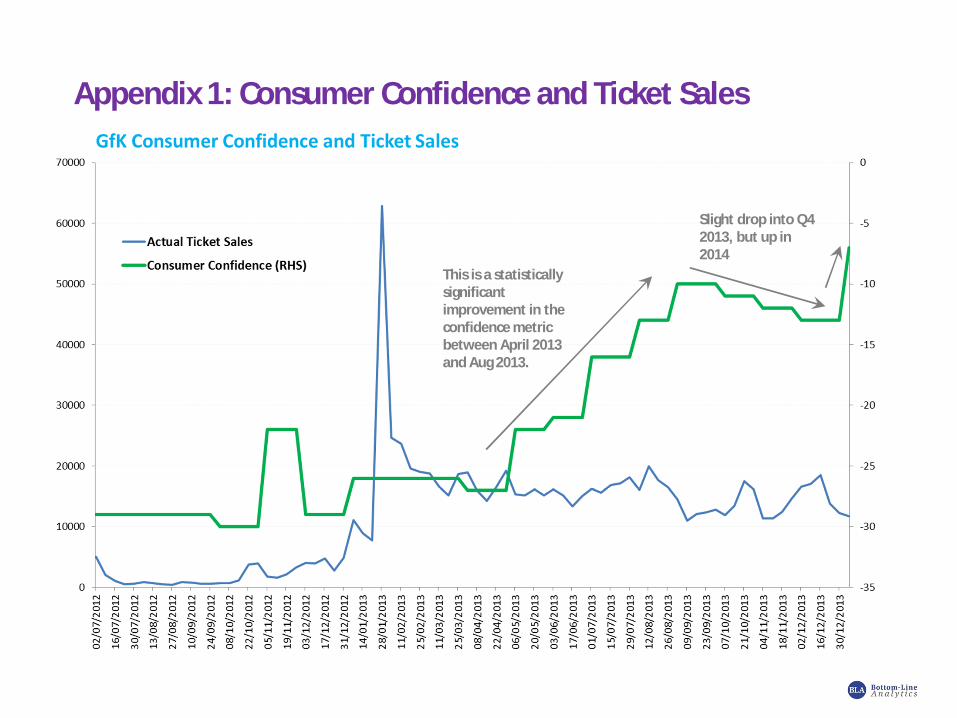
Appendix 1: Consumer Confidence and Ticket Sales
This is a statistically significant improvement in the confidence metric between April 2013 and Aug 2013.
Slight drop into Q4 2013, but up in 2014
Michael Wolfe
CEOBottom Line Analytics GlobalE: [email protected]: 770.485.0270
www.bottomlineanalytics.com
Masood Akhtar
Partner, Analytics (EMEA)Bottom Line Analytics GlobalE: [email protected]: +44 7970 789 663
www.bottomlineanalytics.com