local soil-landscape relationships in western iowa: i. distributions of selected chemical and...
TRANSCRIPT

DIVISION S-5—SOIL GENESIS, MORPHOLOGY,AND CLASSIFICATION
Local Soil-Landscape Relationships in Western Iowa:I. Distributions of Selected Chemical and Physical Properties1
J. H. HUDDLESTON AND F. F. RlECKEN2
ABSTRACTA single, open-system hillslope was studied in detail to
determine the extent to which pedologic processes and geo-logic processes act both separately and jointly to producemodern characteristics of contiguous soils in the soil-landscapesystem. Sixteen soil cores were taken at equal spacings betweenthe hillslope summit and the waterway center. Each core wasdescribed and subdivided into nineteen 10-cm samples, whichwere then analyzed for percent carbonates, total phosphorus,free iron, and particle size distribution. The carbonate dis-tribution demonstrates the geologic effects of landscape evolu-tion, which beveled calcareous, deoxidized loess, and left athin leached sediment above the erosion surface. Both car-bonate and free-iron distributions indicate the effects of theprocesses of dissolution of carbonates and iron, local transloca-tion, and reprecipitation in nodules. The distribution of geo-metric mean particle size shows the geological effects of loessstratification during deposition and the exposure of these strataduring landscape evolution. Total phosphorus and clay dis-tributions illustrate the effect of pedological redistribution.They also illustrate the interaction between the pedologicalprocess of vertical redistribution and the geological process ofsurface modification by landscape evolution.
Additional Index Words: landscape evolution, pedologicprocesses, total P, clay, geometric mean, free iron.
RUHE (1954) began the task of unraveling soil-land-scape relationships in western Iowa with his regional
study of fresh railroad cuts between Bentley and Adair,Iowa. He identified weathering zones in the loess andshowed that they were parallel to the underlying paleosolsurface, whereas the modern landscape surface bevelsweathering zones. Ruhe and Scholtes (1956) interpretedthe independence of weathering zones and faunal zones inthe loess as evidence that weathering zones formed in theloess after deposition had ceased. Formation of deoxidizedzones was attributed to periods of climatic change duringwhich soil moisture was sufficient to cause gleying (Ruhe,Prill, and Riecken, 1955). Iron in the gleyed zone wasreduced to the more mobile ferrous form and translocatedto local areas where it was reoxidized and precipitated aspipestems, leaving a gray matrix of silt grains stripped oftheir iron coatings (Daniels, Simonson, and Handy, 1961).
1 Journal Paper No. J-7190 of the Iowa Agr. and Home Econ.Exp. Sta., Ames, Iowa. Project No. 1540. Received April 5,1972. Approved Nov. 20, 1972.2 NDEA Fellow, Agronomy Dep., Iowa State Univ., nowAsst. Professor, Ecosystems Analysis, University of Wisconsin-Green Bay; Professor, Agronomy Dep., Iowa State Univ., re-spectively.
Carbonate translocation also occurred during weatheringzone formation, for the loess in southwestern Iowa hasalternating leached and unleached zones, the latter contain-ing carbonate nodules, or loess-kindchen (Ruhe, 1969,p. 46). The two processes of iron segregation and carbon-ate translocation have resulted in the weathering zonesidentified as oxidized and leached, deoxidized and un-leached, oxidized and unleached, and deoxidized andleached (see Fig. 1).
Ruhe's regional study was followed by two areal studiesof small watersheds, one in Adair County and one in Pot-tawattamie County, Iowa (Ruhe, Daniels, and Cady,1967). Both of these investigations identified the relation-ship of major kinds of soils and their properties to positionsand distributions of geomorphic surfaces in the watershed.The Pottawattamie County, watershed was located adjacentto Cut 39 of Ruhe's original railroad traverse, where aradiocarbon date of 6,800 ± 300 years had been obtainedfrom the basal increment of gully fill sediments (Rubinand Seuss, 1955). Landscape evolution at this site can besummarized in four general stages: (i) loess depositionending about 14,000 years ago (Ruhe, 1969, p. 42); (ii)formation of weathering zones parallel to the underlyingpaleosol surface; (iii) erosional truncation of weatheringzones and cutting of the gully between the time of weather-ing zone formation and 6,800 years BP and (iv) subse-quent alluviation which partially filled the gully. Evidencefrom Thompson Creek in nearby Harrison County, Iowa,suggests that the last stage was not a period of continuousalluviation but occurred in distinct cycles (Daniels, Rubin,and Simonson, 1963). The first cycle lasted from 7,000 to2,000 years BP, the second was a shorter but more intenseinterval from 2,000 to 1,800 years BP, and the third lastedfrom 1,800 to 250 years BP.
Because neither areal investigation involved extensivesampling and analyses along interconnected traverses,whereby soil changes could be traced continuously fromone geomorphic surface to another, a detailed investigationof soil properties on a single hillslope was undertaken torefine the study of soi!4andscape relationships. It was theaim of this study to show how the properties and genesisof the continuous soils on a single hillside were relatedto the separate effects of the geological processes of loessdeposition and landscape evolution and the pedologicalprocesses of transformation and translocation, particularlyof clay, iron, and phosphorus, and to the interactions be-tween these two sets of processes. The amount of informa-tion already available from Daniel's study area at Cut 39(Ruhe, Daniels, and Cady, 1967) made this a logical placefor a detailed study of local soil-landscape relationships.
264

HUDDLESTON & RIECKEN: SOIL-LANDSCAPE RELATIONSHIPS IN IOWA 265
I290i
1270
I25O
I23O
Ma = MarshallM = MononaD = Monona-Dow intergradeN = Napier
= projected surfaces
OL = oxidized a leachedDU = deoxidized 8 unleachedOU = oxidized S unleachedDL = deoxidized S leachedB = basal soilLK= Lovetand loess S Kansan tillG = gully fill sediments
Wisconsinloess
500 1000DISTANCE (feet)
1500 2000east
Fig. 1—Distribution of soils, weathering zones, and topography at Cut 39.
FIELD AND LABORATORY STUDIES
The soil-landscape system investigated is a west-facing hill-slope 30 m north of Cut 39, in the SE V4, Sec. 13, T76N, R41W,Pottawattamie County, Iowa. A map of the specific location ofDaniel's larger study area is included in Ruhe, Daniels, andCady (1967, p. 205). Stratigraphic and soil relationships at Cut39 as developed by Daniels are shown in Fig. 1.
The hillslope lies within 100 m of the head of the waterwaysystem. It is representative of an open-system hillslope model(Ruhe and Walker, 1968), and all five slope-profile compo-nents are present. Soils on the summit and shoulder are devel-oped in oxidized and leached loess. The summit soil is classifiedin the Marshall series, and the shoulder soil is representative ofthe Monona series. Backslope soils are formed in deoxidizedand unleached loess exposed at the surface by beveling of weath-ering zones during landscape evolution. The Dow series is char-acteristic here. The footslope position is a transitional area inwhich gully fill sediments of increasing thickness overlie oxi-dized and unleached loess. Daniels (Ruhe, Daniels, and Cady,1967) classified the soil in this zone as Monona. The toeslopeposition includes soils of the Napier series, which have devel-oped in thick alluvial sediments in the center of the waterway.
Data were collected from a single traverse that extendedfrom summit center to waterway center, a total planimetric dis-tance of 175 m (585 feet). Sixteen sampling sites were equallyspaced 11.2 m (39 feet) apart along this traverse. At each sitethe relative elevation was determined and soil cores were takento a depth of 190 cm (76 inches). Each core was described andsubdivided into nineteen 10-cm (4-inch) samples. Determina-tions of particle size distribution, carbonate content, total phos-phorus, and free iron were made for each sample.
Particle size distribution was determined by the pipettemethod on samples from which the sand (> 62/j.) was removedprior to sedimentation. Aliquots were taken at times correspond-ing to the five silt fractions and the clay fraction of the Went-worth grading scale. Because this scale is a geometric progres-sion, the average particle size was expressed as the geometricmean. For this calculation, all the sands were assumed to bevery fine sand, as there was generally less than 3% sand in allsamples. Laboratory error of the method was estimated by ana-lyzing six subsamples of a representative silt loam soil. Theaverage of the six determinations of geometric mean was 20.0/i,and the standard deviation was 0.20,u.
Carbonates were determined by dissolving all carbonateminerals in hot HC1, filtering the sample to remove cationsliberated by dissolution, and calculating the total weight loss asa percentage of the original weight. A correction for loss ofweight due to solution and leaching of substances other than
carbonate minerals was made by determining the weight loss ofsimilar but noncalcareous blanks. Although this method assumesthat blanks and samples were mineralogically alike except forcarbonate content, the assumption was considered reasonablyvalid for the soils involved, and the method was used in prefer-ence to methods that measure CO2 evolution in order that thenumbers obtained would represent the actual amount of carbon-ate minerals in the sample, rather than expressing all carbonates,regardless of mineralogy, as a calcium carbonate equivalent.
Total phosphorus was determined by fusion of the samplewith sodium carbonate and colorimetric determination of phos-phorus by the ammonium vanadomolybdate method (Jackson,1958).
Free iron was determined by extracting with a sodium citrate-sodium dithionite mixture (Holmgren, 1967), then determiningFe by atomic absorption spectrophotometry on a 4-ml aliquotdiluted to 100 ml.
RESULTSMorphological characteristics of the soils at five of the
sixteen sampling sites, each representative of one of the fivemajor slope-profile units in the soil-landscape system, aregiven in Table 1. Laboratory data for the same five profilesare shown in Table 2. Data from all sixteen sampling sitesare summarized graphically in Fig. 2-6. These diagramsare made possible by the equal spacing of sites on the land-scape and of samples within each soil core. Coordinates forthe basal plane of each diagram are distance from summitand depth beneath the soil surface. These coordinates areshown on the diagrams as coded units, each distance unitrepresenting one of the 16 sampling sites at 11.2-m inter-vals and each depth unit representing one of the 19 sam-pling increments at 10-cm intervals. Values of the variablesmeasured were computer-plotted to scale in the perspectiveof a third dimension rising above the basal plane. Theperspective in all diagrams creates an impression of stand-ing at the summit of the system and looking downslope.In all but the clay distribution (Fig. 5), the depth dimen-sion is viewed from the surface downwards into the soil.Because the clay distribution decreases with depth, it isnecessary to reverse the perspective and look upwards fromthe bottom of soil profiles. Otherwise, high values nearthe surface would block out lower values at depth, par-

266 SOIL SCI. SOC. AMER. PROC., VOL. 37, 1973
ticularly in the backslope position of the soil-landscapesystem.
The carbonate distribution (Fig. 2) illustrates the effectof weathering zones and their beveling during landscapeevolution. Soils on the summit and shoulder developed inoxidized and leached loess; they are noncalcareous to thedepth sampled. Soils on the backslope did not form untilprocesses of landscape evolution had stripped away oxi-dized and leached loess, exposing deoxidized and un-leached loess. The erosion process was likely one of back-wearing along an erosion surface (Ruhe, Daniels, andCady, 1967, p. 69-70), and the contact between leachedand unleached material (Fig. 2, coded distance units 8-11)may demarcate this erosion surface. Here the surface ofcalcareous loess is very nearly parallel to the modern land-scape surface, and the geometric mean particle size of theoverlying leached soil is slightly greater than in the calcare-ous loess below or the leached loess upslope (Table 2, site9). These two facts are interpreted as evidence that theleached material of the backslope is sediment in transport
on an erosion surface that truncates deoxidized and un-leached loess in this portion of the landscape.
The amount of carbonate in the upper part of the back-slope (Fig. 2, coded distance units 8-10), with only a fewexceptions, ranges between 3.0 and 5.0%. Similarly, free-iron values (Table 2, Fig. 3) are minimal and very uniformin this part of the soil-landscape system. In the lower partof the backslope, the amounts of both carbonate and freeiron are consistently higher, and the distributions are muchmore irregular. This portion of the soil-landscape systemis the only one in which numerous concretions were ob-served. Some of the concretions were dominated by car-bonate minerals (loess-kindchen), others were Fe-Mn.pipestems, and still others were mixtures of both kinds ofminerals. All are products of weathering zone formation,and their presence near the modern soil surface reflectsthe exposure of weathering zones during subsequent ero-sional evolution of the landscape.
Values of free iron in summit and shoulder soils (Fig.3, coded distance units 1—7) are markedly consistent
Table 1—Morphological properties of representative soil-landscape profiles at Cut 39, Pottawattamie County, Iowa
DepthCoatings
Moist color Texture % Kind FreqClay skins
Thick Freq Cons Roots Mn* Carb Bndy
Site 1 - Summit Position - Marshall sllty clay loamApA3BlB21B22
B23
B31
B32
C
ApA3BlB21B22B23
B3
ApA3B2
B3ClC2C3
ApA3BlB21B22B3
0-2323-3838-5555-7575-90
90-110
110-140
140-165
165-190
0-28 •28-3838-5353-7878-9898-118
118-147
0-1818-2828-45
45-5353-9595-108
108-135
135-190
0-1818-3333-4848-7070-105
105-163
163-190
10YR 2/210YR 3/210YR 3/310YR 4/310YR 4/3-4/4
10YR 4/3-4/4
10YR 4/4
10YR 4/4-5/4
10YR5/3
10YR 2/210YR 2/2-3/210YR 3/210YR 4/310YR 4/310YR 4/3
10YH 4/4-5/4
10YH 5/4
10YR 5/4
10YR 3/22. 5Y 5/343/22. 5Y 4/3-5/3
2. 5Y 6/25Y 6/2+2. 5Y 6/42. 5Y 5/4+ 5Y 6/110YR 5/4
7. 5-10YR 5/4+5Y 6/1-6/2
10YR 3/210YR 3/210YR 3/310YR 4/310YR 4/310YR 4/3-5/4
It slclIt slclIt slclIt slclIt slcl
sll
sll
sll
sll
It slclIt slclIt slclIt slclIt slclsll
sll
sll
sll
It slclIt slclIt slcl
sllsllsllsll
sll
It slclIt slclIt slclIt slclIt slclsll
10YR 4/3-5/4 sll
— -
—105
18101810182
13
--
—2+3d2d2dId2dIdl+2dIfIf
" —
—2. 5Y 5/210YR 5/42. 5Y 5/210YR 5/4+5/62. 5Y 5/210YR 5/4+5/610YR 5/2-6/2'10YR 5/4-6/410YR 5/2-6/2
wf+m grvw f+m sbkw-m vf+f sbkw f+m sbkw-m m sbk
w m sbk
vwf sbk
massive
massive
fewfewfewcom
com
few
__
—
10YR 3/210YR 3/210YR 3/310YR 3/3 thin com
10YR 3/3-4/3 thin few
10YR 4/3
—
—
frfrfrfrfr
fr
fr
fr
frSite 4 - Shoulder Position - Monona sllty clay loam
————1
1810135
18102015
—--——If2dId2dIf2d2dId2d
_———
2. 5Y 5/22. 5Y 5/210YH 5/62. 5Y 5/210YR 5/4-5/62. 5Y 5/210YR 5/62. 5Y 5/2-6/210YR 5/6
vw f grw f grw vf+f sbkwfsbkw vf sbkw f pr tow m sbkvw f pr tomassivemassive
massive
_—
fewfewfewfew
few—_
—
_—
10YR 2/210YR 3/2+3/310YR 3/3 thin few10YR 3/3
10YH 3/3-4/3_
_„
^
firmfrfrfrfrfr
fr
fr
fr
Site 9 - Backslope Position - Ma sllty clay loam_
82
1510—151010
_—2fId2d3d__3p2d3d
_—
2. 5Y 5/47. 5+10YB 5/610YH 5/6+5/87. 5YH 5/6+5/8
—7. 5YH 5/6+5/85Y 6/1-6/27. SYR 5/6+5/8
w f grw f grwfsbk
vwf sbkmassivemassivemassive
_
com
——__
_—
5Y 6/2 thin com
——__
frfrfr
frfrfrfr
contains many coarse concretions of secondary carbonatesmassive — — fr
Site 14 - Footslope Position - Monona sllty clay loam———--12
—
——
—Idl+2d
—
————
7. SYR 5/67. SYR 5/6
—
w-m f+m grw f+m grw vf+f sbkw-m vf+f sbkwfsbkmassive tovw f+m sbk
massive
——
commanyfew
—
—
——
10YR 3/210YR 5/210YR 4/2 thin few
—
_
frfrfrfrfrfr
fr
mf+mmf+mcf+mofcf
cf
cf
ff
ff
cf+mcf+mfm+cfcfcfcf
ff
ff
vff
cf+mcfcf
ffffffff
mf+mcf+mcfffffff
vff
NoNoNoNo
3% No
1% No
3% No
3% No
4% No
NoNoNoNo
1% No5% No
2% No
4% No
5% No
NoNoNo
3%8%2%
YesYesYesYes
NoNoNoNoNoNo
Site 16 - Toeslope Position - Napier sllty clay loam
clrclrclrclrclr
clr
clr
abptclrolrclrclrgrad
grad
Ir, Ir
Ir
Ir. Irclrclr
olrgradgradgradgradgrad
Ap
A3Cl
C2C3
0-23
23-4545-75
75-113113-190
10YR 3/2
10YR 2/2-3/210YH 4/3-5/4+ 10YR 3/210YR 3/210YR 3/3
It slcl — —
It slcl — —It slcl — —
It slcl — —It slcl — —
vwf sbk+ m grwf sbkw f sbk
w-m f sbkw f pr tow f+m sbk
—
comcom
—
10YR 3/210YR 3/2
frfirmff
, _ _ [T
— — fr— — firm
cf+m
cf+mcf+m
cf-Hn£f
—
—1%
No
NoNo
NoNo
clr
clrolr
grad—
' Percent of area covered with black (SYR 2/1) Mn stains or concretions.
HUDDLESTON & RIECKEN: SOIL-LANDSCAPE RELATIONSHIPS IN IOWA 267
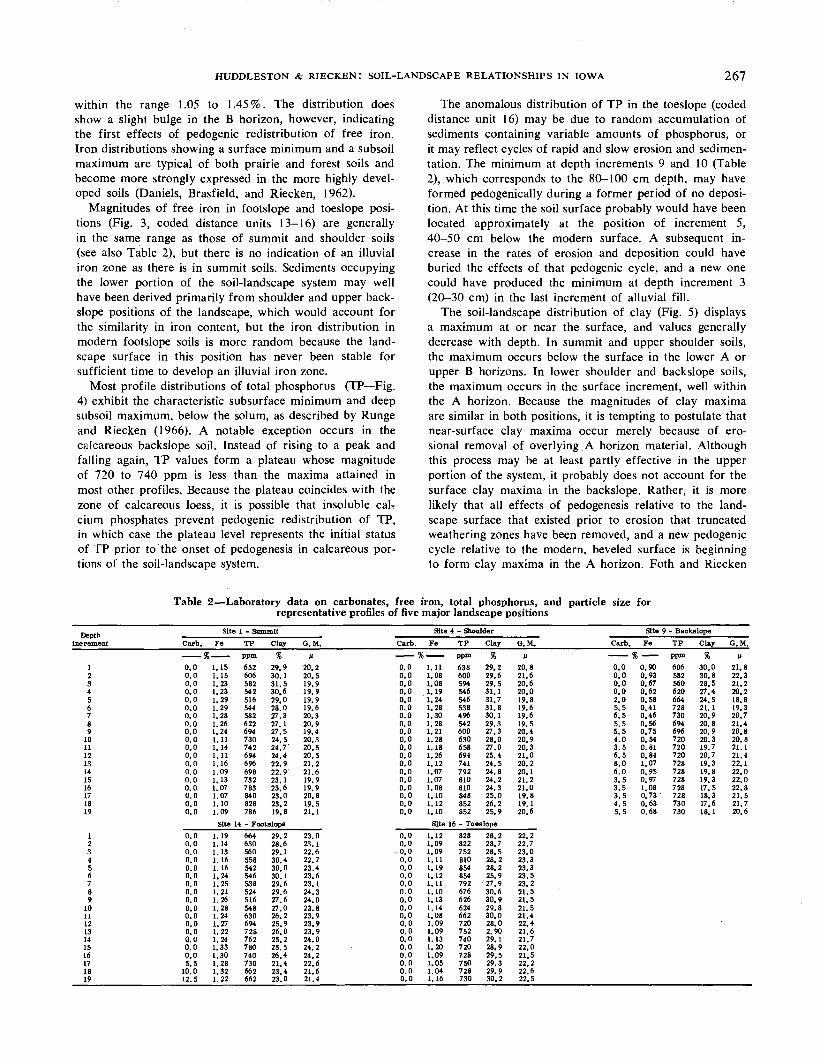
within the range 1.05 to 1.45%. The distribution doesshow a slight bulge in the B horizon, however, indicatingthe first effects of pedogenic redistribution of free iron.Iron distributions showing a surface minimum and a subsoilmaximum are typical of both prairie and forest soils andbecome more strongly expressed in the more highly devel-oped soils (Daniels, Brasfield, and Riecken, 1962).
Magnitudes of free iron in footslope and toeslope posi-tions (Fig. 3, coded distance units 13-16) are generallyin the same range as those of summit and shoulder soils(see also Table 2), but there is no indication of an illuvialiron zone as there is in summit soils. Sediments occupyingthe lower portion of the soil-landscape system may wellhave been derived primarily from shoulder and upper back-slope positions of the landscape, which would account forthe similarity in iron content, but the iron distribution inmodern footslope soils is more random because the land-scape surface in this position has never been stable forsufficient time to develop an illuvial iron zone.
Most profile distributions of total phosphorus (TP—Fig.4) exhibit the characteristic subsurface minimum and deepsubsoil maximum, below the solum, as described by Rungeand Riecken (1966). A notable exception occurs in thecalcareous backslope soil. Instead of rising to a peak andfalling again, TP values form a plateau whose magnitudeof 720 to 740 ppm is less than the maxima attained inmost other profiles. Because the plateau coincides with thezone of calcareous loess, it is possible that insoluble caUcium phosphates prevent pedogenic redistribution of TP,in which case the plateau level represents the initial statusof TP prior to the onset of pedogenesis in calcareous por-tions of the soil-landscape system.
The anomalous distribution of TP in the toeslope (codeddistance unit 16) may be due to random accumulation ofsediments containing variable amounts of phosphorus, orit may reflect cycles of rapid and slow erosion and sedimen-tation. The minimum at depth increments 9 and 10 (Table2), which corresponds to the 80-100 cm depth, may haveformed pedogenically during a former period of no deposi-tion. At this time the soil surface probably would have beenlocated approximately at the position of increment 5,40-50 cm below the modern surface. A subsequent in-crease in the rates of erosion and deposition could haveburied the effects of that pedogenic cycle, and a new onecould have produced the minimum at depth increment 3(20—30 cm) in the last increment of alluvial fill.
The soil-landscape distribution of clay (Fig. 5) displaysa maximum at or near the surface, and values generallydecrease with depth. In summit and upper shoulder soils,the maximum occurs below the surface in the lower A orupper B horizons. In lower shoulder and backslope soils,the maximum occurs in the surface increment, well withinthe A horizon. Because the magnitudes of clay maximaare similar in both positions, it is tempting to postulate thatnear-surface clay maxima occur merely because of ero-sional removal of overlying A horizon material. Althoughthis process may be at least partly effective in the upperportion of the system, it probably does not account for thesurface clay maxima in the backslope. Rather, it is morelikely that all effects of pedogenesis relative to the land-scape surface that existed prior to erosion that truncatedweathering zones have been removed, and a new pedogeniccycle relative to the modern, beveled surface is beginningto form clay maxima in the A horizon. Foth and Riecken
Table 2—Laboratory data on carbonates, free iron, total phosphorus, and particle size forrepresentative profiles of five major landscape positions
DepthIncrement
123456789
10111213141516171819
123456789
10111213141516171819
Carb.—— 50.00.00.00.00.00.00.00.00.00.00.00.00.00.00.00.00.00.00.0
0.00.00.00.00.00.00.00.00.00.00.00.00.00.00.00.05.5
10.012.5
Site 1Fe
6 ——1.151.151.231.231.291.291.281.261.241.111.141.111.161.091.131.071.071.101.09
Site 141.191.141.131.161.161.241.251.211.261.281.241.271.221.241.331.301.281.321.22
— SummitTP Clayppm %652 29. 9606 30. 1582 31.5542 30.6516 29.0544 28. 0582 27.3622 27. 1694 27. 5730 24. 5742 24.7'694 24.4696 22. 9698 22.9732 23.1783 23.6840 23.0828 23.2786 19.8- Footslope664 29. 2630 28.6560 29. 1558 30.4542 30.0546 30. 1538 29.6524 29.6516 27.6548 27.0630 26. 2694 25.9728 26.0762 25. 2780 25. 5740 26.4730 21.4662 23.4662 23.0
Site 4 - ShoulderG.M.
C20.220.519.919.919.919.620.320.919.420.320.520.521.221.619.919.920.819.521.1
23.023.122.622.723.423.623.124.324.023.823.923.923.924.024.224.222.621.621.4
Carb.—— !0.00.00.00.00.00.00.00.00.00.00.00.00.00.00.00.00.00.00.0
0.00.0
. 0.00.00.00.00.00.00.00.00.00.00.00.00.00.00.00.00.0
Fe£ ——
1.111.081.081.191.241.281.301.281.211.281.181.261.121.071.071.081.101.121.10
Site1.121.091.091.111.191.121.111.101.131.141.081.091.091.131.201.091.051.041.16
TPppm638600594546546538496542600630658694741792810810848852852
Clay%
29.229.629.531.131.731.830.129.327.328.027.025.424.524.824.224.325.026.225.9
G.M.C
20.821.620.620,019.819.619.619.520.420.920.321.020.220.121.221.019.819.120.6
Carb._ g
0.00.00.00.02.05.56.55.55.54.03.56.58.06.03.53.53.54.55.5
Site 9 - BackslopeFe TP
5 —— ppm0. 90 6060.93 5820.67 5600.62 6200.58 6640.41 7280.46 7300.56 6940.75 6960. 54 7200.81 7200.84 7201.07 7280.95 7280. 97 7281.08 7280.73 ' 7280.63 7300. 68 730
Clay
30.030.828.527.424.521.120.920.820.920.319.720.719.319.819.317.518.317.618.1
G.M.H
21.822.321.220.218.819.320.721.420.820.821.121.422.122.022,022.821.521.720.6
16 - Toeslope828822752810854854792676626624662720752740720728750728730
28.228.728.528.228.225.9
'27.930.630.929.830.028.02.9029.128.929.529.329.930.2
22.222.723.023.323.323.523.221.521.521.521.422.421.621.722.021.522.222.622.5

Fig.
2—
Soil-
land
scap
e dis
tribu
tion
of c
arbo
nate
s.Fi
g. 4
—So
il-la
ndsc
ape
dist
ribut
ion
of to
tal p
hosp
horu
s.
to 0\
00 en O 10 n p w 50 O VD ~J
U)
Fig.
3—
Soil-
land
scap
e di
strib
utio
n of
free
iron
.Fi
g. 5
—So
il-la
ndsc
ape d
istri
butio
n of
cla
y.

HUDDLESTON & RIECKEN: SOIL-LANDSCAPE RELATIONSHIPS IN IOWA 269
CODED DISTANCE FROM SUMMITI 2 3 4 5 6 7 8 9 10 11 12 13 14 15 16
Fig. 6—Soil-landscape distribution of geometric mean particlesize.
(1954) also observed clay maxima in A horizons of Galvaand Moody soils, which" occur on stable landscape positionsin northwestern Iowa.
Geometric mean of the >2/x fraction is a useful parame-ter of particle size because it incorporates in a single num-ber the influences of the relative amounts of all particle sizefractions except clay. The soil-landscape distribution ofthis parameter (Fig. 6) creates a first impression of hetero-geneity and irregularity. Figure 7 shows why. Loess is nothomogeneous, at least on a micro scale, but was depositedin minute strata of different particle sizes. These strataare generally parallel to weathering zones and underlyingpaleosols, and they probably were the result of minor pul-sations in wind speed associated with seasonal periodicityof deposition. The irregularity of the soil-landscape dis-tribution is due to inheritance of both vertical stratificationand lateral variation caused by truncation of different strataduring landscape evolution.
Closer examination of the geometric mean distributionreveals a major trend, namely that the particle size tends toincrease downslope. Slightly larger values in surface incre-ments on backslope soils have been interpreted as evidencein support of the hypothesis that this material is a water-worked sediment overlying an erosion surface. The processof selective removal of finer particles has also operated ina down-valley direction, leaving much coarser sedimentsin lower footslope and toeslope positions (Fig. 7).
DISCUSSION
Although it is an obvious fact that the distributions ofproperties illustrated in Fig. 2-7 are those of soils on themodern landscape, the fact that the characteristics of thesedistributions combine the results of geologic processes,pedologic processes, and interactions between the two isperhaps less obvious. For the purpose of the discussion that
96-
<90-GEOMETRIC MEANS
microns018.0-19.0E219.0-20.0QJ 20.0-21.0E3 21.0-22.088 22.0-23.0• 23.0-24.0@ 24 0-25.0
84
Fig. 7—Micro-stratification in the loess at Cut 39.
follows, pedologic processes are those that take placewithin the solum and tend to modify or create A and Bhorizons, while geologic processes are those involved indeposition of parent materials, evolution of the landscape,or modification of the regolith below the solum.
When loess deposition ceased 14,000 years ago, thelandscape surface relative to which soil development beganmay have been in the position of the projected surfaceshown in Fig. 1. Weathering zones formed soon afterwards,with the result that the uppermost zone was leached to adepth of about 300 cm (10 feet), well below the solum.Even though leaching of carbonates from the solum (pedo-loeic leaching) probably was occuring simultaneously, itappears that in this landscape leaching below the solum(geologic leaching) acted much faster and more effectively.Consequently the soils are usually considered to havedeveloped essentially in oxidized and leached loess.
If the theorems of landscape evolution given by Ruhe,Daniels, and Cady (1967, p. 69-70) are applicable tothis hillslope, and there is no reason to doubt that theyare, then the summit position has remained stable through-out the subsequent periods of erosion which modified theremainder of the landscape. It is a relic of the initial sur-face that existed 14,000 years ago, and the soils on it havebeen developing relative to this initial surface ever sinceloess deposition ceased. These are the oldest soils on thelandscape. With the exception of weathering zone modifica-

270 SOIL SCI. SOC. AMER. PROC., VOL. 37, 1973
tion of the carbonate distribution, no subsequent majorgeologic process has affected their characteristics. Instead,properties of the modern summit soils result mainly frompedogenic modifications of initial state distributions. Illu-via'l zones of iron and clay (Fig. 3 and 5, coded distanceunits 1-3) and the eluvial-illuvial phosphorus profile (Fig.4) best illustrate this relationship.
The backslope surface, which resulted from erosionalevolution of the landscape, is younger than the summit,and so are the soils on it. All effects of the pedogenic cyclethat started 14,000 years ago on the initial loess surfacehave been removed (Fig. 1, position of the Dow soil), anda new pedogenic cycle has begun in a new parent material.This cycle certainly began no later than 6,800 years BP,and it may have begun as recently as 1,800 years ago, de-pending on the thickness of the increment removed and therate of erosion during that 5,000-year span. The new par-ent material consists of a thin veneer of leached material,which appears to be sediment in transport rather thanloess in place, overlying deoxidized and unleached loess.The modern soil has inherited the initial sorting of the loessdeposit, the downslope sorting during erosive evolution,and the distribution of carbonates and iron produced bygeological processes of weathering zone formation and sub-sequent truncation. Pedogenesis has acted for such a shorttime relative to this new surface that the only distinguisha-ble modification of inherited initial states is the formationof a slight clay bulge in the A horizon (Fig. 5).
The shoulder position is a complex transition zone inwhich pedogenic and geologic processes have been actingand interacting simultaneously. A wedge-shaped block ofsoil has been removed from the shoulder (Fig. 1, positionof upper Monona soil). Where the wedge is thin, the rateof erosion must have been quite slow; where it is thick, amore rapid rate must have prevailed. Somewhere in themiddle, it seems reasonable that the rate of removal duringany one cycle of landscape erosion would just equal the rateof soil genesis, and soil horizons would advance into otherhorizons deeper in the soil. At any given time, the char-acteristics of the soil would be a combination of those in-herited from the geological processes of landscape evolu-tion, those inherited from pedogenesis with respect toformer landscape surfaces, and those produced by pedo-genesis with respect to the surface existing at that time.The same kinds of interactions would occur higher in thelandscape, but here current pedogenic processes woulddominate, since the rate of erosion was slower. Lower onthe shoulder, .where erosion was accelerated, the geologicprocess would tend to dominate.
Processes in footslope and toeslope positions (Fig. 1,lower Monona and Napier soils) are similar to those in theshoulder except that a wedge-shaped block of material,the gully fill sediments, has been added to the surface since6,800 years BP. In the upper part of the footslope, wherealluvium is thin, properties of the underlying oxidizedand leached loess, in particular the nodular concentrationof carbonates and iron (Fig. 2 and 3, coded distance units12-13) are inherited but probably unmodified by pedo-genesis. Somewhere in the middle of the position there may
be an equilibrium point where pedogenesis just keeps upwith sediment accumulation during a given alluvial cycle.Lower in the soil-landscape system, alluviation proceedsat a faster rate than soil genesis until the alluvial cycleends. Pedogenic processes then dominate until the nextalluvial cycle begins. Such may be the case at site 16, thewaterway center, as indicated by the TP distribution (Fig.4). Footslope processes also differ from shoulder processesby the influence of down-valley removal of some sediments,which causes additional sorting of materials that affectsparticle size distributions inherited by soils in thesepositions.
Geometrically, the soil-landscape system at Cut 39 is acontinuous unit in space. The soils on it are also contiguousin space, but they display some very marked differencesin their ages and their properties. These differences arelargely a function of the geologic processes that producedweathering zones and modified the landscape, but they arealso dependent on interactions with pedogenic processes.It remains to assess quantitatively the relative roles of thesetwo processes and their effects on soil genesis in the soil-landscape system.