local relief and the height of mount olympus
TRANSCRIPT
LOCAL RELIEF AND THE HEIGHT OF MOUNT OLYMPUS
DAVID R. MONTGOMERY* AND HARVEYM. GREENBERG
Department of Geological Sciences, University of Washington, Seattle, WA 98195, USA
Received 26 June 1999; Revised 6 July 1999; Accepted 23 August 1999
ABSTRACT
A three-dimensional assessment of the net volume of rock differentially eroded from belowmountain tops to form valleysyields a range-wide constraint on feedback between valley development and the height of mountain peaks. The`superelevation' of mountain peaks potentially attributable to differential removal of material from below peaks in theOlympic Mountains, Washington, was constrained by fitting a smoothed surface to the highest elevation points on a 30 mgrid digital elevation model of the range. High elevation areas separate into two primary areas: one centred on MountOlympus in the core of the range and the other at the eastern end of the range. The largest valleys, and hence areas with thegreatest volume of differentially eroded material, surround Mount Olympus. In contrast, the highest mean elevationsconcentrate in the eastern end of the range. Calculation of the isostatic rebound at Mount Olympus attributable to valleydevelopment ranges from500 to750 m(21 to32per cent of its height) for a 5 to 10kmeffective elastic thickness of the crust.Comparison of cross-range trends inmean andmaximumelevation reveals that this calculated rebound forMountOlympuscorresponds well with its `superelevation' above the general cross-range trend in mean elevation. It therefore appears thatthe location of the highest peak in the Olympics is controlled by the deep valleys excavated in the centre of the range.Copyright# 2000 John Wiley & Sons, Ltd.
KEYWORDS: Valley incision; peak uplift; erosion
INTRODUCTION
The height of local peaks is perhaps the most prominent geomorphological aspect of a mountain range, andtectonic and erosional processes generally influence the elevation of mountain peaks over different lengthscales. Tectonic processes govern the average crustal thickness, spatial variability in rock uplift and theflexural rigidity of the crust, which in turn control the general elevation of a mountain range. Incision of localrelief can trigger isostatic uplift which compensates for the net mass of rock eroded to form valleys andthereby further raises mountain peaks (Holmes, 1944). Isostatic rebound can also focus rock uplift in areas ofconcentrated erosion (Beaumont et al., 1992; Willett et al., 1993; Zeitler et al., 1993). In addition, flexuraluplift of mountains can occur by loading of the crust, which can result from volcanic loading by seamounts(McNutt and Menard, 1978), along rift zones or other major topographic discontinuities (Gilchrist andSummerfield, 1990, 1991), and on the margins of depositional basins (Quinlan and Beaumont, 1984; Smalland Anderson, 1995). The heights of mountain peaks therefore reflect a combination of external geophysicalforcing and spatial variations in erosional and depositional processes.The potential for elevating mountain peaks through valley deepening was recognized shortly after
acceptance of the role of isostasy in maintaining mountain ranges (see Suess (1909) and Bowie (1927) fordiscussions of the early development of the concept of isostasy) (Figure 1). The idea of raising mountain topsin response to isostatic adjustment to denudation is simple±erosion of crustal rocks decreases the mass of thecolumn of rock above the mantle, which then triggers rock uplift (sensu England and Molnar, 1990) asmaterial at depth moves in to compensate for the mass deficit. Because crustal rocks generally are less densethan deeper rocks, the volume of the compensating rock is less than that of the eroded rock. Hence, amountain range will wear down evenly if erosion occurs uniformly, as rebound will only refresh a fraction of
Earth Surface Processes and LandformsEarth Surf. Process. Landforms 25, 385±396 (2000)
Copyright # 2000 John Wiley & Sons, Ltd.
* Correspondence to: Dr D. R. Montgomery, Department of Geological Sciences, University of Washington, Seattle, WA 98195,USA. E-mail: [email protected]

the lost elevation. In contrast, differential erosion that incises deep valleys can raise mountain tops, eventhough the mean elevation of the landscape decreases (Holmes, 1944). Only through valley deepening orwidening can erosional processes contribute to elevating peaks, as material uniformly stripped off of alandscape will result in global lowering.The relative contribution of valley incision to the height of mountain tops is a constraint on the
interpretation of evidence for feedback between late Cenozoic mountain uplift and climate change (Molnarand England, 1990). Evaluation of the specific rise of mountain peaks in response to a particular episode ofvalley deepening requires knowing both the initial topography and the degree of flexural support due tocrustal strength. Unfortunately, range-wide initial conditions are very difficult to know except whereundisputed erosion surfaces are preserved, and even in such special cases cosmogenic isotope data cansuggest substantial erosion of the presumed palaeosurface (Small and Anderson, 1998). For the general casewhere one cannot identify an initial surface, it would be useful to be able to constrain the maximum possiblecontribution of valley development to the height of peaks. The simplest case is that of static isostaticcompensation for the net mass of rock that is `missing', or differentially eroded from below mountain peaks.How much of the elevation of mountain peaks is due to the development of valleys? The idea that incision
of deep valleys can elevate mountain peaks has a long history, but the magnitude of this effect has beenconstrained in only a few studies. Jeffreys (1929, p. 295) considered `deepening of the valleys' to cause only a`slight rise of the highest ground'. In contrast, Wager (1933, 1937) proposed that isostatic compensation forthe mass of rock carved out of deep valleys was responsible for the great height of Himalayan peaks. Based onWager's argument, Holmes (1944) estimated that incision of the Arun River gorge could account for 21 percent of the height of Mount Everest. Although the maximum uplift attributable to local relief can becalculated from the volume of material missing from between mountain peaks for the case of local isostaticcompensation, flexural rigidity of the crust limits actual compensation to less than that predicted for purelylocal compensation. Taking this into consideration, Montgomery (1994) analysed topographic cross-sectionsand showed that simple isostatic response to incision of deep valleys could account for at most 5±10 percentof the elevation of Sierran peaks but up to 30 per cent of the elevation of Himalayan peaks. In a similargeneralized analysis Gilchrist et al. (1994) showed that valley incision could account for at most about 25 percent of the elevation of mountain tops. Whereas these previous estimates of the effect of valley incision on theheight of mountain peaks used analyses of topographic cross-sections, Small and Anderson (1998) useddigital topography to estimate the predicted isostatic rebound from late Cenozoic valley incision into a low-relief upland in four mountain ranges in the western United States. They found that although late Cenozoicvalley deepening could have raised the original surface by several hundred metres, erosion rates on the upland
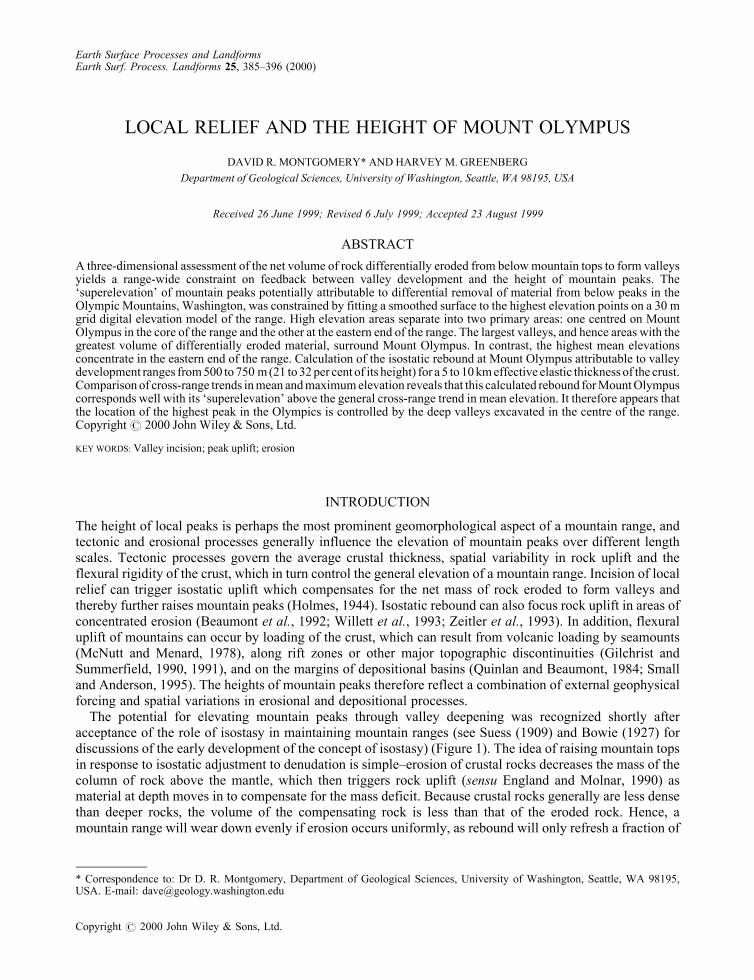
Figure 1. Illustration of the isostatic uplift ofmountain peaks in response to valley incision. (A) Erosion of deep valleys in an initially levelplateau leads to (B) a landscape with a lower mean elevation with mountain peaks rising above the elevation of the original plateau. (C)Erosion that does not increase relief lowers both the mean elevation and mountain peaks. From Montgomery (1994); after Molnar and
England (1990); after Holmes (1944)
Copyright # 2000 John Wiley & Sons, Ltd. Earth Surf. Process. Landforms 25, 385±396 (2000)
386 D. R. MONTGOMERY AND H. M. GREENBERG
were sufficient to preclude significant surface uplift of the peaks. Here we further examine the use ofgeographical information system (GIS) techniques to generalize the limiting analysis for the effect of valleydevelopment, and explore the application of this approach to the Olympic Mountains, Washington.
TWO-DIMENSIONAL MODEL AND CONSTRAINTS
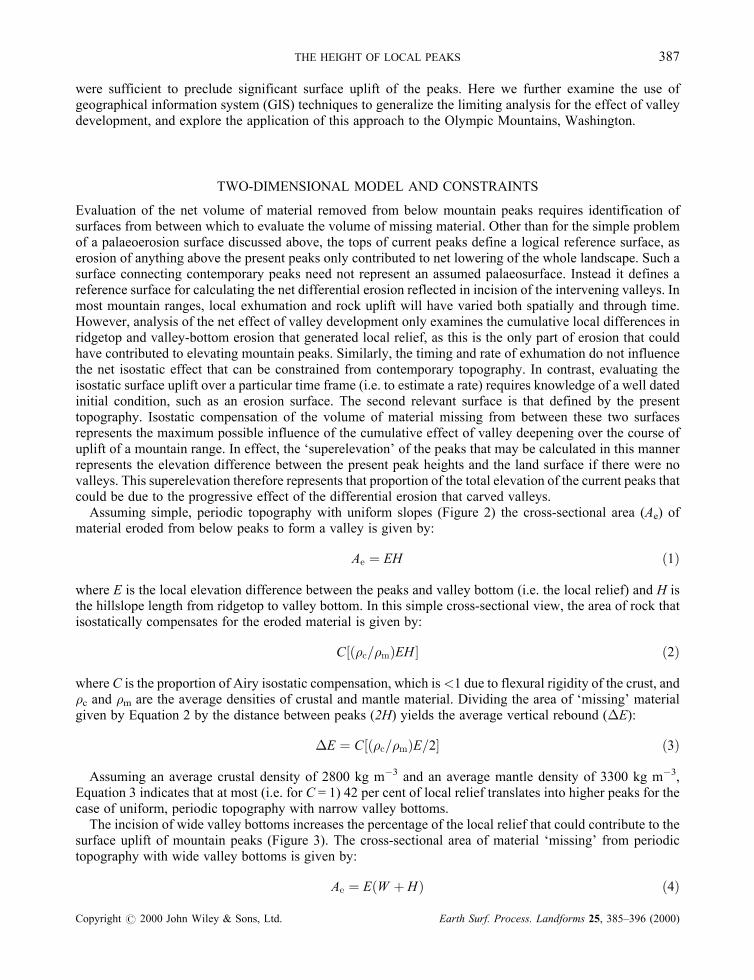
Evaluation of the net volume of material removed from below mountain peaks requires identification ofsurfaces from between which to evaluate the volume of missing material. Other than for the simple problemof a palaeoerosion surface discussed above, the tops of current peaks define a logical reference surface, aserosion of anything above the present peaks only contributed to net lowering of the whole landscape. Such asurface connecting contemporary peaks need not represent an assumed palaeosurface. Instead it defines areference surface for calculating the net differential erosion reflected in incision of the intervening valleys. Inmost mountain ranges, local exhumation and rock uplift will have varied both spatially and through time.However, analysis of the net effect of valley development only examines the cumulative local differences inridgetop and valley-bottom erosion that generated local relief, as this is the only part of erosion that couldhave contributed to elevating mountain peaks. Similarly, the timing and rate of exhumation do not influencethe net isostatic effect that can be constrained from contemporary topography. In contrast, evaluating theisostatic surface uplift over a particular time frame (i.e. to estimate a rate) requires knowledge of a well datedinitial condition, such as an erosion surface. The second relevant surface is that defined by the presenttopography. Isostatic compensation of the volume of material missing from between these two surfacesrepresents the maximum possible influence of the cumulative effect of valley deepening over the course ofuplift of a mountain range. In effect, the `superelevation' of the peaks that may be calculated in this mannerrepresents the elevation difference between the present peak heights and the land surface if there were novalleys. This superelevation therefore represents that proportion of the total elevation of the current peaks thatcould be due to the progressive effect of the differential erosion that carved valleys.Assuming simple, periodic topography with uniform slopes (Figure 2) the cross-sectional area (Ae) of
material eroded from below peaks to form a valley is given by:
Ae � EH �1�
where E is the local elevation difference between the peaks and valley bottom (i.e. the local relief) and H isthe hillslope length from ridgetop to valley bottom. In this simple cross-sectional view, the area of rock thatisostatically compensates for the eroded material is given by:
C���c=�m�EH � �2�
where C is the proportion of Airy isostatic compensation, which is<1 due to flexural rigidity of the crust, and�c and �m are the average densities of crustal and mantle material. Dividing the area of `missing' materialgiven by Equation 2 by the distance between peaks (2H) yields the average vertical rebound (�E):
�E � C���c=�m�E=2� �3�
Assuming an average crustal density of 2800 kg mÿ3 and an average mantle density of 3300 kg mÿ3,Equation 3 indicates that at most (i.e. for C = 1) 42 per cent of local relief translates into higher peaks for thecase of uniform, periodic topography with narrow valley bottoms.The incision of wide valley bottoms increases the percentage of the local relief that could contribute to the
surface uplift of mountain peaks (Figure 3). The cross-sectional area of material `missing' from periodictopography with wide valley bottoms is given by:
Ae � E�W � H� �4�
Copyright # 2000 John Wiley & Sons, Ltd. Earth Surf. Process. Landforms 25, 385±396 (2000)
THE HEIGHT OF LOCAL PEAKS 387
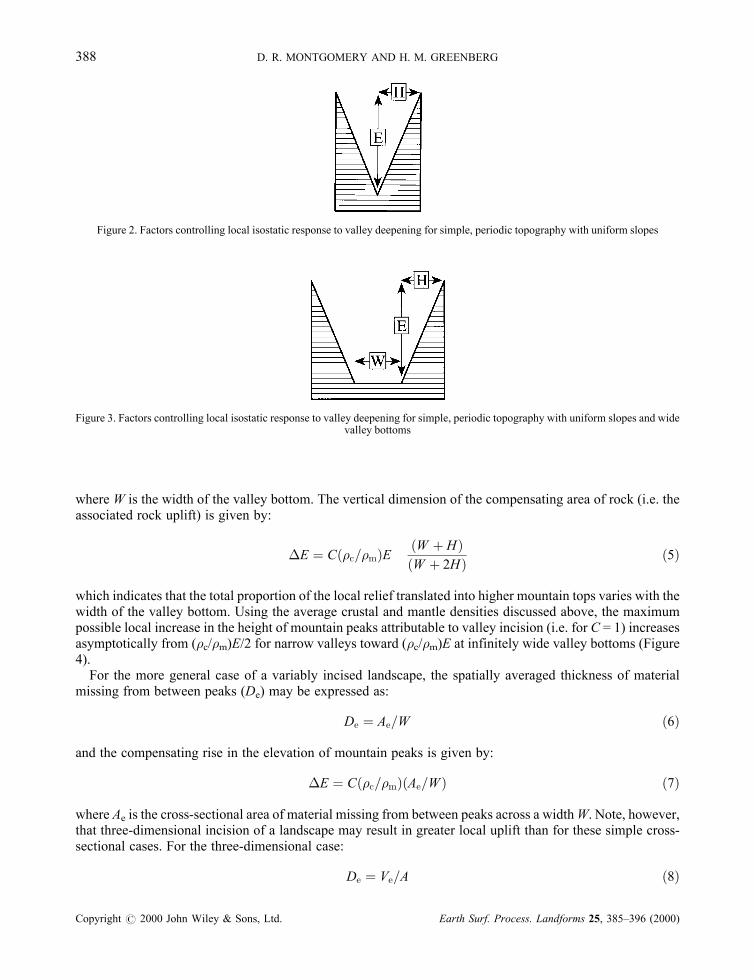
where W is the width of the valley bottom. The vertical dimension of the compensating area of rock (i.e. theassociated rock uplift) is given by:
�E � C��c=�m�E �W � H��W � 2H� �5�
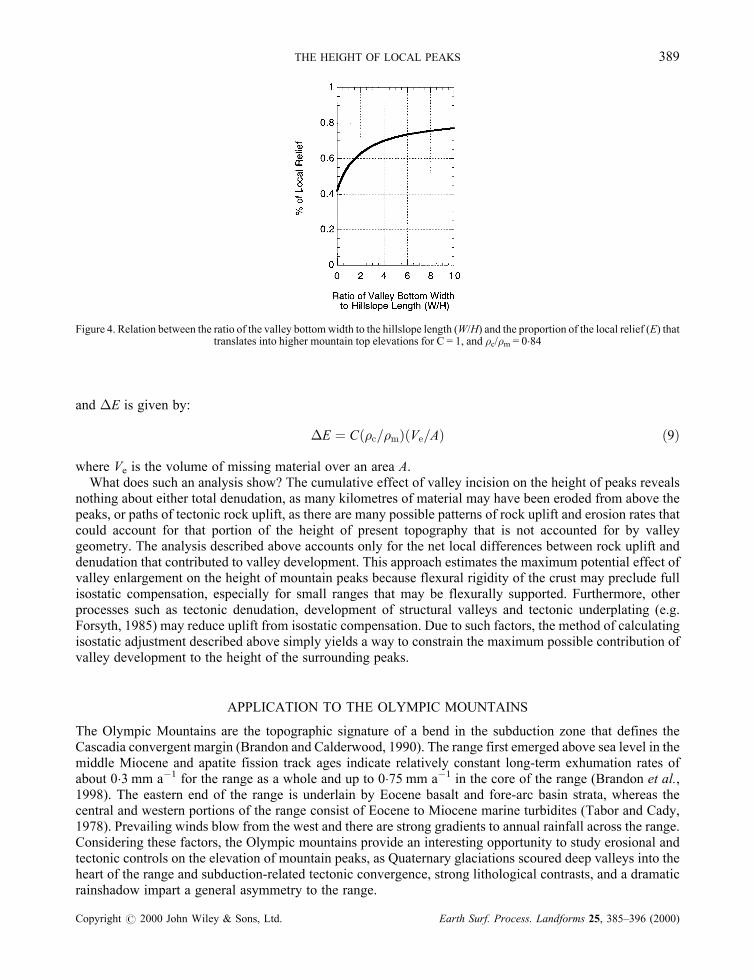
which indicates that the total proportion of the local relief translated into higher mountain tops varies with thewidth of the valley bottom. Using the average crustal and mantle densities discussed above, the maximumpossible local increase in the height of mountain peaks attributable to valley incision (i.e. for C = 1) increasesasymptotically from (�c/�m)E/2 for narrow valleys toward (�c/�m)E at infinitely wide valley bottoms (Figure4).For the more general case of a variably incised landscape, the spatially averaged thickness of material
missing from between peaks (De) may be expressed as:
De � Ae=W �6�
and the compensating rise in the elevation of mountain peaks is given by:
�E � C��c=�m��Ae=W� �7�
where Ae is the cross-sectional area of material missing from between peaks across a widthW. Note, however,that three-dimensional incision of a landscape may result in greater local uplift than for these simple cross-sectional cases. For the three-dimensional case:
De � Ve=A �8�
Figure 2. Factors controlling local isostatic response to valley deepening for simple, periodic topography with uniform slopes
Figure 3. Factors controlling local isostatic response to valley deepening for simple, periodic topography with uniform slopes and widevalley bottoms
Copyright # 2000 John Wiley & Sons, Ltd. Earth Surf. Process. Landforms 25, 385±396 (2000)
388 D. R. MONTGOMERY AND H. M. GREENBERG
and �E is given by:
�E � C��c=�m��Ve=A� �9�
where Ve is the volume of missing material over an area A.What does such an analysis show? The cumulative effect of valley incision on the height of peaks reveals
nothing about either total denudation, as many kilometres of material may have been eroded from above thepeaks, or paths of tectonic rock uplift, as there are many possible patterns of rock uplift and erosion rates thatcould account for that portion of the height of present topography that is not accounted for by valleygeometry. The analysis described above accounts only for the net local differences between rock uplift anddenudation that contributed to valley development. This approach estimates the maximum potential effect ofvalley enlargement on the height of mountain peaks because flexural rigidity of the crust may preclude fullisostatic compensation, especially for small ranges that may be flexurally supported. Furthermore, otherprocesses such as tectonic denudation, development of structural valleys and tectonic underplating (e.g.Forsyth, 1985) may reduce uplift from isostatic compensation. Due to such factors, the method of calculatingisostatic adjustment described above simply yields a way to constrain the maximum possible contribution ofvalley development to the height of the surrounding peaks.
APPLICATION TO THE OLYMPIC MOUNTAINS
The Olympic Mountains are the topographic signature of a bend in the subduction zone that defines theCascadia convergent margin (Brandon and Calderwood, 1990). The range first emerged above sea level in themiddle Miocene and apatite fission track ages indicate relatively constant long-term exhumation rates ofabout 0�3 mm aÿ1 for the range as a whole and up to 0�75 mm aÿ1 in the core of the range (Brandon et al.,1998). The eastern end of the range is underlain by Eocene basalt and fore-arc basin strata, whereas thecentral and western portions of the range consist of Eocene to Miocene marine turbidites (Tabor and Cady,1978). Prevailing winds blow from the west and there are strong gradients to annual rainfall across the range.Considering these factors, the Olympic mountains provide an interesting opportunity to study erosional andtectonic controls on the elevation of mountain peaks, as Quaternary glaciations scoured deep valleys into theheart of the range and subduction-related tectonic convergence, strong lithological contrasts, and a dramaticrainshadow impart a general asymmetry to the range.
Figure 4. Relation between the ratio of the valley bottomwidth to the hillslope length (W/H) and the proportion of the local relief (E) thattranslates into higher mountain top elevations for C = 1, and �c/�m = 0�84
Copyright # 2000 John Wiley & Sons, Ltd. Earth Surf. Process. Landforms 25, 385±396 (2000)
THE HEIGHT OF LOCAL PEAKS 389

For our analysis we compiled a 30 m grid digital elevation model (DEM) of the Olympic Mountains fromUSGS 7�5' quadrangle DEMs (Figure 5). Our approach involved fitting a smoothed surface to the elevations oflocal peaks to create a reference surface againstwhich to evaluate the amountofmaterial removed frombetweenmountain tops (i.e. the amount of material differentially eroded due to valley development). To determine theappropriate surface for our analysis we fitted a series of surfaces to the envelope defined by the highest peakswithin a search radius that varied from 1 to 15 km in 0�3 km increments. The total volume ofmaterial within thefittedsurfacewasgreatestwithasearchradiusofbetween5and10km,andforouranalysiswesoughtamaximumconstraint on the ultimate effect onmountain heights.Hence,weused a 6�6kmsearch radius as itmaximized thetotal volume beneath the fitted surface. The net volume of material differentially eroded from valleys wasdetermined from the elevation difference for each 30 m grid cell between the DEM and the smoothed surfacefitted to the peaks. Mean elevation, maximum elevation and the equivalent thickness of material differentiallyerodedbyvalley development (i.e. the volumeof `missing'material dividedbygrid area)were calculated for a 5km grid from the respective values from the 30 m grid.
Figure 5. Shaded relief image of the compiled 30 m grid DEM of the Olympic Mountains. Note the location of the highest peak, MountOlympus, in the centre of the range. The rectangle represents the area of transect shown in Figures 7 and 9. The irregular border shows the
analysis area for Figures 6 and 8
Copyright # 2000 John Wiley & Sons, Ltd. Earth Surf. Process. Landforms 25, 385±396 (2000)
390 D. R. MONTGOMERY AND H. M. GREENBERG
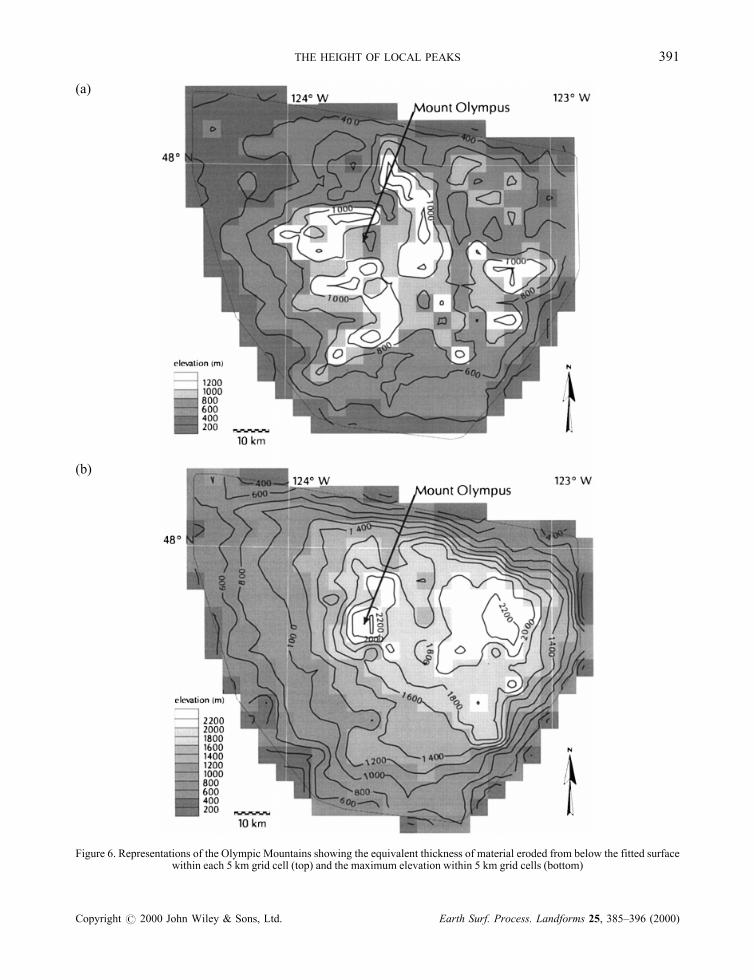
Figure 6. Representations of the Olympic Mountains showing the equivalent thickness of material eroded from below the fitted surfacewithin each 5 km grid cell (top) and the maximum elevation within 5 km grid cells (bottom)
(a)
(b)
Copyright # 2000 John Wiley & Sons, Ltd. Earth Surf. Process. Landforms 25, 385±396 (2000)
THE HEIGHT OF LOCAL PEAKS 391
The spatial distribution of mean and maximum elevations in the Olympic Mountains exhibits somesignificant differences. The mean elevation generally increases to the east across the range. At a 5 km gridsize, mean elevations in the western Olympics are below 1000 m; the central core of the range has meanelevations that range from 500 to 1500 m; and the eastern end of the range has mean elevations in the 1000 to2000 m range. In contrast, the maximum elevations show two distinct areas of high peaks: a small areacentred on 2417 m high Mount Olympus and a broader area of high peaks at the eastern end of the range(Figure 6 a). Perhaps most striking is that the highest peak in the range does not sit in the area of greatest meanelevation±Olympus stands alone in the centre of the range.The equivalent thickness of material differentially eroded from between mountain peaks (i.e. the net
amount of `missing' material) is greatest in the deeply incised Hoh, Queets and Elwha valleys which surroundMount Olympus (Figure 6 b). In contrast, the area of high peaks at the eastern end of the range hosts relativelysmall valleys. Although flexural rigidity in the crust limits the amount of actual rebound to less than predictedfor Airy isostasy, as discussed further below, these observations indicate that incision of deep valleys in thecore of the range could have substantially affected the height of the highest peak.Examination of trends in mean and maximum elevations across the Olympic Mountains shows that Mount
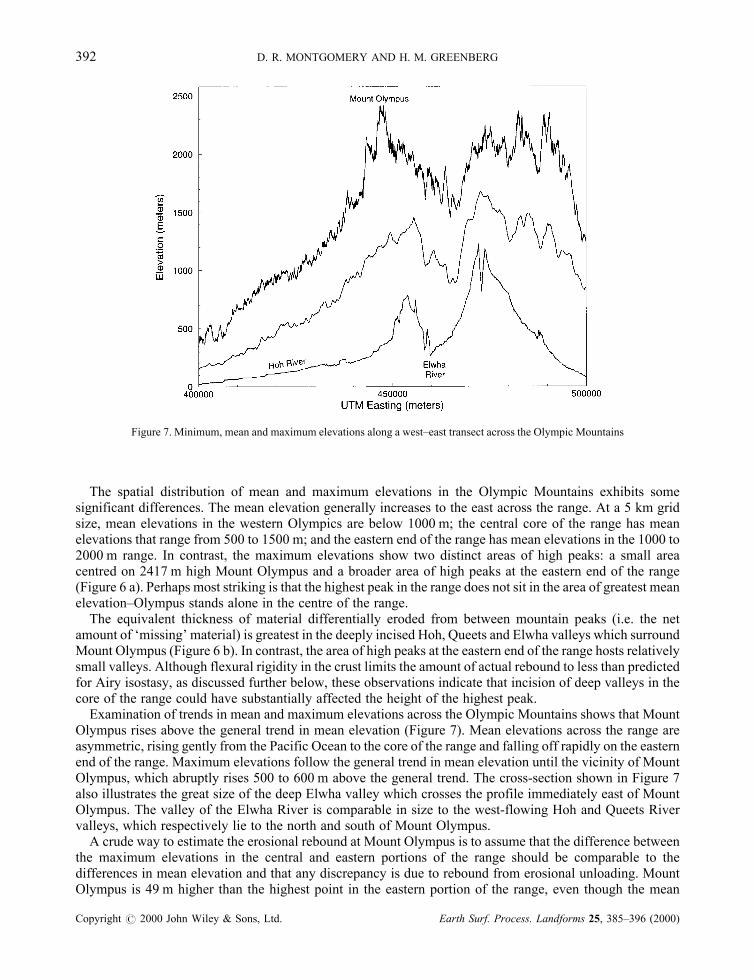
Olympus rises above the general trend in mean elevation (Figure 7). Mean elevations across the range areasymmetric, rising gently from the Pacific Ocean to the core of the range and falling off rapidly on the easternend of the range. Maximum elevations follow the general trend in mean elevation until the vicinity of MountOlympus, which abruptly rises 500 to 600 m above the general trend. The cross-section shown in Figure 7also illustrates the great size of the deep Elwha valley which crosses the profile immediately east of MountOlympus. The valley of the Elwha River is comparable in size to the west-flowing Hoh and Queets Rivervalleys, which respectively lie to the north and south of Mount Olympus.A crude way to estimate the erosional rebound at Mount Olympus is to assume that the difference between
the maximum elevations in the central and eastern portions of the range should be comparable to thedifferences in mean elevation and that any discrepancy is due to rebound from erosional unloading. MountOlympus is 49 m higher than the highest point in the eastern portion of the range, even though the mean
Figure 7. Minimum, mean and maximum elevations along a west±east transect across the Olympic Mountains
Copyright # 2000 John Wiley & Sons, Ltd. Earth Surf. Process. Landforms 25, 385±396 (2000)
392 D. R. MONTGOMERY AND H. M. GREENBERG
elevations in the central Olympics are about 500 m lower (Figure 7). If this excess height of Mount Olympusover the general range of mean elevations in the core of the range reflects rebound due to erosion of thevalleys that surround it, then the total rebound is roughly 550 m, or 23 per cent of the elevation of MountOlympus.
THREE-DIMENSIONAL REBOUND MODEL
A more sophisticated model of the contribution of erosional unloading to the elevation of Mount Olympuscan be obtained by incorporating the effect of flexural rigidity of the crust into predictions of the isostatic rockuplift in response to the negative load associated with valley development. Anderson (1994) modelled thethree-dimensional flexural support for topography by summing the local deflection predicted by a model ofresponse to point loads at each grid cell in a landscape. Here we invert this approach to predict the isostaticrebound from erosional unloading. Our analysis represents the vertical deflection due to a point load (w) by(Lambeck, 1988):
wr
�
� � q
2��mg�2
� �Kel
r
�
� ��10�
where (r/�) is the non-dimensional distance from the point load, �m is the density of the mantle, q is the pointload taken to be ÿzg�c dx dy, z is the equivalent eroded thickness, �c is the density of the crust, dx and dy arethe grid cell dimensions, Kel is the Kelvin function (see Abramowitz and Stegun, 1965), and the flexuralparameter � is given by:
� � �D=�cg�1=4 �11�
where D is the flexural rigidity of the crust, which can be estimated from the effective elastic thickness of thecrust through:
D � ET3=12�1ÿ v2� �12�
where E is the modulus of elasticity, T is the effective elastic thickness, and v is Poisson's ratio. In generalE = 8�35� 1010 N mÿ2 and v = 0�25, but values for T, and therefore D, are more difficult to constrain.
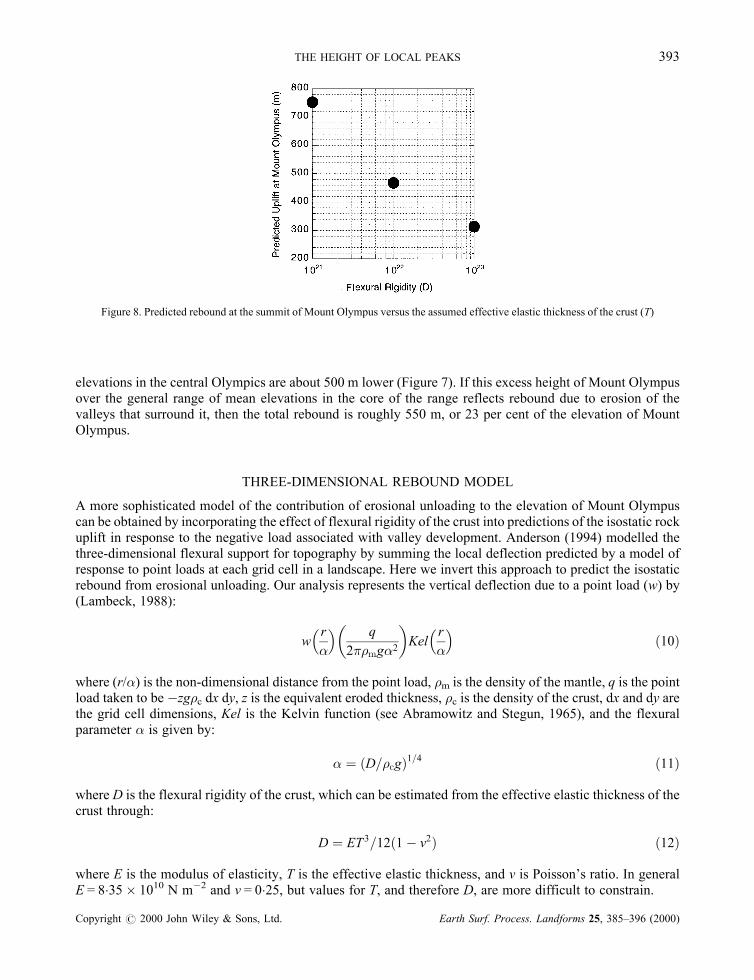
Figure 8. Predicted rebound at the summit of Mount Olympus versus the assumed effective elastic thickness of the crust (T)
Copyright # 2000 John Wiley & Sons, Ltd. Earth Surf. Process. Landforms 25, 385±396 (2000)
THE HEIGHT OF LOCAL PEAKS 393
The pattern of predicted isostatic rebound for the Olympic Mountains was calculated using Equation 10 togenerate the expected pattern of compensation for the material eroded from below the fitted surface for a300 m grid aggregated from values for each 30 m grid cell. This resulted in a predicted rebound patternassociated with each 300 m grid cell. The pattern of total net rebound was calculated by summing the reboundfields predicted from each of these patterns for each of these grid cells. The simulated pattern of isostaticresponse to valley development predicts the greatest amount of rebound in the vicinity of Mount Olympus,and little net rebound for the area of high peaks in the eastern end of the Olympics. The magnitude oferosional rebound varies with the effective elastic thickness of the crust. With a range of flexural rigidity of1021 to 1023 N m, which corresponds to a range of T values of 5 to 24 km, the predicted rebound at MountOlympus ranges from 310 to 750 m (Figure 8).
DISCUSSION
The value assumed for the effective elastic thickness of the crust controls the magnitude of the predictedrebound of Mount Olympus. The northwest coast of the United States has an average crustal thickness of 20km (Couch and Riddihough, 1989; Mooney and Weaver, 1989), and the crustal rocks that form the OlympicMountains increase from a thickness of approximately 10 km at the coast to 30 km at their eastern margin(Brandon and Calderwood, 1990; Finn, 1990). Riddihough (1978) also favoured a crustal thickness of about20 km beneath the Olympic Peninsula. However, the effective elastic thickness of the crust is likely to bemuch less due to the shallow hot slab. Hence, the effective elastic thickness beneath the Olympic Mountainsis probably less than 20 km. Banks et al. (1977) concluded that the flexural rigidity of the crust in the UnitedStates was between 1021 and 1022 N m, and hence that the effective elastic thickness was between 5 and 11km. Bechtel et al. (1990) also reported effective elastic thickness values<10 km for western North America.We conclude that a value of 5� T� 10 km is reasonable for the Olympics. Hence, it is likely that roughly500 to 750 m of the elevation of Mount Olympus is due to erosional unloading in response to valleydevelopment over the life of the range. This amount of `superelevation' of the peak of Olympus was enoughto raise it above peaks in the eastern end of the range.The deep valleys that surround Mount Olympus were probably enlarged by valley glaciers during the
Pleistocene. The addition of substantial elevation to Mount Olympus would have exerted a positive feedbackon glacier development and the associated valley size in a manner described as a `topographic lightning rod'by Brozovic et al. (1997). The prevailing winds blow from the west in the Olympics and there is a strongrainfall gradient across the range. Hence, as Olympus rose it would have intercepted a greater proportion ofthe incoming precipitation, which would have enhanced glacier growth, accelerated valley incision, andincreased erosionally induced uplift of the remaining massif. Whether or not a strong feedback occurred, ouranalysis reveals that incision of deep valleys in the centre of the range is probably responsible for the locationof the highest peak significantly westward of the area of greatest mean elevations.It is also curious that long-term denudation rates are highest in the middle of the range (Brandon et al.,
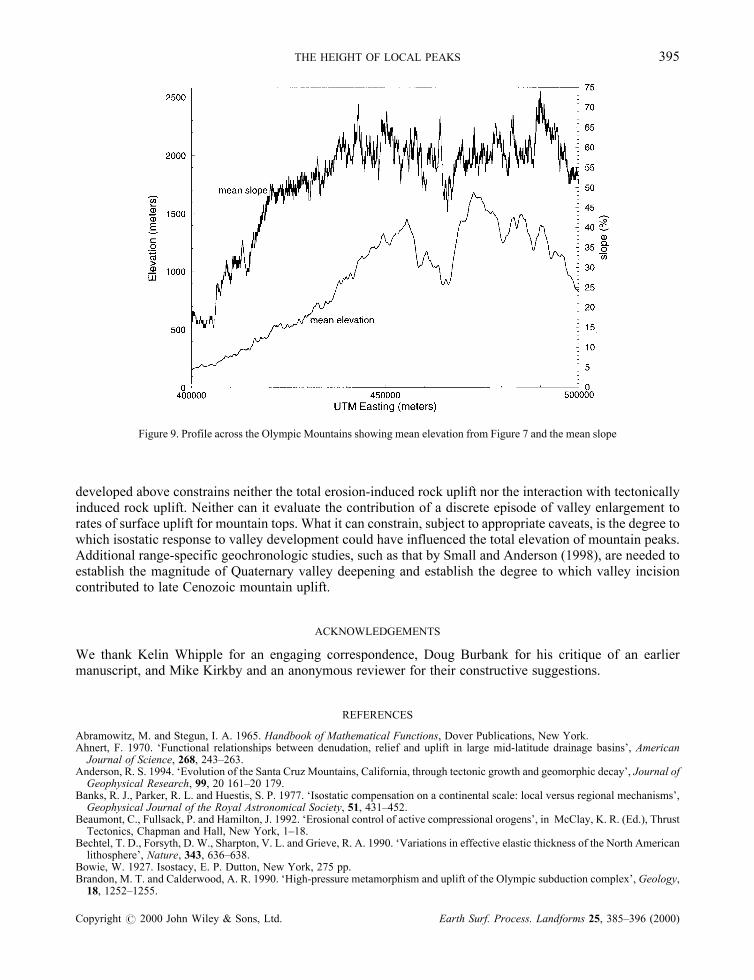
1998), whereas mean and peak elevations (except for Olympus) are higher at the eastern end of the range(Figure 7). Conventional wisdom holds that erosion rates increase with relief (Ruxton and McDougall, 1967;Ahnert, 1970), but the strong gradient in precipitation across the range probably retards erosion rates in thehigh topography of the eastern Olympics, as does the belt of highly competent basalt in this area. Similarity inmean slopes across the core of the Olympics (Figure 9) suggests that the centre of the range may be athreshold landscape, in which slopes are as steep as the rock can support (Schmidt and Montgomery, 1995;Burbank et al., 1996). If this is the case, then the high rates of exhumation in the core of the range may simplyreflect the higher rainfall and generally steeper slopes than in the outer areas of the range.The proportion of the total elevation of Mount Olympus that we estimate could be accounted for by
erosional unloading (21 to 32 per cent) is comparable to the maximum estimates of 25 to 30 per cent in otherregions based on cross-sectional analyses (Montgomery, 1994; Gilchrist et al., 1994). Appropriate estimatesof the effective elastic thickness of the crust may be difficult to constrain, but it is generally recognized thatvalley incision will exert a greater effect on the height of mountain peaks in areas with weak crust and widevalleys than in areas with strong crust and narrow valleys. It is important to recognize that the approach
Copyright # 2000 John Wiley & Sons, Ltd. Earth Surf. Process. Landforms 25, 385±396 (2000)
394 D. R. MONTGOMERY AND H. M. GREENBERG
developed above constrains neither the total erosion-induced rock uplift nor the interaction with tectonicallyinduced rock uplift. Neither can it evaluate the contribution of a discrete episode of valley enlargement torates of surface uplift for mountain tops. What it can constrain, subject to appropriate caveats, is the degree towhich isostatic response to valley development could have influenced the total elevation of mountain peaks.Additional range-specific geochronologic studies, such as that by Small and Anderson (1998), are needed toestablish the magnitude of Quaternary valley deepening and establish the degree to which valley incisioncontributed to late Cenozoic mountain uplift.
ACKNOWLEDGEMENTS
We thank Kelin Whipple for an engaging correspondence, Doug Burbank for his critique of an earliermanuscript, and Mike Kirkby and an anonymous reviewer for their constructive suggestions.
REFERENCES
Abramowitz, M. and Stegun, I. A. 1965. Handbook of Mathematical Functions, Dover Publications, New York.Ahnert, F. 1970. `Functional relationships between denudation, relief and uplift in large mid-latitude drainage basins', AmericanJournal of Science, 268, 243±263.
Anderson, R. S. 1994. `Evolution of the Santa Cruz Mountains, California, through tectonic growth and geomorphic decay', Journal ofGeophysical Research, 99, 20 161±20 179.
Banks, R. J., Parker, R. L. and Huestis, S. P. 1977. `Isostatic compensation on a continental scale: local versus regional mechanisms',Geophysical Journal of the Royal Astronomical Society, 51, 431±452.
Beaumont, C., Fullsack, P. and Hamilton, J. 1992. `Erosional control of active compressional orogens', in McClay, K. R. (Ed.), ThrustTectonics, Chapman and Hall, New York, 1±18.
Bechtel, T. D., Forsyth, D. W., Sharpton, V. L. and Grieve, R. A. 1990. `Variations in effective elastic thickness of the North Americanlithosphere', Nature, 343, 636±638.
Bowie, W. 1927. Isostacy, E. P. Dutton, New York, 275 pp.Brandon, M. T. and Calderwood, A. R. 1990. `High-pressure metamorphism and uplift of the Olympic subduction complex', Geology,18, 1252±1255.
Figure 9. Profile across the Olympic Mountains showing mean elevation from Figure 7 and the mean slope
Copyright # 2000 John Wiley & Sons, Ltd. Earth Surf. Process. Landforms 25, 385±396 (2000)
THE HEIGHT OF LOCAL PEAKS 395
Brandon, M. T., Roden-Tice, M. K. and Garver, J. I. 1998. `Late Cenozoic exhumation of the Cascadia accretionary wedge in theOlympic Mountains, northwest Washington State', Geological Society of America Bulletin, 110, 985±1009.
Brozovic, N., Burbank, D. W. and Meigs, A. J. 1997. `Climatic limits on landscape development in the Northwestern Himalaya',Science, 276, 571±574.
Burbank, D. W., Leland, J., Fielding, E., Anderson, R. S., Brozovic, N., Reid, M. R. and Duncan, C. 1996. `Bedrock incision, rockuplift and threshold hillslopes in the northern Himalayas', Nature, 379, 505±510.
Couch, R. W. and Riddihough, R. P. 1989. `The crustal structure of the western continental margin of North America', in Pakiser, L. C.and Mooney, W. D. (Eds), Geophysical Framework of the Continental Unites States, Geological Society of America Memoir 172,103±128.
England, P. and Molnar, P. 1990. `Surface uplift, uplift of rocks, and exhumation of rocks', Geology, 18, 1173±1177.Finn, C. 1990. `Geophysical constraints onWashington convergent margin structure', Journal of Geophysical Research, 95, 19 533±19546.
Forsyth, D. W. 1985. `Subsurface loading and estimates of the flexural rigidity of the continental lithosphere', Journal of GeophysicalResearch, 90, 12 623±12 632.
Gilchrist, A. R. and Summerfield, M. A. 1990. `Differential denudation and flexural isostasy in formation of rifted-margin upwarps',Nature, 346, 739±742.
Gilchrist, A. R. and Summerfield, M. A. 1991. `Denudation, isostasy and landscape evolution', Earth Surface Processes andLandforms, 16, 555±562.
Gilchrist, A. R., Summerfield, M. A. and Cockburn, H. A. P. 1994. `Landscape dissection, isostatic uplift, and the morphologicdevelopment of orogens', Geology, 22, 963±966.
Holmes, A. 1944. Principles of Physical Geology, Thomas Nelson and Sons, London, 532 pp.Jeffreys, H. 1929. The Earth: Its Origin, History and Physical Constitution, 2nd edn, The Macmillan Company, New York, 346 pp.Lambeck, K. 1988. Geophysical Geodesy: The Slow Deformations of the Earth, Clarendon Press, Oxford, 718 pp.McNutt, M. and Menard, H. W. 1978. `Lithospheric flexure and uplifted atolls', Journal of Geophysical Research, 83, 1206±1212.Molnar, P. and England, P. 1990. `Late Cenozoic uplift of mountain ranges and global climate change: Chicken or egg?', Nature, 346,29±34.
Montgomery, D. R. 1994. `Valley incision and the uplift of mountain peaks', Journal of Geophysical Research, 99, 13 913±13 921.Mooney, W. D. and Weaver, C. S. 1989. `Regional crustal structure and tectonics of the Pacific Coastal States California, Oregon, andWashington', in Pakiser, L. C. and Mooney, W. D. (Eds), Geophysical Framework of the Continental Unites States, GeologicalSociety of America Memoir 172, 129±161.
Quinlan, G. M. and Beaumont, C. 1984. `Appalachian thrusting, lithospheric flexure, and the Paleozoic stratigraphy of the EasternInterior of North America', Canadian Journal of Earth Sciences, 21, 973±996.
Riddihough, R. P. 1978. `Gravity and structure of an active margin ± British Columbia and Washington', Canadian Journal of EarthSciences, 16, 350±363.
Ruxton, B. P. and McDougall, I. 1967. `Denudation rates in northeast Papua from potassium-argon dating of lavas', American Journalof Science, 265, 545±561.
Schmidt, K. M. and Montgomery, D. R. 1995. `Limits to relief', Science, 270, 617±620.Small, E. E. and Anderson, R. S. 1995. `Geomorphically driven late Cenozoic rock uplift in the Sierra Nevada, California', Science,270, 277±280.
Small, E. E. and Anderson, R. S. 1998. `Pleistocene relief production in Laramide mountain ranges, western United States', Geology,26, 123±126.
Suess, E. 1909. The Face of the Earth Volume IV, (Das Antlitz der Erde, translated by H. B. C. Sollas), Clarendon Press, Oxford, 673pp.
Tabor, R. W. and Cady, W. M. 1978. The Structure of the Olympic Mountains, Washington ± Analysis of a Subduction Zone, USGeological Survey Professional Paper 1033, 38 pp.
Wager, L. R. 1933. `The rise of the Himalaya', Nature, 132, 28.Wager, L. R. 1937. `The Arun River drainage pattern and the rise of the Himalaya', Geographical Journal, 89, 239±250.Willett, S. D., Beaumont, C. and Fullsack, P. 1993. `Mechanical model for the tectonics of doubly vergent compressional orogens',Geology, 21, 371±374.
Zeitler, P. K., Chamberlain, C. P. and Smith, H. A. 1993. `Synchronous anatexis, metamorphism, and rapid denudation at Nanga Parbat(Pakistan Himalaya)', Geology, 21, 347±350.
Copyright # 2000 John Wiley & Sons, Ltd. Earth Surf. Process. Landforms 25, 385±396 (2000)
396 D. R. MONTGOMERY AND H. M. GREENBERG