local government toolkit: financing energy effi ciency … · local government toolkit: financing...
TRANSCRIPT
Local Government Toolkit:Financing Energy Effi ciency
and Renewable EnergySALGASouth African Local Government association
www.salga.org.za

02
ACKNOWLEDGEMENTSThe prepara on of this Toolkit (Guideline / Case Study) was funded through the Swiss Agency for Development and Coopera on’s (SDC)
“Energy Effi cient Buildings Programme 2010-2013”. The South African Local Government Associa on (SALGA) has been responsible for facilita ng the implementa on of the local government component of this programme in South Africa.
AUTHORS
FutureWorksProf James Blignaut, Ms Nicci Diederichs Mander, Mr Michael Van Niekerk
Urban EarthMs Margaret McKenzie, Ms Amanda Botes
PUBLICATION DETAILS
First published in February 2014.
Copyright the South African Local Government Associa on.
CONTACTThe Execu ve Director, Municipal Infrastructure Services
Block B, Menlyn Corporate Park175 Corobay Ave, Cnr Garsfontein Rd
Waterkloof Glen X11, PretoriaTel: 012 639 8000 Fax: 012 639 8001www.salga.org.za
03
www.futureworks.co.za
www.urbanearth.co.za
04
1 Introduc on ........................................................................................................ 05
2 Mechanisms for Financing Energy Investments ................................................. 05
2.1 External Funding .......................................................................................... 06
2.2 Internal Funding .......................................................................................... 07
2.3 Incen ves and Partnerships ....................................................................... 07
2.4 Regula on ................................................................................................... 10
3 Assessing which Financing Mechanism to Use ................................................... 10
4 Tools for Unlocking Project Financing ................................................................ 12
4.1 The Project Business Plan ............................................................................ 12
4.1.1 Why are Project Business Plans Important? ..................................... 12
4.1.2 What should a Project Business Plan Contain? ................................. 12
4.2 Establishing the Financial Feasibility of a Project ......................................... 14
4.2.1 Payback Period .................................................................................. 15
4.2.2 Cost-Eff ec veness Method ................................................................ 15
4.2.3 Benefi t-Cost Analysis .......................................................................... 16
4.2.4 Conclusion ........................................................................................ 16
5 Further Resources ............................................................................................. 17
6 Glossary – Acronyms and Technical Terms ......................................................... 18
TABLE OF CONTENTS
05
Owing to the challenges that have arisen with respect to na onal energy genera on shortages and the increasing cost of electricity and fuels, municipali es in South Africa are playing an expanded role in energy management, which now includes the promo on of energy effi ciency and renewable energy genera on over and above their historic role of electricity distribu on.
One of the main drivers of this more holis c focus on energy management by municipali es has been decreased levels of energy security in the country as a result of Eskom’s diffi cul es in supplying suffi cient electricity to meet demand. Municipali es have considerable infl uence over how energy is supplied and used in their areas of jurisdic on. A er Eskom, local municipali es play the biggest role in distribu ng electricity in South Africa.
Municipali es are increasingly iden fying the need to consider forms of local energy genera on to protect their local economies from disrup ons and have also priori sed energy effi ciency so that they can assist in reducing pressure on the na onal grid. Municipali es have iden fi ed local provision of energy services as a key economic growth opportunity. Rather than expor ng money from their local economies for the purchase of
energy in the form of electricity and imported fuels, local energy genera on and energy effi ciency services can create local jobs.
As the South African Government has commi ed the country to reducing its impact on global climate through cu ng carbon (or greenhouse gas) emissions by 34% by 2020 and 42% by 2025, South African municipali es are required to respond at the local level by reducing the total greenhouse gas emissions footprint within their areas of jurisdic on. Considering that electricity provision in South Africa is carbon intensive, municipali es are looking for alterna ve forms of energy provision and ways to reduce energy consump on that reduce their greenhouse gas footprints and help to create low carbon living and working environments.
While there are many reasons and mo va ons for municipali es to implement energy effi ciency and renewable energy projects, the primary barrier to progress cited by mun-icipali es across the country is a lack of access to funding.
This toolkit aims to empower all municipali es in South Africa with the knowledge and a set of prac cal tools to assist them in eff ec vely raising the funds needed to implement energy effi ciency and renewable energy projects.
1. INTRODUCTION
The purpose of this sec on is to present a suite of mechanisms that are currently available for fi nancing energy effi ciency and renewable energy investments. In preparing this toolkit, a number of addi onal mechanisms were iden fi ed which have not been included as they were either not currently available in South Africa or are not feasible given current condi ons. However, if these condi ons change, more op ons may become available in the future.
While the focus of the toolkit is on funding mechanisms available to local government for fi nancing energy investments, a number of addi onal mechanisms have been included in the toolkit which may be more relevant to local residents and businesses.
This does not however mean that local government has no role to play in assis ng local residents and businesses in accessing these fi nancing mechanisms, par cularly if the municipality intends to pursue a reduc on in the municipal total energy demand and greenhouse gas footprint. The role that local government can play for each of the iden fi ed fi nancing mechanisms is discussed in the tables that follow. Note also that some of these fi nancing mechanisms may even result in a revenue loss for local government through reduced electricity sales.
The following fi nancing mechanisms are grouped into four categories, namely external funding, internal funding, incen ves and partnerships, and regula on.
2. MECHANISMS FOR FINANCING ENERGY INVESTMENTS

06
2.1 External Funding
Mechanism Descrip on Examples Strengths Weaknesses Municipality's role
Grants Non-repayable funds made available by a government department, donor funder or the private sector.
EEDSM programme
Green fund
Donor funding from foreign countries
The most accessible form of funding for municipal EE / RE ini a ves.Provides a municipality with access to its own energy effi ciency or renewable energy fund.Can custom-make the applica on of the fund to serve the needs of the municipality.If the municipality can demonstrate a good track record, future funding opportuni es increase.There is replicability and peer-learning between municipali es.
Access to these funds tend to be highly compe ve and hence not easily accessible.Funds tend to have a short-term me horizon seeking to address a mul tude of objec ves.Funding o en for pilot projects - not roll-out. Municipality may not have the capacity, skills or experience to implement.If the municipality demonstrates a poor implementa on track record, then they may lose future funding opportuni es.
Municipality applies for funds, which o en implies preparing and submi ng a proposal to funding agents.If successful, municipality implements the project subject to the specifi ed terms.On-going monitoring and evalua on of project.Repor ng on project achievements, sharing learnings with other municipali es etc.
Loans Borrowing money from the private/fi nancial sector.
Commercial banks e.g. Standard bankDTI Manufacturing Compe veness Enhancement Programme (MCEP) IDC & Kfw Green Energy Effi ciency Fund (GEEF)French Development Bank (AFD)Sustainable Se lements Facility (SSF)The Development Bank of Southern Africa (DBSA)
Can provide funding for upfront costs, par cularly if the payback period is short.O en loans from the foreign funders have reduced / lower interest rates than local commercial banks. The fund can be custom-made to serve the need of the user.
Municipali es may choose not to take loans for EE / RE ini a ves unless the fi nancial benefi ts can be clearly defi ned in rela on to the loan repayment criteria.Municipali es cannot provide loans to the private sector due to restric ons imposed by the MFMA.Fund will have to be repaid with interest.Securing the funds could take a long me and be associated with high transac on costs.A municipality can borrow funds to implement projects only if it can demonstrate the ability to repay the loan.
Providing the relevant informa on to industry and other partners concerning the op ons available.Assis ng the private sector in fi nding and nego a ng the terms of the fi nances, as well as implemen ng the project.Facilitator / mediator between users and loan fi nancers - see Olievenhoutbosch Project in Tshwane.
Carbon Trading
Sale of Cer fi ed Emissions Reduc ons (CERs), and/or Verifi ed Emissions Reduc ons (VERs) credits to co-fi nance EE / RE project.
Kuyasa CDM ProjectMarianhill / Bisasaar Rd Landfi ll gas-to-electricity projects
Can provide valuable co-fi nancing for EE / RE projects.Has marke ng and/or labelling benefi ts.
High transac on cost for achieving cer fi ca on and paying for ongoing verifi ca on.High barriers to entry in cer fi ca on and compliance repor ng - cumbersome and complex process.Requires projects of suffi cient scale to implement.Cer fi ca on can be expensive, take a long me and require highly specialised knowledge.Viability dependent on the market price one can obtain for the product - in the case of carbon this is highly variable.Need to be able to prove that the project will not be feasible without the revenue from carbon credit sales (something called "addi onality") - this can be a major stumbling block in the cer fi ca on process.
Iden fy, ini ate and facilitate projects.Likely to carry the transac on costs of cer fi ca on.Some of the ac vi es could be assigned to third par es at the cost of the municipality.Long term commitment to monitoring and verifi ca on costs and exper se required.
Mechanism Descrip on Examples Strengths Weaknesses Municipality's role
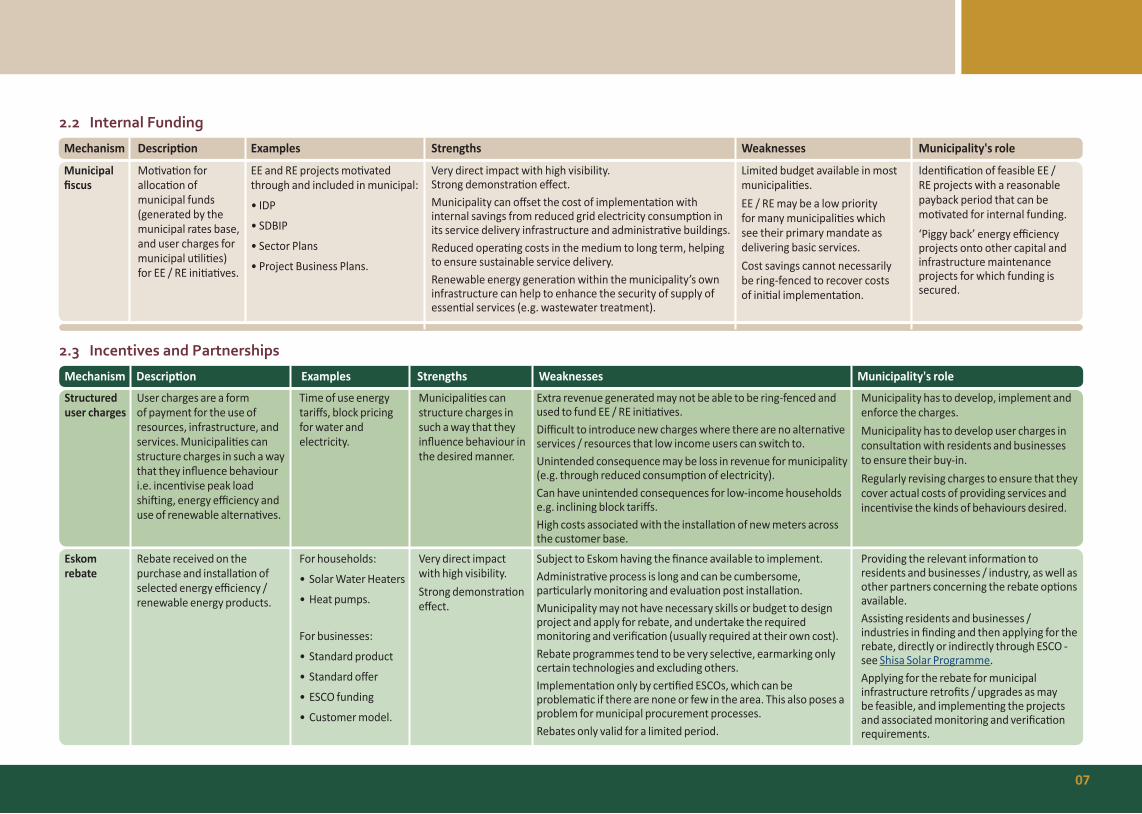
Municipal fi scus
Mo va on for alloca on of municipal funds (generated by the municipal rates base, and user charges for municipal u li es) for EE / RE ini a ves.
EE and RE projects mo vated through and included in municipal:
• IDP
• SDBIP
• Sector Plans
• Project Business Plans.
Very direct impact with high visibility.Strong demonstra on eff ect.Municipality can off set the cost of implementa on with internal savings from reduced grid electricity consump on in its service delivery infrastructure and administra ve buildings.Reduced opera ng costs in the medium to long term, helping to ensure sustainable service delivery.Renewable energy genera on within the municipality’s own infrastructure can help to enhance the security of supply of essen al services (e.g. wastewater treatment).
Limited budget available in most municipali es.EE / RE may be a low priority for many municipali es which see their primary mandate as delivering basic services.Cost savings cannot necessarily be ring-fenced to recover costs of ini al implementa on.
Iden fi ca on of feasible EE / RE projects with a reasonable payback period that can be mo vated for internal funding.‘Piggy back’ energy effi ciency projects onto other capital and infrastructure maintenance projects for which funding is secured.
2.2 Internal Funding
07
Mechanism Descrip on Examples Strengths Weaknesses Municipality's role
2.3 Incentives and Partnerships
Structured user charges
User charges are a form of payment for the use of resources, infrastructure, and services. Municipali es can structure charges in such a way that they infl uence behaviour i.e. incen vise peak load shi ing, energy effi ciency and use of renewable alterna ves.
Time of use energy tariff s, block pricing for water and electricity.
Municipali es can structure charges in such a way that they infl uence behaviour in the desired manner.
Extra revenue generated may not be able to be ring-fenced and used to fund EE / RE ini a ves.Diffi cult to introduce new charges where there are no alterna ve services / resources that low income users can switch to.Unintended consequence may be loss in revenue for municipality (e.g. through reduced consump on of electricity).Can have unintended consequences for low-income households e.g. inclining block tariff s.High costs associated with the installa on of new meters across the customer base.
Municipality has to develop, implement and enforce the charges.Municipality has to develop user charges in consulta on with residents and businesses to ensure their buy-in.Regularly revising charges to ensure that they cover actual costs of providing services and incen vise the kinds of behaviours desired.
Eskom rebate
Rebate received on the purchase and installa on of selected energy effi ciency / renewable energy products.
For households:
• Solar Water Heaters
• Heat pumps.
For businesses:
• Standard product
• Standard off er
• ESCO funding
• Customer model.
Very direct impact with high visibility.Strong demonstra on eff ect.
Subject to Eskom having the fi nance available to implement.Administra ve process is long and can be cumbersome, par cularly monitoring and evalua on post installa on.Municipality may not have necessary skills or budget to design project and apply for rebate, and undertake the required monitoring and verifi ca on (usually required at their own cost).Rebate programmes tend to be very selec ve, earmarking only certain technologies and excluding others.Implementa on only by cer fi ed ESCOs, which can be problema c if there are none or few in the area. This also poses a problem for municipal procurement processes.Rebates only valid for a limited period.
Providing the relevant informa on to residents and businesses / industry, as well as other partners concerning the rebate op ons available.Assis ng residents and businesses / industries in fi nding and then applying for the rebate, directly or indirectly through ESCO - see Shisa Solar Programme.Applying for the rebate for municipal infrastructure retrofi ts / upgrades as may be feasible, and implemen ng the projects and associated monitoring and verifi ca on requirements.

08
Mechanism Descrip on Examples Strengths Weaknesses Municipality's role
Tax rebate Business and industries are en tled to claim a tax deduc on for substan ated energy effi ciency savings.
Manufacturing-related projects with a 10% energy demand reduc on component.Energy effi ciency projects that reduce energy use.
Available to qualifying industries in all municipali es.No direct cost to Municipality.
Op on not available to municipali es.Municipali es do not have any control over whether the private sector will make use of the rebate or not.Rebates only valid for limited period.
Providing the relevant informa on to the private sector and other partners concerning the rebate op ons available.
Performance contrac ng
Ini al improvements iden fi ed, implemented, and paid for by service provider. Percentage of savings made is paid to service provider to cover ini al costs and maintenance. Alterna vely the improvements are paid for by the municipality and the service provider is required to guarantee the savings will be achieved and pay the diff erence if the expected savings are not achieved.
SABC & Johnson ControlsCity of Cape Town
Visible and immediate benefi ts for all par es.Easy to implement and operate.Incen ve for contractor to maximise energy savings achieved by the project as income is a percentage of these cost savings, but also to limit the costs of installa on thereby maximising cost effi ciency.Municipality does not have to have in-house capacity and exper se for successful implementa on – contracted third party usually uses their team of specialists.O en includes maintenance during the contract period - no addi onal burden on municipal staff .
Requires signifi cant foresight and vision to iden fy the project and cra the contract.Could be me-consuming and lead to delays as par es nego ate the terms of the contract.Transac on costs can be high, with a signifi cant percentage of savings going to the contracted third party.These kinds of contracts are usually longer than three years and will thus involve addi onal procedures in order to comply with the MFMA.
Providing the relevant informa on to industry and other partners concerning the op ons available.Facilita ng the implementa on of projects using a performance contrac ng model.Appoin ng Monitoring and Verifi ca on specialists to check and report on energy savings achieved.
Public-Private Partnerships (PPPs)
Long-term contractual agreements between a private operator/company and a public en ty, under which a service is provided, generally with related investments by both private and public sector partners.
Installa on of small-scale renewable energy alterna ves (Working for Energy)Johannesburg and EnergSystems - Waste to energy ini a ves.Olievenhoutbosch Housing Project
Can secure long-term and substan al fi nancial support, par cularly for large and complex projects.Can inject external exper se into the ambit of the municipality opera ng context.Municipality can achieve desired outcomes (e.g. renewable energy genera on, reduced carbon emissions) without having to carry the full costs of installa on and opera on.
Very high barriers to entry and transac on costs with the establishment of PPPs.Cumbersome, complex contrac ng process requiring substan al legal exper se.Requires projects of suffi cient scale to implement.Poor performance of private sector partner creates liability and costs for the municipality.
Iden fy projects, ini ate and facilitate process.Likely to carry the transac on cost.Some of the ac vi es could be assigned to third par es at cost to the municipality.
Facilita on / support
Municipality suppor ng third-party implemen ng agents.
Solar Water Heater roll-out in eThekwini, Nelson Mandela Bay, City of Cape Town and Ekhurhuleni.Renewable Energy Independent Power Producer Programme (REIPPP) projects.
Low cost to the municipality, but with signifi cant savings to industry and households.
Municipality needs competent partners and service providers to work with. Exis ng EE / RE rebate / incen ve programmes are usually needed to make the project work.Cost to municipality can be high if uptake is slow.
Municipality to iden fy poten al programmes, commence with marke ng, dissemina on of informa on, and facilita on of the implementa on process.All or parts of the process can be contracted to third par es.Planning approvals and environmental management support for REIPPP projects being implemented in the municipal area.
09
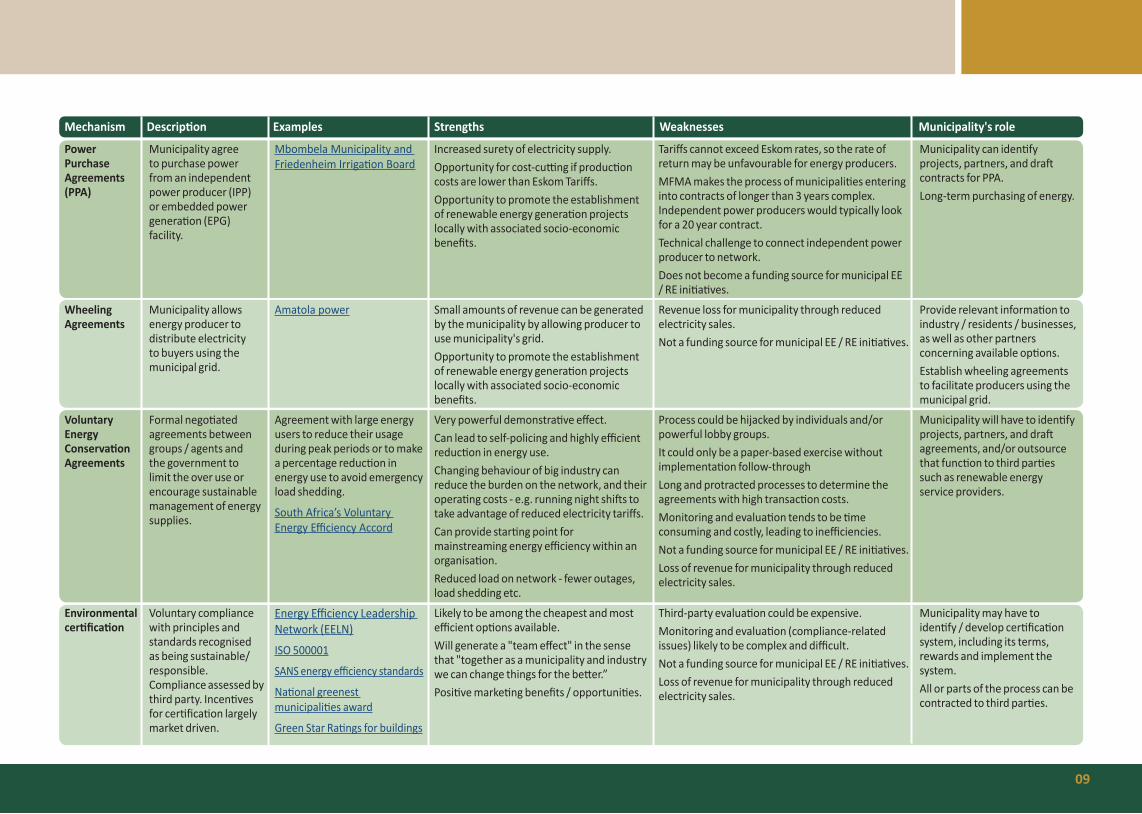
Mechanism Descrip on Examples Strengths Weaknesses Municipality's role
Power Purchase Agreements (PPA)
Municipality agree to purchase power from an independent power producer (IPP) or embedded power genera on (EPG) facility.
Mbombela Municipality and Friedenheim Irriga on Board
Increased surety of electricity supply.Opportunity for cost-cu ng if produc on costs are lower than Eskom Tariff s. Opportunity to promote the establishment of renewable energy genera on projects locally with associated socio-economic benefi ts.
Tariff s cannot exceed Eskom rates, so the rate of return may be unfavourable for energy producers.MFMA makes the process of municipali es entering into contracts of longer than 3 years complex. Independent power producers would typically look for a 20 year contract.Technical challenge to connect independent power producer to network.Does not become a funding source for municipal EE / RE ini a ves.
Municipality can iden fy projects, partners, and dra contracts for PPA.Long-term purchasing of energy.
Wheeling Agreements
Municipality allows energy producer to distribute electricity to buyers using the municipal grid.
Amatola power Small amounts of revenue can be generated by the municipality by allowing producer to use municipality's grid.Opportunity to promote the establishment of renewable energy genera on projects locally with associated socio-economic benefi ts.
Revenue loss for municipality through reduced electricity sales.Not a funding source for municipal EE / RE ini a ves.
Provide relevant informa on to industry / residents / businesses, as well as other partners concerning available op ons.Establish wheeling agreements to facilitate producers using the municipal grid.
Voluntary Energy Conserva on Agreements
Formal nego ated agreements between groups / agents and the government to limit the over use or encourage sustainable management of energy supplies.
Agreement with large energy users to reduce their usage during peak periods or to make a percentage reduc on in energy use to avoid emergency load shedding.
South Africa’s Voluntary Energy Effi ciency Accord
Very powerful demonstra ve eff ect.Can lead to self-policing and highly effi cient reduc on in energy use.Changing behaviour of big industry can reduce the burden on the network, and their opera ng costs - e.g. running night shi s to take advantage of reduced electricity tariff s.Can provide star ng point for mainstreaming energy effi ciency within an organisa on.Reduced load on network - fewer outages, load shedding etc.
Process could be hijacked by individuals and/or powerful lobby groups.It could only be a paper-based exercise without implementa on follow-throughLong and protracted processes to determine the agreements with high transac on costs.Monitoring and evalua on tends to be me consuming and costly, leading to ineffi ciencies.Not a funding source for municipal EE / RE ini a ves.Loss of revenue for municipality through reduced electricity sales.
Municipality will have to iden fy projects, partners, and dra agreements, and/or outsource that func on to third par es such as renewable energy service providers.
Environmental cer fi ca on
Voluntary compliance with principles and standards recognised as being sustainable/ responsible. Compliance assessed by third party. Incen ves for cer fi ca on largely market driven.
Energy Effi ciency Leadership Network (EELN)ISO 500001
SANS energy effi ciency standards
Na onal greenest municipali es award
Green Star Ra ngs for buildings
Likely to be among the cheapest and most effi cient op ons available.Will generate a "team eff ect" in the sense that "together as a municipality and industry we can change things for the be er.”Posi ve marke ng benefi ts / opportuni es.
Third-party evalua on could be expensive.Monitoring and evalua on (compliance-related issues) likely to be complex and diffi cult.Not a funding source for municipal EE / RE ini a ves.Loss of revenue for municipality through reduced electricity sales.
Municipality may have to iden fy / develop cer fi ca on system, including its terms, rewards and implement the system.All or parts of the process can be contracted to third par es.
10
3. ASSESSING WHICH FINANCING MECHANISM TO USE
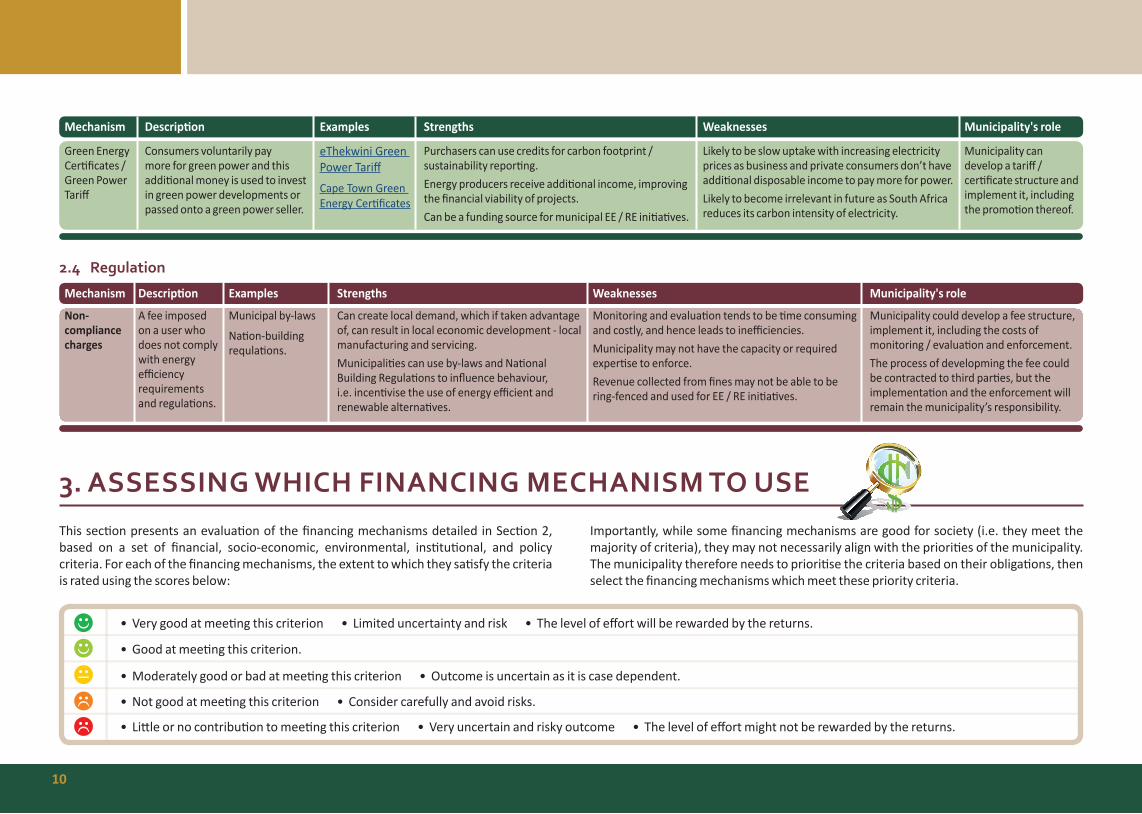
Mechanism Descrip on Examples Strengths Weaknesses Municipality's role
Green Energy Cer fi cates / Green Power Tariff
Consumers voluntarily pay more for green power and this addi onal money is used to invest in green power developments or passed onto a green power seller.
eThekwini Green Power Tariff Cape Town Green Energy Cer fi cates
Purchasers can use credits for carbon footprint / sustainability repor ng.Energy producers receive addi onal income, improving the fi nancial viability of projects. Can be a funding source for municipal EE / RE ini a ves.
Likely to be slow uptake with increasing electricity prices as business and private consumers don’t have addi onal disposable income to pay more for power.Likely to become irrelevant in future as South Africa reduces its carbon intensity of electricity.
Municipality can develop a tariff / cer fi cate structure and implement it, including the promo on thereof.
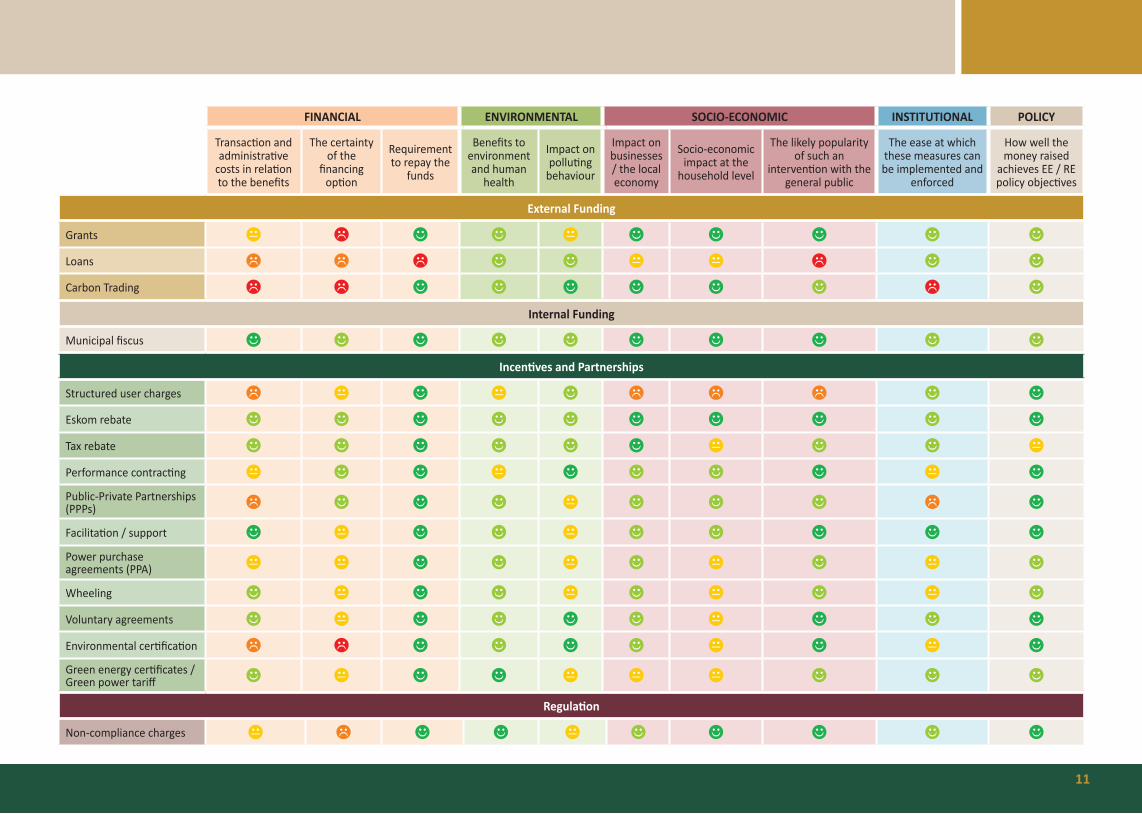
This sec on presents an evalua on of the fi nancing mechanisms detailed in Sec on 2, based on a set of fi nancial, socio-economic, environmental, ins tu onal, and policy criteria. For each of the fi nancing mechanisms, the extent to which they sa sfy the criteria is rated using the scores below:
Importantly, while some fi nancing mechanisms are good for society (i.e. they meet the majority of criteria), they may not necessarily align with the priori es of the municipality. The municipality therefore needs to priori se the criteria based on their obliga ons, then select the fi nancing mechanisms which meet these priority criteria.
2.4 Regulation
Mechanism Descrip on Examples Strengths Weaknesses Municipality's role
Non-compliance charges
A fee imposed on a user who does not comply with energy effi ciency requirements and regula ons.
Municipal by-laws
Na on-building requla ons.
Can create local demand, which if taken advantage of, can result in local economic development - local manufacturing and servicing.Municipali es can use by-laws and Na onal Building Regula ons to infl uence behaviour, i.e. incen vise the use of energy effi cient and renewable alterna ves.
Monitoring and evalua on tends to be me consuming and costly, and hence leads to ineffi ciencies.Municipality may not have the capacity or required exper se to enforce.Revenue collected from fi nes may not be able to be ring-fenced and used for EE / RE ini a ves.
Municipality could develop a fee structure, implement it, including the costs of monitoring / evalua on and enforcement.The process of developming the fee could be contracted to third par es, but the implementa on and the enforcement will remain the municipality’s responsibility.
• Very good at mee ng this criterion • Limited uncertainty and risk • The level of eff ort will be rewarded by the returns.
• Good at mee ng this criterion.
• Moderately good or bad at mee ng this criterion • Outcome is uncertain as it is case dependent.
• Not good at mee ng this criterion • Consider carefully and avoid risks.
• Li le or no contribu on to mee ng this criterion • Very uncertain and risky outcome • The level of eff ort might not be rewarded by the returns.
11
FINANCIAL ENVIRONMENTAL SOCIO-ECONOMIC INSTITUTIONAL POLICY
Transac on and administra ve
costs in rela on to the benefi ts
The certainty of the
fi nancing op on
Requirement to repay the
funds
Benefi ts to environment and human
health
Impact on pollu ng
behaviour
Impact on businesses / the local economy
Socio-economic impact at the
household level
The likely popularity of such an
interven on with the general public
The ease at which these measures can be implemented and
enforced
How well the money raised
achieves EE / RE policy objec ves
External Funding
Grants
Loans
Carbon Trading
Internal Funding
Municipal fi scus
Incen ves and Partnerships
Structured user charges
Eskom rebate
Tax rebate
Performance contrac ng
Public-Private Partnerships (PPPs)
Facilita on / support
Power purchase agreements (PPA)
Wheeling
Voluntary agreements
Environmental cer fi ca on
Green energy cer fi cates / Green power tariff
Regula on
Non-compliance charges
12
4.1 The Project Business Plan
4.1.1 Why are Project Business Plans Important?
When mo va ng for funding for energy projects, having a solid Project Business Plan is a cri cal requirement. Funders (whether internal or external to the municipality) will look to this plan for an understanding of the technical and organisa onal aspects of the project, what it aims to achieve, its feasibility (fi nancial, technical, social and environmental), who will be involved and who will benefi t, and the risks associated with the project (and how these can be managed). Project Business Plans produced by government should, in addi on, explain how the par cular project contributes towards the broader goals of the municipality – for example in terms of aims of the municipal Integrated Development Plan (IDP), or na onal policy direc ves that the municipality needs to respond to.
A well-wri en, thorough Project Business Plan sends a strong message to funders that the project applicant is serious about the project, and that they have thoroughly thought through and planned the project.
4.1.2 What should a Project Business Plan Contain?
There is no hard and fast rule for what a Project Business Plan must contain. Diff erent funders may have specifi c requirements for what needs to be presented to them in a Business Plan, or how certain informa on must be ar culated. Generally, however, Project Business Plans will contain the following components:
A. EXECUTIVE SUMMARY The execu ve summary is a short and concise sec on that summarises the main elements of the Business Plan in such a way that readers can rapidly become acquainted with the large body of material contained within it without having to read it all. It will usually contain a brief statement of the project, contextual informa on, a concise analysis of project feasibility and risks, as well as the main conclusions / recommenda ons of the Plan. It is intended as an aid to decision making by poten al funders and has been described as possibly the most important part of a Business Plan. It must be short and to the point.
B. INTRODUCTION The Introduc on sets the context for the rest of the Business Plan by sta ng succinctly WHAT the project is about, WHO is involved and WHY its being proposed / implemented: • Who is proposing the project, including any partners that are already involved, • What the project is aiming to achieve (i.e. primary goals / outputs), and• Why the project is being undertaken, and • Why it’s important.
The Introduc on must also state what the purpose of the Business Plan is (e.g. to support an Applica on for Funding from a foreign donor).
C: PROJECT CONTEXT This sec on explains the context of the project in terms of how it will contribute towards mee ng local, regional or na onal energy and climate protec on targets, environmental protec on and / or social equality aims, and fi nancial sustainability obliga ons. In some cases this sec on may also refer to how the project will assist a municipality meet its statutory obliga ons in terms of service delivery or legal compliance with na onal building regula ons etc.
D. PROJECT DESCRIPTION This sec on needs to describe in as much detail as possible the exact nature of the project. This needs to include a statement of the WHAT, WHERE, WHEN and HOW: • What the aims and / or goals of the project are (e.g. to reduce current electricity
consump on in targeted buildings by 30%), • What the project will involve (e.g. energy effi ciency retrofi t in municipal buildings),
including the scope and extent of the project (e.g. 10 buildings with a total square meterage of 6,000m2 will be retrofi ed),
• Where the proposed project is to be located, • Exactly how the project will be implemented, e.g.:
• what technologies will be u lised (e.g. LED lights, heat pumps and hydroboils will be retrofi ed),
• where the equipment and materials will be sourced from (e.g. locally produced or imported),
• who will implement the project, and who will benefi t from the project (and how they will benefi t),
• the meframes of the project – projected start and end dates.
4. TOOLS FOR UNLOCKING PROJECT FINANCING
13
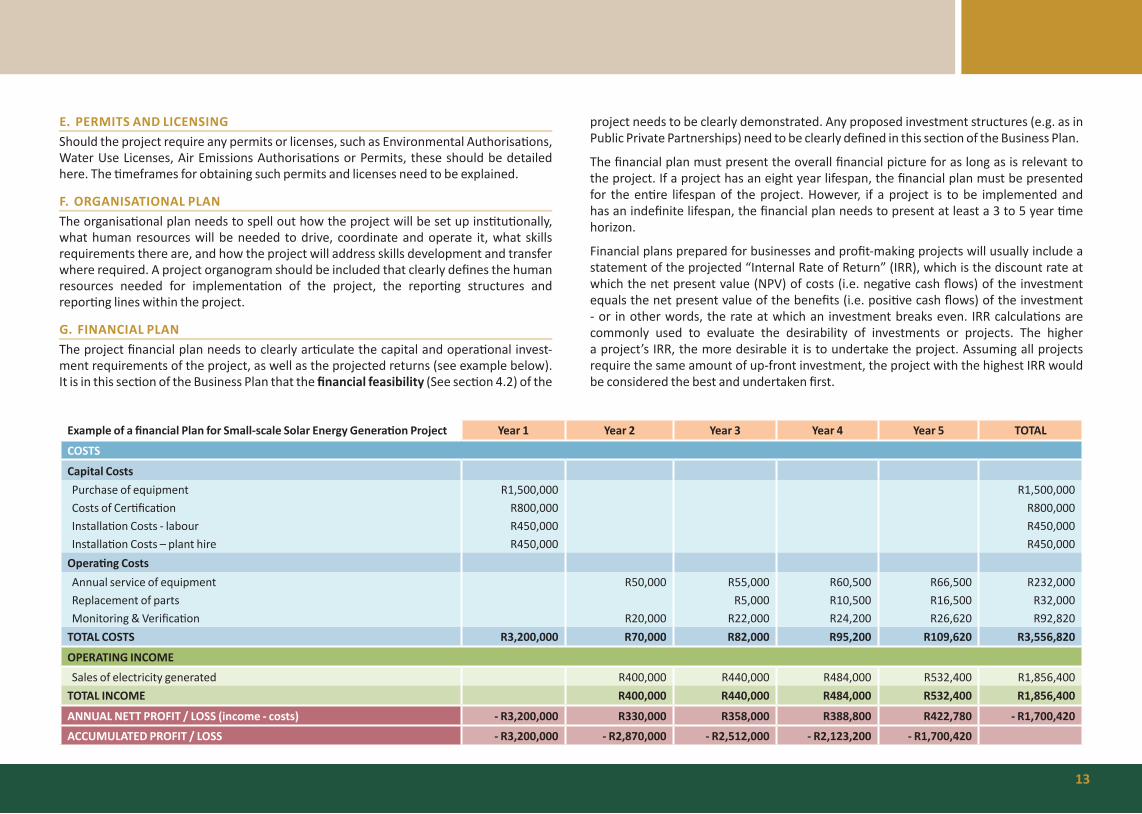
Example of a fi nancial Plan for Small-scale Solar Energy Genera on Project Year 1 Year 2 Year 3 Year 4 Year 5 TOTAL
COSTS
Capital Costs Purchase of equipment R1,500,000 R1,500,000 Costs of Cer fi ca on R800,000 R800,000 Installa on Costs - labour R450,000 R450,000 Installa on Costs – plant hire R450,000 R450,000Opera ng Costs Annual service of equipment R50,000 R55,000 R60,500 R66,500 R232,000 Replacement of parts R5,000 R10,500 R16,500 R32,000 Monitoring & Verifi ca on R20,000 R22,000 R24,200 R26,620 R92,820TOTAL COSTS R3,200,000 R70,000 R82,000 R95,200 R109,620 R3,556,820
OPERATING INCOME
Sales of electricity generated R400,000 R440,000 R484,000 R532,400 R1,856,400TOTAL INCOME R400,000 R440,000 R484,000 R532,400 R1,856,400
ANNUAL NETT PROFIT / LOSS (income - costs) - R3,200,000 R330,000 R358,000 R388,800 R422,780 - R1,700,420
ACCUMULATED PROFIT / LOSS - R3,200,000 - R2,870,000 - R2,512,000 - R2,123,200 - R1,700,420
E. PERMITS AND LICENSING Should the project require any permits or licenses, such as Environmental Authorisa ons, Water Use Licenses, Air Emissions Authorisa ons or Permits, these should be detailed here. The meframes for obtaining such permits and licenses need to be explained.
F. ORGANISATIONAL PLAN The organisa onal plan needs to spell out how the project will be set up ins tu onally, what human resources will be needed to drive, coordinate and operate it, what skills requirements there are, and how the project will address skills development and transfer where required. A project organogram should be included that clearly defi nes the human resources needed for implementa on of the project, the repor ng structures and repor ng lines within the project.
G. FINANCIAL PLAN The project fi nancial plan needs to clearly ar culate the capital and opera onal invest-ment requirements of the project, as well as the projected returns (see example below). It is in this sec on of the Business Plan that the fi nancial feasibility (See sec on 4.2) of the
project needs to be clearly demonstrated. Any proposed investment structures (e.g. as in Public Private Partnerships) need to be clearly defi ned in this sec on of the Business Plan.
The fi nancial plan must present the overall fi nancial picture for as long as is relevant to the project. If a project has an eight year lifespan, the fi nancial plan must be presented for the en re lifespan of the project. However, if a project is to be implemented and has an indefi nite lifespan, the fi nancial plan needs to present at least a 3 to 5 year me horizon.
Financial plans prepared for businesses and profi t-making projects will usually include a statement of the projected “Internal Rate of Return” (IRR), which is the discount rate at which the net present value (NPV) of costs (i.e. nega ve cash fl ows) of the investment equals the net present value of the benefi ts (i.e. posi ve cash fl ows) of the investment - or in other words, the rate at which an investment breaks even. IRR calcula ons are commonly used to evaluate the desirability of investments or projects. The higher a project’s IRR, the more desirable it is to undertake the project. Assuming all projects require the same amount of up-front investment, the project with the highest IRR would be considered the best and undertaken fi rst.
For public en es like municipali es, IRR may be used to select which investments to undertake, but usually Cost-eff ec veness, Payback period or Benefi t-cost Analysis is used instead (see Sec on 4.2). Some fi nancial ins tu ons may, however, require the IRR to be presented in a Business Plan. The calcula on of NPV and IRR is complex – unless you have studied accoun ng or economics. Fortunately, modern versions of Microso Excel and other spreadhseet programmes contain built-in formulae that calculate NPV and IRR for you. It is therefore suggested that Financial Plans be cra ed in such a spreadsheet programme in order that any necessary fi nancial analyses can be performed using the “fi nancial formulae” func ons.
H. SWOT ANALYSISThe inclusion of a “Strengths, Weaknesses, Opportuni es and Threats” analysis is an op onal component of the Business Plan. Owing to the fact that SWOT analyses in Business Plans are conducted by the proponent of the project, most funders will not pay a signifi cant amount of a en on to the content, and will do their own SWOT analysis of the project when considering whether to fund it. It is, however, a useful exercise to do a SWOT analysis when planning a project, as the deeper understanding of the project that is gained o en assists in preparing other sec ons of the Project Business Plan.
• Strengths: are current strong points about the project that are known. They may include the fact that the municipality has strong ins tu onal capacity and fi nancial backing for the project; or that there is signifi cant technical exper se for the project within the municipality.
• Opportuni es: are poten al future strengths that are an cipated. An example may include an iden fi ed opportunity to sell electricity generated by a renewable energy project to an industry. As this deal has not yet been struck it is presented as an opportunity rather than a strength.
• Weaknesses: these are known / exis ng weak points in the project or project plan. For example that the technologies required for a certain project can only be sourced from overseas, which may mean spare parts are not readily available.
• Threats: these are iden fi able future weaknesses or risks that may aff ect the viability or performance of the project.
I. RISK ANALYSIS This sec on must describe all poten al risks (technical, logis cal, fi nancial, human resources / skills etc.) that may result in the project failing. The measures that the project owner / developer will put in place to address these risks must also be described. It is important that when preparing this sec on that honesty prevails – a funder that can spot obvious fi nancial, technical or other risks in the project that are not included in the Business Plan will begin to doubt whether the project has been properly thought through.
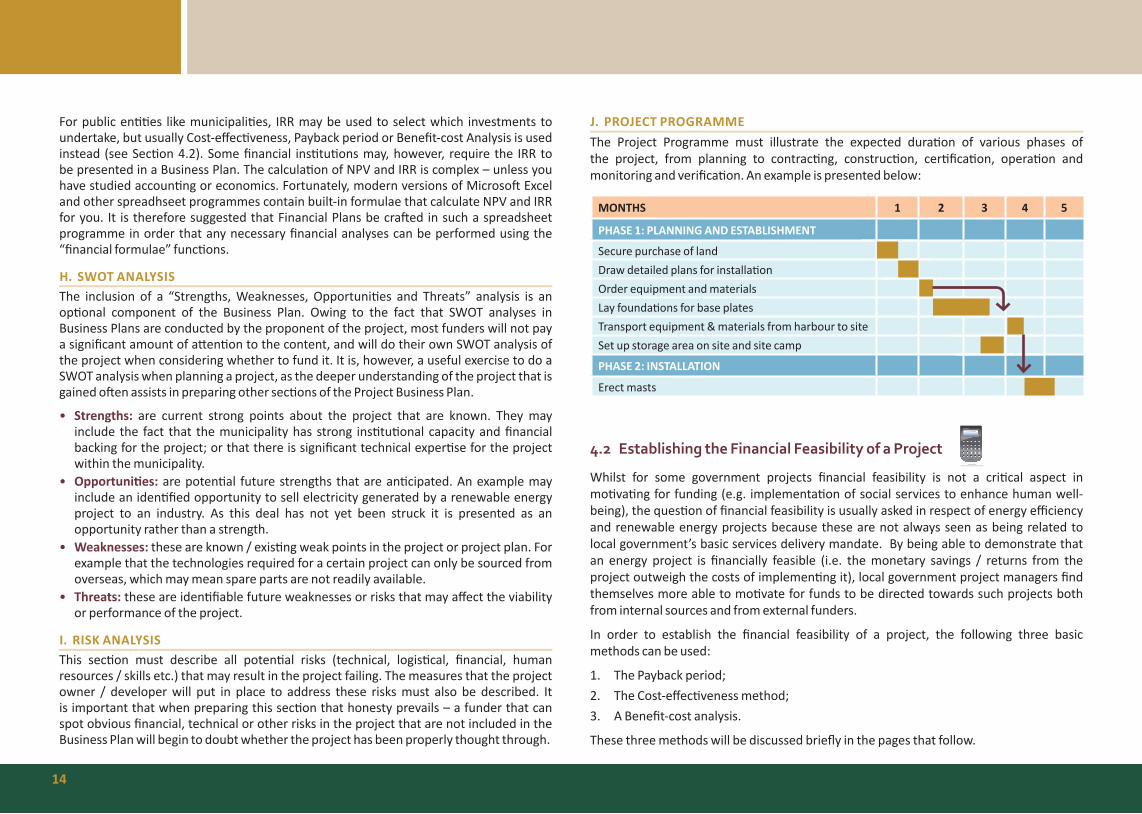
J. PROJECT PROGRAMME The Project Programme must illustrate the expected dura on of various phases of the project, from planning to contrac ng, construc on, cer fi ca on, opera on and monitoring and verifi ca on. An example is presented below:
4.2 Establishing the Financial Feasibility of a Project
Whilst for some government projects fi nancial feasibility is not a cri cal aspect in mo va ng for funding (e.g. implementa on of social services to enhance human well-being), the ques on of fi nancial feasibility is usually asked in respect of energy effi ciency and renewable energy projects because these are not always seen as being related to local government’s basic services delivery mandate. By being able to demonstrate that an energy project is fi nancially feasible (i.e. the monetary savings / returns from the project outweigh the costs of implemen ng it), local government project managers fi nd themselves more able to mo vate for funds to be directed towards such projects both from internal sources and from external funders.
In order to establish the fi nancial feasibility of a project, the following three basic methods can be used:
1. The Payback period;2. The Cost-eff ec veness method; 3. A Benefi t-cost analysis.
These three methods will be discussed briefl y in the pages that follow.
14
MONTHS 1 2 3 4 5
PHASE 1: PLANNING AND ESTABLISHMENT
Secure purchase of landDraw detailed plans for installa onOrder equipment and materialsLay founda ons for base platesTransport equipment & materials from harbour to siteSet up storage area on site and site camp
PHASE 2: INSTALLATION
Erect masts
4.2.1 Payback Period
The payback period method refers to the dura on, either in months or years that it will take to recover the cost of an investment through either fees, charges or other form of income; or cost savings. Examples are presented below.
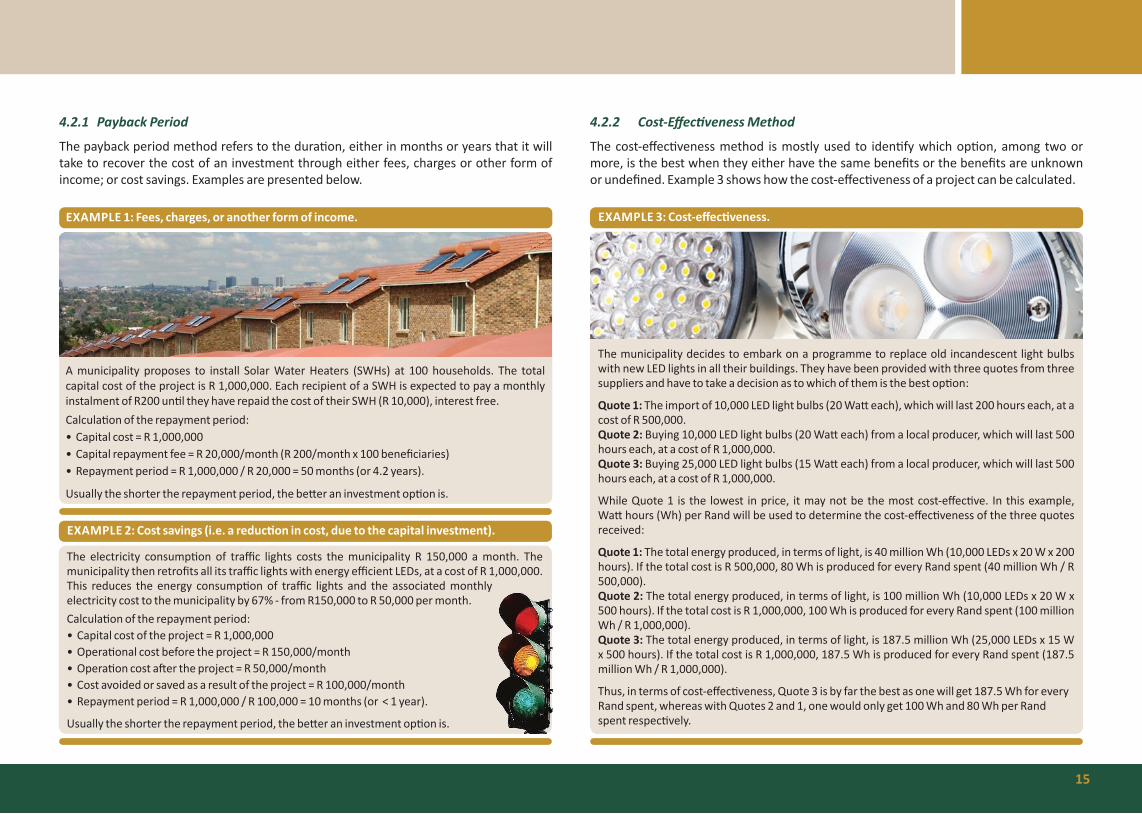
4.2.2 Cost-Eff ec veness Method
The cost-eff ec veness method is mostly used to iden fy which op on, among two or more, is the best when they either have the same benefi ts or the benefi ts are unknown or undefi ned. Example 3 shows how the cost-eff ec veness of a project can be calculated.
EXAMPLE 2: Cost savings (i.e. a reduc on in cost, due to the capital investment).
The electricity consump on of traffi c lights costs the municipality R 150,000 a month. The municipality then retrofi ts all its traffi c lights with energy effi cient LEDs, at a cost of R 1,000,000. This reduces the energy consump on of traffi c lights and the associated monthly electricity cost to the municipality by 67% - from R150,000 to R 50,000 per month. Calcula on of the repayment period:• Capital cost of the project = R 1,000,000• Opera onal cost before the project = R 150,000/month• Opera on cost a er the project = R 50,000/month• Cost avoided or saved as a result of the project = R 100,000/month• Repayment period = R 1,000,000 / R 100,000 = 10 months (or < 1 year).
Usually the shorter the repayment period, the be er an investment op on is.
15
EXAMPLE 3: Cost-eff ec veness.
The municipality decides to embark on a programme to replace old incandescent light bulbs with new LED lights in all their buildings. They have been provided with three quotes from three suppliers and have to take a decision as to which of them is the best op on:
Quote 1: The import of 10,000 LED light bulbs (20 Wa each), which will last 200 hours each, at a cost of R 500,000.Quote 2: Buying 10,000 LED light bulbs (20 Wa each) from a local producer, which will last 500 hours each, at a cost of R 1,000,000.Quote 3: Buying 25,000 LED light bulbs (15 Wa each) from a local producer, which will last 500 hours each, at a cost of R 1,000,000.
While Quote 1 is the lowest in price, it may not be the most cost-eff ec ve. In this example, Wa hours (Wh) per Rand will be used to determine the cost-eff ec veness of the three quotes received:
Quote 1: The total energy produced, in terms of light, is 40 million Wh (10,000 LEDs x 20 W x 200 hours). If the total cost is R 500,000, 80 Wh is produced for every Rand spent (40 million Wh / R 500,000).Quote 2: The total energy produced, in terms of light, is 100 million Wh (10,000 LEDs x 20 W x 500 hours). If the total cost is R 1,000,000, 100 Wh is produced for every Rand spent (100 million Wh / R 1,000,000).Quote 3: The total energy produced, in terms of light, is 187.5 million Wh (25,000 LEDs x 15 W x 500 hours). If the total cost is R 1,000,000, 187.5 Wh is produced for every Rand spent (187.5 million Wh / R 1,000,000).
Thus, in terms of cost-eff ec veness, Quote 3 is by far the best as one will get 187.5 Wh for every Rand spent, whereas with Quotes 2 and 1, one would only get 100 Wh and 80 Wh per Rand spent respec vely.
EXAMPLE 1: Fees, charges, or another form of income.
A municipality proposes to install Solar Water Heaters (SWHs) at 100 households. The total capital cost of the project is R 1,000,000. Each recipient of a SWH is expected to pay a monthly instalment of R200 un l they have repaid the cost of their SWH (R 10,000), interest free. Calcula on of the repayment period:• Capital cost = R 1,000,000• Capital repayment fee = R 20,000/month (R 200/month x 100 benefi ciaries) • Repayment period = R 1,000,000 / R 20,000 = 50 months (or 4.2 years).
Usually the shorter the repayment period, the be er an investment op on is.
16
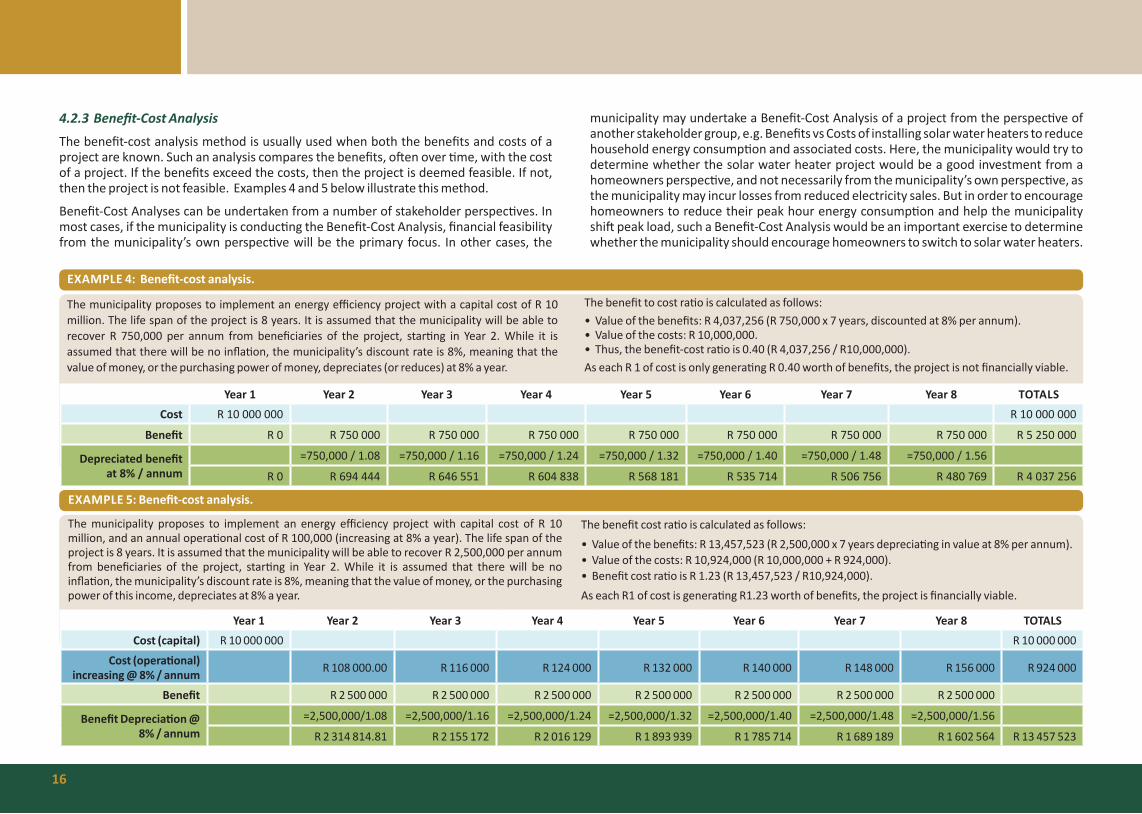
4.2.3 Benefi t-Cost AnalysisThe benefi t-cost analysis method is usually used when both the benefi ts and costs of a project are known. Such an analysis compares the benefi ts, o en over me, with the cost of a project. If the benefi ts exceed the costs, then the project is deemed feasible. If not, then the project is not feasible. Examples 4 and 5 below illustrate this method.
Benefi t-Cost Analyses can be undertaken from a number of stakeholder perspec ves. In most cases, if the municipality is conduc ng the Benefi t-Cost Analysis, fi nancial feasibility from the municipality’s own perspec ve will be the primary focus. In other cases, the
municipality may undertake a Benefi t-Cost Analysis of a project from the perspec ve of another stakeholder group, e.g. Benefi ts vs Costs of installing solar water heaters to reduce household energy consump on and associated costs. Here, the municipality would try to determine whether the solar water heater project would be a good investment from a homeowners perspec ve, and not necessarily from the municipality’s own perspec ve, as the municipality may incur losses from reduced electricity sales. But in order to encourage homeowners to reduce their peak hour energy consump on and help the municipality shi peak load, such a Benefi t-Cost Analysis would be an important exercise to determine whether the municipality should encourage homeowners to switch to solar water heaters.
EXAMPLE 4: Benefi t-cost analysis.
The municipality proposes to implement an energy efficiency project with a capital cost of R 10 million. The life span of the project is 8 years. It is assumed that the municipality will be able to recover R 750,000 per annum from beneficiaries of the project, star ng in Year 2. While it is assumed that there will be no infla on, the municipality’s discount rate is 8%, meaning that the value of money, or the purchasing power of money, depreciates (or reduces) at 8% a year.
The benefi t to cost ra o is calculated as follows:• Value of the benefi ts: R 4,037,256 (R 750,000 x 7 years, discounted at 8% per annum).• Value of the costs: R 10,000,000.• Thus, the benefi t-cost ra o is 0.40 (R 4,037,256 / R10,000,000).As each R 1 of cost is only genera ng R 0.40 worth of benefi ts, the project is not fi nancially viable.
Year 1 Year 2 Year 3 Year 4 Year 5 Year 6 Year 7 Year 8 TOTALSCost R 10 000 000 R 10 000 000
Benefi t R 0 R 750 000 R 750 000 R 750 000 R 750 000 R 750 000 R 750 000 R 750 000 R 5 250 000
Depreciated benefi t at 8% / annum
=750,000 / 1.08 =750,000 / 1.16 =750,000 / 1.24 =750,000 / 1.32 =750,000 / 1.40 =750,000 / 1.48 =750,000 / 1.56
R 0 R 694 444 R 646 551 R 604 838 R 568 181 R 535 714 R 506 756 R 480 769 R 4 037 256
EXAMPLE 5: Benefi t-cost analysis.
The municipality proposes to implement an energy efficiency project with capital cost of R 10 million, and an annual opera onal cost of R 100,000 (increasing at 8% a year). The life span of the project is 8 years. It is assumed that the municipality will be able to recover R 2,500,000 per annum from beneficiaries of the project, star ng in Year 2. While it is assumed that there will be no infla on, the municipality’s discount rate is 8%, meaning that the value of money, or the purchasing power of this income, depreciates at 8% a year.
The benefi t cost ra o is calculated as follows:• Value of the benefi ts: R 13,457,523 (R 2,500,000 x 7 years deprecia ng in value at 8% per annum).• Value of the costs: R 10,924,000 (R 10,000,000 + R 924,000).• Benefi t cost ra o is R 1.23 (R 13,457,523 / R10,924,000). As each R1 of cost is genera ng R1.23 worth of benefi ts, the project is fi nancially viable.
Year 1 Year 2 Year 3 Year 4 Year 5 Year 6 Year 7 Year 8 TOTALSCost (capital) R 10 000 000 R 10 000 000
Cost (opera onal) increasing @ 8% / annum R 108 000.00 R 116 000 R 124 000 R 132 000 R 140 000 R 148 000 R 156 000 R 924 000
Benefi t R 2 500 000 R 2 500 000 R 2 500 000 R 2 500 000 R 2 500 000 R 2 500 000 R 2 500 000
Benefi t Deprecia on @ 8% / annum
=2,500,000/1.08 =2,500,000/1.16 =2,500,000/1.24 =2,500,000/1.32 =2,500,000/1.40 =2,500,000/1.48 =2,500,000/1.56
R 2 314 814.81 R 2 155 172 R 2 016 129 R 1 893 939 R 1 785 714 R 1 689 189 R 1 602 564 R 13 457 523

17
5. FURTHER RESOURCESAfroMaison (undated), Decision Support Tool to Assist the Iden fi ca on of Economic Instruments, Available from: h p://www.afromaison.net/index.php?op on=com_content&view=ar cle&id=72&Itemid=181.
Agence Française de Développement (undated), AFD in South Africa, Available from h p://www.afd.fr/lang/en/home/pays/afrique/geo-afr/afrique-du-sud/AFD-AfriqueduSud.
Amatola Green Power (undated), What We Do, Available from: h p://www.amatolagreenpower.co.za/index.php/what-we-do.
Botes A. (2011), Energy Effi ciency Regula ons for New Buildings, Available from: h p://urbanearth.co.za/ar cles/energy-effi ciency-regula ons-new-buildings.
Cape Town (undated), Green Electricity Cer fi cates Explained, Available from: h p://www.capetown.gov.za/en/electricity/GreenElectricity/Pages/Greenelectricitycer fi catesexplained.aspx.
CEF (undated), CEF Carbon, Available from: h p://www.cef.org.za/index.php?op on=com_content&view=ar cle&id=14&Itemid=15.
City Energy Support Unit (2009), How to Implement Renewable Energy and Energy Effi ciency Op ons: Support for Local Government, Available from: h p://www.cityenergy.org.za/implementa on.
Department of Energy (2013), Request for Proposal (RFP) for Municipal Energy Effi ciency and Demand Side Management (EEDSM) Programme, Available from: h p://www.energy.gov.za/EEE/Request-for-Proposal-municipal-EEDSM-Aug2013.pdf.
Department of Energy (undated), Working for Energy, Available from h p://www.energy.gov.za/fi les/wfe_frame.html.
Department of Environmental Aff airs (undated), Greenest Municipality Compe on (GMC), Available from: h ps://www.environment.gov.za/projectsprogrammes/gmc.
Department of Environment Aff airs (undated), SA Green Fund, Available from h p://www.sagreenfund.org.za/Pages/default.aspx.
Department of Trade and Industry (undated), Manufacturing Compe veness Enhancement Programme (MCEP), Available from: h p://www.thed .gov.za/fi nancial_assistance/fi nancial_incen ve.jsp?id=53&subthemeid=25. Dlamini M. (2006), ABSA in R400m Housing Project, Available from: h p://www.southafrica.info/about/social/911356.htm#.UudCBRD8LIU. ESKOM (undated), Business, Available from: h p://www.eskom.co.za/sites/idm/Business/Pages/Business.aspx.ESKOM (undated), Residen al, Available from h p://www.eskom.co.za/sites/idm/Residen al/Residen alTechnologies/Pages/Solar%20Water%20Hea ng%20Supplier%20List.aspx. eThekwini Municipality (2013), Green Tariff Feasibility Study: Best Prac ce Review for eThekwini Municipality, Prepared by Centre for Renewable and Sustainable Energy Studies, Available from:h p://www.kznenergy.org.za/download/news/CRES%202013%20Best%20prac ce%20review%20rev1.pdf.eThekwini Municipality (2012), Project Summary Document: Durban Landfi ll-Gas to Electricity, Available from: h p://www.kznenergy.org.za/download/projects/Durban_Landill-Gas_to_Electricity_22_Nov.pdf. eThekwini Municipality (undated), Shisa Solar Programme, Available from: h p://www.shisasolar.org.za/. Grasslands Programme (2013), Inves ng in Ecological Infrastructure: The Prac ce and Payoff for Water Security, Grassland News 2013, Available from: h p://www.grasslands.org.za/news/entry/inves ng-in-ecological-infrastructure-the-prac ce-and-the-payoff -for-water-security.Green Building Council (undated), Green Star SA Ra ng System, Available from: h p://www.gbcsa.org.za/ra ng-tools/green-star-sa-ra ng-system/. Green Times (2013), Claiming Energy Effi ciency Tax Incen ves, Available from: h p://thegreen mes.co.za/claiming-energy-effi ciency-tax-incen ves/.
Industrial Development Corpora on (undated), Green Energy Effi ciency Fund (GEEF), Available from: h p://www.idc.co.za/development-funds/geef.
ISO (undated), ISO 50001 – Energy Management, Available from:h p://www.iso.org/iso/home/standards/management-standards/iso50001.htm.
Johannesburg (2010), Solar Heaters for Cosmo City, Available from: h p://www.joburg.org.za/index.php?op on=com_ontent&view=ar cle&id=5327&ca d=123&Itemid=204.
Johannesburg (2011), COJ Waste to Energy Ini a ves, Presenta on for the 4th Waste Khora, Durban 14-16 October 2013, Available from: h p://www.joburg.org.za/index.php?op on=com_content&view=ar cle&id=6784:from-rubbish-to-electricity&ca d=120&Itemid=201.
Johnson Controls (undated), Case Study: Energy Savings Make the Headlines at the South African Broadcas ng Corpora on, Available from: h p://www.johnsoncontrols.co.za/content/dam/WWW/jci/be/eu_library/energy_solu ons/SABC_EN.pdf.
Kuyasa CDM Project (undated), Kuyasa CDM Project, Available from: h p://www.kuyasacdm.co.za/.
Na onal Business Ini a ve (2011), Energy Effi ciency Accord, Available from: h p://www.nbi.org.za/SiteCollec onDocuments/energy_effi ciency_accord.pdf.
Na onal Business Ini a ve (2011), Energy Effi ciency Leadership Network (EELN), Available from: h p://www.nbi.org.za/Focus%20Area/ClimateAndEnergy/EELNSS/Pages/default.aspx.
Nelson Mandela Bay Municipality (undated), Zanemvula Subsidised Housing Solar Water Heater Project, Available from: h p://www.nelsonmandelabay.gov.za/Content.aspx?objID=425.
Op mum Energy Futures project: www.escos.co.za
Sustainability Ins tute (undated), SANS 10400-XA Energy Usage in Buildings: An Architect’s Guide to Compliance in Home Design, Available from: h p://www.nedbank.co.za/website/content/homeloans _microsite/docs/SANS%20Guide%20-%20Architects%20fi nal.pdf.
4.2.4 ConclusionIn most cases it is possible to use a combina on of methods, like benefit-cost analysis and payback period, or payback period and cost-effec veness. Using a combina on can o en assist in leading to more informed decisions. An advantage of doing financial appraisal is
the realisa on that cost and value is not the same. Value can either be in the service (i.e. the amount of Wh of service by the light bulbs purchased) or in the benefit one can derive from it in terms of a resale. It is o en be er to have a value focus than a cost focus as this assists in determining the best/op mal and/or most effec ve op on.
18
Republic of South Africa (2011), SANS 204 (2011): Energy Effi ciency in Buildings, Available from:h ps://law.resource.org/pub/za/ibr/za.sans.204.2011.pdf.
Republic of South Africa (2013), Regula ons in Terms of Sec on 12L of the Income Tax Act, 1962, on the Allowance for Energy Effi ciency Savings, Government Gaze e No. 37136. General No ce No. R971, Available from: h p://www.sars.gov.za/AllDocs/LegalDoclib/SecLegis/LAPD-LSec-Reg-2013-01%20-%20Regula on%20R971%20GG%2037136%209%20December%202013.pdf
South African Bureau of Standards (undated), Energy Effi ciency – Standards and Publica ons, Available from: h ps://www.sabs.co.za/sectors-and-services/services/energy/energy_sp.asp.
South South North (undated), Sustainable Se lements Facility (SSF), accessed from h p://www.southsouthnorth.org/sustainable-se lements-facility-ssf/. Accessed 18 December 2013.
Ramayia J. (2013), Implemen ng an Energy performance Contract: Learning from the City of Cape Town, Available from: h p://urbanearth.co.za/ar cles/implemen ng-energy-performance-contract-learning-city-cape-town.
South African Alterna ve Energy Associa on (2011), Friedenheim Hydro Plant (2MW), Available from: h p://saaea.blogspot.com/2011/05/friedenheim-hydro-plant-2mw.html.
Standard Bank (undated), Clean Energy and Energy Effi ciency, Available from: h p://sustainability.standard bank.com/environment-overview/climate-fi nance-carbon-trading/clean-energy-and-energy-effi ciency.
Standard Bank (undated), Climate Finance and Carbon Trading, Available from: h p://sustainability.standardbank.com/environment-overview/climate-fi nance-carbon-trading.
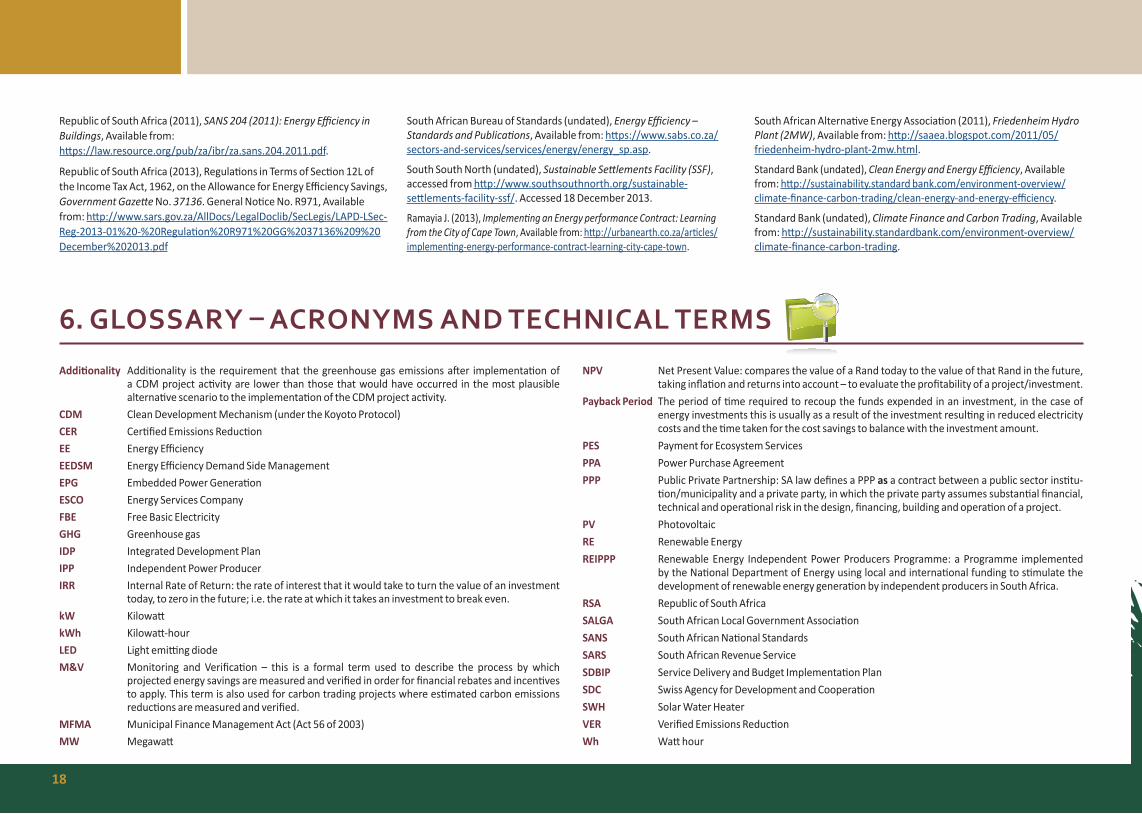
Addi onality Addi onality is the requirement that the greenhouse gas emissions a er implementa on of a CDM project ac vity are lower than those that would have occurred in the most plausible alterna ve scenario to the implementa on of the CDM project ac vity.
CDM Clean Development Mechanism (under the Koyoto Protocol)CER Cer fi ed Emissions Reduc onEE Energy Effi ciencyEEDSM Energy Effi ciency Demand Side Management EPG Embedded Power Genera onESCO Energy Services CompanyFBE Free Basic ElectricityGHG Greenhouse gasIDP Integrated Development PlanIPP Independent Power ProducerIRR Internal Rate of Return: the rate of interest that it would take to turn the value of an investment
today, to zero in the future; i.e. the rate at which it takes an investment to break even.kW Kilowa kWh Kilowa -hourLED Light emi ng diodeM&V Monitoring and Verifi ca on – this is a formal term used to describe the process by which
projected energy savings are measured and verifi ed in order for fi nancial rebates and incen ves to apply. This term is also used for carbon trading projects where es mated carbon emissions reduc ons are measured and verifi ed.
MFMA Municipal Finance Management Act (Act 56 of 2003)MW Megawa
NPV Net Present Value: compares the value of a Rand today to the value of that Rand in the future, taking infla on and returns into account – to evaluate the profitability of a project/investment.
Payback Period The period of me required to recoup the funds expended in an investment, in the case of energy investments this is usually as a result of the investment resul ng in reduced electricity costs and the me taken for the cost savings to balance with the investment amount.
PES Payment for Ecosystem ServicesPPA Power Purchase AgreementPPP Public Private Partnership: SA law defines a PPP as a contract between a public sector ins tu-
on/municipality and a private party, in which the private party assumes substan al financial, technical and opera onal risk in the design, financing, building and opera on of a project.
PV PhotovoltaicRE Renewable EnergyREIPPP Renewable Energy Independent Power Producers Programme: a Programme implemented
by the Na onal Department of Energy using local and interna onal funding to s mulate the development of renewable energy genera on by independent producers in South Africa.
RSA Republic of South AfricaSALGA South African Local Government Associa onSANS South African Na onal StandardsSARS South African Revenue ServiceSDBIP Service Delivery and Budget Implementa on PlanSDC Swiss Agency for Development and Coopera onSWH Solar Water HeaterVER Verifi ed Emissions Reduc onWh Wa hour
6. GLOSSARY ACRONYMS AND TECHNICAL TERMS

19

SALGASouth African Local Government association
Menlyn Corporate Park Block B
175 Corobay AvenueCnr Garsfontein and Corobay
Waterkloof Glen ext 11Pretoria 0001
Tel: (012) 639 8000Fax: (012) 639 8001
www.salga.org.za