local budgets study 2010 (aad) - seknas … · local budgets study 2010 (aad) an analysis of local...
TRANSCRIPT
LOCAL BUDGETS STUDY 2010 (AAD)
An analysis of local budgets in 5 provinces and 42 kabupatens and cities throughout Indonesia
Based on research conducted by 28 NGOs under the overall direction of the National Secretariat of the Indonesian Forum for Budget Transparency (Seknas FITRA)
Sponsored by:
The Asia Foundation UKaid Royal Netherlands Embassy
Published: February 2011
Translated into English by: Denis Fisher
Table of Contents
Glossary of Terms and Abbreviations ................................................................................... 4
1. Preface ................................................................................................................... ................ 6 1.1 Introduction ................................................................................................................................................ 6
1.2 Research Objectives
............................................ .................................................................................................. .. 6 1.3 Methodology
................................................... ............................................................................................. 7
2. Analysis of Local Revenue ...................................................................................................... 10 2.1 Analysis of Growth of Local Revenue................................................................. ......... 10
2.2 Analysis of Revenue per Person................................................................................... . 11
2.3 Analysis of Local Revenue Sources............................................................................. . 12
2.4 Regional Fiscal Transfers ............................................................................................ . 13 2.5 Other Lawful Own-Source Revenue..................................................................... ........ 15
2.6 Local Own-Source Revenue........................................................................................ . 18
3. Analysis of Local Expenditure................................................................................................ 19 3.1 General Analysis of Expenditure...................................................................... ............. 19
3.2 Analysis of Components of Expenditure............................................................... ........ 21
3.3 Direct Per Capita Expenditure.................................................................... ................... 22 3.4 Expenditure on Social Aid and Grants............................................................. .............. 22
4. Analysis of Planning, Financing and Fiscal Space ............................................................... 24 4.1 Budget Planning and Revision Processes..................................................................... . 24 4.2 Budget Surpluses (SiLPA) ............................................................................................. 25
4.3 Analysis of Fiscal Space............................................................................................... . 27
5. Analysis of Local Infrastructure Budgets.............................................................................. 28 5.1 Expenditure on Public Works............................................................................ ............. 28
5.2 Direct and Indirect Expenditure on Public Works……….............................................. 29
5.3 Expenditure on Roads and Bridges................................................................................. 31
5.4 Expenditure on Irrigation Programs.............................................................................. . 33 5.5 Expenditure on Clean Water Programs........................................................................... 33
6. Analysis of Education Budgets .............................................................................................. ... 35 6.1 General Analysis of Expenditure of Local Education Departments................................ 35 6.2 Direct and Indirect Expenditure of Local Education Departments................................. 37
6.3 Ratio between Education Expenditure and Pupil/Teacher Numbers.............................. 38
6.4 Programs Supporting Increased School Participation Rates (APS)................................. 38 6.5 Programs Supporting Better Quality Education……...................................................... 39
6.6 Programs Supporting Non-Formal Education................................................................. 40
7. Analysis of Health Budgets……................................................................................................ 41 7.1 Analysis of Expenditure on Health ............................................................ ...................... 41
7.2 Direct and Indirect Expenditure on Health Services and Hospitals…… ......................... 42
7.3 Health Services and Hospital Programs Involving Direct Expenditure............................ 44
8. Analysis of Budgets for Womens Empowerment…................................................................. 45 8.1 Institutional & Budgetary Support for Womens Empowerment & Gender Mainstreaming 45

8.2 Programs Supporting Offices for Gender Mainstreaming, Womens Empowerment
& Child Protection ............................................ .................................................................................. ................ 46
8.3 Programs Supporting Enhanced Womens Participation in Development.......................... 47
8.3 Programs Supporting Protection of Women and Children……………. ......................... 48
9. Conclusions and Recommendations.......................................................................................... 50
Translator’s Note re Graphs: Unfortunately, the many graphs that feature in the Indonesian text of this document—titled ―Studi
Anggaran Daerah 2010: Analisis Anggaran di 5 Provinsi, 42 Kabupaten/Kota di Indonesia‖—have not be able to be reproduced in this translation because of formatting difficulties. While the translated text is
understandable and meaningful without the graphs, it is of course not as rich as it would have been with
them included. Readers wishing to look at the graphs may do by consulting the Indonesian version of
this publication on Seknas FITRA’s website. Any inconvenience is regretted.

Analysis of Local Budgets: Study of Budgets for 2007-10
In 42 Kabupatens and Cities and 5 Provinces in Indonesia
4
Glossary of Terms and Abbreviations
AAD Analasis Anggaran Daerah—Analysis of local budgets
Adjustment funds Dana penyesuaian—a form of fiscal transfer from the Center to regions: a source
of ―other local own-source revenue‖ (LPDS) (see Tables 1.2 (p.8) and 2.1 (p. 16))
APBD Anggaran Pendapatan dan Belanja Daerah—local government budget as
approved by DPRD
APBD-M Anggaran Pendapatan dan Belanja Daerah-Murni—(unaltered) local government budget as approved by DPRD and not yet revised: same as APBD
APBD-P Anggaran Pendapatan dan Belanja Daerah-Perubahan—(mid-year) revised local
government budget as approved by DPRD
APBD-R Anggaran Pendapatan dan Belanja Daerah-Realisasi—realized local government
budget (end-of-year local budget outcomes)
APBN Anggaran Pendapatan dan Belanja Negara—State Budget as approved
APS Angka Partisipasi Sekolah—school participation rate
BL Belanja langsung—direct expenditure (see that entry below)
BTL Belanja tidak langsung—indirect expenditure (see that entry below)
DAK Dana Alokasi Khusus—Special Purpose Fund
DBH Dana Bagi Hasil—Revenue Sharing Fund, a mechanism for fiscal transfers
from Center to regions DAU Dana Alokasi Umum—General Allocation Fund, a mechanism for fiscal
transfers from Center to regions
bansos bantuan sosial: social aid, a line item of indirect expenditure in Indonesian
budgets available for expenditure for specific deserving social causes
dana perimbangan Fiscal balance transfers from the Center to local governments in regions to
reduce fiscal imbalances between the Center and regions and among regions
dana penyesuaian adjustment funds (see entry above)
dekonsentrasi the delegation of authority (and funds) from the Center to a regional
government or a central government official stationed a region to perform a
not yet decentralized function
direct expenditure Belanja langsung (BL): also known as ―development expenditure‖: costs incurred by a work unit in implementing a specific program or activity (cf. indirect expenditure)
DPD Dewan Perwakilan Daerah—House of Representatives of the Regions, the ―upper‖
chamber of the Indonesian Parliament
PDF PPD Dana Penguatan Desentralisasi Fiskal Percepatan Pembangunan Daerah—Fund to
Strengthen Fiscal Decentralization to Speed up Regional Development, a dana
penyesuaian program
DPID Dana Infrastruktur Daerah—Fund for the Strengthening of Local Infrastructure, a
dana penyesuaian program
DPIP Dana Percepatan Infrastruktur Pendidikan —Fund to Speed up Development of
Educational Infrastructure, a dana penyesuaian program
DPIPD Dana Penguatan Infrastruktur dan Prasarana Daerah – Fund to Strengthen Local
Infrastructure and Public Facilities, a dana penyesuaian program
DPR Dewan Perwakilan Rakyat—the House of Representatives (national
parliament)
DPRD Dewan Perwakilan Rakyat Daerah—local legislative assembly: the legislative
(Complied and inserted by translator)
Analysis of Local Budgets: Study of Budgets for 2007-10
In 42 Kabupatens and Cities and 5 Provinces in Indonesia
5
wing of government at the provincial, kabupaten and city level
DISP Dana Infrastruktur Sarana dan Prasarana—Fund for Infrastructure and Public
Facilities, a dana penyesuaian program
FGD Focus group discussion
Fiscal space a government’s degree of spending discretion (see footnote 13, page 27)
GDP Gross Domestic Product
HDI Human Development Index
HOG head of local government (governor (province), bupati (kabupaten) or
mayor (city))
indirect expenditure Belanja tidak langsung (BTL): also termed ―routine expenditure‖: common costs
incurred by a work unit in implementing the whole gamut of its programs (cf. direct
expenditure)
kabupaten One of sub-national governments in Indonesia, along with provinces and cities
kecamatan sub-district: unit of government administration immediately below level of
kabupaten and city
local government Pemerintah daerah—any sub-national government (provincial, kabupaten or city)
LPDS Lain Pendapatan Daerah yang Sah—other lawful local revenue
PAD Pendapatan Asli Daerah—local own-source revenue
PND Pendapatan Dalam Negeri—domestic revenue at the national level
Pemda Pemerintah daerah—any sub-national government (province, kabupaten or city)
Pemekaran daerah the splitting of an existing region to form two new autonomous regions
Pilkada Pemilihan kepala daerah: popular election (every 5 years) of a local head of
government (HOG: see entry above)
PMK Peraturan Menteri Keuangan—Minister of Finance regulation
Posyandu Pos Pelayanan Terpadu—integrated (health) service post (most often at village
level)
PP Peraturan Pemerintah—central government regulation
Puskesmas Pusat Kesehatan Masyarakat—community health center (usually located at
kabupaten or kecamatan level)
RAPBD Rancangan Anggaran Pendapatan dan Belanja Daerah—draft local budget
Region any sub-national government area (province, kabupaten and city) in Indonesia
Retribusi fees and charges collected by government for goods & services rendered
SIKD Sistem Informasi Keuangan Daerah—Regional Financial Information System
SiLPA Sisa Lebih Penggunaan Anggaran—budget surplus carried forward to next fiscal
year
tugas pembantuan co-administered function: an arrangement by which the central government directs
and funds a local government to undertake a not yet decentralized activity or
function on its behalf and to report back on its implementation.

Analysis of Local Budgets: Study of Budgets for 2007-10
In 42 Kabupatens and Cities and 5 Provinces in Indonesia
6
1. Preface
1.1 Introduction
One of the indicators of the extent to which government pays special attention to the poor and women
is its budget policies. By looking at governmental decisions on budget allocations, a community can get a sense of whether government is promoting economic growth and delivering an adequate level of basic
public services. Accordingly, local budgets are reflections of political intent and determine the level of
welfare enjoyed by the general public.
As a continuation of their study in 2009, 28 community organizations resumed the study of local
budgets (Local Budgets Study (LBS)) and completed it during 2010-11. Coordinated by the National
Secretariat of the Indonesian Forum for Budget Transparency (Seknas Fitra) and The Asia Foundation, the study embraced 42 kabupatens and cities and 5 provinces in Indonesia. The LBS covered two areas:
(i) An evaluation of the performance of local governments throughout the entire budget cycle and of the extent to which their budgetary processes were in accord with principles
of good governance, viz. transparency, participation, public accountability and gender-
responsiveness. This study is called Performance in Management of Local Budgets
(KIPAD). (ii) An analysis of local budgets to ascertain the extent to which they have been structured
and used to meet the needs of the community, especially the poor and women. This
second study is called Analysis of Local Budgets (AAD).
This current document only presents the findings of the AAD study. KIPAD is the subject of a separate
report.
1.2 Research Objectives
The aims of the AAD project were to assess the latest state of local fiscal management and to
undertake a comparative study of performance in the provinces, kabupatens and cities studied. The
study focused principally on three key elements of local budgets: revenue, expenditure and financing. In order to form a judgment on the extent to which expenditure was pro-poor, the study had a close look at
public works, education and health spending in the regions studied. The extent to which governments
observed gender-mainstreaming principles was also analyzed.
This research represented an effort by civil society to provide inputs to government. We hope that the
research findings will become a resource for kabupatens and cities in their efforts to achieve a higher
level of pro-poor and pro-women spending, to reduce poverty and to deliver better public services. In the case of provinces and the central government, we hope that our research findings can be used as a tool for
monitoring the quality of local government budget management performance; and will help refine budget
policies and identify the kinds of technical assistance local governments need in their efforts to lift their performance. Hopefully our research will contribute to improved budget management by government at
all levels—the Center, provinces, kabupatens and cities— and help to streamline the supervisory and
supportive role of central and provincial governments over front-line public service providers—
kabupatens and cities.
We hope that comparisons made between the kabupatens and cities studied will create an environment
of constructive competition among them. Each of the 42 kabupatens and cities and 5 provinces studied is a distinct entity. Hopefully, in the light of our comparative study, they can learn from each other. They

Analysis of Local Budgets: Study of Budgets for 2007-10
In 42 Kabupatens and Cities and 5 Provinces in Indonesia
7
will also hopefully come to see that what one government is doing can be benchmarked by others—even
though that process would not be on a par with following ―best practice‖, from abroad for example.
We also hope that our research can contribute to more effective budget advocacy and more productive
dialogue between civil society and government. Civil society networks were involved in our research in a number of areas. Hopefully that experience will make civil society organizations (CSOs) more adept at
undertaking research and help them to become more effective advocates of pro-poor and pro-women
budgeting and public policy. Evidence-based advocacy will, we hope, enhance the quality of dialogue
between stakeholders and increase the likelihood that CSOs’ advocacy campaign will have the desired impact.
1.3 Methodology
This research was carried out by way of an analysis of local budget (APBD) documents and various
other types of development and financial data for the period 2007-10.1 The main documents collected in
various regions and analyzed in this study are tabulated in Table 1.1. Other kinds of data were used to
verify and enrich the analysis: budgetary information from the Ministry of Finance in its Regional
Financial Information System (SIKD) and in its data on regional fiscal balance funding and regional adjustment funding; the results of the 2010 Population Census (Central Bureau of Statistics (BPS)); and a
variety of data on development in various sectors.
Table 1.1 Main Regional Documents Analyzed
No. Document Years analyzed
1 Local regulations on APBDs and local HOG regulations
providing details of APBDs
2007-10
2 Local regulations on APBD-Ps and local HOG regulations
providing details of APDB-Ps
2007-09
3 Local regulations on public accountability reports on APBDs
and local HOG regulations on the same matter.
2007-10
4 Documents on budget outcomes for local government
departments responsible for education, health (and hospitals),
public works, the regional secretariat, female empowerment
and family planning.
2007-10
5 Work plans for local government departments responsible for
education, health, public works, female empowerment and
family planning.
2007-10
6 Regional Development in Figures 2009-10
In general analysis focused on three principal elements of APBDs, viz. revenue, expenditure and
financing. The LBS team analyzed APBDs as a whole (see Table 1.2 for details of budget structure), the
three sectors most likely to help alleviate poverty (education, health and public works) and local financing & fiscal space as reflected in APBDs. In general, budget appropriations were analyzed— both in terms of
nominal value (at current prices) and real value (based on constant prices). We considered their rate of
growth; their relative size vis-à-vis total budgets and local GDP numbers; the proportion of direct expenditure (BL) and indirect expenditure (BTL) involved; and how appropriations measured up in terms
of service users (population, school pupils) and outcomes (e.g. length or roads, number of class rooms).
1The study took into account the four stages of the Indonesian budgetary cycle: the draft budget (RAPBD) containing work plans and budget
estimates, the approved (and as yet unrevised) annual budget (APBD or APBD-M), the mid-year revised budget (APBD-P) and the end-of-year
realized budget report (APBD-R). In general, analysis focuses on budget outcomes (APBD-Rs) for the years 2007-09 and unrevised budgets
(APBD-Ms) for 2010. Comparisons were also made between APBD-Rs and APBD-Ps to assess the quality of budget revision processes.
Analysis of Local Budgets: Study of Budgets for 2007-10
In 42 Kabupatens and Cities and 5 Provinces in Indonesia
8
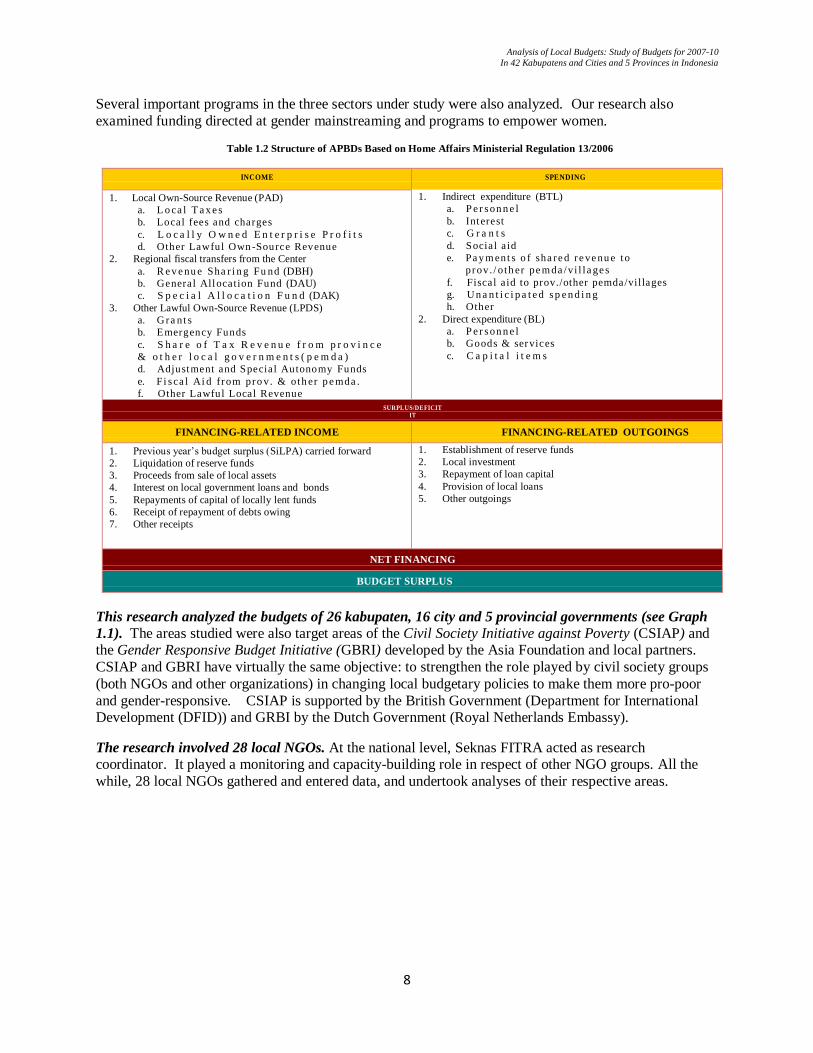
Several important programs in the three sectors under study were also analyzed. Our research also
examined funding directed at gender mainstreaming and programs to empower women.
Table 1.2 Structure of APBDs Based on Home Affairs Ministerial Regulation 13/2006
INCOME SPENDING
1. Local Own-Source Revenue (PAD)
a. L o ca l T a x e s
b. Local fees and charges
c. L o c a l l y O w n e d E n t e r p r i s e P r o f i t s
d. Other Lawful Own-Source Revenue
2. Regional fiscal transfers from the Center
a. R e v e nu e Sha r i n g Fu nd (DBH)
b. General Allocation Fund (DAU)
c. S p e c i a l A l l o c a t i o n F u n d (DAK)
3. Other Lawful Own-Source Revenue (LPDS)
a. G ra nt s
b. Emergency Funds
c. S h a r e o f T a x R e v e n u e f r o m p r o v i n c e
& o t h e r l o c a l g o v e r n m e n t s ( p e m d a )
d. Adjustment and Special Autonomy Funds
e. F i s ca l Ai d from pro v. & oth er p e mda .
f. Other Lawful Local Revenue
1. Indirect expenditure (BTL)
a. P e r son n e l
b. Interest
c. G r a n t s
d. Social a id
e. Pa y m ent s o f sha re d r e ve nu e to
prov . / o th er pe m da /vi l l a ge s
f. Fiscal a id to prov./other pemda/villages
g. Un a n t i c i p a t e d sp e n d i n g
h. Other
2. Direct expenditure (BL)
a. P e r son n e l
b. Goods & services
c. C a p i t a l i t e m s
SURPLUS/DEFICIT IT
FINANCING-RELATED INCOME FINANCING-RELATED OUTGOINGS
1. Previous year’s budget surplus (SiLPA) carried forward
2. Liquidation of reserve funds
3. Proceeds from sale of local assets
4. Interest on local government loans and bonds
5. Repayments of capital of locally lent funds
6. Receipt of repayment of debts owing
7. Other receipts
1. Establishment of reserve funds
2. Local investment
3. Repayment of loan capital
4. Provision of local loans
5. Other outgoings
NET FINANCING
BUDGET SURPLUS
This research analyzed the budgets of 26 kabupaten, 16 city and 5 provincial governments (see Graph
1.1). The areas studied were also target areas of the Civil Society Initiative against Poverty (CSIAP) and the Gender Responsive Budget Initiative (GBRI) developed by the Asia Foundation and local partners.
CSIAP and GBRI have virtually the same objective: to strengthen the role played by civil society groups
(both NGOs and other organizations) in changing local budgetary policies to make them more pro-poor
and gender-responsive. CSIAP is supported by the British Government (Department for International Development (DFID)) and GRBI by the Dutch Government (Royal Netherlands Embassy).
The research involved 28 local NGOs. At the national level, Seknas FITRA acted as research coordinator. It played a monitoring and capacity-building role in respect of other NGO groups. All the
while, 28 local NGOs gathered and entered data, and undertook analyses of their respective areas.

Analysis of Local Budgets: Study of Budgets for 2007-10
In 42 Kabupatens and Cities and 5 Provinces in Indonesia
9
Graph 1.1 Areas Researched in the Local Budgets Study (LBS)
Local Government Areas Studied in LBS
2010
Analysis of Local Budgets: Study of Budgets for 2007-10
In 42 Kabupatens and Cities and 5 Provinces in Indonesia
10
2. Analysis of Local Revenue
2.1 Analysis of Growth of Local Revenue
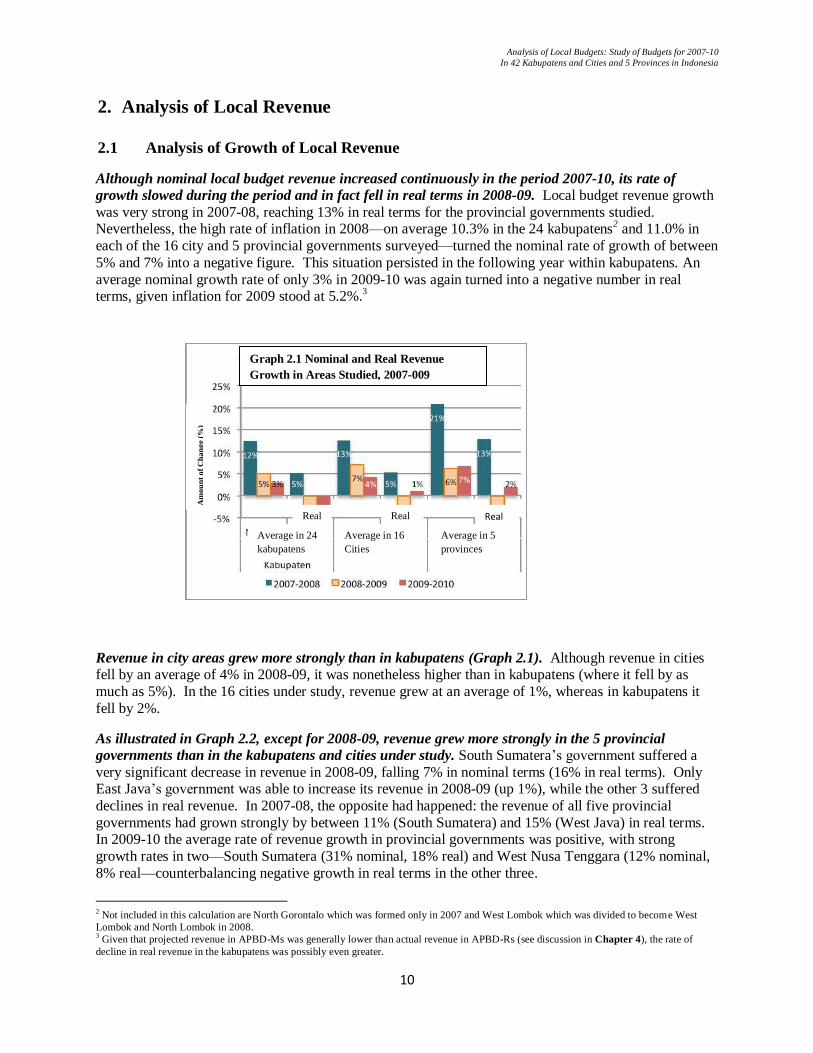
Although nominal local budget revenue increased continuously in the period 2007-10, its rate of
growth slowed during the period and in fact fell in real terms in 2008-09. Local budget revenue growth
was very strong in 2007-08, reaching 13% in real terms for the provincial governments studied. Nevertheless, the high rate of inflation in 2008—on average 10.3% in the 24 kabupatens
2 and 11.0% in
each of the 16 city and 5 provincial governments surveyed—turned the nominal rate of growth of between
5% and 7% into a negative figure. This situation persisted in the following year within kabupatens. An
average nominal growth rate of only 3% in 2009-10 was again turned into a negative number in real terms, given inflation for 2009 stood at 5.2%.
3
Revenue in city areas grew more strongly than in kabupatens (Graph 2.1). Although revenue in cities fell by an average of 4% in 2008-09, it was nonetheless higher than in kabupatens (where it fell by as
much as 5%). In the 16 cities under study, revenue grew at an average of 1%, whereas in kabupatens it
fell by 2%.
As illustrated in Graph 2.2, except for 2008-09, revenue grew more strongly in the 5 provincial
governments than in the kabupatens and cities under study. South Sumatera’s government suffered a
very significant decrease in revenue in 2008-09, falling 7% in nominal terms (16% in real terms). Only East Java’s government was able to increase its revenue in 2008-09 (up 1%), while the other 3 suffered
declines in real revenue. In 2007-08, the opposite had happened: the revenue of all five provincial
governments had grown strongly by between 11% (South Sumatera) and 15% (West Java) in real terms. In 2009-10 the average rate of revenue growth in provincial governments was positive, with strong
growth rates in two—South Sumatera (31% nominal, 18% real) and West Nusa Tenggara (12% nominal,
8% real—counterbalancing negative growth in real terms in the other three.
2 Not included in this calculation are North Gorontalo which was formed only in 2007 and West Lombok which was divided to become West
Lombok and North Lombok in 2008. 3 Given that projected revenue in APBD-Ms was generally lower than actual revenue in APBD-Rs (see discussion in Chapter 4), the rate of
decline in real revenue in the kabupatens was possibly even greater.
Graph 2.1 Nominal and Real Revenue
Growth in Areas Studied, 2007-009
Average in 24
kabupatens
Real
Average in 16
Cities
Real Real
Average in 5
provinces
Am
ou
nt
of
Ch
an
ge
(%)

Analysis of Local Budgets: Study of Budgets for 2007-10
In 42 Kabupatens and Cities and 5 Provinces in Indonesia
11
8
%
Graph 2.2 Nominal and Real Revenue Growth in 5 Provincial Governments, 2007-10
(This graph is available only in the Indonesian text of this publication)
Source: APBD-Rs for 2007-09 and APBD-Ms for 2010, processed by the LBS team.
Three cities (Surakarta, Padang and Surabaya) as well as West Sumbawa and North Gorontalo4 had
the highest average revenue growth rates during 2007-10. North Gorontalo’s revenue rose dramatically
in light of its status as a new kabupaten (formed only in 2007). In real terms its revenue jumped 336%
(2007-08) and 66% (2008-09), but declined in 2010 even in nominal terms. In the case of West Sumbawa, real revenue rose by 19% (2009-2010) because of an agreement between the kabupaten government and a
mining company that promised grant funding of around Rp 63 billion5 in 2010. In addition, there was an
increase under other lawful own-source revenue (LPDS) of Rp 11 billion bringing total revenue to Rp 22 billion.
Graph 2.3 Revenue in 10 Kabupatens with the Highest and Lowest Growth Rates, 2007-10, Based on Constant 2007 Prices
(This graph is available only in the Indonesian text of this publication)
Source: APBD-Rs for 2007-09 and RAPBDs for 2010, processed by Seknas FITRA
The three kabupatens in Aceh and the cities of Banjar and Palu had the lowest average rate of revenue growth among the 42 kabupatens and cities under study. Revenue in the 3 kabupatens in Aceh declined
sharply in 2009 as a result of a decline in Revenue Sharing Fund (DBH) allocations. Based on constant
2007 prices, North Aceh’s DBH receipts declined from Rp 467 billion (2008) to Rp 294 billion (2009), those of Aceh Besar from Rp 48 billion to Rp 26 billion and those of West Aceh from Rp 40 billion to Rp
25 billion. Meanwhile, the city of Banjar sustained drastic drops in revenue of 25% in 2008 and 17% in
2010, principally as a result of a decline in receipts from the General Allocation Fund (DAU) from Rp 274 billion (2008) to Rp 177 billion in 2009. As for the city of Palu’s declining revenue, the main
contributing factor was declining levels of provincial and other government fiscal aid from Rp 25 billion
in 2009 to just Rp 2 billion in its APBD-M in 2010.
2.2 Analysis of Revenue Per Person
In general, the revenue of a kabupaten or city was in direct proportion to its total population (see Graph 2.4). The average revenue of the 42 kabupatens and cities for the 4 years studied (2007-10) was
Rp 653 billion/year; and their average population was 770 000 people (2010). Of the 42, the city of
Surabaya topped the list both for revenue (Rp 2.3 trillion/year) and population (2.8 m). By contrast, North Gorontalo had the lowest revenue (only Rp 161 billion/year) and was second lowest in terms of
population (just 104 000). The city of Padang Panjang was the least populated urban area (47 000) and
had the second lowest level of revenue (Rp 232 billion/year).
Graph 2.4 Average Revenue (2007-10, Based on Constant 2007 Prices) Compared to Total Population
(This graph is available only in the Indonesian text of this publication)
Source: APBD-Rs for 2007, APBD-Ms for 2010 and 2010 Population Census results, processed by the LBS team
Revenue per person was higher on the islands of Sumatera, Kalimantan and Sulawesi than on Java
and Lombok. Small populations outside Java and Lombok resulted in much higher levels of revenue per
4 Throughout the whole of this report a region not specifically designated as a ―city‖ is a kabupaten.
5 Unless a figure is specifically stated to have a nominal value, all figures in this document are real values based on constant 2007 prices.
Analysis of Local Budgets: Study of Budgets for 2007-10
In 42 Kabupatens and Cities and 5 Provinces in Indonesia
12
person there than the average of Rp 1.3 m/person for the 42 kabupatens and cities studied. The city of
Padang Panjang’s revenue per person was Rp 4.9 m; in West Sumbawa (population: 115 000) it was Rp 3 m/person. On Java, the cities of Blitar and Banjar—with populations of 132 000 and 175 000
respectively—achieved average revenue over Rp 1.5 m/person. By contrast, 14 of the 18 regions
surveyed on Java had average revenue of less than Rp 1 m/person. On the bottom of that list were
Malang and Garut—with revenue of just ±Rp 0.5 m/person. High population levels in the three kabupatens on Lombok—between 600 000 and 1.1 m—resulted in very low revenue numbers: ±Rp 0.7
m/person.
Graph 2.5 Average Revenue per Person, 2007-10, Based on Constant 2007 Prices
(This graph is available only in the Indonesian text of this publication)
Source: APBD-Rs for 2007-09 and APBD-Ms for 2010, processed by the LBS team.
2.3 Analysis of Local Revenue Sources
Central government fiscal transfers to regions (dana perimbangan) contributed most revenue in the
kabupatens and cities studied; in second place came “other lawful own-source revenue” (LPDS) (Graph 2.6). Cities were slightly less dependent on dana perimbangan than kabupatens: in 2007 they
derived 81% of their revenue from such transfers; in 2010 the proportion was 73%; in kabupatens the
level of dependency on dana perimbangan fluctuated between 83% and 86% during the period studied
(2007-10). As for LPDS, in 2010 it contributed 14% of total revenue in 16 cities and 9% in 26 kabupatens studied—a slightly higher number than ―local own-source revenue‖ (PAD) (13% in cities and
8% in kabupatens).
Large cities and kabupatens with urban characteristics received relatively lower levels of dana
perimbangan transfers and had higher levels of local own-source revenue (PAD). The cities of
Surabaya and Semarang derived quite substantial amounts of their total revenue from PAD—30% and 20% respectively in 2009
6. The extent of their dependency on dana perimbangan —54% for Surabaya
and 65% for Semarang—was correspondingly less than that of other cities and kabupatens. But a
kabupaten with urban characteristics like Sleman managed to draw on PAD for 16% of its total revenue.
Graph 2.6 Percentage of Revenue Kabupaten/City Revenue by Revenue Source, 2007-10
(This graph is available only in the Indonesian text of this publication)
Source: APBD-Rs for 2007-09 and RAPBDs for 2010, processed by the LBS team
Most of the 19 kabupatens and cities that received less than 80% of their 2009 revenue from central
government fiscal balance transfers (dana perimbangan) derived sizeable amounts of revenue from
other lawful own-source revenue (LPDS) (Graph 2.7). In all these kabupatens and cities more than 9% of total revenue—the kabupaten average in 2009— came from LPDS. North Gorontalo and the city of
Palangka Raya had the highest level of LPDS revenue (reaching 17% of total revenue in 2009).
Graph 2.7 Proportion of Kabupaten/City Revenue by Source, 2009 (APBD-R)
(This graph is available only in the Indonesian text of this publication)
Source: APBD-Rs for 2007-09 and APBD-Ms for 2010, processed by the LBS team.
6 Of the four budgetary years studied (2007-10), 2009 was the last for which APBD-R figures were available. Data for the 2010 budgetary year
could therefore only be drawn from APBD-Ms.

Analysis of Local Budgets: Study of Budgets for 2007-10
In 42 Kabupatens and Cities and 5 Provinces in Indonesia
13
Kabupatens outside Java were generally very dependent on dana perimbangan. Almost all of the fourteen kabupatens/cities among the 42 studied that derived more than 85% of their revenue from dana
perimbangan in 2009 were located outside Java (Graph 2.7). Among those, West Aceh, Dompu,
Polewali Mandar, East Lombok and Serdang Bedagai collected limited local own-source revenue (PAD)
(less than 5% of total revenue). Situbondo and Bojonegoro in East Java were exceptions: they derived 87% and 85% of their revenue respectively from dana perimbangan and just 6% and 8% respectively
from PAD.
The three provincial governments on Java derived most of their revenue from local own-source
revenue (PAD), whereas the governments of South Sumatera and West Nusa Tenggara (NTB) relied
heavily on dana perimbangan transfers. Generally speaking, during 2007-10, PAD contributed between 67% and 74% of total revenue for the governments of West Java, Central Java and East Java; and dana
perimbangan contributed just 25%-33%. Those proportions remained steady over the period studied. By
contrast, although West Sumatera and NTB derived progressively more revenue from PAD during 2007-
10, dana perimbangan transfers remained a more important revenue source for them. The government of South Sumatera derived 48% of its revenue from PAD in 2010 but just over 50% came from dana
perimbangan. In NTB the degree of dependence was even greater: 60% came from dana perimbangan
compared to 40% from PAD. Meanwhile LPDS contributed very little to provincial government revenue.
Graph 2.8 Contributions of PAD and Regional fiscal transfers system Transfers to Revenue in 5 Provinces, 2007-10
(This graph is available only in the Indonesian text of this publication)
Source: APBD-Rs for 2007-09 and APBD-Ms for 2010, processed by the LBS team.
2.4 Central Government Fiscal Transfers to Regions
Central government fiscal balance transfers via the key elements of the dana perimbangan
mechanism—the General Allocation Fund (DAU), the Special Allocation Fund (DAK) and the Revenue Sharing Fund (DBH) —were relatively stable during 2007-10. The only evidence of a
downward trend was in the case of DAK transfers to city areas in 2010. But that may have been because
details of DAK funding for 2010 had not arrived in time for inclusion in APBD-Ms upon which this study was based. Average DAU transfers to surveyed kabupatens in 2007-10 amounted to 79% of total
revenue, a little higher than in the cities (76%). By contrast, DBH transfers contributed an average of
17% in the cities, higher than in the kabupatens (only 11%).
The rate of growth of General Allocation Fund (DAU) transfers slowed in the last three years studied.
Beginning in 2009 the government ceased applying the ―hold harmless‖ principle to DAU
7transfers. The
result was quite significant declines in regional revenue from that source. On average, in the 24 kabupatens studied
8, the nominal rate of increase of DAU transfers fell from 11% during 2007-08 to just
±2% in the following two years. In real terms the growth rate was negative: –8% in 2007-08 and –3% in
2009-10. The cities suffered an even more drastic reduction: down, in nominal terms, from 8% in 2007-08 to – 1% in 2009-10—which translated into real growth rates of –7% in 2009 and –4% in 2010.
Of the 42 kabupatens and cities studied, 13 experienced a decline in nominal value of DAU transfers during 2007-10. The city of Banjar was the only place to experience a significant decrease in DAU
transfers in 2008 (30% (nominal), 35% (real)), even though the city government at that time was still
7 The ―hold harmless‖ principle prevented the nominal DAU allocation for a particular year being less than that of the previous year.
8 The kabupatens of North Gorontalo and West Lombok, formed after their parent kabupatens were split in two, are not included here.

Analysis of Local Budgets: Study of Budgets for 2007-10
In 42 Kabupatens and Cities and 5 Provinces in Indonesia
14
assuming that annual DAU allocations would keep rising. 2009 witnessed falling DAU transfers in 6
kabupatens and cities—leaving aside West Lombok that had just been formed. The most significant falls in 2009 were in West Sumbawa (nominal – 4%, real – 12%) and in the city of Palembang (nominal – 4%,
real –13%). In 2010 the nominal value of DAU transfers fell in 10 kabupatens and cities, including Aceh
Besar, Sleman and the city of Pekanbaru which had also experienced declines in the previous year.
Three cities—Pekanbaru, Surabaya and Semarang—experienced the greatest declines, respectively 19%, 18% and 12% in real terms.
Graph No. 2.10: The Value of DAU Funding in 15 Kabupatens and Cities with Declining DAU Allocations during 2007-10, Based on Constant 2007 Prices
(This graph is available only in the Indonesian text of this publication)
Source: APBD-Rs for 2007-09 and APBD-Ms for 2010, processed by the LBS team.
All three of the provincial governments surveyed on Java received increased General Allocation Fund
(DAU) transfers in the last two years under study (Graph 2.11). But in the first two years studied (2007-
08)—when DAU transfers to the kabupatens and cities increased—DAU allocations fell as a proportion
of provincial government revenue in West Java (by 3% nominal, 8% real) and East Java (6% nominal, 12% real). The corresponding number for the same period in Central Java was positive in nominal term
but down by 6% in real terms. But in fiscal years 2009 and 2010 all three Java-based provincial
governments received increased DAU transfers in nominal terms, though the high rate of inflation meant that, in real terms, growth in 2009 was still – 2% in Central Java and West Java and 0% in East Java.
The two provinces outside Java each had a different experience with DAU transfers (Graph 2.11). In West Nusa Tenggara they grew steadily (in nominal terms) over the four years studied, albeit more
slowly in 2009 and 2010. But in South Sumatera’s case DAU allocations grew by 7% (in nominal terms)
in 2007-08 and 0% in 2009-2010. But, in real terms, both provinces experienced negative rates of growth
in DAU allocations over the four year period as a whole.
Graph 2.11 Nominal and Real Growth of DAU Funding in 5 Provinces, 2007-10
(This graph is available only in the Indonesian text of this publication)
Source: APBD-Rs for 2007-09 and APBD-Ms for 2010, processed by the LBS team.
In contrast to the DAU, levels of Special Allocation Fund (DAK) transfers fluctuated wildly. The number of program areas targeted by the DAK grew from 12 in 2008 to 14 in 2009-10 and reached 19 in
2011 (Table 2.2). Growth in the value of DAK transfers to kabupatens and cities fluctuated wildly among
regions (Graph 2.12). Thus, the difference between the highest and the lowest level of DAK transfers received by Sleman, Bojonegoro and the cities of Surabaya and Semarang during 2007-10 was greater
than each area’s average annual DAK allocation over the 4 year studied. Furthermore, in North
Gorontalo and the city of Pekanbaru, the difference between the highest and lowest allocations received over the same period was twice as great as the average of those two figures.
Graph 2.12 Maximum, Minimum and Average Value of Special Allocation Fund (DAK) Transfers, 2007-10 Based on Constant 2007 Prices
(This graph is available only in the Indonesian text of this publication)
Source: APBD-Rs for 2007-09 and APBD-Ms for 2010, processed by the LBS team.
Revenue Sharing Fund (DBH) transfers were an important source of revenue for some kabupatens and cities (Graph 2.13). This was the case in North Aceh and the city of Pekanbaru, where DBH
transfers contributed between 32% and 48% of local revenue during 2007-10. They also made a sizeable
contribution (23% on average) in West Sumbawa and the city of Surabaya. In Bojonegoro and the cities

Analysis of Local Budgets: Study of Budgets for 2007-10
In 42 Kabupatens and Cities and 5 Provinces in Indonesia
15
of Palembang and Semarang the DBH also furnished an average of 15% of total government revenue. It
is noteworthy that these 7 regions are either large cities or areas endowed with natural resources. Outside those 7, the DBH’s contribution to revenue was relatively small. Unlike the DAU, DBH allocations did
not vary greatly from year to year.
Graph 2.13 Maximum, Minimum and Average Proportion Contributed by DBH to Local Revenue 2007-10
(This graph is available only in the Indonesian text of this publication)
Source: APBD-Rs for 2007-09 and APBD-Ms for 2010, processed by the LBS team.
The provincial government of South Sumatera depended to quite an extent on funding from the
Revenue Sharing Fund (DBH), whereas for the governments of West Java and East Java DBH
contributed relatively little to local revenue. Although the amount contributed by DBH to South Sumatera’s provincial government coffers declined from 36% in 2007 to 26% in 2010, it remained an
important and reliable revenue stream. It did, however, decline in monetary value in 2009. Meanwhile,
in both West Java and East Java, DBH contributed just 13% and 11% respectively of total government revenue, even though the monetary value of the revenue each of these governments derived from DBH
was virtually the same as South Sumatera’s. It is also noteworthy that, while DBH contributed an average
of 8% of total provincial government revenue in both Central Java and West Nusa Tenggara (NTB)
during 2007-10, the monetary value of revenue derived from DBH by Central Java was more than 5 that received by NTB.
2.5 Other lawful Own-source Revenue (LPDS)
Other lawful own-source revenue (LPDS) was an important income stream in some areas, especially
cities. Graph 2.15 shows amounts of LPDS received and the size of LPDS’s contribution to total local
revenue in 10 kabupatens and cities during 2007-10. In seven cities—Surabaya, Semarang, Pekanbaru,
Surakarta, Padang, Pontianak and Palangka Raya—LPDS tended to increase both in monetary value and as a percentage of total revenue, albeit at a lower level in some areas in 2010. This decline could have
resulted from the fact that, for 2010, ABPD-Ms were the only budget documents available for this study.
A different pattern was evident in three kabupatens. In North Aceh LPDS declined significantly in 2009 and again in 2010. In West Sumbawa there was an upward trend over the last 3 years studied, especially
2010. Yet another pattern was evident in North Gorontalo: there, LPDS represented 98% of local
income in 2007, but fell dramatically to just 14% in 2010.
Graph No. 2.15 Total LPDS as a Percentage of Total Government Income, 2007-10, Constant 2007 Prices
(This graph is available only in the Indonesian text of this publication)
Source: APBD-Rs for 2007-09 and APBD-Ms for 2010, processed by the LBS team.
In general, cities derived their other lawful own-source revenue (LPDS) from their shares of tax
revenue collected by provincial or other local governments (a form of DBH at the sub-national level). As Graph 2.16 shows, between 2008 and 2010, such revenue sharing was a major source of LPDS for the
cities of Surabaya, Pekanbaru, Semarang, Pontianak and Surakarta. But at various times in some cities
adjustment and special autonomy transfers contributed quite significantly to local revenue: This was the case in Pekanbaru, Pontianak and Surakarta in 2008, in Pontianak in 2009 and in Surakarta in 2010. The
situation was rather different in Palangka Raya, where adjustment and special autonomy transfers
increased between 2007 and 2009, but were not budgeted for at all in 2010. Padang’s situation was
different again: there, provincial tax revenue sharing contributed significantly to total revenue during 2007-09; but in 2010 its contribution was overshadowed by emergency funding—provided in response to
Analysis of Local Budgets: Study of Budgets for 2007-10
In 42 Kabupatens and Cities and 5 Provinces in Indonesia
16
the 2009 earthquake. Such funding constituted almost half the city’s LPDS in 2010 which, in monetary
terms, was 3.4 times greater than 2009’s LPDS.
LPDS revenue fluctuated significantly in West Sumbawa, North Aceh and North Gorontalo, both in
geographic terms and from year to year. In West Sumbawa, the kabupaten’s share of tax revenue collected by provincial or other local governments was the biggest single contributor to LPDS in 2008-09;
but it was less significant in both 2007 and 2010 when grants took over as the main source of LPDS.
Indeed, in 2010, West Sumbawa budgeted for 2.6 times more LPDS revenue than it had spent in the
preceding year, possibly counting on grants from a large mining company operating in its territory. In North Aceh adjustment and special autonomy funds contributed 90% of LPDS in 2007-08. But, in 2009,
not only did LPDS decline to just 18% of what it was previously; its composition was also different. In
2009-10 shared revenue from taxes collected by the province or other local governments constituted a high proportion (around 60%) of North Aceh’s LPDS. In 2009 provincial/other local government fiscal
support contributed 44% of North Aceh’s LPDS, while grants contributed 37% in 2010. In the case of
North Gorontalo, during its first two years of existence as a province, provincial/other local government
fiscal support and grants took it in turns to be the biggest single contributor to LPDS; but they were both overtaken in 2009-10 by adjustment and special autonomy funding.
Graph 2.16 Contribution of Various LPDS Components to LPDS Revenue in 10 Kabupatens/Cities, 2007-10
(This graph is available only in the Indonesian text of this publication)
Source: APBD-Rs for 2007-09 and APBD-Ms for 2010, processed by the LBS team
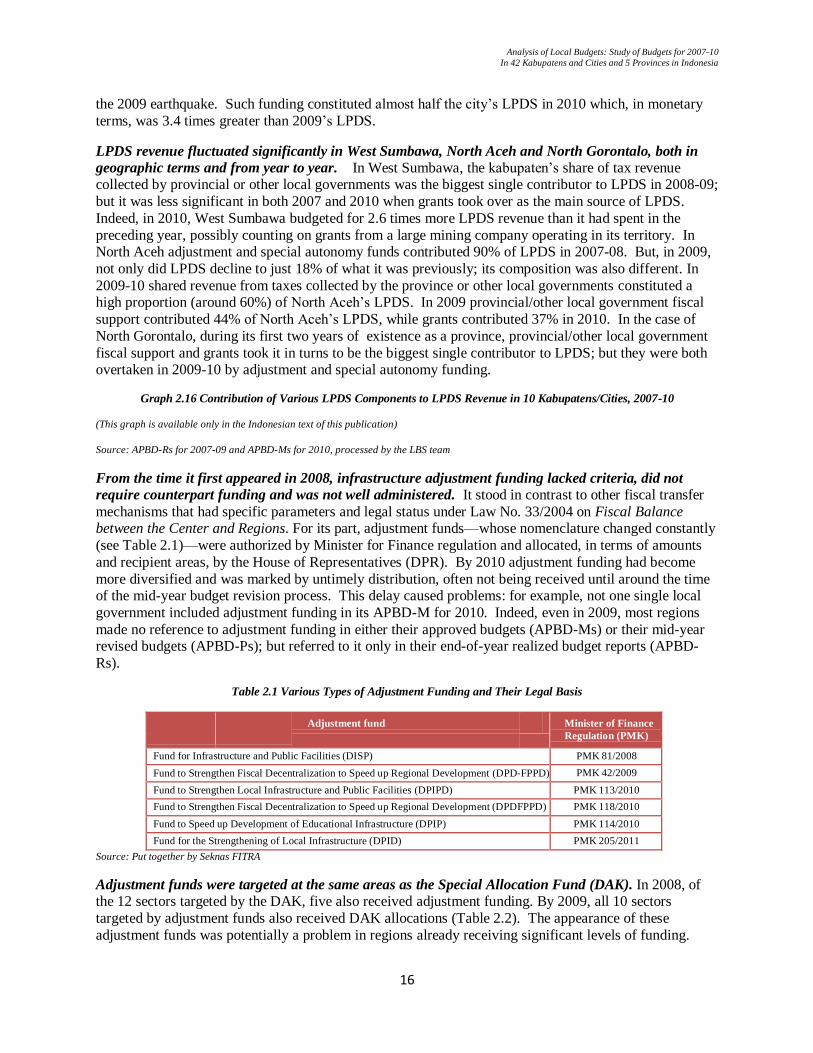
From the time it first appeared in 2008, infrastructure adjustment funding lacked criteria, did not
require counterpart funding and was not well administered. It stood in contrast to other fiscal transfer
mechanisms that had specific parameters and legal status under Law No. 33/2004 on Fiscal Balance between the Center and Regions. For its part, adjustment funds—whose nomenclature changed constantly
(see Table 2.1)—were authorized by Minister for Finance regulation and allocated, in terms of amounts
and recipient areas, by the House of Representatives (DPR). By 2010 adjustment funding had become
more diversified and was marked by untimely distribution, often not being received until around the time of the mid-year budget revision process. This delay caused problems: for example, not one single local
government included adjustment funding in its APBD-M for 2010. Indeed, even in 2009, most regions
made no reference to adjustment funding in either their approved budgets (APBD-Ms) or their mid-year revised budgets (APBD-Ps); but referred to it only in their end-of-year realized budget reports (APBD-
Rs).
Table 2.1 Various Types of Adjustment Funding and Their Legal Basis
Adjustment fund Minister of Finance
Regulation (PMK)
Fund for Infrastructure and Public Facilities (DISP) PMK 81/2008
Fund to Strengthen Fiscal Decentralization to Speed up Regional Development (DPD‐FPPD) PMK 42/2009
Fund to Strengthen Local Infrastructure and Public Facilities (DPIPD) PMK 113/2010
Fund to Strengthen Fiscal Decentralization to Speed up Regional Development (DPDFPPD) PMK 118/2010
Fund to Speed up Development of Educational Infrastructure (DPIP) PMK 114/2010
Fund for the Strengthening of Local Infrastructure (DPID) PMK 205/2011
Source: Put together by Seknas FITRA
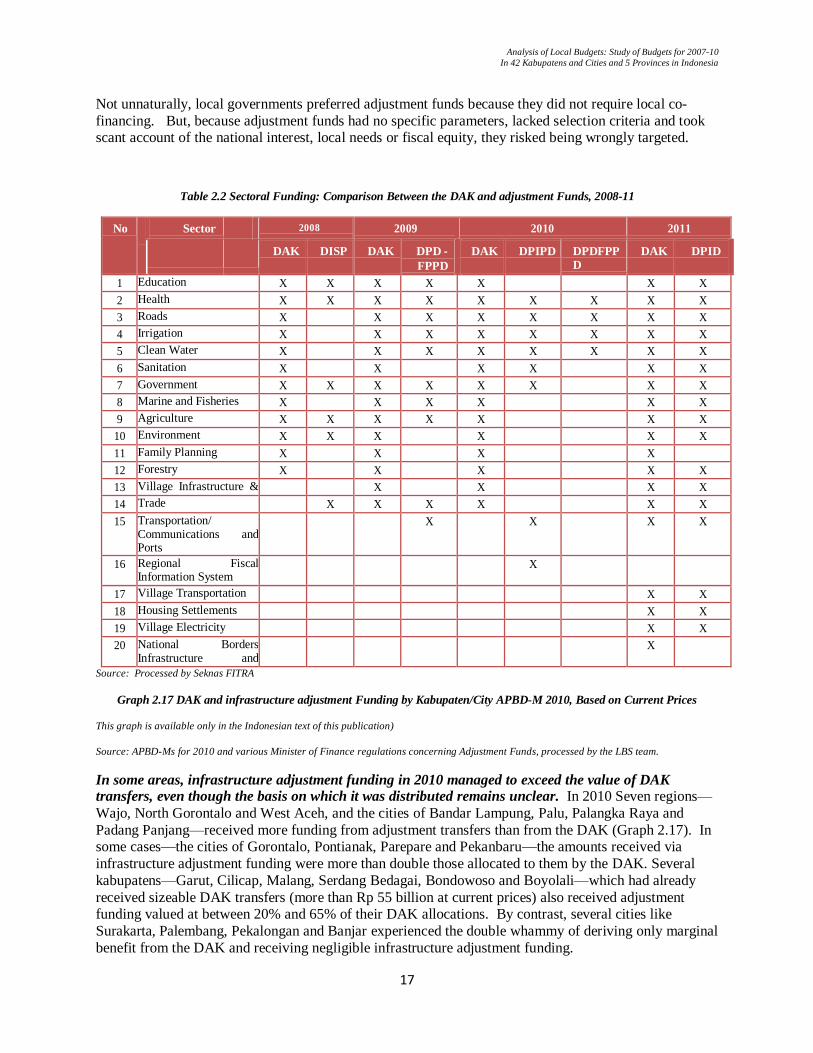
Adjustment funds were targeted at the same areas as the Special Allocation Fund (DAK). In 2008, of the 12 sectors targeted by the DAK, five also received adjustment funding. By 2009, all 10 sectors
targeted by adjustment funds also received DAK allocations (Table 2.2). The appearance of these
adjustment funds was potentially a problem in regions already receiving significant levels of funding.
Analysis of Local Budgets: Study of Budgets for 2007-10
In 42 Kabupatens and Cities and 5 Provinces in Indonesia
17
Not unnaturally, local governments preferred adjustment funds because they did not require local co-
financing. But, because adjustment funds had no specific parameters, lacked selection criteria and took scant account of the national interest, local needs or fiscal equity, they risked being wrongly targeted.
Table 2.2 Sectoral Funding: Comparison Between the DAK and adjustment Funds, 2008-11
No Sector 2008 2009 2010 2011
DAK DISP DAK DPD ‐ FPPD
DAK DPIPD DPDFPP
D DAK DPID
1 Education X X X X X X X
2 Health X X X X X X X X X
3 Roads X X X X X X X X
4 Irrigation X X X X X X X X
5 Clean Water X X X X X X X X
6 Sanitation X X X X X X
7 Government Infrastructure
X X X X X X X X
8 Marine and Fisheries X X X X X X
9 Agriculture X X X X X X X
10 Environment X X X X X X
11 Family Planning X X X X
12 Forestry X X X X X
13 Village Infrastructure & Facilities
X X X X
14 Trade X X X X X X
15 Transportation/ Communications and Ports
X X X X
16 Regional Fiscal Information System
X
17 Village Transportation X X
18 Housing Settlements X X
19 Village Electricity X X
20 National Borders Infrastructure and Facilities
X
Source: Processed by Seknas FITRA
Graph 2.17 DAK and infrastructure adjustment Funding by Kabupaten/City APBD-M 2010, Based on Current Prices
This graph is available only in the Indonesian text of this publication)
Source: APBD-Ms for 2010 and various Minister of Finance regulations concerning Adjustment Funds, processed by the LBS team.
In some areas, infrastructure adjustment funding in 2010 managed to exceed the value of DAK transfers, even though the basis on which it was distributed remains unclear. In 2010 Seven regions—
Wajo, North Gorontalo and West Aceh, and the cities of Bandar Lampung, Palu, Palangka Raya and
Padang Panjang—received more funding from adjustment transfers than from the DAK (Graph 2.17). In some cases—the cities of Gorontalo, Pontianak, Parepare and Pekanbaru—the amounts received via
infrastructure adjustment funding were more than double those allocated to them by the DAK. Several
kabupatens—Garut, Cilicap, Malang, Serdang Bedagai, Bondowoso and Boyolali—which had already
received sizeable DAK transfers (more than Rp 55 billion at current prices) also received adjustment funding valued at between 20% and 65% of their DAK allocations. By contrast, several cities like
Surakarta, Palembang, Pekalongan and Banjar experienced the double whammy of deriving only marginal
benefit from the DAK and receiving negligible infrastructure adjustment funding.
Analysis of Local Budgets: Study of Budgets for 2007-10
In 42 Kabupatens and Cities and 5 Provinces in Indonesia
18
Local Own-Source Revenue (PAD)
Provincial government own-source revenue (PAD) derived mainly from taxation; in cities it derived
mainly from local fees and charges; and in kabupatens it came increasingly from other lawful PAD9.
Tax receipts contributed around 85% of total provincial government PAD in the regions studied. West Java’s provincial government had the highest level of tax-derived PAD—between 91% and 93% over the
four years studied; West Nusa Tenggara’s was somewhat less—between 72% and 84%. On average in
16 cities studied, fees and charges contributed more to PAD than taxation. But even so the amount tax revenue contributed to cities’ PAD (37-39%) was far more than for kabupatens (just 21%-24%). On
average, by 2010, the amount of revenue derived from other lawful PAD in 26 kabupatens surveyed was
slightly more than that derived from local fees and charges. During the period studied (2007-10) taxation’s contribution to kabupatens’ PAD hovered between 21% and 24%.
Provincial and kabupaten governments (but less so in the cities) received increasing amounts of local
own-source revenue (PAD) from other lawful PAD and from management of locally funded government enterprises. Although these two revenue streams contributed a relatively small amount of
overall provincial government PAD, their contribution grew over the 4 years studied: from just 8% of
PAD in 2007 to 13% in 2010. The same sort of trend was evident in 26 kabupatens studied: their contribution grew from 36% of PAD in 2007 to 44% three years later. By contrast, city government PAD
from these two sources declined in 2007-08 and rose again slightly in 2009-10.
Graph 2.18 Growth Trends of Various Sources of PAD, 2007-10
(This graph is available only in the Indonesian text of this publication)
Only areas with urban characteristics were able to turn local taxes into a principal source of local
own-source revenue (PAD). Almost all regions deriving more than 40% of PAD from taxation were
cities or kabupatens with urban characteristics like Sleman. The kabupatens of West Lombok and Serdang Bedagai were exceptions here. The large number of hotels and restaurants in West Lombok’s
Senggigi district meant that it was able to collect a relatively large amount of tax. In the case of Serdang
Bedagai, taxation’s contribution to PAD was high only because total PAD itself was so low vis-à-vis other revenue sources—just Rp 17 billion or a mere 3% of total revenue for 2009. Furthermore, some
small cities such as Gorontalo, Parepare, Blitar and Padang Panjang recorded very low levels of PAD
from taxation (less than 20%).
The kabupatens of Pekalongan, Garut and the city of Banjar all had high levels of revenue from fees
and charges, 80% of which derived from health services. The city of Banjar received fees and charges
amounting to Rp 14-17 billion (constant 2007 prices) or 66%-74% of its PAD during 2007-10. During that same period, Pekalongan netted Rp 24-35 billion worth of fees and charges (constant 2007 prices) or
58%-70% of PAD. Something similar occurred during 2007-09 in Garut, where fees and charges topped
Rp 64-69 billion or 81%-83% of PAD. But in 2010 (in its APBD-M) Garut made provision for free health services, resulting in a fall in revenue from fees and charges to just Rp 11 billion (at constant 2007
prices), or 13% of its PAD.
Other legal PAD (local own-source revenue) was a very significant source of PAD in North Aceh and West Sumbawa. In North Aceh, even though contributions by other legal PAD slid from Rp 85 billion
(84% of total PAD) in 2007 to Rp 10 billion (33% of total PAD) in 2010 (based on APBD-M figures), it
remained the kabupaten’s single biggest contributor to PAD. More than 60% of revenue in question was generated by bank transfer receipts and interest payments. That showed that most of North Aceh’s
official funds were deposited with banks rather than being used to deliver public services and stimulate
9 Revenue from other lawful local own-source revenue derives mainly from receipts from bank transfers, interest on deposits and income from
Local Community Service Agencies (BLUD). In some areas base hospitals are classified as BLUDs.

Analysis of Local Budgets: Study of Budgets for 2007-10
In 42 Kabupatens and Cities and 5 Provinces in Indonesia
19
the economy. This situation explains why, as is discussed in Chapter 4 of this report, North Aceh carried
forward such large amounts of unspent funds (SiLPA) from one budget year to the next. Just the opposite occurred in West Sumbawa, where other lawful PAD increased during the four years under study: from
Rp 5.5 billion (61% of PAD) in 2007 to Rp 22 billion (73% of PAD) in 2010 (based on APBD-M
figures). West Sumbawa derived more than 70% of its other lawful PAD from ―third party contributions‖.
Graph 2.19 Proportion Contributed to (Realized) PAD by Various Sources of PAD
(This graph is available only in the Indonesian text of this publication)
Source: Budget Outcomes for 2009, compiled by the LBS team.

Analysis of Local Budgets: Study of Budgets for 2007-10
In 42 Kabupatens and Cities and 5 Provinces in Indonesia
20
3. Analysis of Local Expenditure
3.1 General Analysis of Expenditure
In general, the rate of growth of budgetary expenditure in the areas studied exceeded the rate of
growth of revenue (see Graph 3.1). The only exceptions were the 5 provincial governments during fiscal
years 2008 and 2009: then, on average, expenditure’s rate of growth fell slightly below that of revenue. As was the case with revenue, the rate of growth in expenditure declined significantly in real terms in
2008-09 in the 24 kabupaten10
, 12 city and 5 provincial governments surveyed. Indeed, during that
period, these regions’ growth rates became negative numbers—ranging from -0.3% to -2.6%; but they
rose sharply in the following year11
especially in provincial governments (up 13%). Our analysis also shows that the rate of growth of expenditure was always higher in cities than in kabupatens.
Graph 3.1 Growth of Expenditure and Income 2007-10, Based on Constant 2007 Prices
(This graph is available only in the Indonesian text of this publication)
Of all the areas studied, the city of Surabaya had the highest rate of growth in expenditure during
2007-10. Indeed, the city’s spending (in constant 2007 prices) more than doubled from Rp 1.6 trillion in
2008 to Rp 3.6 trillion in 2010. While Surabaya spent less than its income in 2007 and 2008, its
expenditure significantly exceeded income in both 2009 and 2010. This high rate of growth in expenditure was accompanied by a decline in the proportion of the budget spent (both directly and
indirectly) on the civil service: down from 48% of total city expenditure in 2007 to 32% in 2010; and a
fall in expenditure on goods & services from 33% in 2007 to 23% in 2010. By contrast, the city increased it capital expenditure over the four year period: from 16% in 2007 to 36-37% in 2009-10.
At the provincial level, the government of West Java’s average level of expenditure grew at a faster rate than that of the other four provinces over the four years under study. In real terms, West Java’s
expenditure grew at an average annual rate of 15% over the period. The opposite was happening on the
revenue side of the ledger: in real terms West Java’s income declined from 2008 onwards. West Java’s
increased expenditure was marked by a rise in spending (both direct and indirect) on civil service costs: up from 18% of total expenditure in 2007 to 20% in 2010. At the same time, expenditure on capital
items and on goods & services also rose steadily from 21-22% in 2007-08 to 30% in 2010. The latter
number (30%) was still lower than the average 2010 level of expenditure in those areas—between 30% and 42% of their entire APBDs—achieved by the other four provinces. Almost half of the government of
West Java’s expenditure consisted of transfers (revenue sharing and financial aid): far more than in the
other four provincial governments that spent only 25% of their budgets on transfers.
Government expenditure was a relatively significant contributor to growth of local kabupaten and city
GDP, but not at the provincial government level. In the case of relatively small kabupatens and cities
outside Java like Dompu and Polewali Mandar and the cities of Padang Panjang and Gorontalo, government expenditure during the four years studied (2007-10) added an average of more than 20% to
local GDP levels obtaining in 2007. Blitar was the only city on Java in which expenditure contributed
significantly (almost 30%) to local GDP. In Central Lombok also, where population far exceeds that of the kabupatens and cities just referred to, government expenditure amounted to 20% of local GDP. These
numbers underline the importance of government expenditure for regional economic growth. By
contrast, expenditure contributed minimally to local GDP of provincial governments studied: a mere 1% in Central Java, East Java and South Sumatera; and 3% in West Nusa Tenggara.
10
The kabupatens of North Gorontalo and West Lombok, formed after their parent kabupatens were split in two, are not included here.
11
2010 budget figures are drawn from APBD-M projections, whereas for the other 3 years they are taken from APBD-Rs.
Analysis of Local Budgets: Study of Budgets for 2007-10
In 42 Kabupatens and Cities and 5 Provinces in Indonesia
21
Graph 3.2 Average Local Budget Expenditure (2007-10) as a Proportion of PRDB (2007), Based on Constant 2007 Prices
(This graph is available only in the Indonesian text of this publication)
Source: Budget Outcomes for 2007-09 and Proposals for 2010 APBDs, produced by the LBS team
3.2 Analysis of the Components of Expenditure
Expenditure on local civil services showed a consistently upward trend. Indeed, such a trend combined
with decreased capital expenditure, mirrored what was happening at the national level12
. In the 26 kabupatens studied, average indirect (routine, administrative) expenditure (BTL) on civil services was as
high as 55% of total budget resources in 2010. The percentage was higher still (60%) when direct
(development-related) civil service expenditure (BL) is factored in. In the 16 cities under study the same trend was evident, albeit at a slightly lower level, with BL and BTL on local civil services consuming
56% of budgetary resources in 2010. Average civil service expenditure in kabupatens and cities under
study was higher than the national average (47% in 2009 (end-of-year outcomes) and 51% in 2010
(planning projections).
This high level of civil service expenditure had implications for spending on capital items and goods &
services which impact directly on local economic growth. Average expenditure in these two areas declined significantly during the period studied: in the kabupatens from 39% of total budgets in 2007 to
28% in 2010; and in the cities, albeit from a slightly higher base, from 46% (2007) to 36% in 2010.
These numbers were below the national average for similar expenditure by kabupatens and cities Indonesia-wide— 43% in 2009 (end-of-year outcomes) and 38% in 2010 (planning projections).
Graph 3.3 Proportional Break-down of Expenditure for Kabupatens, Cities and Provinces 2007-10
(This graph is available only in the Indonesian text of this publication)
The situation was a little different in provincial governments studied: increases in civil service
spending and declines in expenditure on capital items and on goods & services were not as great as in
the kabupatens and cities surveyed. Average provincial government civil service expenditure (direct and
indirect) rose from 24%-25% between 2007 and 2009 to 28% in 2010. That was slightly above the national average—24% in 2009 (end-of-year outcomes) and 28% in 2010 (projections). Overall, the five
provinces studied spent slightly less on civil service costs because of large amounts—27%-33% of their
budgets during 2007-10—expended on transfers in the form of shared revenue and financial aid. Nor did
provincial government spending on capital items and on goods & services decline as much as in the kabupatens and cities: the five provinces studied spent 38% of budgetary resources on those items in
2007, but only 34% in 2010. These numbers fell well short of the national average—47% in 2009 (end-
of-year outcomes) and 38% in 2010 (planning projections).
Graph 3.4 Proportion of DAU Funds Spent on Civil Service in 2007 and 2009
(This graph is available only in the Indonesian text of this publication)
On average, the 42 kabupatens and cities studied spent 95% of their General Allocation Fund (DAU)
transfers in 2010 on civil service costs. In 2007 indirect (routine, administrative) expenditure (BTL) on civil services accounted for 65% of DAU funding received, but such expenditure increased markedly over
the next three years: to 76% in 2008, 85% in 2009 and 95% in 2010. Indeed, the level of civil service
expenditure in 10 of the kabupatens and cities surveyed not only trended upwards during the period 2007-10, but actually exceeded DAU allocation levels in 2010 (Graph 3.4). Most of these regions were cities,
12
National average figures for 2009 quoted in this report are taken from Analisis Realisasi APBD 2009, while those for 2010 come from Deskripsi dan Analasis APBD 2010. Both these documents are publications of the Directorate for the Local Government Funding and Financial Information within the Directorate-General for Fiscal Balance (DJPK), Indonesian Ministry of Finance.

Analysis of Local Budgets: Study of Budgets for 2007-10
In 42 Kabupatens and Cities and 5 Provinces in Indonesia
22
areas with urban characteristics like Sleman or resource-rich areas such as North Aceh. Boyolali was in a
class of its own.
3.3 Direct Per Capita Expenditure
High levels of civil service expenditure led to a significant decline in the level of direct (development-
related) expenditure (BL) per head of population. In the 26 kabupatens studied, average BL per person
(based on constant 2007 prices) declined by 16% from around Rp 5.1 m/person in 2007 to Rp 4.3 m/person in 2010. A slightly better number, albeit on the decline as well, was evident in the 16 cities
under study: Rp 8.1 m/person in 2007 down to Rp 7.5 m/person in 2010—a decline of 8%. As Graph 3.5
shows, only three kabupatens (West Sumbawa, Wajo and the newly established North Gorontalo) had an increase in BL per person. The other 23 kabupatens registered declines. Cities performed relatively
better: six of them—Padang Panjang, Parepare, Surabaya, Pontianak, Padang and Semarang— managed
to achieve an increase in BL per capita. Overall, inhabitants of kabupatens and cities on Java had less
spent directly on them per person than people living in the regions surveyed outside Java.
Graph 3.5 Direct Per Capita Expenditure 2007 and 2010, Based on Constant 2007 Prices
(This graph is available only in the Indonesian text of this publication)
Source: APBD-Rs for 2007, APBD-Ms for 2010 and 2010 Population Census results, processed by the LBS team.
3.4 Expenditure on Social Aid and Grants
Expenditure by kabupatens and cities on social aid (bansos) showed a downward trend, whereas
spending on grants (hibah) increased. Average expenditure on social aid (based on constant 2007 prices) in the 26 kabupatens and 16 cities studied declined by 31% and 47% respectively during 2007-10. As a
proportion of total expenditure, kabupaten and city spending on social aid declined from 4% in 2007 to
2% in 2010. By contrast, expenditure on grants (hibah) rose dramatically. In 2007 kabupatens spent an average of just Rp 8 m (1% of average APBD spending) on grants, but by 2010 that amount had
quadrupled to Rp 34 billion (5% of average APBD expenditure). But cities spent even more on grants:
Rp 3 billion in 2007 and as much as 40 billion in 2010—a more than twelvefold increase. That amounted
to 1% of their total budget spending in 2007 and 4% in 2010.
Graph 3.6 Average Growth of Expenditure on Social aid and Grants by the 26 Kabupatens and 12 Cities Studied, 2007-10 (Based on Constant 2007 Prices)
(This graph is available only in the Indonesian text of this publication)
In most of the 18 kabupatens and cities which held “pilkada”—elections for local heads of government (HOGs) —in 2008, expenditure on social aid fell markedly in 2009 and 2010. In the city of Pontianak,
for example, budget allocations for social aid averaged Rp 33 billion in 2007 and 2008 (constant 2007
prices), but fell to just Rp 7 billion in both 2009 and 2010. Although not quite as dramatic, something
similar happened in East Lombok, Bone and the cities of Padang Panjang and Parepare. Social aid expenditure in those four regions in 2009 hovered between 43% and 49% of levels attained in the election
year (2008). That said, a number of kabupatens and cities—Garut, West Lombok, Bondowoso, North
Gorontalo and the city of Banjar—continued to spend large amounts on social aid after their pilkada.
Graph 3.7 Allocations for Expenditure on Social aid (2007-10) in 18 Kabupatens and Cities Which Held Pilkada in 2008, Based on Constant 2007 Prices
(This graph is available only in the Indonesian text of this publication)
Source: APBD-Rs for 2007, APBD-Ms for 2010 and 2010 Population Census results, processed by the LBS team.

Analysis of Local Budgets: Study of Budgets for 2007-10
In 42 Kabupatens and Cities and 5 Provinces in Indonesia
23
Although social aid expenditure did not increase in 17 local government areas holding pilkada in
2010, spending on grants did, and significantly (graph 3.8). Indeed, in some regions, spending on grants ballooned out in the year preceding 2010 pilkadas: Boyolali spent over 20 times more on grants in
2009 than it did in 2008; the city of Semarang’s 2009 spending on grants was 6 times higher than the
2008 number; and the city of Surabaya spent 4 times more on grants in 2009 than in 2008. This increased
level of spending persisted into the election year (2010). But it has to be acknowledged that grant allocations were partly used to cover costs of conducting elections. Thus three kabupatens holding
elections in 2010—Dompu, Kendal and Serdang Bedagai—allocated nine or ten times more funding for
grants in 2010 than in 2009.
Graph 3.8 Allocations for Expenditure on Grants in 17 Kabupatens and Cities (2007-10) Which Held Pilkada in 2010, Based on Constant 2007 Prices
(This graph is available only in the Indonesian text of this publication)
Source: APBD-Rs for 2007, APBD-Ms for 2010 and 2010 Population Census results, processed by the LBS team.
Although social aid spending by the five provincial governments trended downwards—as it did in the
kabupatens and cities studied—their expenditure patterns on grants were somewhat different to other areas studies. Provincial government expenditure on social aid fell by 70% over the period studied: from
Rp 317 billion in 2007 (8% of total expenditure) to just Rp 94 billion in 2010 (3% of total expenditure).
But, bucking the trend in kabupatens and cities, provincial government spending on grants jumped almost 6 times between 2007 and 2008, but then fell again in 2009-10. In monetary terms, the fall was from Rp
413 billion in 2008 (9% of total expenditure) to Rp 199 billion in 2010 (3% of total expenditure). Such
high levels of spending on grants in 2008 may have been due to gubernatorial elections held in that year.

Analysis of Local Budgets: Study of Budgets for 2007-10
In 42 Kabupatens and Cities and 5 Provinces in Indonesia
24
4. Analysis of Planning, Financing and Fiscal Space
4.1 Budget Planning and Revision Processes
In general, revenue planning processes in kabupatens and cities studied worked relatively well.
Overall, revenue targets were achieved as planned: realized income in end-of-year reports on budget
outcomes (APBD-Rs) averaged between 104% and 105% of original budget (APBD-M) targets. The mid-year budget revision process producing revised budgets (APBD-Ps) also worked well, helping to
bring more precision to revenue forecasts: APBD-R outcomes on revenue were between 99% and 101%
of APBD-P targets. This situation came about mainly because regions could make fairly precise estimates
of income to be derived from central government fiscal balance transfers (dana perimbangan). Indeed, APBD-R numbers on amounts of dana perimbangan received in the budget year just past were between
100% and 104% of APBD-M estimates and between 99% and 101% of APBD-P projections.
That said, projections of revenue from other lawful local own-source revenue (LPDS) were still poor,
especially at the budget planning stage. Graph 4.1 shows that most areas were only able to set
reasonably accurate targets for LPDS revenue during the mid-year budget revision process (APBD-Ps). But, despite that, end-of-year budget results (APBD-Rs) still recorded LPDS revenue numbers that were
between 20% and 60% higher than APBD-P targets. As for the budget planning process, its
underestimation of LPDS revenue grew worse over the period: in 2007 average APBD-R outcomes were
40% higher than APBD-M projections; by 2009 they were 90% higher than planning projections.
Graph 4.1 Actual LPDS Revenue in APBD-Rs Compared to Projected Revenue in APBD-Ms and APBD-Ps
(This graph is available only in the Indonesian text of this publication)
Source: APBD-Ms, APBD-Ps and APBD-Rs for 2007-09, processed by the LBS team.
Although realized budget numbers for local own-source revenue (PAD) were, on average, close to original budget projections, quite a few regions had difficulty accurately estimating PAD revenue. On
average during the three budget years studied in this context, actual revenue (APBD-R) from PAD
hovered between 107% and 109% of original budget projections (APBD-M). The mid-year budget
revision process managed to bring estimated PAD revenue (in APBD-Ps) closer to budget outcomes (APBD-Rs), but budget year 2009 was an exception: in that year APBD-P targets were just 94% of
APBD-R outcomes. In some regions end-of-year APBD-R outcomes bore little resemblance to original
budgets estimates (in APBD-Ms), mostly because governments underestimated their capacity to collect PAD. Areas with poor PAD revenue planning processes ranged from Sleman, on one hand, which always
underestimated its PAD revenue at less than 87% of what it achieved to Bone, on the other, which
consistently overestimated its likely PAD revenue in both its APBD-Ms and APBD-Ps.
While tending to underestimate revenue, the kabupatens and cities studied generally planned for
excessively high levels of expenditure—a tendency exacerbated by the mid-year budget revision process.
Thus on average actual end-of-year expenditure (in APBD-Rs) in kabupatens and cities was lower than both originally projected targets (in APBD-Ms) and mid-year revised targets (in APBD-Ps). The result
was that some allocated funds were unspent at the end of the fiscal year. Mid-year budget revision
processes should have served to improve APBD-Ms by making them more achievable, but in fact they exacerbated the tendency to underspendcd by setting even higher revised expenditure targets. In fact, on
average, expenditure targets set in original budgets (APBD-Ms) were relatively good, given that actual
end-of-year expenditure was between 94% and 99% of original projections. By contrast, actual expenditure was only between 84% and 95% of mid-year revised targets (in APBD-Ps).

Analysis of Local Budgets: Study of Budgets for 2007-10
In 42 Kabupatens and Cities and 5 Provinces in Indonesia
25
This tendency to underspend, made worse by the mid-year budget revision process, was particularly
apparent in expenditure on goods & services. But it was also evident in civil service spending (graph 4.2). Actual expenditure by kabupatens on goods & services was almost identical with planned
expenditure: on average, end-of-year outcomes (in APBD-Rs) were between 97% and 100% of original
budget targets (in APBD-M). But overambitious budget revision processes led many kabupatens to end
up spending less than 90% of revised budget (APBD-P) targets. A similar pattern was evident in cities studied: on average, actual expenditure on goods & services was between 92% and 96% of original
budget projections (in APBD-Ms); and only between 86% and 88% of mid-year revised targets (in
APBD-Ps). Civil service spending was closer to what was targeted: on average, in 2007, 92% of revised expenditure targets were spent; by 2009 the proportion had risen to 95%. The fact remains, however, that
if local governments had not revised their budgets mid-year, their end-of-year expenditure numbers
would have been much better.
Graph 4.2 Actual Expenditure on Goods & services Compared to Projected Expenditure in APBD-Ms and APBD-Ps
(This graph is available only in the Indonesian text of this publication)
Source: APBD-Ms, APBD-Ps and APBD-Rs for 2007-09, processed by the LBS team.
Like expenditure on goods & services, expenditure on capital items was adversely affected by budget
revision processes (graph 4.3). Actual capital expenditure by kabupatens and cities studied was, on average, more than 90% of original budget projections (in APBD-Ms) throughout the three years studied
(2007-09). Kabupatens performed slightly better than cities, though their spending also trended
downwards. More ambitious expenditure targets incorporated into mid-year revised budgets (APBD-Ps) impacted more severely on capital expenditure than on goods & services: on average, actual expenditure
on capital items between 2007 and 2009 in the cities surveyed did not once rise above 85% of mid-year
revised targets (in APBD-Ps). Kabupaten spending was slightly higher: on average their actual
expenditure (in APBD-Rs) rose from 85% of mid-year revised targets (in APBD-Ps) in 2007 to 91% in 2009.
Graph 4.3 Actual Expenditure on Capital Items Compared to Projected Expenditure in APBD-Ms and APBD-Ps
(This graph is available only in the Indonesian text of this publication)
Source: APBD-Ms, APBD-Ps and APBD-Rs for 2007-09, processed by the LBS team.
4.2 Budget Surpluses
Planning figures suggest that budget surpluses resulted more from under expenditure than from unexpected “success” on the revenue side (graph 4.4). On average, budget income recorded in end-of-
year reports (APBD-Rs) showed that the kabupatens and cities studied achieved between 104% and
105% of original revenue targets (in APBD-Ms) and between 99% and 101% of revised targets in mid-year APBD-Ps. This amounts to clear evidence of underestimating budget income. By comparison,
increasingly higher levels of spending were incorporated in both original budgets (APBD-Ms) and
revised budgets (ABPD-P) over the period studied: on average, realized kabupaten/city budget expenditure in 2007 represented 95% of APBD-M spending targets, but only 88% of mid-year revised
budget (APBD-P) targets; corresponding numbers for 2009 were 98% and 92%. This data shows that
kabupatens and cities tended to set themselves excessively high spending targets, particularly in mid-year
revised budgets. Given that shortfalls in realized expenditure were greater than the amounts by which revenue was underestimated, it seems that budget surpluses resulted mainly from under expenditure.
Graph 4.4 Comparison of Budget Outcomes (APBD-R) with Draft (APBD-M) and Revised (APBD-P) Budget Targets and Resulting Budget Surpluses (SiLPA), 2007-09
(This graph is available only in the Indonesian text of this publication)
Analysis of Local Budgets: Study of Budgets for 2007-10
In 42 Kabupatens and Cities and 5 Provinces in Indonesia
26
Source: APBD-Ms, APBD-Ps and APBD-Rs for 2007-09, processed by the LBS team.
The extent to which budget surpluses (termed SiLPA in Indonesian) were used to fund the next year’s
budgets trended downwards during the period under study. On average, in 2008, the 42 kabupaten and cities under study used SiLPA carried forward from 2007 to finance 14% of budget expenditure. That
was a significant contribution: after all, local own-source revenue (PAD) funded only 10% of spending
that year (2008). However, the amount of SiLPA declined steadily after 2008, contributing just 6% of
budget financing in 2010, by which time PAD’s contribution had risen to 11%.
Of the 42 kabupatens and cities studied, North Aceh and Wajo kabupatens and the cities of Surabaya,
Padang Panjang and Semarang used more SiLPA than other areas to fund their budgets. Of these five regions North Aceh had the most substantial surpluses: indeed, in 2007 SiLPA carried forward from
2006 was greater than the entire 2007 budget; in 2008 SiLPA declined somewhat but was still able to
finance 91% of North Aceh’s budget. This situation came about from a combination of factors: on one hand, high levels of revenue in 2007 (almost 150% more than originally budgeted for) and, on the other,
low levels of expenditure (just 75% of original APBD-M projections and 62% of revised APBD-P
targets). Among the three cities mentioned above, Surabaya had the highest proportion of its budgets
funded by SiLPA over the period studied: the high point was in 2008, when 64% of the city’s budget was funded by SiLPA from 2007. Like North Aceh, Surabaya’s large budget surpluses resulted from under-
estimates on the revenue side—actual revenue was 10% above both original APBD-M projections and
revised APBD-P targets—and lower than expected expenditure—just 77% of original APBD-M projections and 62% of revised APBD-P targets. That said, the extent to which North Aceh, Surabaya and
other regions financed their budgets with SiLPA trended downwards through to 2010.
Graph 4.5 Average Contribution of SiLPA from Previous Year to Financing of Expenditure by Kabupatens and Cities
2007-09
(This graph is available only in the Indonesian text of this publication)
Source: APBD-Ms, APBD-Ps and APBD-Rs for 2007-09, processed by the LBS team.
Among the 42 regions studied, the kabupatens of Sidenreng Rappang, Polewali Mandar and East
Lombok and the cities of Palu and Gorontalo used SiLPA least to finance budget expenditure. Each of
these five regions—with the sole exception of Gorontalo in 2008—consistently financed less than 5% of their budgets with SiLPA. Polewali Mandar and East Lombok achieved this outcome with good
budgetary planning: between 2007-09 the former collected 97%-101% of revenue targets—in both
APBD-Ms and APBD-Ps—and spent 94%-101% of both its original and revised expenditure targets; the
corresponding numbers for East Lombok were 97%-101% (revenue collected) and 95%-96% (expenditure achieved). By contrast, the low level of SiLPA in Sidenreng Rappang did not result from
effective budgeting but rather from failure to achieve both revenue and expenditure targets: during 2007-
09 the kabupaten collected only between 83% and 97% of projected revenue (at times when other kabupatens and cities were exceeding targets) and only expended between 83% and 88% of targeted
expenditure.
In the case of the five provincial governments studied, the proportion of expenditure financed by
SiLPA was quite substantial and tended to rise over the period studied. Thus the government of West
Java’s SiLPA contributed a ―mere‖ 13% to budget financing in 2007, but reached 30% by 2009. A
similar, less pronounced, increase occurred in East Java: rising from 16% in 2007 to 27% in 2009. In 2010 both these governments budgeted for lower levels of SiLPA—19% in West Java, 6% in East Java—
but these were planning figures only (the results of which were not available for this study). These large
budget surpluses resulted from underestimation of revenue at both the budget planning and budget revision stages: West Java’s budget income during 2007-09 was between 19% and 28% higher than
original APBD-M and revised APBD-P targets; and in East Java it exceeded targets by between 16% and

Analysis of Local Budgets: Study of Budgets for 2007-10
In 42 Kabupatens and Cities and 5 Provinces in Indonesia
27
38%. Both these provinces did relatively well on the expenditure side during 2007-09: they were
generally within 10% of APBD-M and APBD-P spending targets.
The government of West Nusa Tenggara (NTB) managed to keep its SiLPA at less than 8% for the
four years studied. In 2007 NTB’s realized budget income was a mere ±1% above or below APBD-M and APBD-P targets; and its expenditure was 96% of original APBD-M projections and 92% of revised
APBD-P targets. Thus only 7% of expenditure in 2008 was financed by SiLPA from 2007. The
provincial government maintained this relatively good record on revenue/expenditure levels in the
following years, making SiLPA a minor source of budget financing.
4.3 Analysis of Fiscal Space
In real terms, fiscal discretion or fiscal space13
of provincial, kabupaten and city governments declined
during the period studied. Although provinces’ fiscal space expanded, in nominal terms, by 5% in 2009
and 2% in 2010, it actually shrank in real terms: by 5% in 2009 and 3% in 2010. The situation was even worse for kabupaten/city governments: their fiscal space contracted constantly over the period—albeit
less in cities than in kabupatens—declining in cities by 9% in 2008 and a further 13% in 2009; and in
kabupatens by 13% in 2008 and a further 15% in 2009. The downward trend continued in 2010 at a slightly slower pace in the cities (down 9%) but more steeply in the kabupatens (down 18%).
Kabupatens and cities with large populations generally had more fiscal space than other areas studied (graph 4.8). The city of Surabaya had substantial funding available for discretionary spending: almost
Rp 2.2 trillion in 2009 (based on current prices). Kabupatens or cities with discretionary funds in excess
of Rp 250 billion invariably had populations above 900 000 people. By contrast, kabupatens or cities
with small populations had limited fiscal space. The exception was West Lombok. In 2009 it had only Rp 96 billion worth of fiscal space, despite its population of just 800 000.
Funds available to governments studied for discretionary spending varied enormously, from as little as 8% to as much as 67% of total revenue. In the cities of Pekalongan and Banjar and the kabupatens of
North Gorontalo and Padang Panjang fiscal space represented a substantial proportion of total revenue
(more than 42%), but the amounts of money involved were not large. By contrast, in the city of Surabaya fiscal space was large both in monetary value and as a proportion of total revenue (68%). It ranked ahead
of all other regions studied on both those counts, followed in second place by the city of Pekanbaru.
Graph 4.8 Kabupatens’ and Cities’ Fiscal Space in 2009 as a Proportion of Total Revenue
(This graph is available only in the Indonesian text of this publication)
Source: APBD-Rs for 2009, processed by the LBS team.
Among the 5 provincial governments studied, East Java and West Java outperformed the other three in
terms of fiscal space both in monetary terms and as a proportion of total revenue. In 2009 these two
most densely populated provinces had fiscal space at the provincial government level, valued at Rp 6.7 trillion—86%-87% of total revenue (at constant 2007 prices). The governments of South Sumatera and
Central Java had almost identical proportions of fiscal space: but South Sumatera’s amounted to 41% less
money than Central Java’s. West Nusa Tenggara had limited fiscal space: just Rp 815 billion (69% of
total revenue).
13
Fiscal space refers to the amount of funding (not part of earmarked expenditure programs) which is available to a government for spending at
its own discretion. Fiscal space is total revenue minus special purpose funding—DAK, grants, emergency funding, adjustment funding and
special autonomy funding – and non-discretionary expenditure (civil service costs and payment of interest on loans).

Analysis of Local Budgets: Study of Budgets for 2007-10
In 42 Kabupatens and Cities and 5 Provinces in Indonesia
28
5. Analysis of Local Infrastructure Budgets
Government has a very important role to play in the development of infrastructure; that in turn stimulates economic development and creates jobs for local people, thereby helping to reduce poverty. Good
infrastructure also encourages the involvement and growth of private enterprise. Accordingly, this study
looked not only at overall infrastructure expenditure but took a particularly close look at spending on
roads, bridges, irrigation and provision of clean water. Roads and bridges are especially important for development of local economies; they also have a huge impact on the accessibility of education and
health services. And, of course, the supply of clean water is critical for improved public health standards.
This chapter examines expenditure of various public agencies —different from region to region—that are
involved in infrastructure development. In some areas, public works departments were responsible for
roads, bridges, irrigation and the provision of clean water. In others, responsibility was shared variously between authorities responsible for roads and bridges, specific offices responsible for irrigation and water
resources and town planning bodies which looked after provision of clean water in urban areas.
5.1 Expenditure on Public Works
Expenditure on infrastructure14
by kabupaten and city governments15
was relatively low, but was quite high in the case of provincial governments. As a proportion of overall local budget expenditure, average
spending on infrastructure by kabupatens hovered around 12-13% of overall spending for the four years
studied (2007-10). Average expenditure in cities was slightly higher especially in 2009-10 when it
reached 15-17% of total spending. In the four provinces16
studied, average expenditure on infrastructure (18% of all expenditure in 2007) was higher than in kabupatens and cities, jumping sharply to 23% of
total spending in 2008 but declining in the following two years to 19% in 2010.
Graph 5.1 Average Expenditure on Public Works as a Percentage of Overall Expenditure of Kabupatens, Cities and Provinces, 2007-10
(This graph is available only in the Indonesian text of this publication)
Source: APBD-Rs for 2007-09 and APBD-Ms for 2010, processed by the LBS team.
The 40 kabupatens and cities17
studied for this part of our research spent between 5% and 25% of their
total budgets on infrastructure. Using average expenditure between 2007 and 2010 as a basis for
comparison, the city of Surakarta and the kabupatens of East Lombok, Garut and Sumedang consistently spent an average of just 5% or 6% of their total budget on infrastructure. In contrast, the city of Surabaya
and the kabupatens of Sidenreng Rappang, Wajo and North Aceh all spent an average of 24-25%. But
there were significant variations within this last mentioned group: in 2008 Wajo spent just 12% of its budget on infrastructure but planned to spend 47%in 2010; Surabaya too spent only 12% of its 2008
budget on infrastructure but increased its spending to 37% and 38% in 2009-10
Graph 5.2 Average Expenditure on Public Works as a Proportion of Total Kabupaten/City Expenditure, 2007-10
(This graph is available only in the Indonesian text of this publication)
Source: APBD-Rs for 2007-09 and APBD-Ms for 2010, processed by the LBS team.
14 If a particular area has more than one local office responsible for the three types of infrastructure being studied, the expenditure of those
various offices is aggregated for purposes of comparison with other areas. 15
This estimation is an average for the 20 kabupatens and 11 cities that had full sets of figures for infrastructure spending for the four years under
study. The following are not included: the kabupatens of North Aceh, Bojonegoro, Dompu, Garut, North Gorontalo and West Sumbawa and the
cities of Bandar Lampung, Banjar, Gorontalo, Palangka Raya and Surakarta. 16
West Java is not included, as data for 2007 was not available. 17
The Kabupaten of West Sumbawa and the city of Palangka Raya are not included in this part of the analysis because researches were unable to
obtain information on infrastructure spending for the 4 years studied.
Analysis of Local Budgets: Study of Budgets for 2007-10
In 42 Kabupatens and Cities and 5 Provinces in Indonesia
29
As for provincial governments, average expenditure on infrastructure was greater in South Sumatera
and Central Java than in the other three provinces. Over the four years studied, these two provinces spent an average of between 27% and 29% of their budgets on infrastructure but in each case actual
annual expenditure exceeded 30% in certain years (South Sumatera in 2007 and 2010 and Central Java in
2008 and 2009). By comparison, expenditure on infrastructure in the other three provinces tended to be
on the low side. West Nusa Tenggara spent a steady 16% or 17% of its annual budgets on infrastructure. West Java was the only provincial government to consistently increase its infrastructure spending: up
from 10% of its total budget in 2008 to 15% in 2010.
Graph 5.2 Average Expenditure on Public Works as a Proportion of Total Provincial Expenditure, 2007-10
(This graph is available only in the Indonesian text of this publication)
Source: APBD-Rs for 2007-09 and APBD-Ms for 2010, processed by the LBS team.
Expenditure on infrastructure by 23 kabupatens and cities during the 4 years studied remained steady
as a proportion of overall expenditure, but its monetary value trended downwards. Their average spending on infrastructure was Rp 81 billion in 2007 (constant 2007 prices), but fell during the next 3
years to Rp 64 billion in 2010. Expenditure in the kabupatens of Semarang and West Aceh and the city of
Palu fell most sharply: funding in 2010 was between 26% and 27% of 2007 allocations.
Graph 5.4 Expenditure on Public Works by Kabupaten/City, 2007-10, Based on Constant 2007 Prices
(This graph is available only in the Indonesian text of this publication)
Source: APBD-Rs for 2007-09 and APBD-Ms for 2010, processed by the LBS team.
Nevertheless, some areas achieved very marked increases in infrastructure expenditure. Thus in 2010
the city of Pekalongan and the kabupaten of Serdang Bedagai appropriated between 62% and 64% more funding for infrastructure than they had in 2007. The city of Parepare also consistently increased
infrastructure spending during the period: up from Rp 45 billion in 2007 to Rp 77 billion in 2010
(constant 2007 prices). Expenditure also rose sharply in Wajo: up from Rp 69 billion in 2007 and 2008 to Rp 95 billion in 2009 and Rp 197 billion in 2010.
On a proportional basis, infrastructure spending of the five provincial governments studied followed a fairly similar pattern: an increase in 2008 followed by declines in 2009 and 2010 (graph 5.5). The
government of West Java was something of an exception: it increased its appropriations each year
between 2008 and 2010—with its 2010 appropriations amounting to 89% more than those of 2008.
Central Java also managed to achieve a small overall increase, in real terms: its 2010 appropriations were 14% more than those of 2007. But, even so, Central Java’s level of infrastructure funding declined in
2009-10 after reaching a high point in 2008. Meanwhile, in South Sumatera and East Java, infrastructure
funding fluctuated (without major jumps or falls) and in West Nusa Tenggara funding levels were steady.
Graph 5.5 Expenditure on Public Works by Province, 2007-10, Based on Constant 2007 Prices
Source: APBD-Rs for 2007-09 and APBD-Ms for 2010, processed by the LBS team.
Note: Data on infrastructure expenditure in 2007 was not available in the case of West Java.
5.2 Direct and Indirect Expenditure on Public Works
Most expenditure on infrastructure took the form of direct (development-related) expenditure (BL), but
BL’s share of the expenditure cake declined over the four years studied (graph 5.6). BL was at its
highest in 9 cities studied18
: it reached 95% of total infrastructure spending in 2007 and, although
18
The cities of Bandar Lampung, Banjar, Blitar, Gorontalo, Palangka Raya, Surabaya and Surakarta are not included in this part of the analysis
because the unavailability of complete data for the four years studied.
Analysis of Local Budgets: Study of Budgets for 2007-10
In 42 Kabupatens and Cities and 5 Provinces in Indonesia
30
declining slightly, remained at 90% in 2010. There was a more pronounced slide in BL in the 19
kabupatens studied19
: from 91% of total infrastructure spending in 2007 to just 77% in 2010. On average, the four provincial governments—West Java in not included here—had lower levels of BL but
they did not decline much between 2007 and 2010.
Graph 5.6 Average Direct Expenditure as a Proportion of Overall Infrastructure Expenditure in Kabupatens, Cities and
Provinces 2007-10
(This graph is available only in the Indonesian text of this publication)
Source: APBD-Rs for 2007-09 and APBD-Ms for 2010, processed by the LBS team.
Direct (development-related) expenditure (BL) on infrastructure in the four kabupatens surveyed in West Nusa Tenggara was the lowest among 40 kabupatens and cities studied
20. BL constituted less
than 80% of infrastructure spending in Lombok, Dompu, Central Lombok and East Lombok. The
proportion of BL fluctuated quite markedly in West Lombok, Dompu and East Lombok: in West Lombok
from 88% in 2007 down to 52% in 2010; and in Dompu and Central Lombok from between 86% and 87% in 2007 to between 58% and 59% in 2010. But of all regions studied the kabupaten of Pekalongan
spent the lowest proportion of its infrastructure budget as BL (just 47% in 2010).
Graph 5.7 Average Direct Expenditure as a Proportion of Total public Works Expenditure in Kabupatens and Cities,
2007-10
(This graph is available only in the Indonesian text of this publication)
Source: APBD-Rs for 2007-09 and APBD-Ms for 2010, processed by the LBS team.
The cities Surabaya, Palembang, Pekanbaru, Parepare and Pontianak consistently spent over 95% of their infrastructure budget as direct expenditure (BL) during the four years studied. All these cities,
except for Palembang, spent an average of just over 13% of their total budgets on infrastructure.
Likewise, the kabupatens of North Gorontalo, Wajo and Bojonegoro had sizeable infrastructure budgets a high proportion of which was spent as BL.
The provincial governments of South Sumatera and West Java consistently spent in excess of 90% of
their annual infrastructure budgets as direct expenditure (BL) over the four years studied—more than the other three provinces could manage. East Java and Central Java spent the lowest proportions of their
infrastructure budgets as BL—just 73% in each case. West Nusa Tenggara’s BL on infrastructure trended
downwards from 85% of infrastructure funding in 2007 to between 76% and 78% in 2009 and 2010.
Graph 5.8 Average Direct Expenditure as a Proportion of Total Public Works Expenditure in the Provinces, 2007-10
(This graph is available only in the Indonesian text of this publication)
Source: APBD-Rs for 2007-09 and APBD-Ms for 2010, processed by the LBS team.
In 2009 infrastructure adjustment funding contributed a considerable amount to direct expenditure
(BL) on infrastructure in the kabupatens of Sleman, Bondowoso and Serdang Bedagai and the cities of
Palu, Semarang and Pontianak. Right from the time it was first introduced in 2008, adjustment funding has been playing an increasingly important role in regions, as is evident from the contribution it made to
BL on infrastructure in Sleman and Bondowoso. No less than 44% of Bondowoso’s BL on infrastructure
19
The kabupatens of North Aceh, Bojonegoro, Bondowoso, Dompu, Garut, North Gorantalo and West Sumbawa are not included here because
of the unavailability of complete data for the four years studied. 20
Data was not available for the cities of Palangka Raya and West Sumbawa.
Analysis of Local Budgets: Study of Budgets for 2007-10
In 42 Kabupatens and Cities and 5 Provinces in Indonesia
31
on roads, bridges and irrigation in the period studied was funded by the Fund for Stronger Fiscal
Decentralization and Accelerated Development (DPDFPPD)—Bondowoso did not receive adjustment funding for clean water resources. 26% of Sleman’s BL on infrastructure was similarly funded. The
other 4 regions referred to above also financed between 18 and 22% of their BL on infrastructure with
DPDFPPD funds. But this source of funding carried risks, because it lacked specific parameters and was
distributed in a way that could not be relied upon.
In 2009 West Lombok, Sleman, Aceh Besar and Bondowoso financed more than half of their direct
spending (BL) on infrastructure with Special Allocation Fund (DAK) or DPDFPPD adjustment transfers. While Sleman and Bondowoso received sizeable amounts of DPDFPPD funding in 2009, West
Lombok received no adjustment funding at all in that year. Nevertheless, West Lombok did receive
substantial levels of DAK funding. In fact it topped the list of 32 kabupatens and cities—for which data was available for this comparison—for funding BL on infrastructure with regional fiscal balance transfers
(dana perimbangan) or infrastructure adjustment grants (graph 5.9). In Aceh Besar, BL on
infrastructure was funded by both adjustment funding (10%) and DAK transfers (42%). But in both these
regions BL on infrastructure, in monetary terms, was quite low: just Rp 18.3 billion in West Lombok and Rp 35.9 billion in Aceh Besar. By comparison, average BL on infrastructure across the 32 regions
studied was Rp 122.1 billion per region (at constant 2009 prices).
Graph 5.9 Proportion of Total Public Works Expenditure in Kabupatens/Cities Funded by DAK and Adjustment
Funding, 2007-10
(This graph is available only in the Indonesian text of this publication)
Source: APBD-Rs for 2007-09, APBD-Ms for 2010 and DAK/DPDFPPD disbursements, processed by the LBS team.
5.3 Expenditure on Roads and Bridges
Of all the programs implemented by public works departments (or other local agencies responsible for
infrastructure) roads and bridges21
absorbed most of the direct expenditure (BL) on infrastructure in
kabupatens and cities studied. Taking the average of the 33 kabupatens and cities for which data was available, 49% of all BL on infrastructure was spent of roads and bridges. In fact, North Gorontalo and
Sleman spent more than 70% of their infrastructure BL on roads and bridges. The corresponding figure in
the kabupatens of Semarang, Kendal, Sidenreng Rappang and Situbondo and the cities of Blitar and
Banjar was 40%.
Graph 5.10 Average Proportion of Total Direct Public Works Expenditure Spent on Roads and Bridges in Kabupatens and Cities, 2007-10
(This graph is available only in the Indonesian text of this publication)
Source: APBD-Rs for 2007-09 and APBD-Ms for 2010, processed by the LBS team.
At the provincial government level, the average proportion of BL spent on roads and bridges trended downwards. In 2007 that proportion was 60% but fell to 47% in 2009. West Nusa Tenggara was the only
provincial government where the proportion of BL on roads and bridges rose: it reached 51% in 2009. By contrast it fell quite sharply in East Java (in 2009) and Central Java (during 2008-09).
21
The roads and bridges programs included in this analysis are for the most part: the Roads and Bridges Development Program, the Roads and
Bridges Rehabilitation/Maintenance Program, the Roads and Bridges Emergency Response Program and the roads and bridges portion of the
Village Infrastructure Development Program.

Analysis of Local Budgets: Study of Budgets for 2007-10
In 42 Kabupatens and Cities and 5 Provinces in Indonesia
32
Graph 5.11 Average Proportion of Direct Provincial Government Public Works Expenditure on Roads and Bridges, 2007-09
(This graph is available only in the Indonesian text of this publication)
Source: APBD-Rs for 2007-09 and APBD-Ms for 2010, processed by the LBS team. Note: date for West Java could not be accessed.
Graph 5.12 Average Expenditure per km on Roads and Bridges in the Kabupatens and Cities, 2007-10, Based on
Constant 2007 Prices
(This graph is available only in the Indonesian text of this publication)
Source: APBD-Rs for 2007-09, APBD-Ms for 2010 and the BPS’s ―Kabupatens/Cities in Figures‖, processed by the LBS team.
The level of expenditure per km on roads and bridges varied enormously among the kabupatens and
cities under study, but theoretically Wajo was the only area in a position to rehabilitate any of its
existing roads. In some areas with relatively few roads (below 600 km in total length)—such as Wajo,
Bojonegoro and the city of Pontianak—average annual expenditure on roads and bridges exceeded Rp 150 million/km. In fact Wajo spent an average of Rp 274m/km/year. But the bulk of the regions studied
allocated very low levels of funding for roads and bridges: on average, below Rp 50 million/km/year. For
example, East Lombok spent only Rp 11-12 billion (constant 2007 prices) on its 2 841 km of roads and
bridges over the 4 years studied—just Rp 5m/km/year. Still in West Nusa Tenggara, West Lombok’s budget for roads and bridges declined from Rp 19 billion in 2007 to just Rp 4 billion in 2010. Although
it only had 655 km of roads, West Lombok’s small budget meant that it had only Rp 15m/km/year to
spend on roads and bridges. On the basis of Ministry of Public Works estimates of funding required per km of road maintenance—Rp 1 billion/km every 3 to 5 years or Rp 200-333m/km/year—it emerges that,
theoretically, Wajo was the only region studied that had sufficient funds to maintain its existing roads. It
is, therefore, something of a vain hope to expect that kabupatens or cities can maintain the quality of their existing roads, let alone build new ones.
The provincial government of South Sumatera allocated more funding per km for roads and bridges than any of the other three provincial governments studied. With 3 039 km of roads under its charge,
the government of South Sumatera had a relatively substantial budget for roads and bridges. It was therefore able to allocate Rp 139m/km/year. This amount was far more than West Nusa Tenggara could
manage: on average, just Rp 28m/km/year over the period studied. Meanwhile, the two provincial
governments on Java for which data was available were pretty much on a par: East Java spent Rp 72m/km/year and Central Java Rp 82m/km/year.
Graph 5.13 Average Expenditure per km on Roads and Bridges in the Provinces, 2007-10, Based on Constant 2007 Prices
(This graph is available only in the Indonesian text of this publication)
Source: APBD-Rs for 2007-09, APBD-Ms for 2010 and the BPS’s ―Kabupaten/City in Figures‖, processed by the LBS team.
Graph 5.14 Proportion Contributed by DAK and Adjustment Funding to Expenditure on Roads and Bridges in Kabupatens and Cities, 2009
(This graph is available only in the Indonesian text of this publication)
Source: APBD-Rs for 2009 and Minister of Finance regulations on adjustment funding, processed by the LBS team.
In the case of 8 of the cities and kabupatens studied, more than 50% of funding for roads and bridges derived from Special Allocation Fund (DAK) transfers or adjustment funding. In 2009, the kabupatens
of West Lombok, Pekalongan and East Lombok, and the cities of Pekalongan and Surakarta got 60% of
their entire funding for roads and bridges from DAK transfers; but none of them received a single rupiah

Analysis of Local Budgets: Study of Budgets for 2007-10
In 42 Kabupatens and Cities and 5 Provinces in Indonesia
33
from infrastructure adjustment programs. By contrast, in the cities of Semarang and Pontianak,
adjustment funding (DPDFPPD for roads and bridges) contributed 52% and 39% respectively of total budgets for roads and bridges in 2009. Adjustment funding also made an important contribution (17%) to
Aceh Besar’s budget for roads and bridges.
5.4 Expenditure on Irrigation Programs
Although irrigation is very important for agriculture— an important source of income in most village areas— the sector attracted relatively low levels of funding. Our research showed that of the 32 areas
for which data was available, only four kabupatens—Sumedang, Serdang Bedagai, Cilicap and East Lombok— and one city (Blitar) allocated more than 20% of their direct expenditure (BL) on
infrastructure to irrigation programs. By contrast, Bojonegoro only allocated just 1% of its infrastructure
BL budget of Rp 155 billion (current 2009 prices) to support irrigation projects. North Gorontalo was
another kabupaten which spent less than 4% of its infrastructure BL on irrigation programs.
Graph 5.15 Average Proportion of Direct Public Works Expenditure Spent on Irrigation Programs in the Kabupatens and Cities, 2007-10
(This graph is available only in the Indonesian text of this publication)
Source: APBD-Rs for 2007-09 and APBD-Ms for 2010, processed by the LBS team.
Graph 5.16 Average Proportion of Direct Public Works Expenditure Spent on Irrigation Programs in the Provinces, 2007-10
(This graph is available only in the Indonesian text of this publication)
Source: APBD-Rs for 2007-09 and APBD-Ms for 2010, processed by the LBS team.
Although provincial governments have considerable responsibility in the irrigation sub-sector, the four
provinces studied—except for West Nusa Tenggara (NTB) — spent only modest amounts on irrigation.
NTB’s provincial government increased its expenditure on irrigation very significantly in 2008 and again
in 2009 to 30% of its infrastructure BL budget (graph 5.15). The governments of East Java and West Sumatera also increased spending on irrigation in 2009, but in both cases it remained below 15% of total
BL on public works. Central Java spent least on irrigation: just 2% of its infrastructure BL over the 3
years studied.
5.5 Expenditure on Clean Water
Expenditure on clean water programs was lower than in the other two sub-sectors studied. Even though the provision of clean water is very important for public health and community welfare, 30 cities and kabupatens studied spent an average of just 6% of their public works direct (development-related)
expenditure (BL) on water projects. Two of three kabupatens surveyed on the island of Lombok (West
Nusa Tenggara province)—West Lombok and East Lombok—allocated quite significant amounts (over 14% of their public works BL to water projects. The corresponding figure for the other kabupaten on
Lombok (Central Lombok) was just 5%. Given that several health indicators classify NTB as one of the
unhealthiest areas in Indonesia, West and East Lombok’s approach to water projects was headed in the
right direction. The cities of Blitar and Pekalongan and the kabupaten of Polewali Mandar also spent over 10% of their public works BL on clean water projects. But in several cities and kabupatens
expenditure on such projects fell below 3%.

Analysis of Local Budgets: Study of Budgets for 2007-10
In 42 Kabupatens and Cities and 5 Provinces in Indonesia
34
Graph 5.17 Average Proportion of Direct Public Works Expenditure Spent on Clean Water Programs in the
Kabupatens and Cities, 2007-10
(This graph is available only in the Indonesian text of this publication)
Source: APBD-Rs for 2007-09 and APBD-Ms for 2010, processed by the LBS team.
Even though, in reality, city and kabupaten governments are responsible for the provision of clean
water, South Sumatera’s provincial government appropriated quite considerable funding for fresh water programs: in 2009 as much as 6% of its direct public works expenditure. The governments of
West Nusa Tenggara and East Java also spent quite substantial amounts on clean water programs—3-4%
of their BL on infrastructure in 2009. But, in the same year, East Java allocated just 1% of its BL on public works to such programs.
Graph 5.18 Average Proportion of Direct Public Works Expenditure Spent on Clean Water Programs in the Provinces, 2007-10
(This graph is available only in the Indonesian text of this publication)
Source: APBD-Rs for 2007-09 and APBD-Ms for 2010, processed by the LBS team.
Analysis of Local Budgets: Study of Budgets for 2007-10
In 42 Kabupatens and Cities and 5 Provinces in Indonesia
35
6. Analysis of Education Budgets
Education is the only sector for which the level of budgetary funding—20% of all national, provincial, kabupaten and city budgets—is mandated by the Indonesian constitution. That mandate underlines the importance of education for achievement of our goals as a nation. It also underscores the importance of
education as a driving force behind economic development: not only statistical economic progress—
improved local GNP numbers—but also true social development measured against Indonesia’s
Millennium Development Goals (MDGs). At the micro level, education can also be relied upon to help communities lift income levels and improve quality of life—enabling them to defeat poverty.
6.1 General Analysis of Expenditure of Education Departments
Overall, kabupaten and city governments more than met their obligation to devote 20% of their budgets
to education. But, in the four provincial governments studied, less than 8% of budgetary resources
were spent on education. On average, 20 kabupatens22
and 9 cities23
surveyed spent very similar
proportions of their budgets on education (graph 6.1). Their average spending rose slightly from 33% of total budgets in all regions in 2007 to 36% (in cities) and 38% (in kabupatens) in 2010. By contrast,
provincial governments only spent an average of between 4% and 7% of their budgets on education
during that period. This situation was very much as it should have been, bearing in the mind the limited role provinces play in the education sector, compared to kabupatens and cities.
Graph 6.1 Average Expenditure of Education Departments as a Proportion of Kabupaten, City and Provincial Budgets, 2007-10
(This graph is available only in the Indonesian text of this publication)
Source: APBD-Rs for 2007-09 and APBD-Ms for 2010, processed by the LBS team.
Of 37 kabupatens and cities24
surveyed, 27 spent more than 30% of their budgets on education over the four years (2007-10), 9 spent between 20% and 30% and only one (the kabupaten of Bone) spent
less than 20%. Indeed, in some regions almost half of local budget resources were spent on education,
with Boyolali (in 2009) and East Lombok (in 2010) outstripping the others by spending 56%. By contrast,
in only one of the four years studied (2008) did Bone manage to spend 20% of its budget on education.
Four other areas, at various times, dropped below the 20% allocation level during the four years surveyed: the city of Banjar did so in 2007, as did the kabupaten of West Sumbawa (in 2010), the city of
Pekalongan (in 2010) and the kabupaten of Wajo (in 2007).
Graph 6.2 Average Expenditure by Education Departments as a Proportion of Kabupaten and City Budgets, 2007-10
(This graph is available only in the Indonesian text of this publication)
Source: APBD-Rs for 2007-09 and APBD-Ms for 2010, processed by the LBS team.
Graph 6.3 Average Expenditure of Education Departments as Proportion of Provincial Budgets, 2007-10
(This graph is available only in the Indonesian text of this publication)
Source: APBD-Rs for 2007-09 and APBD-Ms for 2010, processed by the LBS team.
22
The kabupatens of North Aceh, Bojonegoro, Bondowoso, Dompu, North Gorontalo and Sleman did not have complete data for the four budget
years under study and are thus not included in this part of our analysis. 23
The cities of Bandar Lampung, Banjar, Blitar, Gorontalo, Parepare, Surabaya and Surakarta did not have complete data for the four budget
years under study and are thus not included in this part of our analysis. 24
Data for 37 kabupatens and cities only could be accessed. The kabupaten of North Gorontalo and the cities of Bandar Lampung, Blitar,
Gorontalo and Parepare are not covered here.
Analysis of Local Budgets: Study of Budgets for 2007-10
In 42 Kabupatens and Cities and 5 Provinces in Indonesia
36
Except for South Sumatera, provincial governments did not spend a high proportion of their budgets
on education: as a proportion of its overall budget, South Sumatera’s spending on education trended upwards during 2007-10, reaching 17% in 2010. In comparison, the other provincial governments spent
around 3% or 4%, though Central Java’s spent somewhat more than that (graph 6.3).
Over the four fiscal years studied (2007-10), spending on education in regions surveyed increased not
only as a proportion of overall budgetary expenditure, but also in monetary value. In money terms, average expenditure on education in 29 kabupatens/cities increased by 20% between 2007 and 2010. The
biggest increase was in Pekalongan: Rp 173 billion in 2007 rising to Rp 267 billion in 2010 (based on
constant 2007 figures). Sizeable increases were also evident in East Lombok and the city of Padang, where spending was 40% higher in 2010 than in 2007.
Graph 6.4 Expenditure of Education Departments of Kabupatens and Cities, 2007-10, Based on Constant 2007 Prices
(This graph is available only in the Indonesian text of this publication)
Source: APBD-Rs for 2007-09 and APBD-Ms for 2010, processed by the LBS team.
The amount spent by South Sumatera’s provincial education department was far greater than in either
of the provincial governments on Java and veritably dwarfed expenditure by the government of West Nusa Tenggara (NTB) (graph 6.4). South Sumatera’s education budget rose substantially in 2009 and
2010: up from Rp 181 billion in 2008 to Rp 423 billion in 2010 (constant 2007 prices). South Sumatera’s
2010 number was almost double that of either Central or East Java’s provincial government. As for NTB, its education budget in 2007 was Rp 61 billion, falling sharply to a mere Rp 18.5 billion in each of the last
three years surveyed.
Graph 6.5 Average Expenditure of Education Departments of the Provinces, 2007-10, Based on Constant 2007 Prices
(This graph is available only in the Indonesian text of this publication)
Source: APBD-Rs for 2007-09 and APBD-Ms for 2010, processed by the LBS team.
As a proportion of local GDP, the kabupatens surveyed invested considerable amounts in their education sectors. In 2007, average allocations of 18 kabupatens studied represented 4% of local GDP.
The corresponding figure in 8 cities for which data was available was 3.5%. These numbers are quite
gratifying: westernized countries like Japan and the Scandinavians invest between 3% and 5.5% in their education sectors.
Of the five kabupatens surveyed in West Nusa Tenggara (NTB) all (except West Sumbawa) invested a relatively significant portion of their local GDP in education. As for West Sumbawa, in 2007, even though it had a much bigger economy—with a local GDP of Rp 12.7 trillion, four times greater than the
average of the other four—it only allocated Rp 71 billion or 1% of its local GDP to the education sector.
By contrast, in the same year (2007) Central Lombok, Dompu, East Lombok and West Lombok each
invested more than 5% of their local GDP in education. In fact, among the 30 sub-national governments studied, these four NTB kabupatens ranked among the top eight in terms of expenditure on education as a
percentage of local GDP (graph 6.6).
Large cities tended to spend a small proportion of their local GDP on education. Five of the eight cities studied—Pekanbaru, Pekalongan, Pontianak, Semarang and Palembang—spent less than 2.2% of local
GDP on education. But a small city like Padang Panjang invested as much as 9.1% of local GDP in the
education sector —the highest percentage among all the areas studied.

Analysis of Local Budgets: Study of Budgets for 2007-10
In 42 Kabupatens and Cities and 5 Provinces in Indonesia
37
Four provincial governments studied only spent an average of 0.1% of local GDP on education. Even though West Nusa Tenggara (NTB) spent more than the others, its 2007 expenditure represented a modest 0.18% of its local GDP of Rp 33.5 trillion. By comparison, East Java—with a local GDP 16 times greater
than NTB’s—only spent the equivalent of 0.03% of local GDP on education in the same year.
Graph 6.6 Expenditure of Kabupaten, City and Provincial Education Departments as a Proportion of Local GDP, 2007
(This graph is available only in the Indonesian text of this publication)
Source: APBD-Rs for 2007-09, APBD-Ms for 2010 and the BPS’s ―Kabupatens/Cities in Figures‖, processed by the LBS team.
6.2 Direct and Indirect Expenditure of Education Departments
In contrast to provincial governments, kabupaten and city governments spent a relatively small amount
of their education budgets on direct (development-related) expenditure (BL). In 2007 the 20
kabupatens surveyed only spent 22% of their education budgets as BL, with the remaining 78% being spent on civil service salaries; but that proportion fell to just 15% by 2010. A similar trend, albeit at a
slightly higher level, was evident in 9 cities studied: They spent 28% of their education budgets as BL in
2007, falling to 19% in 2010. By contrast, provincial governments spent the bulk of their education budgets as BL: 86% in 2007—leaving just 14% for indirect expenditure—and 74% in 2009 and 2010.
Graph 6.7 Average Proportion of Education Departmental Budgets of Kabupaten, City and Provincial Governments Spent as Indirect Expenditure, 2007-10
(This graph is available only in the Indonesian text of this publication)
Source: APBD-Rs for 2007-09 and APBD-Ms for 2010, processed by the LBS team.
Direct expenditure (BL) decreased, as a proportion of the education budget, in the case of West Nusa
Tenggara (NTB)’s provincial government, but remained steady in the other three provincial
governments. Over the period studied, the proportion of NTB government BL spent on education fell
from 87% in 2007 to just 40% in 2010. The other three provincial governments spent an average of 84% of their education budget as BL throughout the four years studied.
Graph 6.8 Proportion of Education Budgets of Provinces Spent as Indirect Expenditure, 2007-10
(This graph is available only in the Indonesian text of this publication)
Source: APBD-Rs for 2007-09 and APBD-Ms for 2010, processed by the LBS team.
Only 7 of the kabupatens and cities studied—located mainly outside Java—spent an average of more
than 30% of their education budgets as direct expenditure (BL) during 2007-10. Of all the places surveyed on Java, the ―batik city‖ of Pekalongan spent the greatest proportion of its education budget as
BL: an average of 38% over the period, but down to 19% in 2010. Of 37 areas covered by our study, the
kabupatens of Bone and Wajo in South Sulawesi spent the greatest proportion of their education budgets as BL: an average of more than 40% over the period. Indeed, in 2010, Bone appropriated as much as
61% of its education budget for BL programs. Four other areas also spent high proportions of education
funds as BL: West Sumbawa and Dompu (both on Sumbawa Island, West Nusa Tenggara) and the cities of Pekanbaru and Padang Panjang (on Sumatera).
Graph 6.9 Average Proportion of Education Budgets of Kabupatens and Cities Spent as Indirect Expenditure, 2007-10
(This graph is available only in the Indonesian text of this publication)
Source: APBD-Rs for 2007-09 and APBD-Ms for 2010, processed by the LBS team.

Analysis of Local Budgets: Study of Budgets for 2007-10
In 42 Kabupatens and Cities and 5 Provinces in Indonesia
38
By contrast, several areas spent less than 10% of their education budgets on direct expenditure (BL) programs. Such was the situation in the city of Padang and the kabupaten of Garut especially in the last two years surveyed: in 2007-08, they managed to spend 13% of their education funds on BL programs,
but in 2009 and 2010 the proportion was just 5%. Sleman also consistently allocated no more than
between 4% and 8% of its education budget for BL programs. The kabupatens of North Aceh,
Sumedang, Boyolali, Malang and Situbondo and the city of Surakarta also appropriated less than 5% of their education budgets for BL programs, most notably in 2010. This may have been because central
government transfers earmarked for BL were not available for inclusion in original 2010 budgets (APBD-
Ms)—one of the documents used in this part of our analysis.
6.3 Ratio Between Education Expenditure and Pupil/Teacher Numbers
The ratio between expenditure on education and the number of primary and junior secondary teachers
tended to be higher in cities than in kabupatens. On average, city governments surveyed—except for Surakarta, Pekanbaru and Pekalongan—appropriated Rp 23.3 m/teacher/year as indirect expenditure
(BTL) on education. That number was higher than average expenditure in all 36 kabupatens and cities
studied. Indeed in five cities—Palembang, Pontianak, Palangka Raya and Padang Panjang—BTL was higher still: Rp 30 m/teacher/year or Rp 2.4 m/teacher/month. By contrast in two kabupatens in South
Sulawesi—Wajo and Bone—BTL on education was less than Rp 10 m/teacher/year, probably because of
large numbers of non-civil service teachers in those areas.
Graph 6.10 Total Teachers and Average Level of Indirect Expenditure of Education Budgets Per Teacher, 2007-10,
Based on Constant 2007 Prices
(This graph is available only in the Indonesian text of this publication)
Source: APBD-Rs for 2007-09, APBD-Ms for 2010 and Education Statistics (Ministry of National Education) processed by the LBS team.
In 30 of the 37 kabupatens and cities studied the ratio between direct education spending and the student population was less than Rp 1 m/student/year (graph 6.11). Indeed, in the kabupatens of
Malang, Cilicap and Garut (all with large pupil populations) and Sleman (which has relatively few pupils), the ratio between direct expenditure (BL) and pupil numbers over the four years studied was only
Rp 250 000/pupil/year or a mere Rp 21 000/pupil/month. The city of Padang Panjang, however,— with
just 8 500 pupils in primary/junior high school—managed to appropriate BL of Rp 2.8 m/pupil/year. Six
other regions with relatively small pupil populations—the kabupatens of West Sumbawa and North Aceh and the cities Pekanbaru, Palangka Raya, Pontianak and Pekalongan—had BL appropriation levels of
between Rp1 m and Rp 1.8 m/pupil/year.
Graph 6.11 Ratio between Student Numbers and Levels of Direct Education Expenditure, 2007-10, Based on Constant
2007 Prices
(This graph is available only in the Indonesian text of this publication)
Source: APBD-Rs for 2007-09, APBD-Ms for 2010 and Education Statistics (Ministry of National Education), processed by the LBS team.
6.4 Programs Supporting Increased School Participation Rates
On average about 50% of direct education expenditure (BL) in the regions studied was spent in support
of the national program to increase participation rates (APS) in 9 years of obligatory basic education,
but such expenditure declined between 2007 and 2010. In 19 of the 31 kabupatens and cities surveyed the percentage was in fact between 56% and 59% in 2007 and 2008. But it fell to 51% in 2009 and 48%
in 2010.

Analysis of Local Budgets: Study of Budgets for 2007-10
In 42 Kabupatens and Cities and 5 Provinces in Indonesia
39
Graph 6.12 Average Proportion of Kabupaten/City Direct Expenditure on 9 Year Obligatory Education Program, 2007-2010
(This graph is available only in the Indonesian text of this publication)
Source: APBD-Rs for 2007-09 and APBD-Ms for 2010, processed by the LBS team.
The level of funding committed by governments studied to supporting the 9 Years of Obligatory
Education Program varied enormously— between the extremes of 15% and 84% (graph 6.12). On one
hand, four regions in South Sulawesi—the kabupatens of Polewali Mandar, Bone and Sidenreng Rappang and the city of Palu—spent an average of 70% of their education direct expenditure (BL) in support of the
program between 2007 and 2010. On the other hand, the kabupaten of Sumedang and the cities of
Pekanbaru and Palembang supported it with a mere 15-25% of their BL on education.
75% of the money spent by regions surveyed in support of the 9 Years of Obligatory Basic Education
program went towards infrastructure. Only three regions—the cities of Surabaya and Semarang and the
kabupaten of Aceh Besar—spent more than 50% of the money dedicated to supporting the obligatory education program in areas other than infrastructure. But eight regions—the kabupatens of Polewali
Mandar, Sumedang, Situbondo, Serdang Bedagai and Cilicap, and the cities of Surakarta, Pontianak and
Padang Panjang—spent 85% of their support for the program on infrastructure.
Graph 6.13 Average Proportion of Kabupaten/City Direct Education Expenditure on Infrastructure in Support of 9 Years of Obligatory Basic Schooling and Classroom/Pupil Ratios, 2007-10
(This graph is available only in the Indonesian text of this publication)
Source: APBD-Rs for 2007-09, APBD-Ms for 2010 and Education Statistics (Ministry of National Education), processed by the LBS
An examination of the pupil per classroom ratio in the areas studied indicated that most of the kabupatens and cities surveyed did not need to construct new classrooms (graph 6.13). The ratio of 40
or more pupils per class occurred in only a few areas—the kabupatens of Malang and Sidenreng Rappang
and the cities of Pekanbaru, Palembang and Surabaya. Ministry of National Education data indicated that, on average in the 42 kabupatens and cities studied, 32% of existing classrooms were either slightly or
seriously damaged. Despite these numbers, appropriations for education infrastructure in the city of
Surabaya and the kabupaten of Sidenreng Rappang, for example, were low compared to other regions.
6.5 Programs Supporting Better Quality Education
Data from the Ministry of National Education indicates that the majority of teachers and school
principals in Indonesia are not fit to teach. 79% of Indonesia’s 1.3 million state primary school
teachers fall into the ―unfit to teach‖ category; and 27% of the country’s 421 000 state junior high school teachers are in the same category. These figures underline how important it is that local governments,
responsible for education at the primary and junior high school levels, give priority to improving the
quality of teachers.
Graph 6.14 Average Proportion of Kabupaten/City Direct Education Expenditure on Better Quality Education programs,
2007-10
(This graph is available only in the Indonesian text of this publication)
Source: APBD-Rs for 2007-09 and APBD-Ms for 2010, processed by the LBS team.
Only a few of the regions surveyed appropriated meaningful levels of funding for programs aimed at
improving the quality of primary and junior high school teachers. Of the 33 regions for which data was available for this analysis, just 24%—five cities: Surakarta, Padang Panjang, Pekalongan, Surabaya and
Palembang and three kabupatens: Serdang Bedagai, Central Lombok and Dompu—appropriated more

Analysis of Local Budgets: Study of Budgets for 2007-10
In 42 Kabupatens and Cities and 5 Provinces in Indonesia
40
than 9% of their direct education expenditure for programs to improve the quality of teachers. All the
other regions spent very little in this important area.
6.6 Programs Supporting Non-Formal Education
Funding for non-formal education was at the same low level as for programs to improve teacher
quality. But, of course, non-formal education plays an important role in enhancing the skills needed by
the formally uneducated to help them to find work—an important step towards overcoming poverty. On average, 31 kabupatens and cities, for which data was available for this analysis, spent a mere 1.3% of
their education BL in support of non-formal education. Of all the regions, Aceh Besar spent most—±5%
of education BL—while 25 other regions put aside just 2% for the purpose.
Graph 6.15 Average Proportion of Kabupaten/City Direct Education Expenditure on Non-Formal Education, 2007-10
(This graph is available only in the Indonesian text of this publication)
Source: APBD-Rs for 2007-09 and APBD-Ms for 2010, processed by the LBS team.
Analysis of Local Budgets: Study of Budgets for 2007-10
In 42 Kabupatens and Cities and 5 Provinces in Indonesia
41
7. Analysis of Health Budgets
The health sector is very important and has a significant impact on the quality of people’s lives. Government plays a critical role in the health sector, especially in the case of the poor and of people who
live in areas with minimal private health services. It is very important, therefore, to examine Indonesian
local government health budgets to establish their level of commitment to health funding; and to ascertain
where the funding is coming from and how it is being spent. Given that the data available for this study was limited, in terms of both quantity and quality, this chapter focuses on two representative elements of
the health sector: local government-funded health services and local government hospitals.
7.1 Analysis of Expenditure on Health
On average, provincial governments surveyed spent more of their budgets on health services and
hospitals that did kabupatens and cities. Average provincial government spending in these areas rose in
the last 3 of the 4 years studied from 9.1% of total budgetary spending in 2008 to 12.2% in 2010. This
was more than kabupatens could manage: they spent an average of 9.6% of total budgets in 2007, rising to 10.3% in 2010. City governments, on the other hand, spent less than both provinces and kabupatens: a
steady average of 8% in each of the four years studied. Law No. 39/2009 on health stipulates that a
minimum of 10% of local budgets (excluding expenditure on civil service salaries) should be spent on health services and hospitals. Provincial and kabupaten governments managed to achieve that percentage
and thus, on average, satisfied formal legal requirements.
Graph 7.1 Average Proportion of Budgets Spent on Health Services and Hospitals By Kabupatens, Cities and Provinces, 2007-10
(This graph is available only in the Indonesian text of this publication)
Source: APBD-Rs for 2007-09 and APBD-Ms for 2010 for 21 kabupatens, 11 cities and 5 provinces, processed by the LBS team.
Note: The proportion of provincial spending for 2007 is based on information from 3 provinces, while for 2008-10 it is based on data for 4
provinces.
The 32 kabupatens and cities studied allocated an average of 9% of their total budgets to health services and hospitals during the 4 years studied. But in fact only 14 regions actually achieved the 9%
figure; the other 18 did not manage to do so. Two kabupatens performed best: Pekalongan (with 15%)
and Semarang (13%). The cities of Padang and Surabaya performed worst with 6%. A look at graph 7.2
shows that four governments—the kabupatens of Pekalongan and Semarang and the cities of Pekalongan and Padang Panjang—at some point in the four year period studied, spent more the 15% of their budgets
on health services and hospitals; but six kabupatens/cities did not at any time over the same period spend
more that 8% of their budgets in these areas.
Graph 7.2 Proportion of Budgets Spent on Health Services and Hospitals By Kabupatens and Cities, 2007-10
(This graph is available only in the Indonesian text of this publication)
Source: APBD-Rs for 2007-09 and APBD-Ms for several areas, processed by the LBS team.
Graph 7.3 Average Proportion of Budgets Spent on Health Services and Hospitals By 5 Provinces Over Past 4 Years, 2007-10
(This graph is available only in the Indonesian text of this publication)
Source: APBD-Rs for 2007-09 and APBD-Ms for 2010 for several areas, processed by the LBS team.
Analysis of Local Budgets: Study of Budgets for 2007-10
In 42 Kabupatens and Cities and 5 Provinces in Indonesia
42
In general, provincial governments studied (except for West Nusa Tenggara (NTB)) steadily increased
the proportion of their overall budgets spent on health services and hospitals during 2007-10 (graph 7.3). In 2008 the government of South Sumatera spent less than the other three provinces on these
programs (just 5% of its total budget), but managed to lift its performance in each subsequent year by
around 4% to 12% in 2010. By comparison, Central Java appropriated a relatively high proportion (11%)
of its total budget for health services and hospitals in 2008, and managed to increase the amount by 2% in both 2009 and 2010 (when it reached 15%). East Java dramatically increased its spending on health
services and hospitals in 2010 to 19% of its entire budget. These numbers show that in 2010 these three
provinces satisfied the 10% spending requirement in law No. 36/2009. As for NTB, the drop in the proportion of its budget dedicated to health services and hospitals to just 2% in 2010 might have resulted
from classification of health sector expenditure (in the form of financial assistance and grants) as
―transfers‖.
Most of the 32 kabupatens and cities studied increased the monetary value of their expenditure on
health services and hospitals during the period under study. Only 9 spent less on health in 2010 than
they had in 2007. The biggest decrease was in the city of Palangka Raya: down from Rp 37 billion in 2007 to Rp 27 billion in 2010. The biggest increase was in the city of Surabaya: up by 40% in real terms
between 2007 and 2010.
There was no direct correlation between total amounts spent on health services and hospitals and per
capita rates of expenditure. Thus, in real terms, the city of Pandang Panjang spent less than any other
region studied but had a per capita expenditure rate that surpassed all the others. Conversely, although Surabaya spent very large amounts on health services and hospitals, on a per capita basis it only spent the
average of the regions studied. All this goes to show that, when population size is factored in, a high
level of expenditure does not necessarily mean that people’s health needs are being met.
Graph 7.4 Total Expenditure on Health Services and Hospitals by Kabupatens and Cities (2007-10) and Per Capita
Expenditure
(This graph is available only in the Indonesian text of this publication)
Source: APBD-Rs for 2007-09 and APBD-Ms for 2010 for several areas, processed by the LBS team.
7.2 Direct and Indirect Expenditure on Health Services and Hospitals
The proportion of provincial government direct (development-related) expenditure (BL) on health
services and hospitals increased over the period but declined in kabupatens and cities. Taking the average of the four provinces studied, their proportion of BL dropped slightly in 2009, but rose in both
2008 (to 68%) and in 2010 (71%). Although not so significant, this increase was a better outcome than in
the kabupatens and cities surveyed: there, BL on health services and hospitals declined from 2008 onwards. This decline reflected an increase in indirect (routine administrative) expenditure (BTL) on
civil servants. On one hand, such a change can be a good if it means more money is being spent on
medical staff (doctors, midwives and the like), but, on the other, if spent on civil service administrative
staff, it can have a bad effect on the quantity and quality of health service delivery.
Graph 7.5 Proportion of Direct Expenditure on Health Services and Hospitals by Category of Local Government (2007-10)
(This graph is available only in the Indonesian text of this publication)
Source: APBD-Rs for 2007-09 and APBD-Ms for 2010, processed by the LBS team.
Kabupatens and cities studied varied greatly in terms of the proportion of their health budgets spent on
direct (development-related) expenditure (BL). Average BL among kabupatens/cities on health services

Analysis of Local Budgets: Study of Budgets for 2007-10
In 42 Kabupatens and Cities and 5 Provinces in Indonesia
43
and hospitals varied hugely from one to the other between 2007 and 2010. Thus, the kabupaten of
Pekalongan spent more than 70% of its health BL on those programs, whereas the city of Pekanbaru could only manage to apportion 31%. An examination of the annual BL health allocations indicates that one
city (Pekalongan) at one point topped 90%, whereas four other kabupatens/cities never did better than
50%.
Graph 7.6 Proportion of Direct Expenditure on Health Services and Hospitals by Kabupatens and Cities, 2007-10
(This graph is available only in the Indonesian text of this publication)
Source: APBD-Rs for 2007-09 and APBD-Ms for 2010, processed by the LBS team.
The amount a region spent as indirect (routine administrative) expenditure (BTL) did not always mean that it had a satisfactory ratio between medical staff and population. Several kabupatens/cities
appropriated more than 50% of their health services and hospitals budget for BTL programs, but still had
only 3 health sector staff per 1 000 people. But in some areas—such as North Aceh, West Aceh, Aceh Besar and the city of Pekanbaru—increased BTL did mean more medical staff per capita. The situation in
Parepare was particularly interesting. Although it spent less than 40% of its health budget on BTL
programs, it managed to have 5 health sector workers per 1 000 people. These comparisons show how
BTL can best be used: to reinforce the number of operational medical staff.
Graph 7.7 Proportion of Indirect Expenditure on Health Services and Hospitals and Number of Medical Staff per capita, 2008
(This graph is available only in the Indonesian text of this publication)
Although health fees and charges remained an important source of local own-source revenue (PAD)
for the 19 kabupatens studied, their contribution to kabupaten revenue declined over the period
studied. But in the 10 cities surveyed the opposite trend was in evidence. In 2007 the contribution of
health fees and charges to city revenue (10%) was less than for kabupatens (19%). But by 2010 health fees and charges were contributing less of kabupatens’ PAD (16%), but more for city governments (15%).
Graph 7.8 Health Fees and Charges as a Proportion of Local Own-Source Revenue (PAD), 2007-10
(This graph is available only in the Indonesian text of this publication)
Special central government fiscal transfers to kabupatens/cities to supplement direct (development-
related) expenditure (BL) on health services and hospitals declined slightly during the period studied.
Included among such transfers were: Special Allocation Fund (DAK) and infrastructure adjustment
funding earmarked for health programs. Apart from these special transfers, regions also received transfers from the General Allocation Fund (DAU) and Revenue Sharing Fund (DBH) which could be spent at the
discretion of regional governments, subject to planning and budgetary processes. And of course there
was also local own-source revenue (PAD). On average, patterns of health expenditure indicated that the level of special central government transfers for health services and hospitals declined slightly between
2007 and 2010.
Graph 7.9 Contribution of Central Government Special Health Transfers to Direct Expenditure on Health Services &
Hospitals
(This graph is available only in the Indonesian text of this publication)
Source: APBD-Rs for 2007-09 and APBD-Ms for 2010, processed by the LBS (?? Corrected original’s ―2008‖ to read 2007)
Note: ―Special health transfers‖ are program funding from such sources as the DAK and the infrastructure adjustment fund whose use is
determined by the central government.

Analysis of Local Budgets: Study of Budgets for 2007-10
In 42 Kabupatens and Cities and 5 Provinces in Indonesia
44
7.3 Health Services and Hospital Programs Involving Direct Expenditure
In general, more than 90% of direct (development-related) expenditure (BL) on health by
health departments and hospitals was spent on administration, health care equipment and
mandatory curative health programs. Even though, on average, the proportion of local health
departments’ and hospitals’ spending on administration and health care equipment declined over
the last 3 years studied (2008-10), it ended up still being 15% of their budgets. At the same time,
expenditure on mandatory curative health programs, although on the increase, constituted less
than 85% of BL on health. Most of that 85% was used to upgrade and maintain health facilities;
to procure medicines and health supplies; and to operate community health service clinics:
puskesmas and posyandu, in particular. But, for all that, average BL spent on community health
programs was very limited: less than 2% was spent on improved public nutrition levels,
preventive medical care for young children, improved community health, care of birthing
mothers and newborns and other preventive or advisory health services.
Table 7.1 Break-down of Programs Funded by Regional Health Departments and Hospitals, 2008-10
Average Value
PROGRA
M
2008 2009 2010 Rp Million % Rp Million % Rp Million %
Administrative and Bureaucratic Programs (Codes< 15) 5 597 19.8% 5 545 17.0% 5,353 15.7%
Obligatory Health Programs (Codes > 15) 22 700 80.2% 27 081 83.0% 28 748 84.3%
Community Health Drives 5 059 17.9% 6 623 20.3% 8 153 23.9%
Medicines and Pharmaceutical Items 3 348 11.8% 2 604 8.0% 7 331 21.5%
Oversight Control of Medications and Food 59 0.2% 40 0.1% 36 0.1%
Promotion of Community Health 253 0.9% 274 0.8% 776 2.3%
Improvement of Community Nutrition 316 1.1% 339 1.0% 345 1.0%
Development of Healthy Living Environments 238 0.8% 202 0.6% 140 0.4%
Prevention and Control of Infectious Diseases 706 2.5% 649 2.0% 598 1.8%
Standardization of Health Services 306 1.1% 534 1.6% 200 0.6%
Health Services for the Poor 145 0.5% 1 052 3.2% 1 300 3.8%
Supply/Enhancement of Health Infrastructure/Facilities 5 984 21.1% 7 409 22.7% 3 396 10.0%
Supply/Enhancement of Hospital Infrastructure/Facilities 5 770 20.4% 6 816 20.9% 5 665 16.6%
Hospital Care and Maintenance 308 1.1% 334 1.0% 467 1.4%
Oversight and Control of Foodstuffs 10 0.0% 5 0.0% 11 0.0%
Improved Health for Children under 5 yrs 37 0.1% 13 0.0% 51 0.1%
Improved Health Service Delivery for the Aged 17 0.1% 12 0.0% 16 0.0%
Improved Safety Standards for Birthing Mothers/Babies 101 0.4% 82 0.3% 82 0.2%
Partnership for Improved Health Service Delivery 43 0.2% 92 0.3% 181 0.5%
Totals 28 297 100.0% 32 626 100.0% 34 100 100.0%
On average, all kabupatens and cities studied, except for the cities of Parepare and Banjar, spent less
on caring for birthing mothers and infants than Bappenas’ minimum benchmark of Rp 65 000/person. The health of birthing mothers and newborns remains one of Indonesia’s most pressing health issues at
the sub-national level. But local governments studied were often not giving the problem the attention it deserved. Of 34 kabupatens and cities for which statistical data was available, 32 spent less than Rp 46
000/person on securing the health of birthing mothers and newborns: considerably less than the Bappenas
benchmark. Indeed, in Kendal, only Rp 2 000/person/year was appropriated for such programs: clearly

Analysis of Local Budgets: Study of Budgets for 2007-10
In 42 Kabupatens and Cities and 5 Provinces in Indonesia
45
unsatisfactory, particularly if the area concerned faces serious issues in regard to birthing mothers and
newborns.
Graph 7.10 Per Capita Expenditure on Birthing Mothers and Babies Health Programs
(This graph is available only in the Indonesian text of this publication)

Analysis of Local Budgets: Study of Budgets for 2007-10
In 42 Kabupatens and Cities and 5 Provinces in Indonesia
46
8. Analysis of Budgets for Womens Empowerment
The establishment of offices for womens empowerment in every local government area in Indonesia is
part of the drive, mandated in Presidential Instruction No. 9/2000 and Government Regulation No.
41/2007, to accelerate the process of gender mainstreaming (PUG for short in Indonesian) throughout Indonesia; and to encourage development of gender-responsive policies in every area of economic
development.
8.1 Institutional & Budgetary Support for Womens Empowerment and PUG
The 2010 study of Performance in Management of Local Budgets (KIPAD) found that only 23 of 42
kabupatens and cities studied had established PUG work units. Only one of the 23, Serdang Bedagai,
had set up all three of the institutional units required by government decree: a working group (Pokja for
short in Indonesian), a gender mainstreaming focal point (PUG focal point, for short) and a gender responsiveness analysis team (ARG for short). 14 others had established two of the three: most opted for
Pokjas, except for Situbondo and West Lombok which formed both Pokjas and ARGs. The other 8 had
established just one of the three: opting for either a Pokja or a PUG focal point.
Graph 8.1 Progress Made in Establishing Gender Mainstreaming Offices
(This graph is available only in the Indonesian text of this publication)
The five provincial governments surveyed spent considerably more than kabupatens/cities on womens empowerment and PUG programs. In terms of aggregate spending over the 4 years studied (2007-10), the provincial government of West Java spent most on these programs—a total of Rp 16.4 billion; and
West Nusa Tenggara spent least—Rp 2.3 billion.
Graph 8.2 Total Value of Provincial Expenditure on Womens Empowerment and PUG Programs, 2007-2010 (Rp billion),
Based on Constant 2007 Prices
Although the kabupatens and cities studied all formed womens empowerment work units, they allocated only limited funding to PUG programs (graph 8.3). Only 16 regions—just 42% of those studied—allocated more than Rp 1 billion in aggregate—an average of just Rp 250 m/year—to such
programs between 2007 and 2010. Only the cities of Surabaya and Surakarta (both on Java) appropriated
reasonably sizeable amounts to such programs over the period studied: Rp 7.7 billion (Surabaya) and Rp 5.4 billion (Surakarta). By contrast, Bojonegoro, East Lombok and Central Lombok spent least: less than
Rp 140 million in total over 4 years. Generally speaking, regions with womens empowerment work units
in place allocated an average of 50% more for womens empowerment programs than those without them.
Graph 8.3 Aggregate Expenditure on Womens Empowerment and PUG Programs, by Kabupatens/Cities, 2007-10 (Rp m)
Based on Constant 2007 Prices
(This graph is available only in the Indonesian text of this publication)
Source: APBD-Rs for 2007-09 and APBD-Ms for 2010, processed by the LBS team.
8.2 Programs Supporting Offices for Gender Mainstreaming (PUG), Womens
Empowerment and Child Protection
Overall, four programs fall into the above category: (i) programs to strengthen
institutionalization of PUG and protection of children; (ii) programs to harmonize policies to

Analysis of Local Budgets: Study of Budgets for 2007-10
In 42 Kabupatens and Cities and 5 Provinces in Indonesia
47
enhance capabilities of women and children; (iii) programs promoting PUG and child protection;
and (iv) programs of policies aimed at enhancing capabilities of women and children.
Graph 8.4 Appropriations for Programs Supporting PUG Work Units, 2007-10 (Rp billion), Based on Constant 2007 Prices
(This graph is available only in the Indonesian text of this publication)
Source: APBD-Rs for 2007-09 and APBD-Ms for 2010, processed by the LBS team.
Eight regions consistently allocated funding in support of programs to strengthen institutional support for gender mainstreaming (PUG) (graph 8.4). The city of Surakarta allocated most of all: Rp 2 billion
in 2008, but less in the following two years. Two provincial governments (Central Java and South
Sumatera) spent progressively more in these areas over the 4 years (2007-10), but Central Java’s level of spending far exceeded that of South Sumatera.
The City of Surakarta’s performance in this area was notable in several respects. In 2008-09, the city government spent Rp 2.1 billion on a program of capacity building and development of institutional support for empowerment of women and children; between 2008 and 2010 it developed a database on
women and children; and over the period 2007-2009 it conducted a public awareness campaign on health,
gender issues, womens empowerment and the protection of children.
Central Java’s provincial government used its funding to put in place several local government regulations. In 2009 it promulgated local regulation No.3/2009 on Providing Support for the Victims of
Gender-based Violence; in 2010 it commissioned an academic study in preparation for drafting a local
regulation on the protection of children; and submitted the completed study to the local legislative assembly (DPRD) for discussion. And, over three budget years (2008-10), it developed a database on
gender issues, conducted capacity building programs and formed a network of PUG-related community
linkages.
21 kabupatens and cities and 3 provincial governments studied set up “integrated service centers for womens empowerment”. The first regions to do so (in 2007) were West Aceh, Aceh Besar, Cilicap,
Semarang, Bone and Polewali Mandar and the cities of Pekalongan and Surakarta. Other areas followed
their lead in 2008-09: Serdang Bedagai and the city of Surabaya in 2008 and Sumedang, Boyolali, Pekalongan and the city of Parepare in 2009. The remainder—Central Lombok and the cities of
Palembang, Banjar, Semarang and Blitar—followed suit in 2010. At the provincial level, the
governments of East Java, Central Java and South Sumatera also dedicated funds to the establishment of such offices.
8.3 Programs Supporting Enhanced Womens Participation in Development
Two programs fall into this category: (i) Increasing the participation of women and the level of gender equality in development; and (ii) Enhancing the role of women in village areas.
Six regions consistently appropriated funding for programs to enhance womens participation in development. The city of Surabaya and the kabupatens of Pekalongan and Aceh Besar consistently
funded such programs with higher levels of funding each year. By contrast, Situbondo and the city of Palu
spent less and less on these programs over the four years studied. At the provincial level, the government
of South Sumatera was alone in showing any meaningful budgetary commitment to enhanced womens participation programs.
Analysis of Local Budgets: Study of Budgets for 2007-10
In 42 Kabupatens and Cities and 5 Provinces in Indonesia
48
The city of Pekalongan’s main activities in this area were education and training for womens groups. It conducted two separate training programs—albeit with limited annual funding (below Rp 50 million (current prices) for each)—throughout the four years studied: one on enhanced female participation and
gender equality in development and the other on improved business management techniques for women.
It also invested Rp 200 million each year (current prices) in capacity building and performance
enhancement programs for womens groups.
Graph 8.5 Appropriations for Programs Supporting Enhanced Womens Participation, 2007-10 (Constant 2007 Prices)
(This graph is available only in the Indonesian text of this publication)
Source: APBD-Rs for 2007-09 and APBD-Ms for 2010, processed by the LBS team.
Several areas began to make moves, albeit modest ones, to encourage females to participate more
actively and take up positions in politics and public office. In 2007-08 the city of Surakarta funded the
development of a policy framework in precisely this area; and Garut and Wajo and the provincial government of Central Java did likewise in 2009-10. In 2009 West Java funded the establishment of an
Indonesian female political caucus. But despite all that, not one of these regions consistently allocated
funding for these sorts of activities over the four years studied.
8.3 Programs Supporting Protection of Women and Children
Programs encompassing efforts to protect women and children include the following: (i) social and humanitarian assistance programs; (ii) programs to enhance the quality of life and the protection of
women; (iii) programs to enhance the welfare and protection of women and children.
During the four years under study provincial governments surpassed other regions studied for consistency in allocating funds for programs to protect women and children. Among cities studied,
only two (Pekalongan and Surakarta) appropriated budgetary resources for such programs; but the
amounts of money involved were not great and showed little sign of increasing during the period studied. By contrast, West Java’s provincial government appropriated substantial amounts for such programs: Rp
3 billion in 2009, up to Rp 6 billion in 2010 (constant 2007 prices). The governments of South Sumatera
and Central Java also budgeted for very significant levels of spending on programs to protect women and children: around Rp 1.4 billion in 2010 (constant 2007 prices).
Central Java’s provincial government focused its attention on protection of victims of trafficking and
on its “integrated service center for womens empowerment”. In 2010 it appropriated Rp 3.14 billion (current prices) for prevention of people trafficking and for handling and care of victims of trafficking.
In 2010 it allocated Rp 1.35 billion (current prices) to support its integrated service center. And over the
two year period 2009-10, albeit with more limited funds, it sponsored two other activities: one to establish mechanisms for the protection of women and the other to conduct a public awareness and advocacy
campaign on the protection of women in the workplace.
Graph 8.6 Appropriations for Programs Supporting Protection of Women and Children, 2007-10 Constant 2007 Prices
(This graph is available only in the Indonesian text of this publication)
Source: APBD-Rs for 2007-09 and APBD-Ms for 2010, processed by the LBS team.
The city of Pontianak displayed a high level of commitment to the protection of females and children,
especially during the last two years studied. During 2009-10 it consistently provided funding for programs directed at protection of children, control of juvenile delinquency and handling cases of

Analysis of Local Budgets: Study of Budgets for 2007-10
In 42 Kabupatens and Cities and 5 Provinces in Indonesia
49
domestic violence. In 2010 it funded construction of a shelter for victims of violence and for development
of Pontianak as a ―children friendly city‖.
Among the regions studied, only the city of Surakarta provided funding support for programs for the
handicapped. The city already had such programs in place in 2007 and 2008. It was a similar story with programs for the elderly: only the city of Surabaya made provision for aged citizens—in its 2008 budget.
This situation illustrates the extent to which the handicapped and the aged are discriminated against in
local government budgets.

Analysis of Local Budgets: Study of Budgets for 2007-10
In 42 Kabupatens and Cities and 5 Provinces in Indonesia
50
9. CONCLUSIONS AND RECOMMENDATIONS
1. The contribution made by other lawful own-source revenue (LPDS) has been constantly rising
over the last several years. One of the main stimuli for growth in LPDS has been the
introduction of infrastructure adjustment funds which basically doubled up on the Special
Allocation Fund (DAK). Not only have adjustment funds lacked clear eligibility criteria, they have also required no counterpart financing from recipient local governments. Moreover, some
areas receiving high levels of DAK funding have been chosen to receive adjustment funding as
well, while others, inadequately funded by the DAK, have received no adjustment funding. Such a situation not only violates principles of fiscal decentralization in Law No. 33/2004, but also
reflects poorly on the administration of adjustment fund programs. Almost all regions could only
properly ―administer‖ their 2009 adjustment fund grants at the end of the fiscal year after grants
had been spent. Recommendations: That infrastructure adjustment funds be abolished and
amalgamated with the DAK; that the DAK itself have more transparent allocation criteria and
concentrate on fewer and thus better funded areas of activity.
2. Local fiscal discretion is on a downward slide: spending on bureaucracies is increasing; and
expenditure on goods & services is decreasing. Lack of local government interest in downsizing,
or at least not increasing, civil service numbers has meant that more and more local government money has been spent on local bureaucracies. Moreover, 95% of General Allocation Fund
(DAU) transfers are spent exclusively on local bureaucracies without any incentive for local
governments to reduce civil service costs and spend more on enhancing community welfare.
Ever tighter fiscal situations have progressively reduced funding for capital expenditure and for provision of goods & services—so sorely needed for community welfare and for local economic
development. Recommendations: That local governments be encouraged to reduce
expenditure on civil servants; options for doing so include removing civil service costs as a
component of DAU and offering incentives—for example, via a regional incentives fund—to
local governments to reform and streamline their bureaucracies.
3. The full benefits of mid-year budget revision processes—to make budgets better targeted—are
still not being enjoyed. Budget revision processes have undoubtedly improved budget planning
by making it more realistic. But local governments are still generally underestimating their
income, leaving them at year’s end with more revenue than they expected to receive. At the same time, mid-year revised expenditure targets have been becoming more and more unrealistic
especially in the areas of capital expenditure and provision of goods & services. End-of-year
budget outcomes are not far off what was envisaged in original budgets (APBN-Ms), but are way below mid-year revised APBD-P expenditure targets. The result is a double whammy: under-
achievement of expenditure targets and over-achievement of revenue projections. That results in
turn in sizeable unspent budgetary surpluses (SiLPA) at year’s end. And let’s not forget that civil
society plays only a very limited role in budget revision processes. Recommendations: (i) That
government consider an incentives scheme to encourage more efficient mid- year budget
revision processes similar to the scheme in place for original budget (APBD-M) processes —
when governments not adopting budgets on time have their DAU allocations cut; (ii) That
technical regulations be passed making it mandatory for mid-year budget revision processes to
be transparent and participatory; and (iii) That civil society pay closer attention to mid-year
budget revision processes.
4. Overall spending on social aid and grants remains high—though its composition is changing:
spending on social aid is decreasing while expenditure on grants is rising. The main problems

Analysis of Local Budgets: Study of Budgets for 2007-10
In 42 Kabupatens and Cities and 5 Provinces in Indonesia
51
with these two areas of expenditure are lack of transparency in their planning and unclear
allocation and expenditure criteria. They are thus very susceptible to misuse for personal or political purposes. The Ministry of Home Affairs has sent out circular letters to try to limit the use
of these budget line items, but seemingly without good effect. Recommendations: (i) That
government issue stricter regulations on expenditure on social aid and grants: for example, by
setting an upper limit on the amount of local budget resources that can be allocated for these
line items; (ii) That the implementation of such regulations be closely monitored with a system
of clearly defined incentives and sanctions; and (iii) That civil society more closely monitor the
allocation and expenditure of social aid and grant funds.
5. Allocations for education are quite satisfactory in aggregate terms, but the way they are
dispersed within the education sector needs to be improved. Most education funding is currently spent on civil service costs or education infrastructure. Except in a few areas, student-teacher
and student-classroom ratios are quite reasonable. What is in short supply, however, is money to
enhance the quality of education and of teachers who deliver it. In fact, the Ministry of National
Education has acknowledged that most Indonesian teachers are not adequately qualified.
Recommendations: (i) That advocacy on education no longer focus on increased levels of
expenditure on education but rather on how available funding can be spent to maximum
effect; (ii) That indirect (routine, administrative) education expenditure be no longer directed
at increasing the number of teachers but rather at boosting income levels of existing teachers;
and (iii) That direct (development-related) expenditure be spent on enhancing teacher quality.
6. Low levels of funding for capital expenditure and provision of goods & services means that
funding for health services and public works are very limited. Overall, the funds available for
these two sectors is very limited indeed: for example, funding available for critically important
maternal and neonatal health services is way below what is needed; and declining public works funding for roads and bridges is insufficient even to maintain existing infrastructure. Budgets for
irrigation are also quite low, despite its importance for agriculture—still the mainstay of many
local economies. Development of public works is not just an important community service: it also stimulates economic growth and, at the end of day, increases local government tax revenue.
Recommendations: (i) That local governments allocate higher levels of funding for health and
public works and improve their policy frameworks for allocating such funding; and (ii) That
government consider setting up special programs for central intervention in these two sectors,
paying due attention to shared responsibilities inherent in regional autonomy.
7. Womens empowerment and gender mainstreaming are still thin on the ground in sub-national governments. All regions studies now have special local work units responsible for womens
empowerment and some have begun setting up legally mandated institutional support
mechanisms. But most regions lack stable funding for the development of strategic programs like data collection and use, analyses of gender issues, enhanced womens participation in politics
and protection of women and children. Recommendation: That public advocacy henceforth
focus on supporting the implementation of strategic womens programs that are supported by
adequate and stable funding.