lncs 4479 - beyond centrality - classifying topological ... · beyond centrality - classifying...
TRANSCRIPT

Beyond Centrality - Classifying TopologicalSignificance Using Backup Efficiency and
Alternative Paths
Yuval Shavitt and Yaron Singer
Tel Aviv University, Tel Aviv, [email protected]
Abstract. In networks characterized by broad degree distribution, suchas the Internet AS graph, node significance is often associated with itsdegree or with centrality metrics which relate to its reachability andshortest paths passing through it. Such measures do not consider avail-ability of efficient backup of the node and thus often fail to capture itscontribution to the functionality and resilience of the network operation.In this paper we suggest the Quality of Backup (QoB) and AlternativePath Centrality (APC) measures as complementary methods which en-able analysis of node significance in a manner which considers backup.We examine the theoretical significance of these measures and use themto classify nodes in the Internet AS graph while applying the BGP valley-free routing restrictions. We show that both node degree and node cen-trality are not necessarily evidence of its significance. In particular, somemedium degree nodes with medium centrality measure prove to be cru-cial for efficient routing in the Internet AS graph.
Keywords: Internet topology, network analysis, Internet AS graph.
1 Introduction
The topological study of networks appears in a wide spectrum of research ar-eas such as physics [3], biology [13], and computer science [10]. In research ofthe Internet, node significance classification has received attention in past stud-ies [18,4,5] and was treated in two different contexts: study of the Internet re-siliency against attacks and failures [3,12,14,7] and identification of the Internetcore nodes as well as significance categorization [18,5]. Both study threads wereconducted at the Internet AS level graph.
Several attempts have been made in the past to characterize the core of theInternet AS graph. In [18] the most connected node was used as the naturalstarting point for defining the Internet’s core. Other ASes were also classifiedto four shells and tendrils that hang from the shells, where ASes in shells witha small index are considered more important than ones in higher indices. Fur-ther work has dealt with classification of nodes into few shells with decreasingimportance [8,17]. In recent study [5] k-shell graph decomposition was used toclassify nodes by importance to roughly 40 layers of hierarchal significance. The
I.F. Akyildiz et al. (Eds.): NETWORKING 2007, LNCS 4479, pp. 774–785, 2007.c© IFIP International Federation for Information Processing 2007

Beyond Centrality - Classifying Topological Significance 775
k-shell classification, based on the node’s connectivity, identified over 80 ASesas the Internet core, some of which with medium degrees. Almost exclusively, anattempt to rank ASes by metrics other than node degree was done by CAIDA[1], where the ‘cone’ of the node was used to determine its importance, namelythe number of direct and indirect customers of the AS.
As network functionality is often measured by connectivity and vertex dis-tances in the graph used as its model, measures which credit vertices connectedto a relatively large number of vertices at relatively short distances are often usedas significance indicators [9,3]. However, inadequate consideration of backup bysuch measures often overshadows significance in context of its contribution tofunctionality and resilience of the network. Existence of backup raises questionregarding a node’s significance since failure of a node with backup does not effectconnectivity nor does it increase path lengths in the network and therefore theeffect of failure in such instances is minimal. Furthermore, existence of backupdenies exclusivity of the information passing through the node in the network.Since nodes can have backups of various qualities, measures of backup efficiencyand topological significance which considers backup are crucial for analysis ofnetwork functionality.
In this paper, we suggest two complementary measures which capture a node’scontribution to the network’s functionality: the Quality of Backup (QoB) andthe Alternative Path Centrality (APC). The QoB measures backup quality of avertex regardless of its centrality or effect on the functionality of the network,enables comparison of backup efficiency between vertices in the graph as well asbetween vertices from different graphs, and can thus serve as a universal measurefor backup. The APC measures functionality which considers both backup qual-ity and centrality of vertices in graphs and therefore enables analysis of nodes’significance in a wider context in comparison to other topological measures.
Our starting point for the node significance classification problem is exam-ination on levels of theoretical abstraction, and then evaluation of our resultson the Internet AS graph. Since failure of a node on the AS level is possible [7]though highly unlikely, applying APC and QoB on the Internet AS graph allowsa unique insight to the Internet as oppose to quantifying effects of failures. Onthe AS level, centrality which considers backup reveals significance in context ofpotential information which exclusively passes through a node, and its backupquantifies the dependency of its customers on its transit services. In our studywe use APC to identify the most significant nodes in the Internet AS graph, andshow that these are not necessarily members of the Internet core. In accordancewith properties of APC, it is not surprising that the largest ASes in the core, suchas UUNET and Sprint, also have very high APC values due to the large numberof customer ASes. However, small networks with poor backup like the Frenchresearch network RENATER, and the GEANT and Abiline academic backboneswhich have degrees as low as 51 (RENATER) and low centrality values, havevery high APC values as well.
The rest of this paper is organized as follows. The next section discusses theconcept of backup in networks and introduces the QoB as a measure of universal

776 Y. Shavitt and Y. Singer
backup efficiency. Section 3 provides detail of the APC construction and discussesits properties. In Section 4, we discuss modifications of our methods in order tomaintain relevance in the Internet AS graph model. Section 5 holds our analysisof the Internet AS graph using the modified measures in comparison to previousworks. Finally, we summarize and discuss our work in section 6.
2 Quantifying Backup Efficiency
In our attempt to quantify backup in networks we observed that the quality ofbackup of a given vertex in the graph is determined by the number of directchildren covered by a set of backup vertices, and the efficiency of reaching thisset by the set of direct parents. For a vertex v ∈ V , we define the set of childrenCv, set of parents Pv, and the backup set Bv, as follows:
Cv = {u ∈ V |(v, u) ∈ E},
Pv = {u ∈ V |(u, v) ∈ E},
Bv = {w ∈ V |∃u ∈ Cv : (w, u) ∈ E}.
Clearly, in instances of undirected graphs Cv ≡ Pv, and the discussion whichfollows remains relevant for these instances as well.
For u, w ∈ V , we use δ(u, w) to denote the shortest path distance between uand w in G. The shortest distance, δ(u, w), can be calculated by any set of rules,e.g., based on additional annotations on the graph edges, and is not limited tominimum hop. By convention, if u cannot reach v through any path in G, thenδ(u, v) = ∞. We also use δv(u, w) to represent the distance of the shortest pathwhich bypasses v from u to w.
Let G = (V, E) be a directed or undirected graph where V is the set of verticesand E is the set of edges. For v ∈ V , let Pv be the set of v’s direct parents andlet Cv be the set of v’s direct children. The Quality of Backup of v, denoted ρ(v)is:
ρ(v) =
∑u∈Pv
∑w∈Cv
(max{δv(u, w) − 1, 1})−1
|Pv| · |Cv|
The rational behind this measure is the following. To measure backup effi-ciency of a given vertex, it is enough to examine the cost of re-routing paths fromits set of parents to its set of direct children. Note that max{δv(u, w) − 1, 1} =δv(u, w) − δ(u, w) + 1 for all pairs 〈u, w〉, where u ∈ Pv and w ∈ Cv. For v ∈ V ,it is easy to see that ρ(v) = 1 ⇐⇒ ∀〈x, u〉 ∈ Pv × Cv ∃w ∈ Bv : (x, w) ∈E ∧ (w, u) ∈ E. Also, note that ρ(v) = 0 ⇐⇒ δv(x, u) = ∞ ∀〈x, u〉 ∈ Pv ×Cv.Thus, ρ : V −→ [0, 1], and returns 1 for vertices with perfect backups and 0 forvertices with no backup. Formal implementation of QoB on unweighted directedgraphs is presented in the figure below. Here, bfsv denotes the bfs algorithmwhich bypasses a vertex v, and δv(u), denotes the vector of shortest path dis-tances from u to all the vertices in the graph, which bypass v.

Beyond Centrality - Classifying Topological Significance 777
QoB(v, G)ρ ← 0for all u ∈ Pv do
δv(u) ← bfsv(u, G)for all w ∈ Cv do
ρ ← ρ + (max{δv(u, w) − 1, 1})−1
ρ ← ρ|Pv|·|Cv|
return ρ
The following theorem shows the QoB measure indeed enables local measure-ment of a vertex’s backup in the graph.
Theorem 1. For G = (V, E), for a vertex v ∈ V with Pv = ∅ and Cv = ∅, ρ(v)monotonically increases with respect to rise in backup efficiency.
Proof. For u ∈ Pv and w ∈ Cv, assume that δv(u, w) = c in G, where 1 < c ≤ ∞.Construct G′ by adding some edge e /∈ E, such that δ′v(u, w) = c′ < c, whereδ′v(u, w) represents the distance between u and w bypassing v in G′ . Therefore,
1δ′
v(u,w) > 1δv(u,w) , and (max{δ′v(u, w) − 1, 1})−1 ≥ (max{δv(u, w) − 1, 1})−1
(where equality holds only when c = 2). It thus easily follows that ρ′(v) > ρ(v),where ρ′(v) is the QoB measure of v in G′. �
3 Alternative Path Centrality
The above section discusses backup efficiency of a vertex regardless of centralityconsiderations. In an attempt to quantify significance, note that centrality ofa node (its ability to reach a relatively large number of nodes efficiently) alsoplays a vital role in analysis: a node which has relatively efficient backup canbe crucial to the network’s functionality due to its high centrality, while a nodewith poor backup and low centrality can have little effect on functionality inthe network. The Alternative Path Centrality (APC) measure presented in thissection enables quantifying topological contribution of a node to the functionalityof the network as it considers both centrality and backup efficiency.
Given a graph G = (V, E) as above and u ∈ V , the topological centralitymeasure used here, denoted χ, where χ : V −→ R is:
χ(u) =∑
w∈V \{u}
1δ(u, w)
Clearly, 0 ≤ χ(u) ≤ |V | − 1 ∀u ∈ V.
For a vertex u ∈ V , the value of χ(u) depends on the number of vertices con-nected to u and their distances from it; χ monotonically increases with respect toboth centrality and connectivity of the vertex. Thus, in relation to other verticesin the graph, high χ values are obtained for a vertex which is connected to a large

778 Y. Shavitt and Y. Singer
number of vertices at short distances. Symmetrically, a vertex connected to asmall number of vertices at large distances yields low χ values. These propertiesmake the χ function a favorite candidate for measuring vertices’ centrality inthe network. In [11] for a network G, the average of χ values was used to definethe efficiency of the network. Similar topological measures have also been usedin [3] and in [9] to study functionality in complex networks.
For G = (V, E), The APC value of v ∈ V , denoted ϕ(v) is:
ϕ(v) =∑
u∈V \{v}χ(u) −
∑
u∈V \{v}χv(u)
Where χv denotes centrality values calculated in the graph using alternativepaths which bypass v.
The rational behind APC is simple. In instances where network functionalityis determined by shortest paths and connectivity, the significance of a node vto the network’s functionality can be measured by its effect on these criteria.Computing the difference between vertices’ topological centrality using v, andtopological centrality bypassing v, enables witnessing v’s exclusive contributionto the network’s functionality.
The algorithm presented below is a simple implementation of APC using theBreadth First Search (bfs) algorithm for unweighted directed graphs.
APC(v, G)ϕ ← 0for all u ∈ V \{v} do
δ(u) ← bfs(u, G)δv(u) ← bfsv(u, G)χΔ ← 0for all w ∈ V \{v, u} do
χΔ ← 1δ(u,w) − 1
δv(u,w)return ϕ
Using the bfs algorithm, the overall computational complexity of APC isO(|V | · |E|). For weighted graphs, one can substitute the bfs algorithm with asingle-source shortest path algorithm for non-negative weighted graphs, such asDijkstra’s algorithm [6] and achieve (|V | · (|V | · log |V | + |E|)) running time.
We conclude our discussion of the APC properties with the following theoremwhich shows that APC properly considers both centrality and backup of a vertexin the graph.
Theorem 2. For G = (V, E) and v ∈ V , Cv = ∅, ϕ(v) monotonically increaseswith respect to rise in topological centrality and decrement in backup quality.
Proof. To prove ϕ(v) monotonically increases with respect to rise in centrality,let χ(v) < |V | − 1, and w ∈ V be a vertex for which 1 < δ(v, w) ≤ ∞. Let e /∈ Ebe some edge for which δ′(v, w) < δ(v, w), where δ′(v, w) denotes the shortest

Beyond Centrality - Classifying Topological Significance 779
path distance in G′ = (V, E⋃
{e}), and e does not create new alternative pathsto w in G′ (otherwise backup efficiency increases). We show that ϕ(v) < ϕ′(v),where ϕ′(v) denotes the APC value of v in G′. For all x ∈ V , which reach wthrough v, δ′(x, w) < δ(x, w) and δ′v(x, w) = δv(x, w). For all such vertices, x,we have:
1δ′(x, w)
− 1δ′v(x, w)
>1
δ(x, w)− 1
δv(x, w)
and it therefore follows that ϕ(v) < ϕ′(v).To prove monotonic increase with respect to decrement in backup quality,
assume that some edge e /∈ E has been added to G, such that ρ(v) increases. Weagain denote G′ = (V, E
⋃{e}), and use similar notation as above. We therefore
assume ρ′(v) > ρ(v). Specifically, there is some pair 〈u, w〉 ∈ Pv × Cv such thatδ′v(u, w) < δv(u, w). For this pair we have:
1δ′(u, w)
− 1δ′v(u, w)
<1
δ(u, w)− 1
δv(u, w)
It trivially follows that ϕ′(u) < ϕ(u), and concludes proof of the theorem. �
4 Adaptation of APC and QoB for the Directed ASGraph
To apply QoB and APC on the Internet, we have adjusted these measures toconform to the model of the AS graph and specifically to the routing restrictionwhich it imposes. We begin with a brief description of the AS graph model.
The Internet AS GraphThe Internet today consists of tens of thousands of networks, each with it ownadministrative management, called Autonomous Systems (ASes). Each such ASuses an interior routing protocol (such as OSPF, RIP) inside its managed net-work, and communicates with neighboring ASes using an exterior routing pro-tocol, called BGP. The graph which models inter-connection between ASes inthe Internet is referred to as the Internet AS graph. Since the ASes in the Inter-net are bound by commercial agreements, restrictions are imposed on the pathswhich may be explored. The commercial agreements between the ASes are char-acterized by customer-provider, provider-customer and peer-to-peer relations.A customer pays its provider for transit services, thus the provider transits allpackets to and from its customers. The customer, however, will not transit pack-ets for its provider. Specifically, a customer will not transit packets between twoof its providers, or between its provider and its peers. Peers are two ASes thatagree to provide transit information between their respective customers.
In pioneering work, Lixin Gao [8] has deduced that a legal AS path may eitherbe an up hill path, followed by a down hill path, or an up hill path, followed bya peering link, followed by a down hill path. An up hill path is a sequential set,possibly empty, of customer-provider links, and a down hill path is a sequential

780 Y. Shavitt and Y. Singer
set, possibly empty, of provider-customer links. Therefore a legal route betweenASes can be described as a valley free path. A peering link can be traversed onlyonce in each such path, and if it exists in the path it marks the turning pointfor a down hill path.
The ASQoB and ASAPC Measures
Since transitivity is not immediate in the AS graph, the QoB requires two cardi-nal adjustments to maintain relevance. Consider the AS graph G = (V, E), andsome v ∈ V , for which we wish to obtain ρ(v) in G. Let u ∈ Pv and w ∈ Cv. Thefirst adjustment is to consider the pair 〈u, w〉 ⇐⇒ u can reach w through vusing a legal AS path. Since the bfs algorithm does not consider the up, down,and peer labels, valley free paths are not exclusively discovered, and it cannotbe used to measure minimum-hop distances in the AS graph. For this, we usethe asbfs algorithm [16] which discovers valley free shortest paths from a sourcevertex in the unweighted AS graph in linear time.
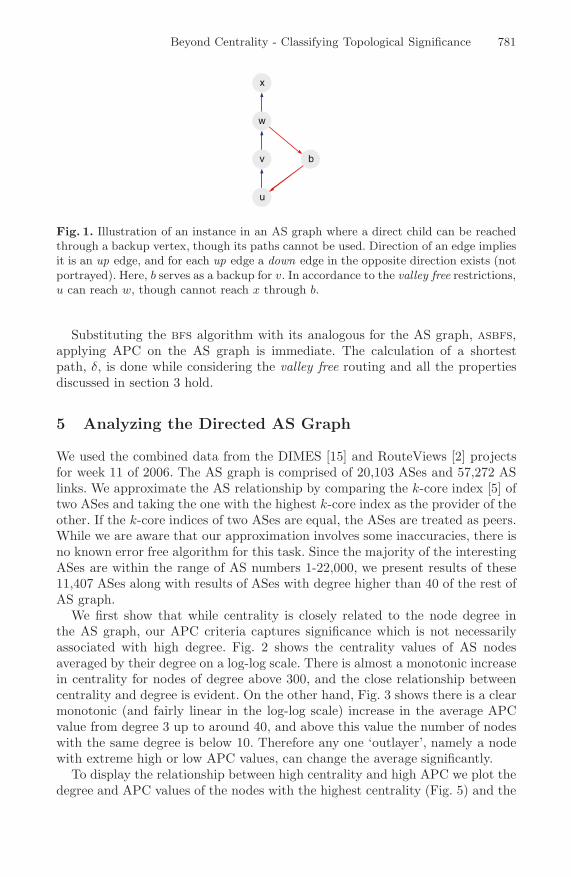
In order to provide motivation for the second adjustment required, we presentthe following example. Consider the graph illustrated in Fig. 1. In quantifying theQoB of v ∈ V Suppose a vertex u ∈ Pv has reached a vertex w ∈ Cv through anup hill path through v, though by using the alternative path through the vertexb ∈ Bv, u now reaches w through a down hill path. All vertices in Cw which arereached through an up hill path (x in this example), are now unreachable to uas this creates an illegal AS path. Therefore, to factor this into the QoB measurein the AS graph, we use the following strategy. For all vertices w ∈ Cv we scanfor vertices x ∈ Cw which are reachable from v through legal AS paths, andconsider the pairs 〈u, x〉 ∈ Pv × Cw as well. The ASQoB algorithm is describedin the figure below. We denote by Ruv the set of reachable children of v from uin accordance to policy based routing in the AS graph.
ASQoB(v,G)ρ ← 0for all u ∈ Pv do
δv(u) ← asbfsv(u, G)for all w ∈ Ruv do
ρ ← ρ + (max{δv(u, w) − 1, 1})−1
for all x ∈ Rvw doρ ← ρ + (max{δv(v, x) − 1, 1})−1
ρ ← ρ∑u∈Pv
∑w∈Ruv
|Ruv|+|Rvw|return ρ
Drawing its strength from the properties of the QoB measure, the ASQoBremains faithful to the principles of measuring backup efficiency in the AS graph.For v ∈ V , as reachable children are scanned in two levels, we are guaranteedthat ρ(v) = 1 ⇐⇒ v has a perfect backup which does not disqualify legal ASpaths.
Beyond Centrality - Classifying Topological Significance 781
w
v b
x
u
Fig. 1. Illustration of an instance in an AS graph where a direct child can be reachedthrough a backup vertex, though its paths cannot be used. Direction of an edge impliesit is an up edge, and for each up edge a down edge in the opposite direction exists (notportrayed). Here, b serves as a backup for v. In accordance to the valley free restrictions,u can reach w, though cannot reach x through b.
Substituting the bfs algorithm with its analogous for the AS graph, asbfs,applying APC on the AS graph is immediate. The calculation of a shortestpath, δ, is done while considering the valley free routing and all the propertiesdiscussed in section 3 hold.
5 Analyzing the Directed AS Graph
We used the combined data from the DIMES [15] and RouteViews [2] projectsfor week 11 of 2006. The AS graph is comprised of 20,103 ASes and 57,272 ASlinks. We approximate the AS relationship by comparing the k-core index [5] oftwo ASes and taking the one with the highest k-core index as the provider of theother. If the k-core indices of two ASes are equal, the ASes are treated as peers.While we are aware that our approximation involves some inaccuracies, there isno known error free algorithm for this task. Since the majority of the interestingASes are within the range of AS numbers 1-22,000, we present results of these11,407 ASes along with results of ASes with degree higher than 40 of the rest ofAS graph.
We first show that while centrality is closely related to the node degree inthe AS graph, our APC criteria captures significance which is not necessarilyassociated with high degree. Fig. 2 shows the centrality values of AS nodesaveraged by their degree on a log-log scale. There is almost a monotonic increasein centrality for nodes of degree above 300, and the close relationship betweencentrality and degree is evident. On the other hand, Fig. 3 shows there is a clearmonotonic (and fairly linear in the log-log scale) increase in the average APCvalue from degree 3 up to around 40, and above this value the number of nodeswith the same degree is below 10. Therefore any one ‘outlayer’, namely a nodewith extreme high or low APC values, can change the average significantly.
To display the relationship between high centrality and high APC we plot thedegree and APC values of the nodes with the highest centrality (Fig. 5) and the

782 Y. Shavitt and Y. Singer
100
101
102
103
104
101
102
103
104
degree (log scale)
aver
age
cent
ralit
y (lo
g sc
ale)
Fig. 2. Average centrality as a functionof its degree
100
101
102
103
104
100
101
102
103
104
105
degree (log scale)
aver
age
AP
C (
log
scal
e)
Fig. 3. Average APC as a function ofits degree
degree and centrality of the nodes with the highest APC values (Fig. 4). The fiveASes with the highest degree, 701 (UUNET), 7018 (AT&T), 1239 (Sprint), 3356(Level3), and 174 (Cogent), are also the five ASes with the highest centrality.These are the largest tier-1 providers. In contrast, only UUNET is in the topten APC list, mainly due to its high number of peer ASes; Sprint and Cogentalso have high APC values. These three tier-1 providers support many stub ASesbut have relatively low backup measure (0.7–0.75) which explain their high APCvalues. Level3, which has high centrality, has low APC value because it has arather high QoB around 0.82. This means that although Level3 (3356) plays acentral role in Internet routing, it may be replaced through alternative routes andthus is not as important as the previous three nodes. The next nodes with highcentrality are 3549 (GBLX), 2914 (Verio), 7132 (SBC), 6461 (Abovenet), and12956 (Telefonica). These are all tier-1 providers or major providers in Europe.
For the nodes with the highest APC values the picture is different: whileUUNET (701) has the fourth largest APC value, many of the high locations inthe list are captured by medium sized ASes with poor (and sometimes extremelypoor) backup. Through study of the QoB distribution in the AS graph we havelearned that there is a large concentration around 1, which is a testament of per-fect backup. The median QoB value is 0.9799, and a large majority of the nodeshave QoB values above 0.95. The nodes ranked first, third, and eighth in the topAPC list are educational networks: GEANT (20965) in Europe, ENA (11686)in the USA, and RENATER (2200) in France (Abiline the US research networkwas ranked eleventh). The other group of nodes is of medium size providers,France Telecom (3215), YIPES (6517), Ukraine Telecom (6849), and Server-Central (23352), each appears to have high APC values due to a different rea-son. France Telecom, YIPES and UKR Telecom have extremely low QoB, whileServerCentral connects remote locations that may not have efficient alternativepaths. Statistics of nodes with highest APC values are displayed in table 1.
Fig. 6 shows the distribution of the APC values in the AS graph (note thetruncation of the first column). The APC distribution is shown to have a longbut narrow tail with only a few nodes with very high APC values, these nodes are

Beyond Centrality - Classifying Topological Significance 783
101
102
103
104
102
103
104
701
2200
3215
6517 & 6849
10910
11686
12859
20965
23352
degree
cent
ralit
yhigh APC nodes
Fig. 4. The degree and centrality of thenodes with the highest APC values
500 1000 1500 2000 2500 30000
5000
10000
15000
174
701
1239
2914
3356
35496461
7018
7132
12956
degree
AP
C
high centrality nodes
Fig. 5. The degree and APC of thenodes with the highest centrality val-ues
0 0.5 1 1.5 2 2.5 3
x 104
0
10
20
30
40
50
604402
Distribution of APC Values in AS Graph for all nodes with degree 3 and up
Fig. 6. A histogram of the APC val-ues for nodes of degree greater than 2.The first bin holds 4402 ASes and wastruncated.
0 0.1 0.2 0.3 0.4 0.5 0.6 0.7 0.8 0.9 10
500
1000
1500
2000
2500
3000Distribution of QoB Values in AS Graph for all nodes with degree 3 and up
Fig. 7. A histogram of the backup val-ues for nodes of degree greater than 2
scattered almost over the entire degree range, starting with nodes with degreeof just above 50 (see Fig. 4 and Table 1).
The QoB distribution shown in Fig. 7 has a large concentration around 1,which is a testament of perfect backup. The median value is 0.9799, and as thehistogram shows a large majority of the nodes have QoB values above 0.95.
To discuss our results in comparison to other measures of node significance,we refer to table 2 which shows the top ten nodes in the CAIDA ranking [1]based on the number of customers a node has. The list is dominated by highdegree nodes; the two medium degree nodes in the list have also rather highAPC values; in general all the nodes have relatively high APC values and eightof them are in the top 38 APC list. All the nodes in the list have poor QoBvalues, possibly due to relatively large stub ASes connecting to them. It is vividthat the centrality of the nodes in the CAIDA list is much larger than on our

784 Y. Shavitt and Y. Singer
Table 1. statistics of AS nodes withhighest APC values
AS No. degree cent. QoB APC20965 74 1190 0.79 2662810910 205 385 0.59 1629811686 187 3389 0.92 16042
701 2616 7956 0.72 142763215 115 422 0.80 134936517 175 474 0.83 128516849 186 472 0.56 127652200 51 347 0.50 12549
12859 79 1017 0.94 1239623352 71 2113 0.94 12065
Table 2. statistics of AS nodes withhighest CAIDA significance rankings
AS No. degree cent. QoB APC3356 1784 7690 0.82 7559209 1272 5381 0.72 6113
7018 2354 7992 0.74 114481239 2020 8022 0.74 10604701 2616 7956 0.72 14276
3561 708 5762 0.79 2579174 1483 7144 0.76 8797703 216 1441 0.86 10539
19262 188 905 0.75 10763702 680 5672 0.77 2101
APC list. While all the nodes identified as important in the CAIDA list havehigh APC values, the opposite analogy does not apply. Several of the nodes inour top 10 list are ranked below 200 in the CAIDA list.
6 Conclusion
We have shed light on the contribution of backup efficiency for the node sig-nificance classification problem. Given our theoretical analysis, we believe thiscontribution has merit in classification of network nodes in other fields outsidethe data networking domain.
We are aware that our results are not accurate for several reasons. First, aswe stated in the main text, our AS relationship approximation is not accurate.Second, although we used the most detailed Internet map available through theDIMES project, the graph itself is still missing many links which can effect thecalculation of all the measures, as well as the AS relationship deduction.
In the future we intend to broaden this research to study the effect of nodefailure on the Point of Presence (PoP) level as well as study relationship of setsof nodes in the AS graph in the context of backup and functionality. On the the-oretical level, we intend to study the robustness of the APC and QoB measuresto error in measurements, as well as further formal analysis of their properties.
References
1. CAIDA AS ranking. http://as-rank.caida.org/.2. University of oregon RouteViews project. http://www.antc.uoregon.edu/route-
views/.3. Reka Albert, Hawoong Jeong, and Albert-Laszlo Barabasi. Error and attack
tolerance of complex networks. Nature, (406):378–382, 2000.4. Sagy Bar, Mira Gonen, and Avishai Wool. An incremental super-linear preferential
internet topology model. In PAM ’04, Antibes Juan-les-Pins, France, April 2004.
Beyond Centrality - Classifying Topological Significance 785
5. Shai Carmi, Shlomo Havlin, Scott Kirkpatrick, Yuval Shavitt, and Eran Shir.Medusa: New model of Internet topology using k-shell decomposition. Technicalreport, arXiv, January 2006.
6. Thomas H. Cormen, Charles E. Leiserson, Ronald L. Rivest, and Clifford Stein.Introduction to Algorithms. 2001.
7. Danny Dolev, Sugih Jamin, Osnat Mokryn, and Yuval Shavitt. Internet re-siliency to attacks and failures under BGP policy routing. Computer Networks,50(16):3183–3196, November 2006.
8. Lixin Gao. On inferring automonous system relationships in the Internet.IEEE/ACM Transactions on Networking, 9(6):733–745, December 2001.
9. H. Jeong, S. P. Mason, A. L. Barabasi, and Z. N. Oltvai. Lethality and centralityin protein networks. Nature, 411:41–42, 2001.
10. Jon M. Kleinberg. Authoritative sources in a hyperlinked environment. In SODA,pages 668–677, 1998.
11. Vito Latora and Massimo Marchiori. Efficient behavior of small-world networks.Physical Review Letters, 87(19):198701, 2001.
12. Damien Magoni. Tearing down the internet. IEEE Journal on Selected Areas inCommunications, 21(6):949–960, August 2003.
13. Ron Milo, Shai Shen-Orr, Shalev Itzkovitz, Nadav Kashtan, D. Chklovski, andUri Alon. Network motifs: simple building blocks of complex networks. Science,298:824–827, 2002.
14. Seung-Taek Park, Alexy Khrabrov, David M. Pennock, Steve Lawrence, C. LeeGiles, and Lyle H. Ungar. Static and dynamic analysis of the internet’s suscepti-bility to faults and attacks. In IEEE INFOCOM 2003, San-Francisco, CA, USA,April 2003.
15. Yuval Shavitt and Eran Shir. DIMES: Let the internet measure itself. ACMSIGCOMM Computer Communication Review, 35(5), October 2005.
16. Yuval Shavitt and Yaron Singer. A linear time shortest paths algorithm for theInternet AS graph. Tel Aviv University Technical Report, (EE102), 2007.
17. Lakshminarayanan Subramanian, Sharad Agarwal, Jennifer Rexford, andRandy H. Katz. Characterizing the Internet hierarchy from multiple vantagepoints. In IEEE INFOCOM 2002, New-York, NY, USA, April 2002.
18. L. Tauro, C. Palmer, G. Siganos, and M. Faloutsos. A simple conceptual modelfor the Internet topology. In Global Internet, November 2001.