livestock farming systems in the northern tablelands of … · tablelands: representative year ......
TRANSCRIPT
Livestock Farming Systems in the NorthernTablelands of NSW: An Economic Analysis
Andrew AlfordPhD Scholar with the Cooperative Research Centre for Cattle and Beef Quality, University of
New England, Armidale, on leave from the Meat, Dairy and Intensive Livestock ProductsProgram, NSW Agriculture
Garry GriffithMeat, Dairy and Intensive Livestock Products Program,
NSW Agriculture, Armidale
Lloyd DaviesMeat, Dairy and Intensive Livestock Products Program,
NSW Agriculture, Tocal
Economic Research Report No. 12
October 2003

ii
NSW Agriculture 2003This publication is copyright. Except as permitted under the Copyright Act 1968, no part ofthe publication may be reproduced by any process, electronic or otherwise, without thespecific written permission of the copyright owner. Neither may information be storedelectronically in any way whatever without such permission.
ISSN 1442-9764
ISBN 0 7347 1514 5
Senior Author's Contact:Dr Garry Griffith, NSW Agriculture, Beef Industry Centre, University of New England,Armidale, 2351.
Telephone: (02) 6770 1826 Facsimile: (02) 6770 1830Email: [email protected]
Citation:Alford, A.R., Griffith, G.R. and Davies, B.L. (2003), Livestock Farming Systems in theNorthern Tablelands of NSW: An Economic Analysis, Economic Research Report No. 12,NSW Agriculture, Orange, October.

iii
Livestock Farming Systems in the Northern Tablelands ofNSW: An Economic Analysis
Table of Contents
PageList of Tables vList of Figures viAcknowledgements viiAcronyms and Abbreviations Used in the Report viiExecutive Summary viii
1. Introduction1.1 Overview1.2 Representative Farm Analysis
111
222234
2. Northern Tablelands Agriculture2.1 Area and Topography2.2 Climate2.3 Soils2.4 Pasture Base2.5 Regional Agricultural Issues
3. The Northern Tablelands Farming System3.1 Sources of Information3.2 Characteristics of Regional Agricultural Activities3.3 Description of the Various Beef, Sheep and Pasture Activities
3.3.1 Northern Tablelands Beef Activities Included as Options in the FarmModel3.3.2 Northern Tablelands Sheep Activities Included as Options in the FarmModel3.3.3 Northern Tablelands Pasture Activities Included in the Farm Model
3.4 Enterprise Budgets3.5 The Northern Tablelands Whole-Farm Linear Program
4. The Northern Tablelands Representative Farm Model 4.1 The Representative Farm Model
4.1.1 The Representative Farm Plan4.1.2 The Whole-Farm Operating Budget4.1.3 Assets and Liabilities of the Representative Farm
4.2 Sensitivity Analysis4.2.1 Profit Drivers of the Representative Farm4.2.2 Sensitivity of the Representative Farm Plan to Price Assumptions4.2.3 Whole-Farm Budget for the Northern Tablelands Representative Farm:
2002 Year4.2.4 Whole-Farm Budget for the Northern Tablelands Representative Farm:
2003 Year
88810
10
11111214
1616161617202020
21
22

iv
5. Economic Evaluation of New Technologies at the Farm-Level - ExampleApplication of the Northern Tablelands Whole-Farm Model5.1 Introduction5.2 Case Study – Improvement in Winter Pasture Growth
26
2626
6. Summary and Conclusions
7. References
Appendices
29
31
A ABARE Survey Data, 2000/2001B Representative Farm Enterprise Budgets for the Representative Year (2001 dollar values)
Pasture Enterprise Budgets Beef Cattle Enterprise Budgets Sheep Enterprise Budgets Supplementary Feeding Enterprise Budgets
3538
38404853
C Pasture Production Assumptions 54

v
List of TablesPage
Table 1. Historical climatic data for Northern Tableland centres 4
Table 2. Variation in farm size by local government area, 1997 9
Table 3. Physical characteristics of sheep-beef and sheep farms surveyed byABARE in the Northern Tablelands in 2000/01 9
Table 4. Commodity price assumptions used in deriving the representativeyear whole-farm budget 13
Table 5. Sources of input prices for the farm budgets 13
Table 6. Outline of the structure of the Northern Tablelands linear program matrix 15
Table 7. Whole-farm budgets for representative sheep-beef farm for NorthernTablelands: representative year annual operating budget (2001 dollars) 18
Table 8. Whole-farm budgets for representative sheep-beef farm for NorthernTablelands: representative year statement of assets and liabilities (2001 dollars) 19
Table 9. Profit drivers of the representative farm 20
Table 10. Relative improvement in enterprise gross margins requiredto be selected in the optimal farm plan for the representative year 21
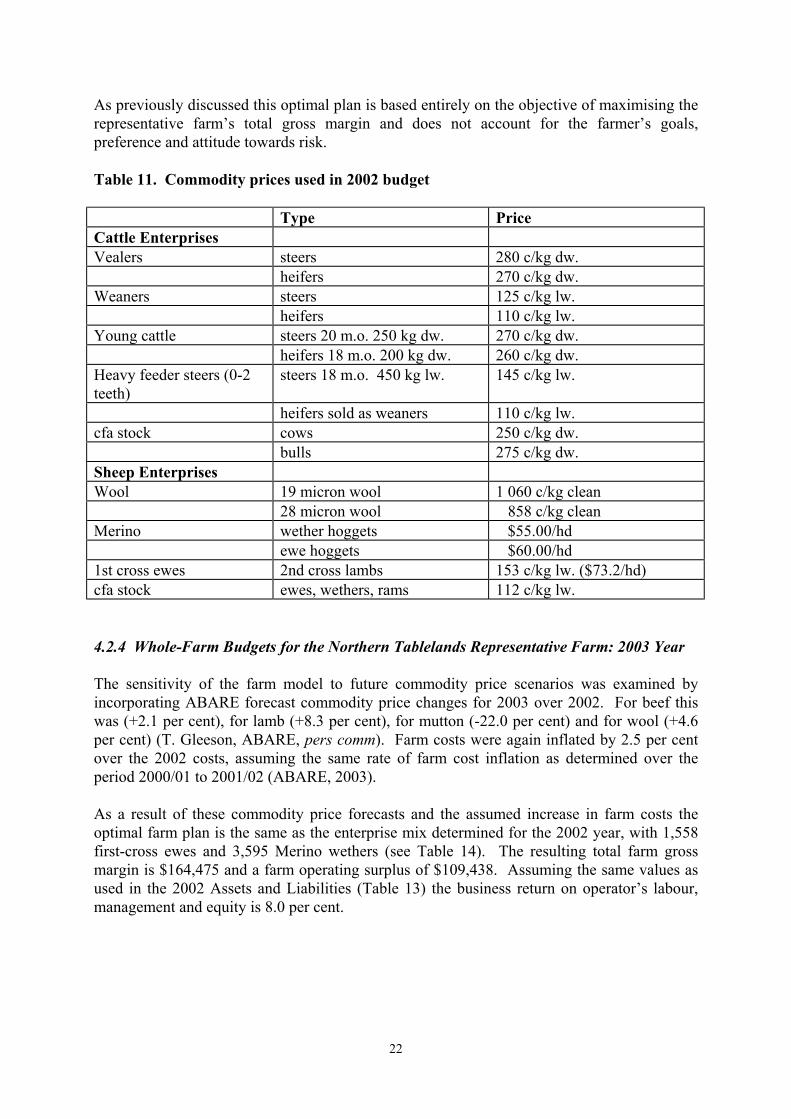
Table 11. Commodity prices used in 2002 budget 22
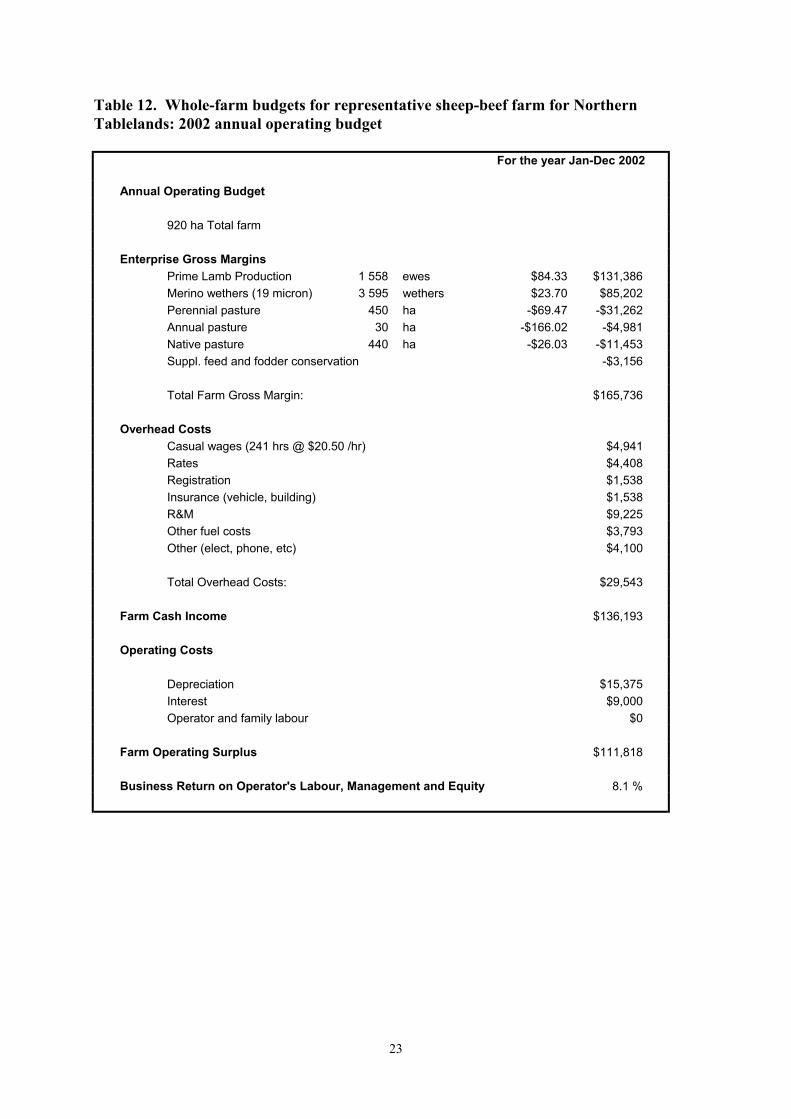
Table 12. Whole-farm budgets for representative sheep-beef farm forNorthern Tablelands: 2002 annual operating budget 23
Table 13. Whole-farm budgets for representative sheep-beef farm forNorthern Tablelands: 2002 statement of assets and liabilities 24
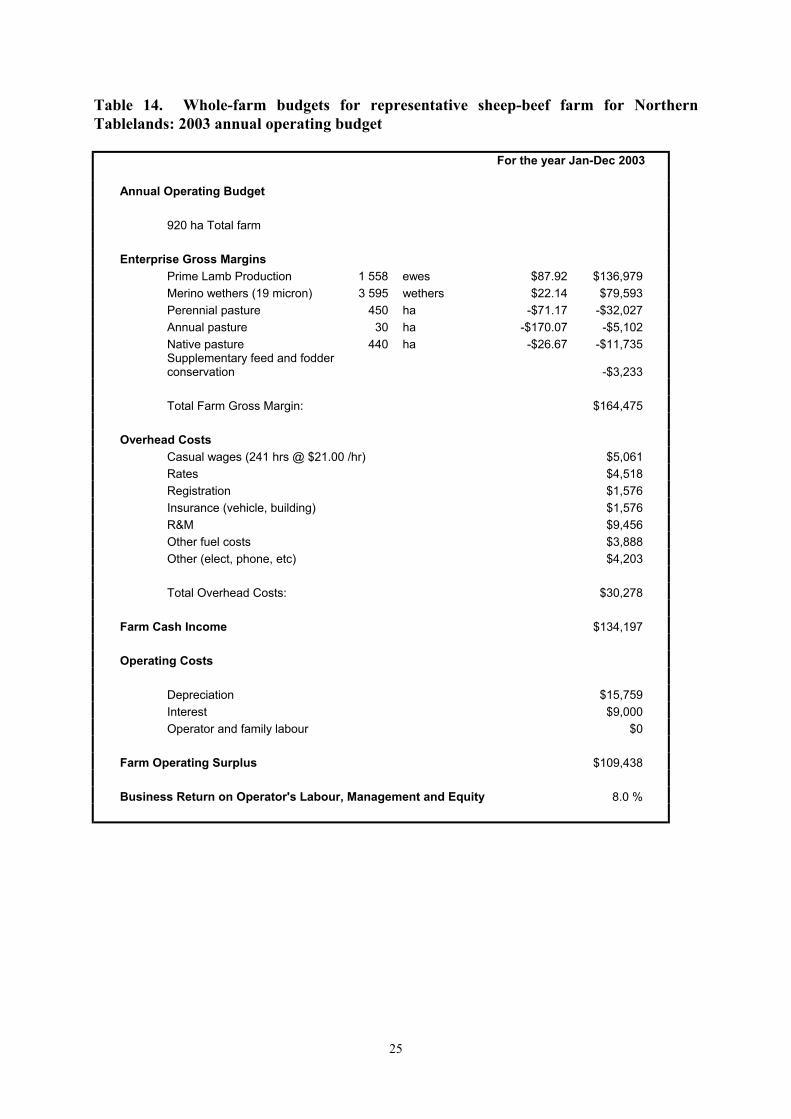
Table 14. Whole-farm budgets for representative sheep-beef farm forNorthern Tablelands: 2003 annual operating budget 25
Table 15. Summary of farm-level benefits from improvements in the wintergrowth potential of introduced pasture species to the representative farm 28

vi
List of FiguresPage
Figure 1. The Northern Tablelands region of New South Wales 3
Figure 2. Estimated pasture growth rate of Microlaena/clover pastures onthe NSW Tablelands 5
Figure 3. Estimated pasture growth rate of temperate perennial grassand clover pastures on the NSW Tablelands 5
Figure 4. Comparison of farm business profit of Northern Tablelandssheep-beef and specialist sheep farms over the period 1990/91 to 2000/01 6
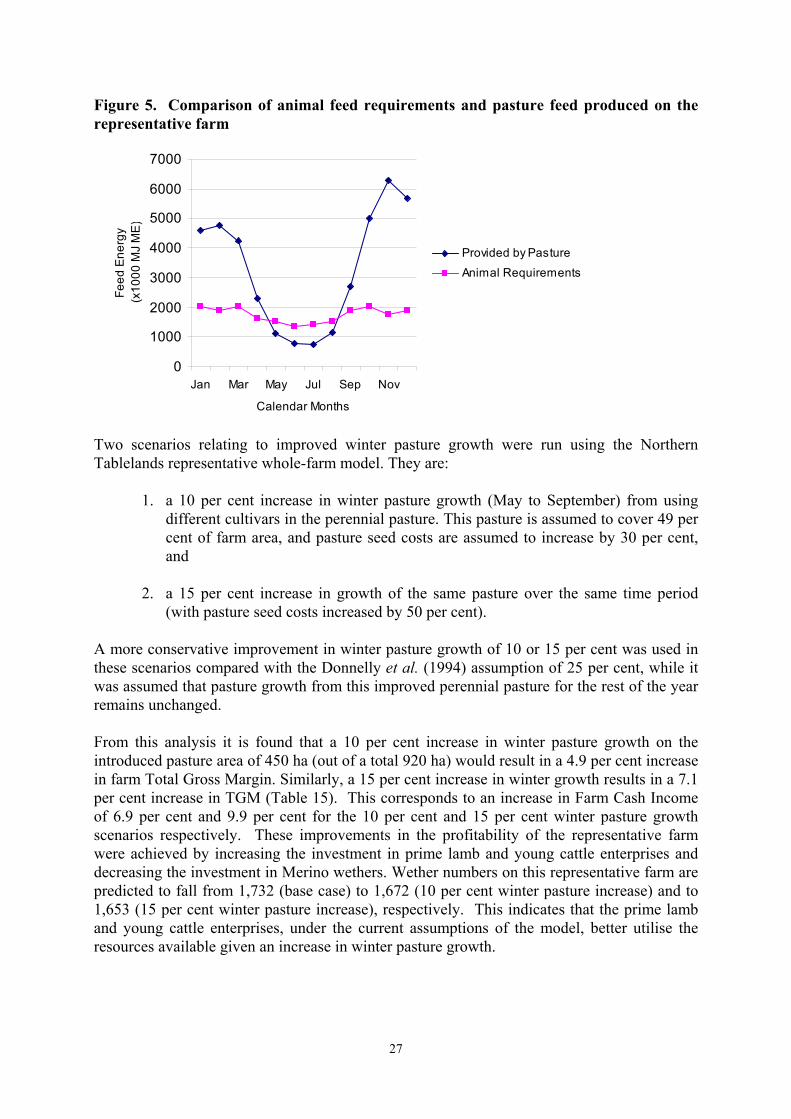
Figure 5. Comparison of animal feed requirements and pasture feedproduced on the representative farm 27
vii
AcknowledgmentsFinancial support for the research program on the Australian beef and sheep industry of whichthis Report forms part was provided by the Cooperative Research Centre for Cattle and BeefQuality, the Australian Sheep Industry Cooperative Research Centre and NSW Agriculture.
In developing the representative farm model and in preparing this Report, the authorsacknowledge the helpful contributions of John Ayres, Bob Gaden, Sue Hatcher, Jeff Lowien,Bob Marchant, Dean Patton and Alastair Rayner, all from NSW Agriculture; Jim Scott andKeith Hutchinson from the University of New England; Stephen Hooper from ABARE; andseveral Northern Tablelands graziers.
John Mullen, Mathew McRae and Chris Cole provided valuable comments on an earlierversion of this Report.
Acronyms and Abbreviations Used in the ReportABARE Australian Bureau of Agricultural and Resource EconomicsABS Australian Bureau of StatisticsAMLC Australian Meat and Livestock Corporation (now MLA)AWE Australian Wool ExchangeBEEF CRC Cooperative Research Centre for Cattle and Beef QualityCFA Cast-for-ageDW Dressed weight (or carcase weight)FCI Farm Cash IncomeFOS Farm Operating SurplusLGA Local Government Area (typically a shire or a municipality)LP Linear ProgrammingLW LiveweightME Metabolisable EnergyMIDAS Model of an Integrated Dryland Agricultural SystemMJ Megajoules (of energy)MLA Meat and Livestock AustraliaNFE Net Feed EfficiencyNTLP Northern Tablelands Linear ProgramPTIC Pregnancy tested, in calfR&D Research and DevelopmentSHEEP CRC Australian Sheep Industry Cooperative Research CentreTGM Total Gross MarginTVC Total Variable Costs
viii
Livestock Farming Systems in the Northern Tablelands ofNSW: An Economic Analysis
Executive Summary
The Northern Tablelands region of New South Wales covers an area of approximately 3.12million hectares including 2.11 million hectares occupied by some 2300 agriculturalestablishments producing agricultural commodities valued at more than $220 million. Sheepand wool production and cattle production are the dominant agricultural enterprises.
In this Report, a whole-farm model of a representative livestock farming system in theNorthern Tablelands is developed. Whole-farm economic models of the relevant farmingsystem are a useful first step in understanding the nature of the biological and economicconstraints facing producers in their decision making in relation to their choices of inputs andoutputs. Such models are also useful in relation to more general concerns such as the expectedimpacts of investments in new technologies applicable to grazing systems, or of externalevents such as drought conditions or a depreciation in the exchange rate.
A whole–farm budget for a representative farm includes a statement of assets and liabilities,based upon estimates of the various capital items including land, livestock and plant andmachinery and farm structures. There is also an annual operating budget that includes the cashincome and costs associated with each of the farm enterprises as well as the fixed costsincurred for running the farm over the year to derive the farm cash income. Allowances fordepreciation and interest costs are deducted from farm cash income to determine farmoperating surplus. No family labour allowance is subtracted, so the resulting farm operatingsurplus represents a return on owner-operated labour, management and farm assets. Pasturecosts are not apportioned to the specific animal enterprises and therefore appear as separatenegative gross margins. Similarly, supplementary feeding costs and fodder conservationactivities are listed as a separate negative gross margin.
A representative farm model of the Northern Tablelands livestock farming system wasdeveloped based on ABS and ABARE data on the relevant industries, from simulations with alinear programming model, and from discussions with local graziers and extension officers.The farm comprises 920 ha of which about half is native pasture and about half is introducedpasture. This farm runs a flock of 1,108 first-cross ewes, a flock of 1,732 Merino wethers anda 127 cow herd producing 18 month old steers suitable for the heavy feeder steer market.
Using average prices and costs over an extended period of time, the annual operating budgetfor the farm shows a total gross margin of $86,191 and total overhead costs for the year of$24,720. This results in a farm cash income of $61,471 and a farm operating surplus of$37,471 after depreciation and interest costs. The statement of assets and liabilities showstotal assets of the farm to be $1,498,060 and liabilities of $100,000 which equates to an equitylevel of 93.3 per cent. The farm operating surplus achieved on this model farm as a percentageof the owner’s equity is 2.7 per cent. This represents a return on operator and family labour,management and equity. Low returns to equity are typical of Australian broadacreagriculture.
ix
Other scenarios examined included whole-farm budgets based on 2002 actual market pricesand on 2003 expected prices. Given the relatively high prices for sheep relative to cattle inthese years, the representative farm would be more profitable running 1,558 first-cross ewesand 3,595 Merino wethers. Such an enterprise mix would achieve a farm total gross margin of$165,736. After overhead costs, depreciation and interest costs there would be a farmoperating surplus of $111,818. Based on equity totalling $1,472,870, this operating surpluswould represent a business return on operator labour, management and equity of 8.1 per cent.
However, while the Northern Tablelands representative farm model would suggest thatgreater profits could be achieved from changing enterprises as commodity prices change, inpractice various biological lags, infrastructure, financial and management constraints preventregular changes in farm enterprises. In fact, diversification amongst a variety of farmenterprises between various sheep and cattle enterprises as evidenced in the NorthernTablelands is one management response to this commodity price variability.
A hypothetical new improved-pasture technology suggested by researchers, involving theselection of pasture varieties with improved winter pasture growth, was examined using thewhole-farm model. If the existing 450 ha of improved pasture was replaced by a new varietythat gave a 10 per cent increase in winter pasture growth, this would result in a 4.9 per centincrease in farm total gross margin. This corresponds to an increase in farm cash income of6.9 per cent. These improvements in the profitability of the representative farm would beachieved by increasing the investment in first-cross ewes and in cows producing heavy feedersteers (by 3.5 per cent and 7.8 per cent respectively) and by decreasing the Merino wetherenterprise from 1,732 to 1,672 wethers. This indicates that the prime lamb and cowenterprises, under the current assumptions of the model, are better able to utilise the farmresources available given an increase in winter pasture growth.
The main conclusions from the analysis are that:
• Returns to equity are quite low in the Northern Tablelands livestock farming system;• Variable commodity prices, largely determined in world markets, result in variable levels
of profitability of the farming system over time;• The optimal farm plan is quite sensitive to small changes in the relative prices of the
different outputs produced;• In practice farm plans do not change very much as prices change, with most farms
maintaining a range of cattle and sheep enterprises;• Thus a "representative year" is a more realistic basis for assessing potential changes in
farm plans; and• New technologies can potentially have large impacts of farm profits and on the mix of
resources used and outputs produced.

1
1. Introduction1.1 Overview
This report provides a description of farming systems that are typical of the NorthernTablelands of New South Wales. The Northern Tablelands region is defined and an overviewof its land resources, climate and the major farm enterprises is provided. Given thetopography and the land and water resources available, mixed grazing farms of sheep andbeef cattle dominate the Northern Tablelands farming system.
A whole-farm perspective is a central principle of this commentary and while individual grossmargins for a range of sheep and beef enterprises are detailed, how these enterprises might becombined within the whole-farm business is emphasised. This is achieved by thedevelopment of whole-farm budgets for a representative farm that enables the examination offarm activities within physical, financial and labour constraints.
The resulting whole-farm budgets and the associated whole-farm linear program (LP) can beapplied to various policy and management questions. In this report the representative modelsare used to examine the potential farm level benefits, in the Northern Tablelands, of specificagricultural research targeted at the pasture base.
1.2 Representative Farm Analysis
Whole-farm modelling may be undertaken using a representative farm or a case study farmapproach. A representative farm is constructed from survey information from various sourcesand is designed to represent the average or typical farm, in terms of the physical, financial,labour and management resources available to it, for a defined region of interest.Alternatively a case study approach might be used, where a real farm is identified anddescribed in detail. Following the approach adopted in other reports in this series (Patton andMullen, 2001; Singh et al., 2003), the representative farm methodology is applied here.
The whole-farm budgets presented provide a picture of the profitability of the representativefarm, for a particular set of prices and costs and a particular suite of resources. As such theymay differ significantly from any actual farm regarding differing resource endowments,climatic influences, management skills, market prices and costs and the farmer’s goals,preferences and attitude to risk. Therefore, this report provides only a general perspective offarm profitability and a description of a feasible farm enterprise mix.
Another caveat on the use of these whole-farm budgets is that they are static while manyproblems related to assessing the profitability of different or new management strategies ortechnologies in the farm system are time dependent. Development budgets and cash flowbudgets are required to fully examine the economics of dynamic problems in farmingsystems, such as pasture development, fertiliser carryover, weed and pest control, andanything to do with genetic improvement in livestock.
2
2. Northern Tablelands Agriculture2.1 Area and Topography
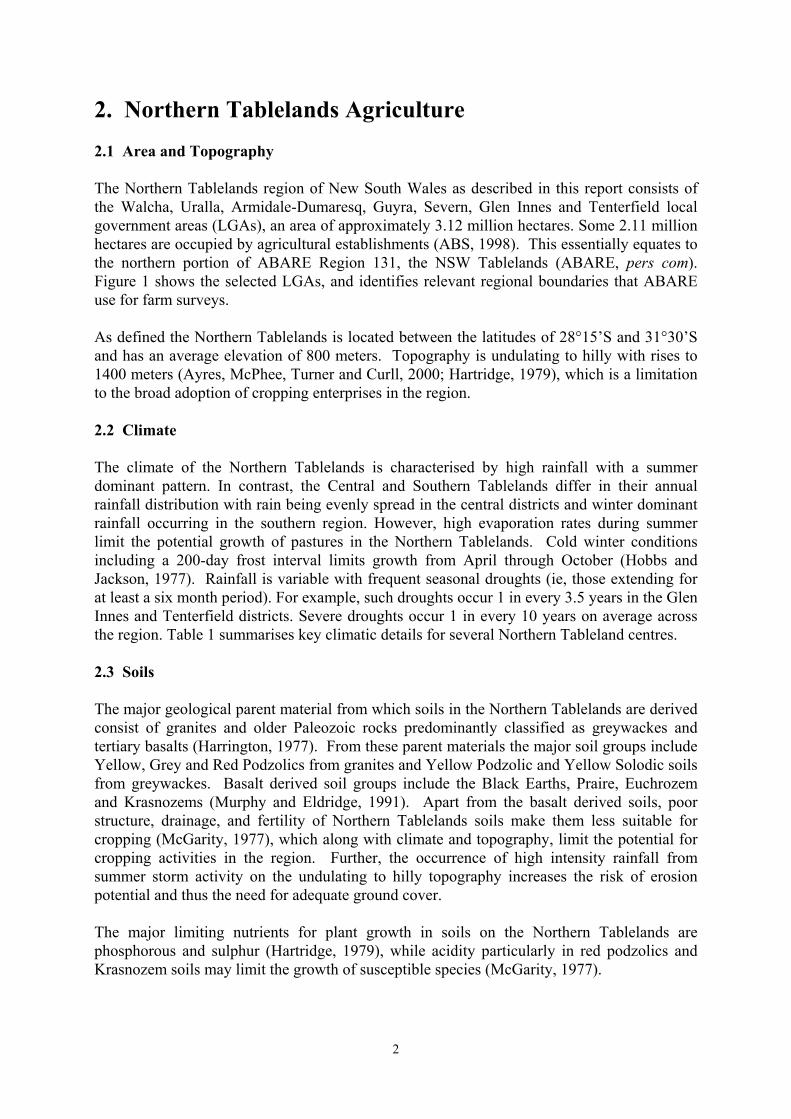
The Northern Tablelands region of New South Wales as described in this report consists ofthe Walcha, Uralla, Armidale-Dumaresq, Guyra, Severn, Glen Innes and Tenterfield localgovernment areas (LGAs), an area of approximately 3.12 million hectares. Some 2.11 millionhectares are occupied by agricultural establishments (ABS, 1998). This essentially equates tothe northern portion of ABARE Region 131, the NSW Tablelands (ABARE, pers com).Figure 1 shows the selected LGAs, and identifies relevant regional boundaries that ABAREuse for farm surveys.
As defined the Northern Tablelands is located between the latitudes of 28°15’S and 31°30’Sand has an average elevation of 800 meters. Topography is undulating to hilly with rises to1400 meters (Ayres, McPhee, Turner and Curll, 2000; Hartridge, 1979), which is a limitationto the broad adoption of cropping enterprises in the region.
2.2 Climate
The climate of the Northern Tablelands is characterised by high rainfall with a summerdominant pattern. In contrast, the Central and Southern Tablelands differ in their annualrainfall distribution with rain being evenly spread in the central districts and winter dominantrainfall occurring in the southern region. However, high evaporation rates during summerlimit the potential growth of pastures in the Northern Tablelands. Cold winter conditionsincluding a 200-day frost interval limits growth from April through October (Hobbs andJackson, 1977). Rainfall is variable with frequent seasonal droughts (ie, those extending forat least a six month period). For example, such droughts occur 1 in every 3.5 years in the GlenInnes and Tenterfield districts. Severe droughts occur 1 in every 10 years on average acrossthe region. Table 1 summarises key climatic details for several Northern Tableland centres.
2.3 Soils
The major geological parent material from which soils in the Northern Tablelands are derivedconsist of granites and older Paleozoic rocks predominantly classified as greywackes andtertiary basalts (Harrington, 1977). From these parent materials the major soil groups includeYellow, Grey and Red Podzolics from granites and Yellow Podzolic and Yellow Solodic soilsfrom greywackes. Basalt derived soil groups include the Black Earths, Praire, Euchrozemand Krasnozems (Murphy and Eldridge, 1991). Apart from the basalt derived soils, poorstructure, drainage, and fertility of Northern Tablelands soils make them less suitable forcropping (McGarity, 1977), which along with climate and topography, limit the potential forcropping activities in the region. Further, the occurrence of high intensity rainfall fromsummer storm activity on the undulating to hilly topography increases the risk of erosionpotential and thus the need for adequate ground cover.
The major limiting nutrients for plant growth in soils on the Northern Tablelands arephosphorous and sulphur (Hartridge, 1979), while acidity particularly in red podzolics andKrasnozem soils may limit the growth of susceptible species (McGarity, 1977).
3
Figure 1. The Northern Tablelands region of New South Wales
Source: NSW Agriculture
2.4 Pasture Base
The expansion of pasture improvement activities through the period 1950 to 1970 wasimportant in improving the productivity of agriculture in response to the declining terms oftrade of farmers, post-1953 (Crofts, 1997). This was especially so for Northern Tablelandsproducers who had few diversification opportunities away from sheep and cattle grazing.Such activities included the application of superphosphate and the widespread introduction ofnew pasture species including legumes.
An estimated 50 per cent of Northern Tablelands pastures are based upon natural pastures, ahigher proportion than exists on the Central and Southern Tablelands (34 per cent). This ispartly a consequence of the relatively high productivity of these pastures and grazingpractices that favour the growth of cool season perennial native grasses (Duncan, 1995;Lodge and Whalley, 1989). Archer (1995) estimated that introduced pasture species occupyonly 23 per cent of the total farm area in the Northern Tablelands.
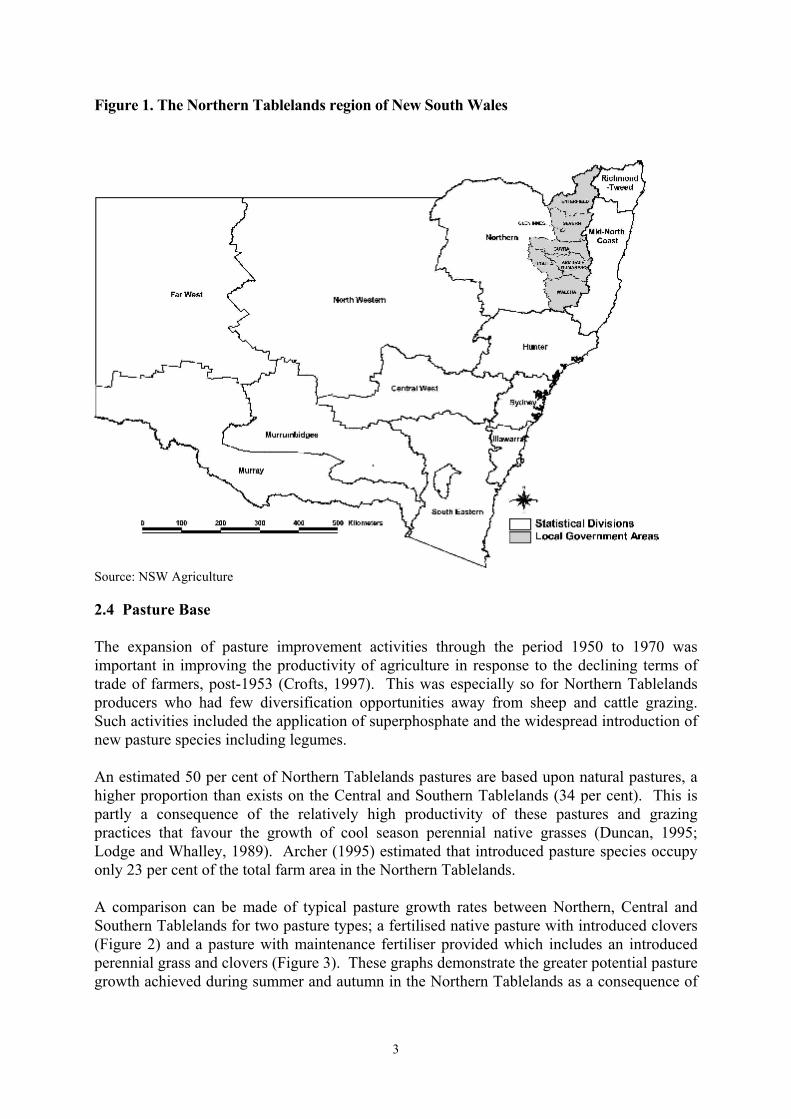
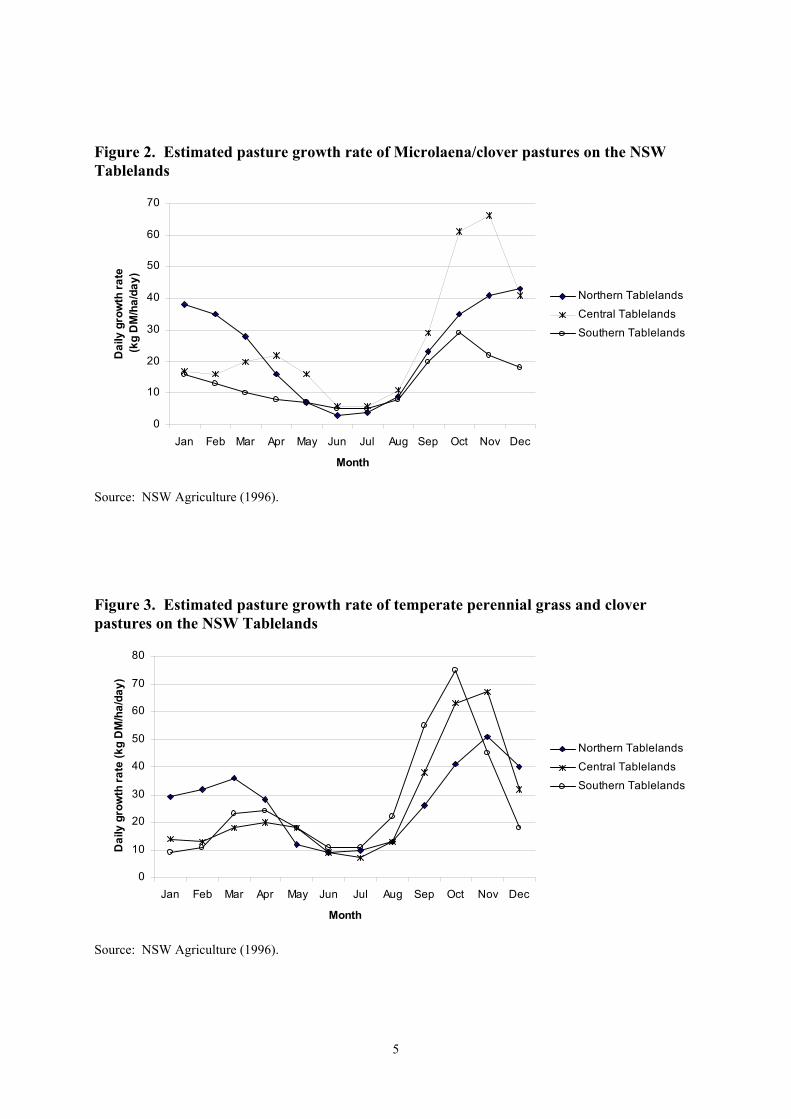
A comparison can be made of typical pasture growth rates between Northern, Central andSouthern Tablelands for two pasture types; a fertilised native pasture with introduced clovers(Figure 2) and a pasture with maintenance fertiliser provided which includes an introducedperennial grass and clovers (Figure 3). These graphs demonstrate the greater potential pasturegrowth achieved during summer and autumn in the Northern Tablelands as a consequence of

4
the summer dominated rainfall distribution pattern. Pastures in all three regions suffer duringthe cold winter months, resulting in the well-known "winter feed gap".
Table 1. Historical climatic data for Northern Tableland centres
Item Armidale Glen Innes Tenterfield Walcha EborAnnual medianrainfall (mm)
764 839 829 807 1113
Co-efficient ofVariationa ( %)
22 22 25 21 31
Av. Jan Temprange (°C)
13.8 - 26.7 13.6 – 25.9 14.7 - 26.5 na na
Av. July Temprange (°C)
0.4 – 12.7 0.4 – 12.8 0.8 - 14.4 na na
Frequency ofDrought
- seasonalb 31 in 129 yrs(0.24)
34 in 120 yrs(0.28)
38 in 130 yrs(0.29)
29 in 121 yrs(0.24)
30 in 113 yrs(0.27)
- severeb 11 in 129 yrs(0.09)
12 in 120 yrs(0.10)
12 in 130 yrs(0.09)
8 in 121 yrs(0.07)
14 in 113 yrs(0.12)
Source: Rainman software; latest data year 2000.na not availablea Coefficient of variation equals the standard deviation divided by the mean.b Drought occurrence is determined by Rainman© using a 'window' moving over the monthly rainfall totals tosee if any test period has less than the threshold value for the lowest 10 per cent of years (10th percentile) or 5per cent for severe droughts. The minimum test periods are 12 months (major), 24 months (extended), and 6months (seasonal). Seasonal droughts have starting dates that exclude the dry season; in the case of theNorthern Tablelands (March to July). Seasonal droughts are broken when the rainfall in the 6-month windowexceeds the lowest 30 per cent of yearsClewett, J.F., Smith, P.G., Partridge, I.J., George, D.A. and Peacock, A. (1999).
2.5 Regional Agricultural Issues
From the latest available agricultural census data 1996/97 (ABS, 1998) there were 2295establishments carrying out agricultural activities as defined by ABS in the NorthernTablelands region. These activities produced agricultural commodities to the value of $217.8million in 1996/97. Sheep and cattle production were the dominant agricultural enterprises inthe region, contributing 86 per cent of this total value including wool (41.7 per cent), beefcattle slaughterings (36.1 per cent) and sheep and lamb slaughterings (8.4 per cent).
Major issues for Northern Tablelands agriculture relate mainly to the economic andenvironmental sustainability of this beef and sheep grazing system. Farm profitability is anecessary prerequisite for a sustainable agricultural sector. This was recognised by theStanding Committee for Agriculture and Resource Management (SCARM) as a key indicatorfor the sustainability of agriculture (SCA, 1991). The profitability of the Australian beef andsheep industries has, like most other agricultural enterprises, been highly variable.
5
Figure 2. Estimated pasture growth rate of Microlaena/clover pastures on the NSWTablelands
0
10
20
30
40
50
60
70
Jan Feb Mar Apr May Jun Jul Aug Sep Oct Nov Dec
Month
Dai
ly g
row
th ra
te
(kg
DM
/ha/
day)
Northern TablelandsCentral TablelandsSouthern Tablelands
Source: NSW Agriculture (1996).
Figure 3. Estimated pasture growth rate of temperate perennial grass and cloverpastures on the NSW Tablelands
0
10
20
30
40
50
60
70
80
Jan Feb Mar Apr May Jun Jul Aug Sep Oct Nov Dec
Month
Dai
ly g
row
th ra
te (k
g D
M/h
a/da
y)
Northern TablelandsCentral TablelandsSouthern Tablelands
Source: NSW Agriculture (1996).

6
Numerous general economic and farm specific factors contribute to the variability in annualprofit amongst grazing properties including commodity prices and climatic variability. In thecase of industry economic factors for example, the cyclical nature of beef prices are wellrecognized (Griffith and Alford, 2002), while the removal of the wool Reserve Price Schemein 1990 and the existence of the wool stockpile throughout the 1990s would also have had animpact on the stability of prices that wool growers might face. The extent of variability inannual profits amongst Northern Tablelands producers is illustrated in Figure 4.
Figure 4. Comparison of farm business profit of Northern Tablelands sheep-beef andspecialist sheep farms over the period 1990/91 to 2000/01
-80000
-60000
-40000
-20000
0
20000
40000
60000
80000
1991
1992
1993
1994
1995
1996
1997
1998
1999
2000
2001
Farm
Bus
ines
s Pr
ofit
($)
Sheep-BeefSheep
Source: ABARE data (insufficient sample size in sheep-beef properties in 1997/98, and in specialist beefproperties over the whole sample period)
Environmental sustainability is an increasingly important concern for Northern Tablelandfarmers. Dieback in Eucalyptus trees on the Northern Tablelands was perhaps the first majorenvironmental concern recognised as resulting from European agricultural practices(Hartridge, 1979). Subsequently, other sustainability issues relevant to Northern Tablelandsproducers have included the decline in pasture productivity as well as hydrological impactson regional river catchments and some occurrence of dryland salinity and soil acidity in theregion.
In relation to pasture productivity, a survey of producers in eastern temperate regions ofAustralia found that 35 per cent recognised declining pasture quality as a problem in theirdistrict. Specifically when Glen Innes producers were asked if pasture decline was a problemon their farm, 82 per cent identified the problem (Lees and Reeve, 1994). In the same survey51 per cent of Glen Innes producers identified pasture quality decline as a problem on theirfarm. Problems cited relating to pasture quality decline included weeds (64 per cent), poorspecies persistence including legumes (58 per cent), lower pasture production (55 per cent)and less perennial legumes in pasture (41 per cent). Scott et al. (2000) studied several ofthese pasture sustainability issues for the Northern Tablelands and highlighted their potentialimpact on subsequent soil and nutrient losses.
In relation to soil quality problems, the NSW Department of Land and Water Conservation(2003) suggest that there are numerous small, scattered pockets of dryland salinity in theNorthern Tablelands. These are mainly to the west of the Great Dividing Range, and in terms

7
of Figure 1, these areas lie towards the western boundaries of the Tenterfield, Severn, Guyra,Uralla and Walcha LGAs. Acid soils are a more widespread problem on the NorthernTablelands (NSW Agriculture, 2001). These areas tend to be on the eastern side of the regionin the higher rainfall belt, although there is also an extensive area of "strongly acid" soils tothe west of Armidale. NSW Agriculture has been managing a research and advisory programcalled Acid Soil Action to combat this problem.
Generally, various government policies also have an impact upon Northern Tablelands farmbusinesses, such as farm commodity marketing arrangements particularly the wool ReservePrice Scheme up until its removal in 1990. As well, legislation aimed at land managementissues are also of potential significance to the Northern Tablelands farm sector, for examplethe NSW Native Vegetation Conservation Act 1997.
From time to time, economists are required to provide advice about the expected impacts ofnew investments in technologies applicable to grazing systems, of government policies suchas those mentioned above, or of external events such as drought conditions or a depreciationin the exchange rate. To be able to provide such advice in a credible manner, economicmodels of the relevant farming system are a useful first step in understanding the nature of thebiological and economic constraints facing producers in their decision making.
Such an economic model for the Northern Tablelands livestock farming system is describedin the following sections.

8
3. The Northern Tablelands Farming System3.1 Sources of Information
To develop the representative farm model, a variety of information sources regarding thefarming system in the Northern Tablelands were used. Farm survey data from ABARE forthe years 1990/91 to 2000/01 were obtained for the Northern Tablelands and includedspecialist sheep properties and sheep-beef properties (unpublished ABARE data). Theapplicability of this data is limited by the small number of properties and the resulting highlevel of relative standard errors associated with the data means (refer to Appendix 1). In factthe sample of specialist beef properties is not large enough to provide reliable estimates. ABSfarm census data from the 1996/97 census were also available.
NSW Agriculture district extension and research staff were also asked to list and describe themajor beef and sheep enterprises undertaken in the region. As well, they were asked toprovide estimates of production targets that might be reasonably achieved for the variouslivestock enterprises (for example, calving and lambing rates and growth rates). Informationwas also drawn from various research and extension publications and from discussions withseveral district graziers.
3.2 Characteristics of Regional Agricultural Activities
As noted above, sheep and cattle production were the dominant agricultural enterprises in theregion. Other minor commodities produced included cereal cropping, hay production, fruitand vegetables, pigs, dairy and honey activities.
The average agricultural establishment on the Northern Tablelands was 921 ha and producedagricultural commodities to the value of $94,887 in 1996/97 (ABS, 1998). In comparison theaverage farm area of beef-sheep farms sampled in the ABARE farm survey for the 2000/01 inthe Northern Tablelands region was 958 ha (standard error: ± 297 ha). Table 2 shows theaverage farm areas for various LGAs within the Northern Tablelands region. As well the1996/97 census results show that the majority of commercial farms in the NorthernTablelands operated mixed beef-sheep farms, with the exception of the Tenterfield LGAwhere fewer sheep enterprises were undertaken compared with other Northern TablelandsLGAs.
As well, agricultural holdings tend to be smaller in the Central Tablelands (Cabonne (Orange)LGA has an average holding size of 527 ha, Evans (Bathurst) LGA 529 ha, and Yass LGA588 ha). There is also increased diversification in farm activities particularly in the CentralTablelands with horticulture and viticulture having become increasingly important to thesefarm businesses in the region.
Table 3 shows the main physical attributes of the sheep-beef farms and specialist sheep farmsin the region surveyed by ABARE in 2000/01.

9
Table 2. Variation in farm size by local government area, 1997
LocalGovernmentArea
Averagearea perholding (ha)
Cattlestocking rate(hd/ha)
Sheepstocking rate(hd/ha)
Per centfarmswithcattle
Per centfarmswithsheep
Dumaresq 1070 0.33 2.12 70 67Guyra 850 0.35 2.38 70 82Severn 880 0.34 1.51 72 69Tenterfield 893 0.29 0.60 75 27Uralla 899 0.26 2.94 68 83Walcha 1098 0.41 2.08 80 66
Source: ABS (1998)Stocking rates estimated as total numbers of cattle and sheep in each LGA as at March 31, divided by the area ofeach LGA.
Table 3. Physical characteristics of sheep-beef and sheep farms surveyed by ABARE inthe Northern Tablelands in 2000/01
Physical characteristics Sheep-Beef Sheepunit mean ± Std. Error Mean ± Std. Error
Closing area operated Ha 958 297 611 18Closing sheep numbers No. 4549 1083 3114 93 - ewes No. 2089 503 1206 470 - lambs No. 1167 368 406 256 - rams No. 43 19 20 10 - wethers No. 1251 530 1482 637Closing beef cattle numbers No. 250 70 101 20 - bulls No. 5 1 1 . - calves No. 52 26 27 7 - cows No. 126 27 44 10 - replacement heifers No. 34 9 6 . - other No. 33 18 23 3Other grain production Tonnes 29 28 0 .No. sheep sold No. 1223 60 1058 719No. prime lambs sold No. 40 58 652 763No. other lambs sold No. 267 226 21 .No. beef cattle sold No. 121 23 20 2No. of sheep and lambs shorn No. 4426 1005 3211 225No. ewes mated No. 1715 295 983 482No. of lambs marked No. 1460 197 888 719Lambing rate % 87 12 87 12Wool produced kg 16417 5401 12321 1848Amount of labour used weeks 146 50 99 2Number sampled 5 5
Source: ABARE (unpublished data)
10
Based on the foregoing discussion, the Northern Tablelands representative farm model isassumed to have an area of 920 hectares, managed by an owner/operator with further part-time assistance from family labour. This farm has a mix of native and improved pasture, andruns a mix of sheep and cattle enterprises. These aspects of the model farm are detailedimmediately below. The overheads, assets and liabilities of the farm are detailed in Section 4.
3.3 Description of the Various Beef, Sheep and Pasture Activities
The Northern Tablelands growing season and locality influence the types of beef and sheepenterprises carried out. In the case of beef cattle production, British breed cattle predominatewith some European breeds used for cross-breeding. Traditional enterprises have includedstore weaner breeding resulting in autumn weaner sales both to local, north-western slopes,southern NSW, Queensland and Victorian producers who finish the stock (Llewellyn andDavies, 2001). Recently, the development of large feedlots in northern NSW and southernQueensland have provided the opportunity for Northern Tablelands producers to retain stockto grow to reach the regional feeder steer market. The supermarket, European Union andgrass-fed Japanese bullock markets have grown in importance (Llewellyn and Davies, 2001),while some specialisation by producers as ‘backgrounders’ of cattle for feedlots is alsooccurring.
Northern Tablelands sheep activities include a wide variety of enterprises with Merino woolparticularly fine wool (18-19 micron) and prime lamb production dominating. Super-finewool production and first-cross ewe production are also carried out on the NorthernTablelands.
Introduced perennial pasture species, native pasture species and forage crops are utilised onNorthern Tablelands farms. Assumptions regarding pasture types, establishment andmaintenance practices and their performance were derived from a variety of sources includingdiscussions with several district graziers, NSW Agriculture extension and researchagronomists and publications, in particular Lowien, Duncan, Collett and McDonald (1997)and NSW Agriculture (1996). These assumptions are detailed later.
3.3.1 NorthernTablelands Beef Activities Included as Options in the Farm Model
Specialist local trade – occurring in the higher rainfall districts of the region where cows arejoined to calve in July and early August to produce vealers at approximately 9 months of ageand 180 kg (d.w). These are heavier and better finished than weaners. Replacement cross-bred heifers are purchased in-calf (see Appendix B for more detail on these enterpriseoptions).
Inland Weaners – cows are joined to calve in late July and August, and heifers are joined tocalve at 2 years of age. Steers and heifers are sold at 9 months weighing approximately 240-250kg (lw.) for growing and finishing in other regions or locally.
Young Cattle 15-20 months (moderate growth) – cows are joined to calve in August andSeptember to producing yearlings, and heifers are joined to calve at 2 years of age. These aresold at about 18 months of age weighing approximately 260 kg (d.w). Target markets forthese cattle include the supermarket and wholesale trades.
11
Heavy Feeder Steers (Young Cattle 0-2 teeth) – cows are joined to calve in August andSeptember, and heifers are joined to calve at 2 years of age. Heifers are sold as weaners ataround nine months of age, while steers are sold at approximately 18 months of age at 440-450 kg (lw.) suitable for entry into feedlots.
3.3.2 Northern Tablelands Sheep Activities Included as Options in the Farm Model
Self Replacing Merino Ewes – a self-replacing 19 micron ewe flock is joined to lamb in lateAugust and September. Wether hoggets and excess ewe hoggets are sold at 18 months of age.Ewes are culled for age at 51/2 years of age.
Prime Lamb Production – First cross ewes (Merino x Border Leicester) are joined to a shortwool terminal sire (eg., Poll Dorset) to produce second cross lambs for sale at approximately6 months of age. Lambing occurs in late August to early October. Ewes are purchased at 18months of age and joined to lamb at 2 years. Ewes are culled for age at 51/2 years of age.
Merino Wethers – 19 micron wethers are purchased as hoggets and culled for age at 51/2 yearsof age. In the model an average live weight for wethers is assumed to be 45 kg. They areassumed to be shorn in November.
Pre-lamb shearing of ewes on the Northern Tablelands is still generally practised within 4 to 8weeks of lambing, while shearing of wethers may occur at other times of the year. For thepurpose of the representative farm, shearing of ewes is assumed to occur prior to lambing andwethers are assumed shorn in October. Ewes have traditionally been shorn prior to lambingas a means of reducing casting in pregnant ewes and to improve lamb suckling (Miller, 1991)as well as to reduce the incidence of breaks in the middle of the fibre. An alternative view onthe appropriate time to shear in summer rainfall dominant regions such as the NorthernTablelands is to shear in summer to reduce the incidence of fly strike and seed burden in thefleece (Bell, 1991; Bob Marchant, NSW Agriculture, pers com). However discussions withdistrict extension personnel and graziers indicated that the late winter shearing of ewesremains the predominate practice in the region.
3.3.3 Northern Tablelands Pasture Activities Included in the Farm Model
Native pasture – Native pastures including Red grass and Microlaena pastures with someclovers present based on soils of naturally moderate fertility. Maintenance fertilizerapplications are assumed to be applied at half the recommended rate. Assumed to occur on440 ha or 48 percent of the model farm area (920 ha).
Introduced pasture – Fescue/Phalaris grass dominated pastures with at least 20 per cent ofbase dry matter present as white or sub clover. These pastures are based upon soils ofmoderate to good fertility with annual applications of maintenance fertiliser. Assumed tocover 450 ha or 49 per cent of the total area.
Forage Oats – Sown in February on moderate to good fertility soils with recommendedfertiliser rates. Oats is assumed to be sown on 30 ha of the farm or 3 per cent of the farmarea.

12
3.4 Enterprise Budgets for the Cattle, Sheep and Pasture Activities Included as Optionsin the Farm Model
Enterprise budgets were developed for each of the possible cattle, sheep and pasture activitiesincluded as options in the farm model. These are all reported in Appendix B. In preparingthese budgets, the prices used were based on data over an extended period of time butexpressed in 2001 dollar terms. Thus, these budgets could be termed budgets for a“representative year”.
The reason for adopting this approach is because the returns from the various enterprises areextremely variable from year to year. Thus, the optimal farm plans would also vary from oneyear to the next based upon a profit-maximising response to these large commodity pricechanges. However, sheep and cattle producers are relatively constrained in their ability tochange their enterprise mix in the short and medium terms. Breeding enterprises in particularrequire an extended period of time to introduce or expand as a consequence of biologicalconstraints. Typically such enterprises are expanded by holding onto young females abovethe number required to simply maintain the current breeding flock or herd size. This limitsthe ability of producers to move into or out of a breeding enterprise in the short and mediumterms.
Thus, a farmer’s decision to invest in particular animal enterprises is necessarily based ontheir experience over the longer term with regard to an enterprises’ profitability, physical andenvironmental constraints of a particular farm. As well, the farm manager’s personalpreferences, skills, goals and attitude to risk, are also important.
Therefore commodity prices in any single year are not necessarily the relevant factors indetermining the optimal enterprise mix on farms such as those on the Northern Tablelands.Rather it is more likely that as far as price drives farmer enterprise choice, such producerexpectations are based upon a number of years of commodity price observation.
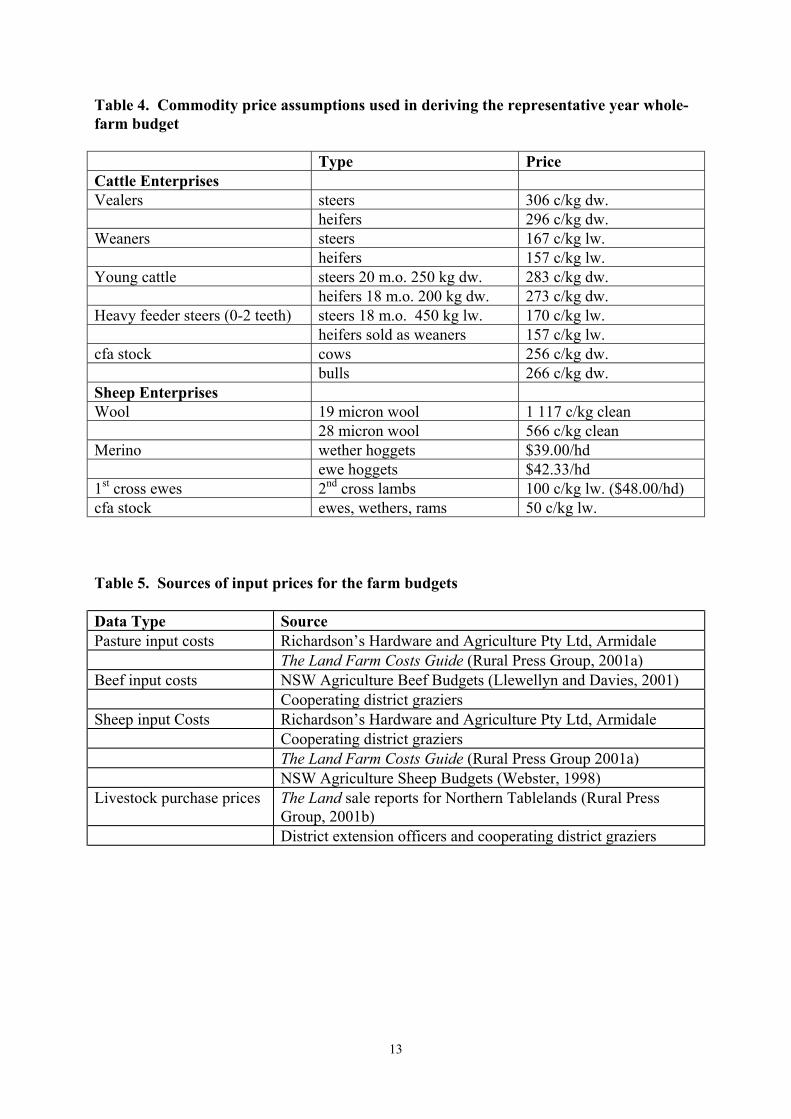
Therefore, producer price expectations were assumed to be formed over a period of severalyears. Specifically, the historical prices for beef and sheep sales were derived from AMLC(AMLC, 1997) and MLA (MLA, various issues) statistics for NSW for the various classes oflivestock product over the period 1995 to 2001. Similarly the wool prices used were theaverage annual clean price for the relevant microns (19 and 28 microns) from WoolInternational and Australian Wool Exchange over the period 1995/96 to 2001/02 (ABARE,2003). Prices for replacement stock such as bulls, wether hoggets and first-cross ewes wereobtained from sampling sale reports and classified advertisements from The Land newspaper(various issues) and from NSW Agriculture beef and sheep budgets over the period 1994 to2001. All prices are expressed in 2001 dollar terms. The resulting average prices for themajor farm outputs for Northern Tablelands region are provided in Table 5.
The representative year whole-farm budgets used 2001 farm costs. These farm input priceswere obtained from a variety of sources as detailed in Table 6, while Appendix B details theenterprise gross margins including the costs used. Other price scenarios were examined andthese are detailed in Section 4.
13
Table 4. Commodity price assumptions used in deriving the representative year whole-farm budget
Type PriceCattle EnterprisesVealers steers 306 c/kg dw.
heifers 296 c/kg dw.Weaners steers 167 c/kg lw.
heifers 157 c/kg lw.Young cattle steers 20 m.o. 250 kg dw. 283 c/kg dw.
heifers 18 m.o. 200 kg dw. 273 c/kg dw.Heavy feeder steers (0-2 teeth) steers 18 m.o. 450 kg lw. 170 c/kg lw.
heifers sold as weaners 157 c/kg lw.cfa stock cows 256 c/kg dw.
bulls 266 c/kg dw.Sheep EnterprisesWool 19 micron wool 1 117 c/kg clean
28 micron wool 566 c/kg cleanMerino wether hoggets $39.00/hd
ewe hoggets $42.33/hd1st cross ewes 2nd cross lambs 100 c/kg lw. ($48.00/hd)cfa stock ewes, wethers, rams 50 c/kg lw.
Table 5. Sources of input prices for the farm budgets
Data Type SourcePasture input costs Richardson’s Hardware and Agriculture Pty Ltd, Armidale
The Land Farm Costs Guide (Rural Press Group, 2001a)Beef input costs NSW Agriculture Beef Budgets (Llewellyn and Davies, 2001)
Cooperating district graziersSheep input Costs Richardson’s Hardware and Agriculture Pty Ltd, Armidale
Cooperating district graziersThe Land Farm Costs Guide (Rural Press Group 2001a)NSW Agriculture Sheep Budgets (Webster, 1998)
Livestock purchase prices The Land sale reports for Northern Tablelands (Rural PressGroup, 2001b)District extension officers and cooperating district graziers
14
3.5 The Northern Tablelands Whole-Farm Linear Program
The Northern Tablelands farming system described above is quite complex. There are anumber of possible sheep and cattle enterprises that compete for different types of pasture andfor other farm resources. In such circumstances, it is useful to also model the farming systemin a linear programming framework. Linear programming allows the joint evaluation ofconcurrent farm activities, while considering the costs and returns of all enterprises and anyresource adjustments imposed by adoption of the technology. In this farming system, thewhole-farm focus incorporates various aspects of the pasture base, resource constraints andsheep and cattle interactions. Such a characterisation is particularly useful when the task is toevaluate the potential benefits of a new technology that may be appropriate for this farmingsystem.
Therefore, a Northern Tablelands linear programming (NTLP) model is constructed torepresent a typical beef-sheep farm on the Northern Tablelands of New South Wales. It isderived from the Department of Natural Resources and Environment’s whole-farm LP forvarious pastoral regions of Victoria as well as from previous LP models includingFarquharson (1991). The NTLP model uses the same approach as in MIDAS (Kingwell andPannell, 1987), in which the farm system is based upon a single year in equilibrium for whichvarious beef and sheep enterprises and management strategies are selected to maximise thefarm’s total gross margin. Calendar months are used as the time unit for farm activities.
The grazing enterprises included as options are those which are common in the NorthernTablelands grazing system as identified by regional agricultural advisors and researchers andsome local graziers. The management practices are based upon “best management practices”as described by NSW Agriculture officers, however management targets may be altered in themodel, such as herd of flock reproductive performance, animal growth rates and pasturegrowth rates. Similarly, management strategies such as timing of calving or lambing can alsobe adjusted.
The basic NTLP matrix includes some 166 activities and 112 constraints. Three sheepactivities and four cattle activities are available for selection, as outlined above. In the matrixa large proportion of the activities are related to feed transfers between months and fodderconservation actions. The supplementary feeding of livestock also necessitates significantdetail. Pasture production and supplementary feeding assumptions included in the LP areprovided in Appendices B and C. Following the method used to outline the MIDAS model(Kingwell and Pannell, 1987), Table 6 provides an overview of the general structure of theNTLP matrix and the proportion of activities and constraints allotted to various componentsof the LP.
Further details of the Northern Tablelands LP model are provided in the companion EconomicResearch Report (Alford, Griffith and Cacho, 2003).

15
Table 6. Outline of the structure of the Northern Tablelands linear program matrix
Pasture types(3)
ChooseSheep
enterprises(6)*
ChooseCattle
enterprises(8)*
CasualLabour
Requirement(12)
Pasture feedconsumed ortransferred
(72)
Hay/Silageactivities -
make/buy/sell (6)
Feed outfodder (24)
Buy/feedgrain (12)
Sell animalproducts (23)
Sign RHSterm
Land area (1) Ha 1 = Area
Pasture typeareas (3)
Ha 1 <= Area
Fodderconstraints (4)
1 <= Area
Fodder poolsHay/grain (2)
MJ -a, +a +a <= 0
Thresholdenterprise levels(7)
1,-a 1,-a
Pastureproduction (36)
MJ -a +a, -a <= 0
Feed Pool (12) MJ +a +a -a -a -a <= 0
Max. DryMatter Intake(12)
T DM +a +a -1 -1 -1 >= 0
Labourconstraints (12)
Hrs +a +a -1 <= Maxpermanent
labourAnimal Outputs(23)
Kg orHead
-a -a 1 = 0
Numbers in parentheses refer to numbers of rows or columns in matrix.“a” and “1” refers to the coefficients in matrix. Sign refers to type of constraint either equality or inequality in matrix.* includes binary integers to incorporate minimum enterprise sizes (500 breeding units or wethers for sheep enterprises and 100 breeding cows for cattle enterprises).Outline follows Kingwell (1987).

16
4. The Northern Tablelands Representative Farm ModelIn this section the objective is to describe a representative farm model of a livestock propertyon the Northern Tablelands of New South Wales. As noted above, the Northern Tablelandsrepresentative farm model is assumed to have an area of 920 hectares, managed by anowner/operator with further part-time assistance from family labour. This farm has a mix ofnative and improved pasture, and runs a mix of sheep and cattle enterprises. In this section theenterprise mix is described as well as the overhead costs, the annual operating budget and thestatement of assets and liabilities of the farm.
4.1 The Representative Farm Model
The wide range of sheep and cattle enterprises from which producers on the NorthernTablelands can choose has already been described. In developing the representative farmmodel, one of the many possible enterprise mixes was chosen as being typical of the area. Inmaking this choice, guidance was received from the published ABS and ABARE statistics,from the views of local graziers and NSW Agriculture extension officers, and fromsimulations of a profit-maximising farm plan generated by the NTLP model.
4.1.1 The Representative Farm Plan
The optimal farm plan for the representative year to maximise farm total gross margin usinglong run commodity price averages was determined by the NTLP model to include threeenterprises. These were 1 108 first-cross ewes, 1 732 Merino wethers and a beef herd of 127cows producing 18 month old steers at 448kg liveweight and excess heifers sold as 9 monthold weaners. See Alford et al. (2003) for details. This farm plan was taken back to the localadvisory and research staff and they all agreed that such an enterprise mix was broadlyrepresentative of the Northern Tablelands grazing system. Thus, it was adopted as therepresentative farm plan.
Compared with the 1996/97 ABS data quoted above, the model under-predicts the size of thewool enterprise and over-predicts the size of the lamb enterprise, with the cattle enterprisealmost exactly right. These differences reflect the problems mentioned previously ofcomparing the economic structure of the farming system in a particular year versus that in amore "representative" year.
4.1.2 The Whole-Farm Operating Budget
The whole–farm budget for the representative farm for the Northern Tablelands includes astatement of assets and liabilities and an annual operating budget. The operating budgetincludes the cash income and costs associated with each of the farm enterprises as well as thefixed costs incurred for running the farm over the year to derive the farm cash income. Anallowance for depreciation (based on 10 per cent of the value of the farm’s plant andequipment) along with interest costs are deducted from farm cash income to determine farmoperating surplus. Family labour may also be accounted for by subtracting an allowance fromthe farm cash income (Makeham and Malcolm, 1993). However, in this report no familylabour allowance has been subtracted and the resulting farm operating surplus represents areturn on owner-operated labour, management and farm assets. Labour requirements in excess

17
of owner-operated labour availability are purchased at a casual labour rate. Labour budgetsfor various enterprises are detailed in Alford, Cacho and Griffith (2003).
Pasture costs have not been apportioned to the specific animal enterprises and thereforeappear as separate negative gross margins. Similarly, supplementary feeding costs and fodderconservation activities determined by the LP (based upon monthly ME requirements of theanimals) were not attributed to a specific animal enterprise but are listed as a separatenegative gross margin.
Assumptions regarding the typical overhead costs and debt levels were formed fromexamination of ABARE survey data for the Northern Tablelands. Average values weredetermined from the 1990/91 to 2000/01 survey data expressed in 2000/01 dollar terms.These were compared with data from farm business management workshops run during 2000and 2001 by one of the regional extension officers, to confirm that the average valuesdetermined fell within the ranges obtained from these workshops (Marchant, pers com). Anexamination of the relative standard errors estimated by ABARE indicates the variability inthe cost overheads that exists between farm businesses.
For this farm plan, the representative year annual operating budget (Table 7) shows a totalgross margin for the farm of $86, 191 and total overhead costs for the year of $24, 720. Thisresults in a farm cash income of $61, 471 and a farm operating surplus of $37, 471 afterdepreciation and interest costs. Note that no allowance for operator and family labour hasbeen made in this case.
The farm operating surplus achieved on this model farm as a percentage of the owner’s equityis 2.7 per cent in the representative year. This represents a return on operator and familylabour, management and equity. Low returns to equity are typical of Australian broadacreagriculture, and more particularly of specialist livestock producers (Riley, Gleeson, Martinand Delforce, 2001).
4.1.3 Assets and Liabilities of the Representative Farm
The statement of assets and liabilities is based upon estimates of the various capital itemsincluding land, livestock and plant and machinery and farm structures determined from thesources previously described. They would require careful re-estimation if applied to anyparticular farm.
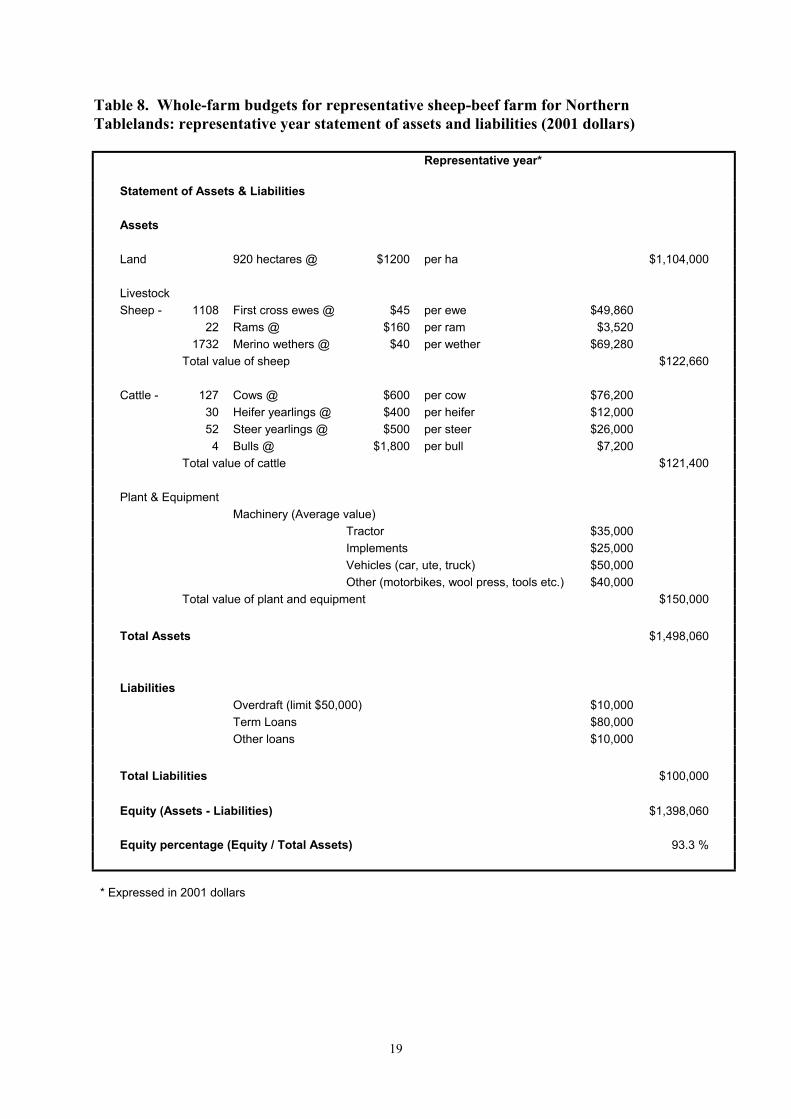
The representative year statement of assets and liabilities (Table 8) shows total assets of thefarm to be $1, 498, 060 and liabilities of $100, 000 which equates to an equity level of 93.3per cent. ABARE survey data suggest that Northern Tablelands pastoral farms typically havehigh levels of equity, with an average level of equity over the 11 years 1990/1 to 2000/1 of 90per cent, from those farms surveyed.

18
Table 7. Whole-farm budgets for representative sheep-beef farm for NorthernTablelands: representative year annual operating budget (2001 dollars)
Representative Year* Annual Operating Budget 920 ha Total farm Enterprise Gross Margins Prime Lamb Production 1 108 ewes $43.71 $48,430
Merino wethers (19 micron) 1 732 wethers $19.65 $34,034 Young cattle (heavy feeder steers) 127 cows $419.26 $53,246 Perennial pasture 450 ha -$67.78 -$30,501 Annual pasture 30 ha -$161.98 -$4,859 Native pasture 440 ha -$25.40 -$11,176 Suppl. feed and fodder conservation -$2,983 Total Farm Gross Margin: $86,191 Overhead Costs Casual wages (36 hrs @ $20 /hr) $ 720 Rates $4,300 Registration $1,500 Insurance (vehicle, building) $1,500 R&M $9,000 Other fuel costs $3,700 Other (elect, phone, etc) $4,000 Total Overhead Costs: $24,720 Farm Cash Income $61,471 Operating Costs Depreciation $15,000 Interest $9,000 Operator and family labour $0 Farm Operating Surplus $37,471 Business Return on Operator's Labour, Management and Equity 2.7 %
* Expressed in 2001 dollars
19
Table 8. Whole-farm budgets for representative sheep-beef farm for NorthernTablelands: representative year statement of assets and liabilities (2001 dollars)
Representative year*
Statement of Assets & Liabilities Assets Land 920 hectares @ $1200 per ha $1,104,000 Livestock Sheep - 1108 First cross ewes @ $45 per ewe $49,860 22 Rams @ $160 per ram $3,520 1732 Merino wethers @ $40 per wether $69,280 Total value of sheep $122,660 Cattle - 127 Cows @ $600 per cow $76,200 30 Heifer yearlings @ $400 per heifer $12,000 52 Steer yearlings @ $500 per steer $26,000 4 Bulls @ $1,800 per bull $7,200 Total value of cattle $121,400 Plant & Equipment Machinery (Average value) Tractor $35,000 Implements $25,000 Vehicles (car, ute, truck) $50,000 Other (motorbikes, wool press, tools etc.) $40,000 Total value of plant and equipment $150,000 Total Assets $1,498,060 Liabilities Overdraft (limit $50,000) $10,000 Term Loans $80,000 Other loans $10,000 Total Liabilities $100,000 Equity (Assets - Liabilities) $1,398,060 Equity percentage (Equity / Total Assets) 93.3 %
* Expressed in 2001 dollars

20
4.2 Sensitivity Analysis
In this section, a number of other scenarios are examined. These include the effect of changesin price assumptions underlying the representative year whole-farm budget, for the specifiedset of enterprises; the relative improvement in enterprise gross margin required for a non-specified enterprise to be selected into the representative year optimal farm plan; and theeffect of changes in price assumptions for different base years.
4.2.1 Profit Drivers of the Representative Farm
Examining the effect of changes in price assumptions underlying the representative yearwhole-farm budget provides an opportunity to examine some of the profit drivers of the farmmodel described in this report. The sensitivity analysis was carried out, post-optimally, bydetermining the effect on farm operating surplus if there were a 10 per cent favourable shift inrelevant commodity prices for the enterprises listed in Table 7. That is, given the relativeinflexibility in the short term of farm enterprises, how is the representative year farm plan(enterprise mix remains fixed) affected by changes in commodity prices.
Given the broadly similar investment in wool, prime lamb and beef production in the optimalfarm plan for the representative year, a 10 per cent increase in either the price of sheep, woolor beef results in increases in farm operating surplus for the representative farm of similarmagnitudes (Table 9). A 10 per cent increase in sheep sale prices or wool price results in thefarm operating surplus increasing by 18.2 per cent and 19.7 per cent respectively, while a 10per cent increase in beef prices results in a 15.9 per cent increase in farm operating surplus.In the case of farm costs a 10 per cent increase in fertilizer costs causes a 10.2 per centdecrease in farm operating surplus.
Table 9. Profit drivers of the representative farm
Assumption Per Cent Change in Farm OperatingSurplus
10 per cent increase in sheep slaughter price 18.210 per cent increase wool price 19.710 per cent increase in cattle price 15.910 per cent increase in fertilizer costs -10.2
4.2.2 Sensitivity of the Representative Farm Plan to Price Assumptions
The optimal farm plan for the representative farm determined from the LP is sensitive torelatively small changes in input or output prices and production parameters. For example,for the representative year, small improvements in a number of the individual enterprise grossmargins relative to the enterprises that are selected in the representative model would result inthem displacing the currently selected enterprises. This is illustrated by the results of asensitivity analysis using the LP model (Table 10) to determine the relative improvement inenterprise gross margin required for that activity to be selected into the representative yearoptimal farm plan, given the prescribed minimum enterprise size thresholds. With theexception of the beef weaner enterprise, the other available livestock enterprises require lessthan a 5 per cent improvement in the respective gross margins to be included in an optimalfarm plan.

21
The relatively similar profitability levels between most of the sheep and beef enterpriseoptions would be anticipated. The enterprises were all identified by local graziers andadvisory staff as being common on the Northern Tablelands. If one or two enterprises weresignificantly more profitable over a number of years then it would be anticipated that themajority of Northern Tablelands producers would have concentrated their farm investment inthose specific enterprises. Further, the relatively small differences in enterprise profitabilitywhen viewed in a whole-farm context also reflect the similar resource requirements that eachof the enterprises have, making them readily substitutable.
Table 10. Relative improvement in enterprise gross margins required to be selected inthe optimal farm plan for the representative year
Enterprise $ Improvement in GM perbreeding unit
Per cent Improvementin Enterprise GM
Self Replacing Merinos 1.61 3.0Specialist Local Trade 10.67 3.5Weaners 60.31 19.3Young Cattle (18-20 month) 18.30 4.1
It should also be noted that a limitation of the LP is that being a model it is necessarily asimplification of the real world and does not capture all interactions that occur within thewhole farm. A set of farm enterprises may be selected by an individual farmer to meet goalsother than profitability alone, such as personal preference, labour requirements andmanagement knowledge. As well the model may not capture the vast number of interactionssuch as the benefits arising from the complementary grazing effect of beef and sheepenterprises; the reduction in risk; and farmer preferences in breeding their own Merinowethers or replacement cows.
4.2.3 Whole-Farm Budget for the Northern Tablelands Representative Farm: 2002 Year
As a contrast to the optimal plan obtained for the "representative" year, the LP was re-runusing the actual 2002 prices for commodities as published in NSW Agriculture beef and sheepgross margins (NSW Agriculture, 2003), as summarised in Table 11. Since farm costs in therepresentative year budgets are expressed in 2001 dollar terms, for 2002 these costs wereinflated by 2.5 per cent which is the increase in prices paid by farmers between 2000/01 and2001/02 (ABARE, 2003). The optimal farm plan based upon 2002 commodity prices isshown in Table 12 and includes a Prime Lamb producing enterprise of 1,558 first-cross ewesand a flock of 3,595 Merino wethers. Interestingly, no cattle enterprises are included in theoptimal plan for the representative farm for this particular data set.
The 2002 annual operating budget for the representative farm is given in Table 12. Based on2002 market prices, this farm enterprise mix achieved a total gross margin of $165,736. Afteroverhead costs, depreciation and interest costs there was a farm operating surplus of$111,818. Based on equity totalling $1,372,870, this operating surplus represents a businessreturn on operator labour, management and equity of 8.1 per cent.
The 2002 statement of assets and liabilities for the representative farm is provided in Table13, the same as that used in the representative year.
22
As previously discussed this optimal plan is based entirely on the objective of maximising therepresentative farm’s total gross margin and does not account for the farmer’s goals,preference and attitude towards risk.
Table 11. Commodity prices used in 2002 budget
Type PriceCattle EnterprisesVealers steers 280 c/kg dw.
heifers 270 c/kg dw.Weaners steers 125 c/kg lw.
heifers 110 c/kg lw.Young cattle steers 20 m.o. 250 kg dw. 270 c/kg dw.
heifers 18 m.o. 200 kg dw. 260 c/kg dw.Heavy feeder steers (0-2teeth)
steers 18 m.o. 450 kg lw. 145 c/kg lw.
heifers sold as weaners 110 c/kg lw.cfa stock cows 250 c/kg dw.
bulls 275 c/kg dw.Sheep EnterprisesWool 19 micron wool 1 060 c/kg clean
28 micron wool 858 c/kg cleanMerino wether hoggets $55.00/hd
ewe hoggets $60.00/hd1st cross ewes 2nd cross lambs 153 c/kg lw. ($73.2/hd)cfa stock ewes, wethers, rams 112 c/kg lw.
4.2.4 Whole-Farm Budgets for the Northern Tablelands Representative Farm: 2003 Year
The sensitivity of the farm model to future commodity price scenarios was examined byincorporating ABARE forecast commodity price changes for 2003 over 2002. For beef thiswas (+2.1 per cent), for lamb (+8.3 per cent), for mutton (-22.0 per cent) and for wool (+4.6per cent) (T. Gleeson, ABARE, pers comm). Farm costs were again inflated by 2.5 per centover the 2002 costs, assuming the same rate of farm cost inflation as determined over theperiod 2000/01 to 2001/02 (ABARE, 2003).
As a result of these commodity price forecasts and the assumed increase in farm costs theoptimal farm plan is the same as the enterprise mix determined for the 2002 year, with 1,558first-cross ewes and 3,595 Merino wethers (see Table 14). The resulting total farm grossmargin is $164,475 and a farm operating surplus of $109,438. Assuming the same values asused in the 2002 Assets and Liabilities (Table 13) the business return on operator’s labour,management and equity is 8.0 per cent.
23
Table 12. Whole-farm budgets for representative sheep-beef farm for NorthernTablelands: 2002 annual operating budget
For the year Jan-Dec 2002
Annual Operating Budget 920 ha Total farm Enterprise Gross Margins Prime Lamb Production 1 558 ewes $84.33 $131,386 Merino wethers (19 micron) 3 595 wethers $23.70 $85,202 Perennial pasture 450 ha -$69.47 -$31,262 Annual pasture 30 ha -$166.02 -$4,981 Native pasture 440 ha -$26.03 -$11,453 Suppl. feed and fodder conservation -$3,156 Total Farm Gross Margin: $165,736 Overhead Costs Casual wages (241 hrs @ $20.50 /hr) $4,941 Rates $4,408 Registration $1,538 Insurance (vehicle, building) $1,538 R&M $9,225 Other fuel costs $3,793 Other (elect, phone, etc) $4,100 Total Overhead Costs: $29,543 Farm Cash Income $136,193 Operating Costs Depreciation $15,375 Interest $9,000 Operator and family labour $0 Farm Operating Surplus $111,818 Business Return on Operator's Labour, Management and Equity 8.1 %

24
Table 13. Whole-farm budgets for representative sheep-beef farm for NorthernTablelands: 2002 statement of assets and liabilities
For the year Jan-Dec 2002 Statement of Assets & Liabilities Assets Land 920 hectares @ $1200 per ha $1,104,000 Livestock Sheep - 1,558 First cross ewes @ $45 per ewe $70,110 31 Rams @ $160 per ram $4,960 3,595 Merino wethers @ $40 per wether $143,800 Total value of sheep $218,870 Plant & Equipment Machinery (Average value) Tractor $35,000 Implements $25,000 Vehicles (car, ute, truck) $50,000 Other (motorbikes, wool press, tools etc.) $40,000 Total value of plant and equipment $150,000 Total Assets $1,472,870 Liabilities Overdraft (limit $50,000) $10,000 Term Loans $80,000 Other loans $10,000 Total Liabilities $100,000 Equity (Assets - Liabilities) $1,372,870
Equity percentage (Equity / TotalAssets) 93.2 %
25
Table 14. Whole-farm budgets for representative sheep-beef farm for NorthernTablelands: 2003 annual operating budget
For the year Jan-Dec 2003
Annual Operating Budget 920 ha Total farm Enterprise Gross Margins Prime Lamb Production 1 558 ewes $87.92 $136,979
Merino wethers (19 micron) 3 595 wethers $22.14 $79,593 Perennial pasture 450 ha -$71.17 -$32,027 Annual pasture 30 ha -$170.07 -$5,102 Native pasture 440 ha -$26.67 -$11,735
Supplementary feed and fodderconservation -$3,233
Total Farm Gross Margin: $164,475 Overhead Costs Casual wages (241 hrs @ $21.00 /hr) $5,061 Rates $4,518 Registration $1,576 Insurance (vehicle, building) $1,576 R&M $9,456 Other fuel costs $3,888 Other (elect, phone, etc) $4,203 Total Overhead Costs: $30,278 Farm Cash Income $134,197 Operating Costs Depreciation $15,759 Interest $9,000 Operator and family labour $0 Farm Operating Surplus $109,438
Business Return on Operator's Labour, Management and Equity 8.0 %

26
5. Economic Evaluation of New Technologies at the FarmLevel – Example Application of the Northern TablelandsWhole-Farm Model5.1 Introduction
Declining terms of trade for Australian farmers require farm managers to continually increaseproductivity through the application of new production technologies on the farm. Farm-levelevaluation of a new technology using LP has the ability to jointly evaluate concurrent farmactivities, considering the costs and returns of all enterprises and the resource adjustmentimposed by adoption of the technology (Griffith et al., 1995).
The following case study applies the whole-farm budgets developed in this report and theNorthern Tablelands LP to estimate the likely economic benefits of a hypothetical pasturetechnology that could be applied to Northern Tablelands farming systems.
5.2 Case Study– Improvement in Winter Pasture Growth
The representative farm model along with the associated LP can account for the opportunitycost of feed supply within a year since pasture growth is based upon calendar months.Therefore it is a suitable basis for ex ante estimation of new technologies aimed at improvingpasture base productivity.
Within the last two decades various reviews of research priorities for Australia’s pasture basehave been undertaken (for example, Wheeler et al. (1987) and Kemp (1994)). A productionlimitation recognised in the high rainfall regions of the New South Wales tablelands is therelatively low growth rates of introduced pastures species through the winter period.
Recently, Ayres et al. (2001) quantified the limitations of the feed year for the NorthernTablelands with respect to grazing cattle. Specifically they identified two major limitations toproduction from pasture - the winter-early spring feed gap that is a consequence of the coldwinter; and limits on pasture quality in summer-autumn that is as a result of the poorernutritive value of the secondary regrowth pasture. Figure 5 shows the relationship betweenanimal energy requirements throughout the year and the energy supplied by a typical pasturemix in the Northern Tablelands, as estimated by the Northern Tablelands LP. Researchershave highlighted the potential to target pasture species and cultivar selection to address thiswinter feed limitation. Examples include Lazenby and Lovett (1975) with tall fescue;Robinson and Archer (1988) with Poa seiberana, amongst others; and Ayres et al. (2000)with tall fescue (Festuca arundinacea) and phalaris (Phalaris aquatica).
Donnelly, Freer and Moore (1994) used GRAZPLAN to undertake an evaluation of pasturebreeding objectives by examining the impact of improving winter pasture growth on the grossmargin of a Merino wether enterprise. They estimate that selection of a more active wintercultivar could increase daily growth rate between May and September by at least 25 per cent.Application of a whole-farm LP might also provide additional insights into such a problem,given the known interactions between sheep and cattle requirements, pasture productivity andother farm constraints.
27
Figure 5. Comparison of animal feed requirements and pasture feed produced on therepresentative farm
0
1000
2000
3000
4000
5000
6000
7000
Jan Mar May Jul Sep Nov
Calendar Months
Feed
Ene
rgy
(x10
00 M
J M
E )
Provided by PastureAnimal Requirements
Two scenarios relating to improved winter pasture growth were run using the NorthernTablelands representative whole-farm model. They are:
1. a 10 per cent increase in winter pasture growth (May to September) from usingdifferent cultivars in the perennial pasture. This pasture is assumed to cover 49 percent of farm area, and pasture seed costs are assumed to increase by 30 per cent,and
2. a 15 per cent increase in growth of the same pasture over the same time period(with pasture seed costs increased by 50 per cent).
A more conservative improvement in winter pasture growth of 10 or 15 per cent was used inthese scenarios compared with the Donnelly et al. (1994) assumption of 25 per cent, while itwas assumed that pasture growth from this improved perennial pasture for the rest of the yearremains unchanged.
From this analysis it is found that a 10 per cent increase in winter pasture growth on theintroduced pasture area of 450 ha (out of a total 920 ha) would result in a 4.9 per cent increasein farm Total Gross Margin. Similarly, a 15 per cent increase in winter growth results in a 7.1per cent increase in TGM (Table 15). This corresponds to an increase in Farm Cash Incomeof 6.9 per cent and 9.9 per cent for the 10 per cent and 15 per cent winter pasture growthscenarios respectively. These improvements in the profitability of the representative farmwere achieved by increasing the investment in prime lamb and young cattle enterprises anddecreasing the investment in Merino wethers. Wether numbers on this representative farm arepredicted to fall from 1,732 (base case) to 1,672 (10 per cent winter pasture increase) and to1,653 (15 per cent winter pasture increase), respectively. This indicates that the prime lamband young cattle enterprises, under the current assumptions of the model, better utilise theresources available given an increase in winter pasture growth.

28
Table 15. Summary of farm-level benefits from improvements in the winter growthpotential of introduced pasture species to the representative farm
Base 10 per centincrease in winter
growth
15 per centincrease in winter
growthTotal Gross Margin1 ($)(per cent improvement over base)
85,471 89,689(4.9 per cent)
91,551 (7.1 per cent)
Enterprises: Prime lambs (ewes) Merino wethers
1 1081 732
1 1471 672
1 1531 653
Young cattle (cows) 127 137 143
Feed related costs ($ per dse)(per cent reduction in feed costs)
7.81 7.63(2.3 per cent)
7.57(3.1 per cent)
Additional increase in annual MEprovided by the pasture 1.7 per cent 2.5 per cent
1TGM includes casual labour costs
Further analysis of these results would include an investigation of the sensitivity of theseresults to key price and management assumptions used in the LP model. Some of these issuesare examined in the companion Economic Research Report (Alford et al., 2003).
Finally, the pasture enterprise budgets (Appendix B) underlying the LP model account for theannual maintenance cost of the pasture and an annualised cost of establishing the pasture, sothe results reported in Table 15 compare the values of three types of pasture, afterestablishment. A more complete analysis would include a cash flow budget and theimplications for TGM while the pasture development was being done. Also, there may besome additional capital required to achieve the optimal stocking levels of prime lambs andcattle, above that retained from the partial liquidation of the wether flock, and these costswould need to be accounted for in the development budget. These investment costs could alsobe modelled in the multi-period version of NTLP, as described in Alford et al. (2003).

29
6. Summary and ConclusionsThe Northern Tablelands region of New South Wales is defined to include the Walcha, Uralla,Armidale-Dumaresq, Guyra, Severn, Glen Innes and Tenterfield local government areas. Thisregion covers an area of approximately 3.12 million hectares including 2.11 million hectaresoccupied by agricultural establishments (ABS, 1998). From the latest available ABSagricultural census data, there were 2295 establishments carrying out agricultural activities inthe Northern Tablelands region, producing agricultural commodities to the value of $217.8million in 1996/97. Sheep and cattle production were the dominant agricultural enterprises,contributing 86 per cent of this total value including wool (41.7 per cent), beef cattleslaughterings (36.1 per cent) and sheep and lamb slaughterings (8.4 per cent).
Given this pattern, major issues for Northern Tablelands agriculture relate to the economicand environmental sustainability of the beef and sheep grazing system. Economic models ofthe relevant farming system are a useful first step in understanding the nature of the biologicaland economic constraints facing producers in their decision making in relation to these issues.Such models are also useful in relation to more general concerns such as the expected impactsof new investments in technologies applicable to grazing systems, or of external events suchas drought conditions or a depreciation in the exchange rate. Such an economic model for theNorthern Tablelands livestock farming system is described in this report.
Because of the mixed farming nature of the enterprises commonly run, a whole-farmperspective is taken. The whole–farm budget for a representative farm for the NorthernTablelands includes a statement of assets and liabilities and an annual operating budget. Thestatement of assets and liabilities is based upon estimates of the various capital itemsincluding land, livestock and plant and machinery and farm structures. The annual operatingbudget includes the cash income and costs associated with each of the farm enterprises as wellas the fixed costs incurred for running the farm over the year to derive the Farm Cash Income.Allowances for depreciation and interest costs are deducted from farm cash income todetermine farm operating surplus. No family labour allowance is subtracted, so the resultingfarm operating surplus represents a return on owner-operated labour, management and farmassets. Pasture costs have not been apportioned to the specific animal enterprises andtherefore appear as separate negative gross margins. Similarly, supplementary feeding costsand fodder conservation activities are listed as a separate negative gross margin.
A representative whole-farm model of the Northern Tablelands livestock farming system wasdeveloped based on ABS and ABARE data on the relevant industries, from simulations with alinear programming model, and from discussions with local graziers and extension officers.The model farm is based on average prices and costs over an extended period of time. Thefarm comprises 920 ha of which about half is native pasture and about half is introducedpasture. This farm runs a flock of 1,108 first-cross ewes, a flock of 1,732 Merino wethers anda herd of 127 cows producing 18 month old steers suitable for the heavy feeder steer market.
Compared with the 1996/97 ABS data quoted earlier, the model farm has a smaller woolenterprise and a larger lamb enterprise, with the cattle enterprise almost exactly right. Thesedifferences reflect the problems mentioned previously of comparing the economic structure ofthe farming system in a particular year versus that in a more "representative" year.

30
For this farm plan, the annual operating budget shows a total gross margin of $86,191 andtotal overhead costs for the year of $24,720. This results in a farm cash income of $61,471and a farm operating surplus of $37,471 after depreciation and interest costs. The statement ofassets and liabilities shows total assets of the farm to be $1,498,060 and liabilities of $100,000which equates to an equity level of 93.3 per cent. The farm operating surplus achieved on thismodel farm as a percentage of the owner’s equity is 2.7 per cent. This represents a return onoperator and family labour, management and equity. One result therefore is that low returns toequity are typical of Northern Tablelands livestock farming systems, just as they are of mostof Australian broadacre agriculture.
Other scenarios examined included whole-farm budgets based on 2002 actual market pricesand on 2003 expected prices. Given the relatively high prices for sheep relative to cattle inthese years, the representative farm would be more profitable running just sheep - 1,558 first-cross ewes and 3,595 Merino wethers. Such an enterprise mix would achieve a farm totalgross margin of $165,736. After overhead costs, depreciation and interest costs there wouldbe a farm operating surplus of $111,818. Based on equity of $1,472,870, this surplus wouldrepresent a business return on operator labour, management and equity of 8.1 per cent.
However, while the Northern Tablelands representative farm model would suggest thatgreater profits could be achieved from changing enterprises as commodity prices change, inpractice various biological lags, infrastructure, financial and management constraints preventregular changes in farm enterprises. In fact, diversification amongst a variety of farmenterprises between various sheep and cattle enterprises as evidenced in the NorthernTablelands is one management response to this commodity price variability. Producers'attitudes to risk, and the fact that most establishments maintain both cattle and sheepinfrastructures, means that such establishments continue to run a mix of cattle and sheepenterprises. However, if enterprise gross margins change by large amounts, or if there is amajor change in the quantity or quality of resources available to the producer, then theenterprise mix does change in a substantial way (see the related discussion in Alford, Griffithand Cacho 2003).
A proposed technology examined with the model was a new pasture variety that gaveimproved growth in winter. It was shown that a 10 per cent increase in winter pasture growthon the introduced pasture area of 450 ha (out of a total 920 ha) would result in a 5.0 per centincrease in farm total gross margin. This corresponds to an increase in farm cash income of6.9 per cent. These improvements in the profitability of the representative farm wereachieved by increasing the investment in prime lamb and cow enterprises and decreasing theinvestment in Merino wethers. This indicates that the prime lamb enterprise and the youngcattle enterprise, under the current assumptions of the model, better utilise the new resourceavailable (an increase in winter growth in introduced pasture). However a more completeanalysis using a pasture development budget would be required to confirm whether thispotential increase in farm income could be achieved in practice.
The development of the whole-farm model described in this Report has had a profitabilityfocus to date. Ongoing research is aimed at expanding this focus to include natural resourcemanagement issues, such as the well-known decline in pasture productivity, hydrologicalimpacts on regional river catchments and the emerging problems of dryland salinity and soilacidity.

31
7. References
Alford, A.R., Griffith, G.R. and Cacho, O. (2003). A Northern Tablelands Whole-FarmLinear Programme for Economic Evaluation of New Technologies at the Farm Level.Economic Research Report No. 13, NSW Agriculture, Armidale.
Archer, K.A. (1995). "The New South Wales pasture base", in J.F. Ayres, D.L. Michalk andH. Lloyd-Davies (Eds), Proceedings of the 10th Annual Conference of the Grassland Societyof New South Wales, Grassland Society of NSW Inc.
Australian Bureau of Agricultural and Resource Economics (2003). Australian CommodityStatistics 2002, ABARE, Canberra.
Australian Bureau of Statistics (1998). Agricultural Census 1996/97, Local Area Statistics,[Online. Accessed through NSW Agriculture Library Services internal web site]. ABS,Canberra.
Australian Meat and Live-stock Corporation (1997). Australian Meat and Livestock IndustryStatistics, AMLC, Sydney.
Australian Meat and Live-stock Corporation (various issues). Statistical Review, AMLC,Sydney.
Ayres, J.F., Dicker, R.W., McPhee, M.J., Turner, A.D., Murison, R.D. and Kamphorst, P.G.(2001). "Post-weaning growth of cattle in northern New South Wales 1. Grazing value oftemperate perennial pasture grazed by cattle", Australian Journal of ExperimentalAgriculture, 41, pp. 959-969.
Ayres, J.F., McPhee, M.J., Turner, A.D. and Curll, M.L. (2000). "The grazing value of tallfescue (Festuca arundinacea) and phalaris (Phalaris aquatica) for sheep production in thenorthern tablelands of New South Wales", Australian Journal of Agricultural Research, 51,pp. 57-68.
Bell, A. (1991). "Sheep management", in D.J. Cottle (Ed), Australian Sheep and WoolHandbook, Inkata Press, Melbourne, Chapter 12, pp. 253-266.
Clewett, J.F., Smith, P.G., Partridge, I.J., George, D.A. and Peacock, A. (1999). AustralianRainman Version 3: An Integrated Software Package of Rainfall Information for BetterManagement. QI98071, Department of Primary Industries Queensland, Brisbane.
Crofts, F. (1997). "Australian pasture production: the last 50 years", in J.V. Lovett and J.M.Scott (Eds), Pasture Production and Management, Inkata Press, Melbourne, Chapter 1, pp. 1-16.
Department of Land and Water Conservation (2003). "Dryland Salinity: Known Locations inNew South Wales". [Online]. Available: http://www.dlwc.gov.au/care/salinity/pdf/extent_fig1.pdf
Donnelly, J.R., Freer, M. and Moore, A.D. (1994). "Evaluating pasture breeding objectivesusing computer models", New Zealand Journal of Agricultural Research, 37, pp. 269-275.
Duncan, M.R. (1995). "Fertiliser requirements of grazed pastures", in J.F. Ayres, D.L.Michalk and H. Lloyd-Davies (Eds), Proceedings of the 10th Annual Conference of theGrassland Society of New South Wales, Grassland Society of NSW Inc.

32
Farquharson, R.J. (1991). "A farm level evaluation of a new twinning technology in beefcattle", Review of Marketing and Agricultural Economics, 59, pp. 66-86.Griffith, G.R. and A.R. Alford (2002). "The US cattle cycle and its influence on theAustralian beef industry", Review Paper No. 2, Volume 10 in Australian AgribusinessReview, [Online]. Available: http://www.agribusiness.asn.au/Review/2002v10/Griffith/Griffith.htm
Griffith, G.R., Vere, D.T. and B.W. Bootle (1995). "An integrated approach to assessing thefarm and market level impacts of new technology adoption in Australian lamb production andmarketing systems: the case of large, lean lamb", Agricultural Systems 47 (2), 175-198.
Harrington, H.J. (1977). "Geology", in D.A.M. Lea, J.J.J. Pigram and L.M. Greenwood (Eds),An Atlas of New England, Volume 2. The Commentaries, Department of Geography,University of New England, Armidale, Chapter 5, pp. 25-46.
Hartridge, F. (1979). Pastoral Research on the Northern Tablelands of New South Wales,New South Wales Department of Agriculture, Sydney.
Hobbs, J.E. and Jackson, I.J. (1977). "Climate", in D.A.M. Lea, J.J.J. Pigram and L.M.Greenwood (Eds), An Atlas of New England. Vol. 2. The Commentaries, Department ofGeography, University of New England.
Kemp, D.R. (1994). "Pasture management research priorities", in D.R. Kemp and D.L.Michalk (Eds), Pasture Management Technology for the 21st Century, CSIRO Australia, EastMelbourne, pp. 149-154.
Kingwell, R.S. (1987). "A detailed description of MIDAS", in R.S. Kingwell and D.J. Pannell(Eds), MIDAS, A Bioeconomic Model of a Dryland Farm System, Pudoc, Wageningen,Chapter 2, pp. 15-54.
Kingwell, R.S. and Pannell, D.J. (Eds) (1987). MIDAS, A Bioeconomic Model of a DrylandFarm System, Pudoc, Wageningen.
Lazenby, A. and Lovett, J.V. (1975). "Growth of pasture species on the Northern Tablelandsof New South Wales", Australian Journal of Agricultural Research, 26, 269-280.
Lees, J. and Reeve, I. (1994). Temperate Pasture Sustainability Key Program 1994, ProducerSurvey, Report to the Meat Research Corporation, Rural Development Centre, University ofNew England, Armidale.
Llewelyn, D. and Davies, L. (2001). NSW Agriculture Beef Enterprise Budgets. NSWAgriculture, Orange. [Online] Available: http://www.agric.nsw.gov.au/ (Replaced bysubsequent budgets).
Lodge, G.M. and Whalley, R.D.B. (1989). Native and Natural Pastures on the NorthernSlopes and Tablelands of NSW: A Review and Annotated Bibliography, Technical Bulletin 35,NSW Agriculture, Sydney.
Lowien, J., Duncan, M., Collett, I. and McDonald, W. (1997). A Guide to Better Pastures onthe Northern Tablelands, NSW Agriculture, Orange.
Makeham, J.P. and Malcolm, L.R. (1993). The Farming Game Now, Cambridge UniversityPress, Melbourne.

33
McGarity, J.W. (1977). "Soils", in D.A.M. Lea, J.J.J. Pigram and L.M. Greenwood (Eds), AnAtlas of New England, Volume 2. The Commentaries, Department of Geography, Universityof New England, Armidale, Chapter 6, pp. 47-70.
Meat & Livestock Australia (2001). Statistical Review July 2000-June 2001, MLA, MarketingInformation Services, Sydney.
Miller, B.V. (1991). "Pregnancy and lambing", in D.J.Cottle (Ed), Australian Sheep and WoolHandbook, Inkata Press, Melbourne, Chapter 5, pp. 119-143.
Murphy, B.W. and Eldridge, D.J. (1991). "Soils of New South Wales", in P.E.V. Charmanand B.W. Murphy (Eds), Soils. Their Properties and Management: A soil conservationhandbook for New South Wales, Sydney University Press/ Soil Conservation Service of NewSouth Wales, Sydney, Chapter 8, pp. 115-128.
NSW Agriculture (1996). Prograze©. Profitable, Sustainable Grazing, Third edition, NSWAgriculture, Orange.
NSW Agriculture (2001). Acid Soil Action in NSW. Leaflet No. 1, 2nd Edition. [Online].Available: http://www.agric.nsw.gov.au/reader/3677/
NSW Agriculture (2003). Livestock Gross Margins, NSW Agriculture, Orange [Online].Available: http://www.agric.nsw.gov.au/reader/818/
Patton, D.A. and Mullen, J.D. (2001). Farming Systems in the Central West of NSW: AnEconomic Analysis, Economic Research Report No. 7, NSW Agriculture, Orange.
Riley, D., Gleeson, T., Martin, P. and Delforce, R. (2001). Australian Beef Industry 2001,ABARE Research Report 01.8, Canberra.
Robinson, G.G. and Archer, K.A. (1988). "Agronomic potential of native grass species on theNorthern Tablelands of New South Wales. I Growth and herbage production", AustralianJournal of Agricultural Research, 39, pp. 415-423.
Rural Press Group (2001a). Farm Costs Guide 2001, Insert to The Land, 13th September2001, Agricultural Publishers, North Richmond.
Rural Press Group (2001b). The Land (various issues), Agricultural Publishers, NorthRichmond.
SCA (1991). Sustainable Agriculture, Report to the Australian Agriculture Council by aWorking Group in Sustainable Agriculture, Standing Committee on Agriculture TechnicalReport No. 36, CSIRO, Melbourne.
Scott, J.M., Hutchinson, K.J., King, K., Chen, W., McLeod, M., Blair, G.J., White, A.,Wilkinson, D., Lefroy, R.D.B., Cresswell, H., Daniel, H., Harris, C., MacLeod, D.A., Blair,N. and Chamberlain, G. (2000). "Quantifying the sustainability of grazed pastures on theNorthern Tablelands of New South Wales", Australian Journal of Experimental Agriculture,40, pp. 257-265.
Singh, R.P., Faour, K., Mullen, J.D. and Jayasuriya, R. (2003). Farming Systems in theMurrumbidgee Irrigation Area in NSW, Economic Research Report No.10, NSW Agriculture,Orange.
Webster, S. (1998). Farm Budget Handbook 1998: NSW Wool & Sheepmeat Budgets, NSWAgriculture, Orange.

34
Wesfarmers Landmark (2002). Wool Weekly (various issues). [Online] Available:http://www.wesfarmersdalgety.com.au/
Wheeler, J.L., Pearson, C.J. and Robards, G.E. (Eds) (1987). Temperate Pastures: TheirProduction, Use and Management, Australian Wool Corporation / CSIRO Australia, EastMelbourne, pp. 609.

35
AppendicesAppendix A: ABARE Survey Data 2000/01
2000/01 Unit NorthernTablelandsSheep-Beef
Relativestandarderror
PHYSICALESTIMATESFarm area ha 958 (31)Wheat area harvested ha 0Sheep flock June 30 no 4549 (24) - ewes no 2089 (24) - lambs no 1167 (32) - rams no 43 (46) - wethers no 1251 (42)Cattle herd June 30 no 250 (28) - bulls no 5 (30) - calves no 52 (50) - cows no 126 (22) - replacement heifers no 34 (28) - other no 33 (56)Area sown to cereals ha 0Area sown to pulses ha 0Area sown to oilseeds ha 0Area sown to other crops ha 1 (85)Wheat production t 0Other grain production t 29 (97)Sheep sold no 1223 (5)Prime lambs sold no 40 (144)Other lambs sold no 267 (85)Beef cattle sold no 121 (19)Sheep and lambs shorn no 4426 (23)Ewes mated no 1715 (17)Lambs marked no 1460 (14)Lambing rate % 87 (14)Wool produced kg 16417 (33)Amount of labour used weeks 146 (35)

36
Appendix A (continued)
2000/01 Unit NorthernTablelandsSheep-Beef
Relativestandarderror
CASH RECEIPTSSheep receipts excludingprime lambs $ 29564 (18)prime lambs $ 1691 (144)Beef cattle sales $ 59244 (25)Other livestock $ 0 .Wool $ 189662 (35)Wheat $ 0 .Barley $ 0 .Sorghum $ 0 .Pulses $ 0 .Oilseeds $ 0 .Other crop receipts $ 668 (85)Off farm share farming $ 0 .off farm contracts $ 0 .Other cash receipts $ 2432 (53)Total cash receipts $ 283260 (27)CASH COSTSSheep purchases $ 6247 (39)Beef cattle purchases $ 11869 (61)Wages of hired labour $ 7043 (52)Shearing and crutching $ 8491 (35)Fertiliser $ 6427 (34)Fodder $ 5061 (40)Crop and pasturechemicals
$713 (97)
Fuel, oil and grease $ 7397 (23)Repairs and maintenance $ 10903 (17)Other materials $ 11191 (37)Administration $ 4824 (26)Contracts $ 3207 (56)Rates $ 4058 (53)Freight $ 2588 (21)Handling and marketing $ 31068 (21)other services $ 9844 (40)Interest paid $ 15236 (35)Rent $ 300 (54)On farm share farmingpayments
$0 .
Other costs $ 868 (39)Total cash costs $ 147335 (19)GM costs $ 86904GM $ 110130

37
Appendix A (continued)
2000/01 Unit NorthernTablelandsSheep-Beef
Relativestandarderror
FARMPERFORMANCEFarm cash income $ 144432 (19)- Plus build up in tradingstock $ -8885 (133)- Less depreciation $ 18982 (24)- Less operator andfamily labour costs $ 54867 (30)Farm business profit $ 61698 (49)Farm business profit atfull equity $ 64814 (48)- Plus capital appreciation $ 103340 (19)Profit at full equityincluding capitalappreciation $ 168153 (26)Opening value of capital $ 1666673 (18)Closing value of capital $ 1585024 (17)Farm equity at 30 June $ 1631961 (17)Farm equity ratio % 93 (1)Off farm income $ 54867 (30)Rate of return excludingcapital appreciation % 3.5 (36)Closing debt at 30 June $ 26955 (107)
Source: ABARE (unpublished data).

38
Appendix B: Representative Farm Enterprise Budgets for the Representative Year(2001 dollar values)
Pasture Enterprise Budgets
Enterprise: Perennial Pasture Enterprise Unit: hectare
Representative Year - 2001 dollar values
ESTABLISHMENT COSTS Rate Unit Cost Unit TOTALChisel 0.7hrs/ha/chisel (x2) 1.4 hrs/ha @ 16.95 per hour 23.73Scarifier (x2) 0.84 hrs/ha @ 15.1 per hour 12.68Sowing - combine 0.5 hrs/ha @ 23.37 per hour 11.69Seed Demeter Fescue 5 kg/ha @ 5 \kg 25Australian Phalaris 2.5 kg/ha @ 9 \kg 22.5Perennial ryegrass (Impact) 1.5 kg/ha @ 5.5 \kg 8.25White Clover (Haifa)+ innoc,lime 1 kg/ha @ 4.5 \kg 4.5 Fertiliser Starter 125 kg/ha @ 520 per tonne 65 Herbicides 2,4DB 2.1 L/Ha @ 13.5 per litre 28.35TOTAL ESTABLISHMENT COSTS $ 201.70 VARIABLE COSTS Rate Unit Cost Unit TOTAL Lifespan of Perennial Pasture 15 years ESTABLISHING COSTS PER YEAR 13.45 Maintenance Fertiliser Years 2-4 SuperP (spread) 375 kg/ha @ 326 per tonne 122.25Years 5-15 SuperP (spread) 125 kg/ha @ 326 per tonne 40.75
Average annual maintenancefertiliser 54.33
TOTAL ANNUALISED COSTS $ 67.78 /ha

39
Enterprise: Native- PastureEnterprise Unit: hectare
ESTABLISHMENT COSTS Rate Unit Cost Unit TOTALSeed White Clover (Haifa)+ innoc, lime 1 kg/ha @ 4.5 \kg 4.5Subclover (Junee)+ innoc, lime 4 kg/ha @ 4.7 \kg 18.8Fertiliser SuperP (spread) 125 kg/ha @ 326 per tonne 40.75 Herbicides 2,4DB 2.1 L/Ha @ 13.5 per litre 28.35Herbicide application 0.2 hrs/ha @ 16.7 per ha 3.34 TOTAL ESTABLISHMENT COSTS $ 95.74 VARIABLE COSTS Rate Unit Cost Unit TOTAL Lifespan of Perennial Pasture 15 years ESTABLISHING COSTS PER YEAR 6.38 Years 2-15 SuperP (spread) 62.5 kg/ha @ 326 per tonne 20.375 Average annual maintenance fertiliser 19.02TOTAL ANNUALISED COSTS $ 25.40/ha
Enterprise: Forage OatsEnterprise Unit: hectare
ESTABLISHMENT COSTS Rate Unit Cost Unit TOTALChisel 0.7hrs/ha/chisel (x2) 1.4 hrs/ha @ 16.95 per hour 23.73Offset disc 0.6 hrs/ha @ 15.1 per hour 9.06Sowing - combine 0.5 hrs/ha @ 23.37 per hour 11.69Seed Oats (Bass) 70 kg/ha @ 0.75 \kg 52.5Fertiliser Starter 125 kg/ha @ 520 per tonne 65 TOTAL ANNUAL COSTS $ 161.98

40
Beef Cattle Enterprise Budgets
Enterprise: Specialist local trade (vealers)
Enterprise Unit: 100 cows (cross-bred)Representative Year - 2001 dollar values
Herd parameters:
Conception rate (cows) 90 %Conception rate (heifers) 100% (bought PTIC*)Weaning rate 82 %Adult mortality 2 %Yearling mortality 3 %Calf mortality 5 %Bull requirement 3 %Bull cull rate 33 %Age at First Calving 2 yearsCow cull age 10 years
Income:
41.4 Steer vealers 174 kg dw. \hd @ 306 ¢/kg dw. 22 043.0241.4 Heifer vealers 155 kg dw. \hd @ 296 ¢/kg dw. 18 994.3215.1 Cull cows 250 kg dw. \hd @ 256 ¢/kg dw. 9 664.00
0.9 Cull bulls 450 kg dw. \hd @ 266 ¢/kg dw. 1 077.30
Total Income 51 778.64
Variable Costs:Animal health - vaccination, drenching and vet costs Cows 99.7 @ 2.73 \hd 272.18 Bulls 2.7 @ 64.23 \hd 173.42 Vealers 85.7 @ 0.46 \hd 39.42Ear tags Heifers 17.7 @ 2 \hd 35.4Selling Costs Cartage Sales/ Purchases 117.4 @ 7 \hd 821.80Commission Sales Revenue 51 779 @ 4% 2 071.16Yard dues No. of head 16 @ 3.60 \hd 57.60MLA levy No. of head 98.9 @ 3.50 \hd 346.15Tail tags No. of head 98.9 @ 0.11 \hd 10.88Freight to abattoir kg dw. 13 574 @ 0.05 \kg dw 678.71 Replacements
Cross-bred heifers 17.7 @ 775.00 \hd 13 717.50Bull 0.9 @ 3 250.00 \hd 2 925.00
Total Costs 21 149.22
Gross margin 30 629.42Gross margin per cow 306.29
* PTIC (pregnancy tested in calf)Since the LP is based upon single breeding units, decimal places are included in the gross margin to determinecosts and income per breeding unit.
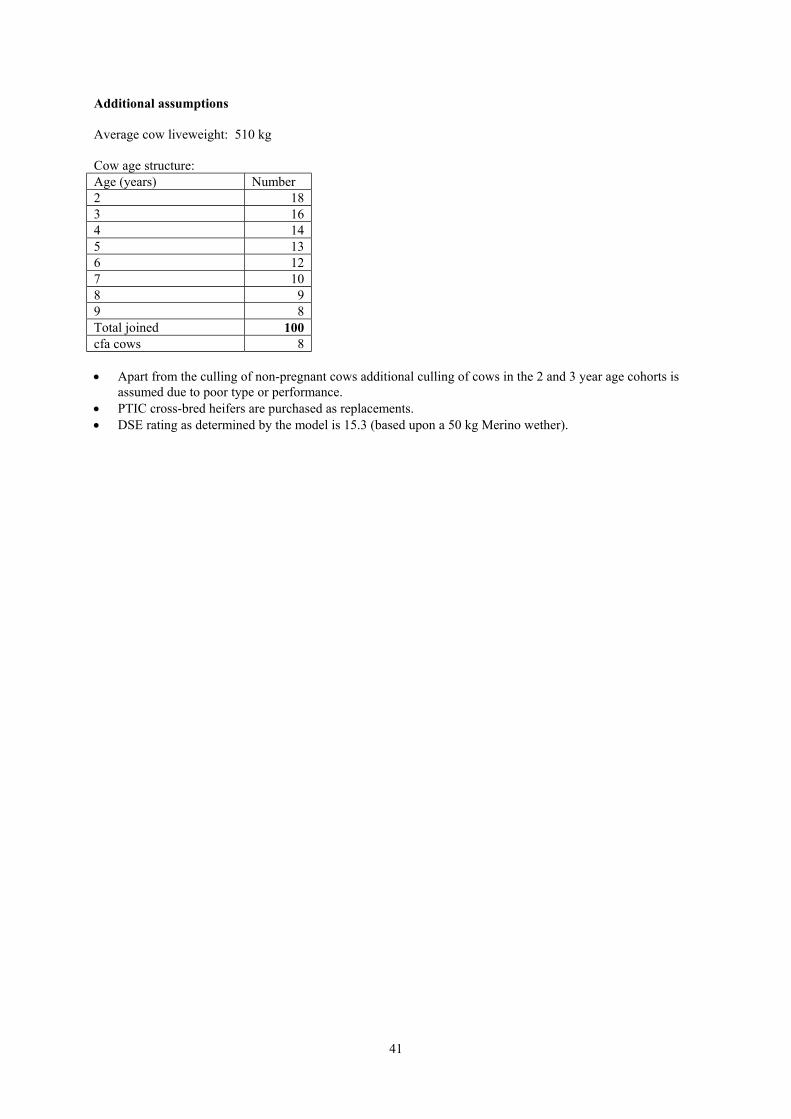
41
Additional assumptions
Average cow liveweight: 510 kg
Cow age structure:Age (years) Number2 183 164 145 136 127 108 99 8Total joined 100cfa cows 8
• Apart from the culling of non-pregnant cows additional culling of cows in the 2 and 3 year age cohorts isassumed due to poor type or performance.
• PTIC cross-bred heifers are purchased as replacements.• DSE rating as determined by the model is 15.3 (based upon a 50 kg Merino wether).
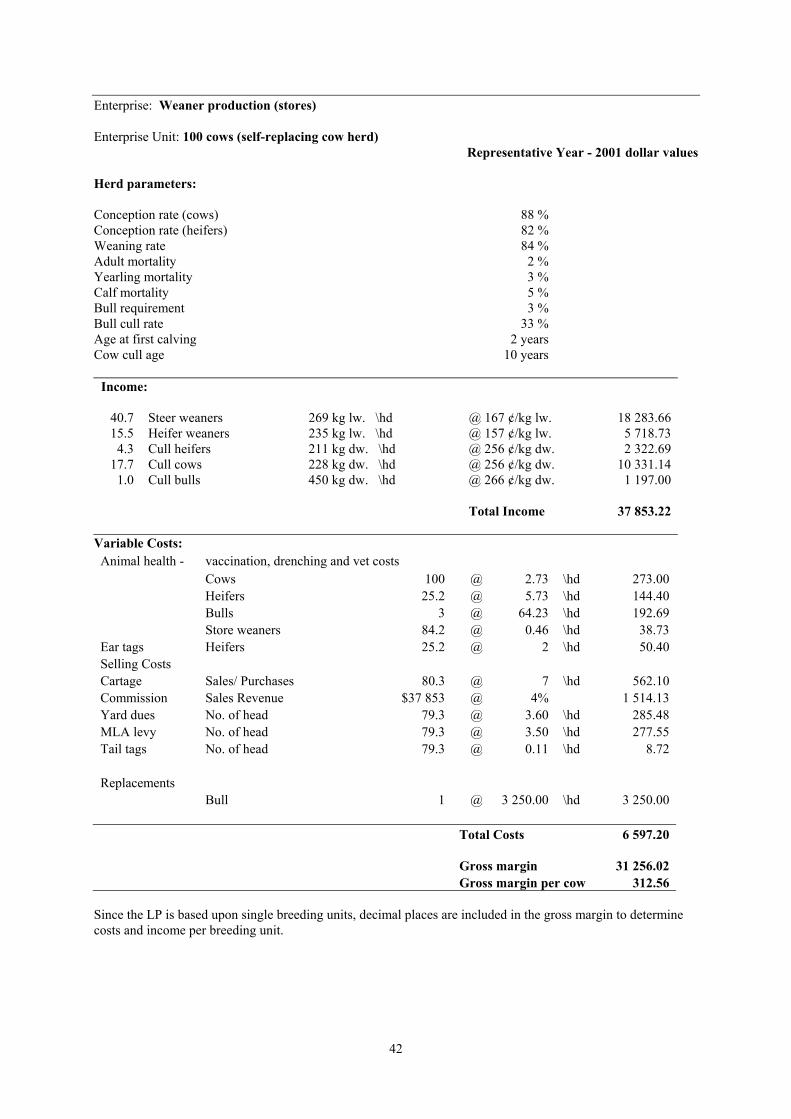
42
Enterprise: Weaner production (stores)
Enterprise Unit: 100 cows (self-replacing cow herd)Representative Year - 2001 dollar values
Herd parameters:
Conception rate (cows) 88 %Conception rate (heifers) 82 %Weaning rate 84 %Adult mortality 2 %Yearling mortality 3 %Calf mortality 5 %Bull requirement 3 %Bull cull rate 33 %Age at first calving 2 yearsCow cull age 10 years
Income:
40.7 Steer weaners 269 kg lw. \hd @ 167 ¢/kg lw. 18 283.6615.5 Heifer weaners 235 kg lw. \hd @ 157 ¢/kg lw. 5 718.73
4.3 Cull heifers 211 kg dw. \hd @ 256 ¢/kg dw. 2 322.6917.7 Cull cows 228 kg dw. \hd @ 256 ¢/kg dw. 10 331.14
1.0 Cull bulls 450 kg dw. \hd @ 266 ¢/kg dw. 1 197.00
Total Income 37 853.22
Variable Costs:Animal health - vaccination, drenching and vet costs Cows 100 @ 2.73 \hd 273.00
Heifers 25.2 @ 5.73 \hd 144.40 Bulls 3 @ 64.23 \hd 192.69 Store weaners 84.2 @ 0.46 \hd 38.73Ear tags Heifers 25.2 @ 2 \hd 50.40Selling Costs Cartage Sales/ Purchases 80.3 @ 7 \hd 562.10Commission Sales Revenue $37 853 @ 4% 1 514.13Yard dues No. of head 79.3 @ 3.60 \hd 285.48MLA levy No. of head 79.3 @ 3.50 \hd 277.55Tail tags No. of head 79.3 @ 0.11 \hd 8.72 Replacements
Bull 1 @ 3 250.00 \hd 3 250.00
Total Costs 6 597.20
Gross margin 31 256.02Gross margin per cow 312.56
Since the LP is based upon single breeding units, decimal places are included in the gross margin to determinecosts and income per breeding unit.

43
Average cow liveweight: 456 kg
Cow age structure:Age (years) Number2 213 174 145 126 117 108 89 7Total joined 100cfa cows 7
• Apart from the culling of non-pregnant cows additional culling of cows in the 2 and 3 year age cohorts isassumed due to poor type or performance.
• DSE rating as determined by the model is 17.6 (based upon a 50 kg Merino wether).

44
Enterprise: Young cattle 18-20 months (moderate growth)
Enterprise Unit: 100 cows (self-replacing cow herd)Representative Year - 2001 dollar values
Herd parameters:
Conception rate (cows) 88 %Conception rate (heifers) 82 %Weaning rate 84 %Adult mortality 2 %Yearling mortality 3 %Calf mortality 5 %Bull requirement 3 %Bull cull rate 33 %Age at first calving 2 yearsCow cull age 10 years
Income:
40.5 Steers 252 kg dw. \hd @ 283 ¢/kg dw. 28 882.9813.9 Heifers 218 kg dw. \hd @ 273 ¢/kg dw. 8 272.45
3.8 Cull heifers 212 kg dw. \hd @ 256 ¢/kg dw. 2 062.3421.0 Cull cows 228 kg dw. \hd @ 256 ¢/kg dw. 12 257.28
1 Cull bulls 450 kg dw. \hd @ 266 ¢/kg dw. 1 197.00
Total Income 52 672.05
Variable Costs:Animal health - vaccination, drenching and vet costs Cows 100 @ 2.73 \hd 273.00
Heifers 41.3 @ 5.73 \hd 236.65Steers 41.3 @ 5.73 \hd 236.65
Bulls 3 @ 64.23 \hd 192.69 Store weaners 86.7 @ 0.46 \hd 39.88Ear tags Heifers 26.7 @ 2 \hd 53.40Selling Costs Cartage Sales/ Purchases 81.2 @ 7 \hd 568.40Commission Sales Revenue $52 672 @ 4% 2 106.88Yard dues No. of head 80.2 @ 3.60 \hd 288.72MLA levy No. of head 80.2 @ 3.50 \hd 280.70Tail tags No. of head 80.2 @ 0.11 \hd 8.82 Replacements
Bull 1 @ 3 250.00 \hd 3 250.00
Total Costs 7 535.79
Gross margin 45 136.26Gross margin per cow 451.36
Since the LP is based upon single breeding units, decimal places are included in the gross margin to determinecosts and income per breeding unit.

45
Average cow liveweight: 456 kg
Cow age structure:Age (years) Number2 223 184 145 126 117 98 89 6Total joined 100cfa cows 6
• Apart from the culling of non-pregnant cows additional culling of cows in the 2 and 3 year age cohorts isassumed due to poor type or performance.
• DSE rating as determined by model is 21.2 (based upon a 50 kg Merino wether).

46
Enterprise: Young cattle (0-2 teeth) – Heavy feeder steers.
Enterprise Unit: 100 cows (self-replacing cow herd)Representative Year - 2001 dollar values
Herd parameters:
Conception rate (cows) 88 %Conception rate (heifers) 82 %Weaning rate 84 %Adult mortality 2 %Yearling mortality 3 %Calf mortality 5 %Bull requirement 3 %Bull cull rate 33 %Age at first calving 2 yearsCow cull age 10 years
Income:
40.6 Steers 448 kg lw. \hd @ 170 ¢/kg lw. 30 920.9616.5 Heifers weaners 205 kg lw. \hd @ 165 ¢/kg lw. 5 581.13
3.0 Cull heifers 213 kg dw. \hd @ 256 ¢/kg dw. 1 635.8418.0 Cull cows 228 kg dw. \hd @ 256 ¢/kg dw. 10 506.24
1.0 Cull bulls 450 kg dw. \hd @ 266 ¢/kg dw. 1 197.00
Total Income 49 841.17Variable Costs:Animal health - vaccination, drenching and vet costs Cows 100 @ 2.73 \hd 273.00
Heifers 43.4 @ 5.73 \hd 248.68Steers 43.4 @ 5.73 \hd 248.68
Bulls 3 @ 64.23 \hd 192.69 Store weaners 86.7 @ 0.46 \hd 39.88Ear tags Heifers 23 @ 2 \hd 46.00Selling Costs Cartage Sales/ Purchases 79 @ 7 \hd 553.00Commission Sales Revenue $49 841 @ 4% 1 993.64Yard dues No. of head 79 @ 3.60 \hd 284.40MLA levy No. of head 79 @ 3.50 \hd 276.50Tail tags No. of head 79 @ 0.11 \hd 8.69 Replacements
Bull 1 @ 3 750.00 \hd 3 750.00
Total Costs 7 915.16
Gross margin 41 926.01Gross margin per cow 419.26
Since the LP is based upon single breeding units, decimal places are included in the gross margin to determinecosts and income per breeding unit.

47
Average cow liveweight: 456 kg
Cow age structure:Age (years) Number2 203 174 155 136 117 98 89 7Total joined 100cfa cows 7
• Apart from the culling of non-pregnant cows additional culling of cows in the 2 and 3 year age cohorts isassumed due to poor type or performance.
• DSE rating as determined by model is 18.8 (based upon a 50 kg Merino wether).

48
Sheep Enterprise Budgets
Enterprise: Self-replacing Merino ewes (19 micron)
Enterprise Unit: 1000 ewesRepresentative Year - 2001 dollar values
Flock parameters:
Weaning rate 82 %Weaning age 3 monthsAdult mortality 3.5 %Hogget mortality 3 %Lamb mortality 5 %Ram requirement 2 %Ram cull rate 25 %Ewe cull age 5.5 years
Income:Wool sales
kg/hd(greasy)
Yield(%)
Pcs/blsfactor
Cleanprice($/kg)
Total
1 005.3 Ewes 4.30 0.72 0.9 11.17 31 289.05394.3 Ewe hoggets 3.40 0.69 0.9 11.17 9 299.30394.3 Wether hoggets 3.50 0.69 0.9 11.17 9 572.81
20 Rams 5.85 0.70 0.9 11.17 823.34
Stock sales388.4 Wether hoggets 39.00 \hd 15 147.60121.9 Ewe hoggets 42.33 \hd 5 160.03232.7 Cull ewes 46 kg lw. \hd @ 50 ¢/kg lw. 5 352.10
5 Cull rams 74 kg lw. \hd @ 50 ¢/kg lw. 185.00
Total Income 76 829.23
Variable Costs:Shearing Ewes, hoggets 1 793.9 @ 3.52 \hd 6 314.53
Rams 20 @ 5.02 \hd 100.40Crutching Ewes, hoggets 1 825 @ 0.56 \hd 1 022.00
Rams 20 @ 1.12 \hd 22.40Animal health Drenching Adults/hoggets (broadspect.) 1 783.9 x2@ 0.19 \hd 677.88
Lambs (broadspect.) 811.1 x3@ 0.13 \hd 316.33Adults/hoggets (narrowspect.) 1783.9 x3@ 0.21 \hd 1 123.86
Lambs (narrowspect.) 811.1 x3@ 0.14 \hd 340.66Vaccination Adults/hoggets 1783.9 @ 0.34 \hd 606.53
Lambs 811.1 x2@ 0.34 \hd 551.55Dipping Adults/hoggets 1 783.9 @ 0.32 \hd 570.85Jetting Adults/hoggets 1 783.9 @ 0.21 \hd 374.62
weaners 811.1 @ 0.11 \hd 89.22Mulesing,marking Lambs 811.1 @ 0.90 \hd 729.99Wool tax Wool revenue $ 50 985 @ 2% 1 019.70Commission Wool revenue $ 50 985 @ 1.3% 662.81Wool warehousing, testing 25.4 @ 23.39 \bale 594.11

49
Wool cartage 25.4 @ 12.50 \bale 317.50Wool packs 25.4 @ 9.50 \bale 241.30Stock Cartage Sales/ Purchases 748 @ 1.50 \hd 1 122.00Commission/yarddues Stock sales revenue $25 845 @ 4.5% 1 163.03MLA Levy $25 845 @ 2% 516.90 Replacements
Rams 5 @ 800 \hd 4 000.00
Total Costs 22 478.17
Gross margin 54 351.06Gross margin per ewe 54.35
Since the LP is based upon single breeding units, decimal places are included in the gross margin to determinecosts and income per breeding unit.
Average ewe liveweight: 45 kg
Ewe age structure:Age (years) Number2 2643 2544 2455 237Total joined 1000cfa ewes 233
• It is assumed that ewes are shorn pre-lambing.• Hoggets not retained are sold at 18 months of age after one shearing.• DSE rating as determined by model is 2.2 (based upon a 50 kg Merino wether).

50
Enterprise: Prime Lamb production (second-cross lambs)
Enterprise Unit: 1000 first-cross ewesRepresentative Year - 2001 dollar values
Flock parameters:
Weaning rate 108 %Weaning age 3 monthsAdult mortality 3.5 %Hogget mortality 3 %Lamb mortality 5 %Ram requirement 2 %Ram cull rate 25 %Ewe cull age 5.5 years
Income:Wool sales
kg/hd(greasy)
Yield(%)
Pcs/blsfactor
Cleanprice($/kg)
Total
1 006 Ewes 4.6 0.68 0.9 5.66 16 385.8520 Rams 3.8 0.72 0.9 5.66 284.94
Stock sales1062.1 Prime lambs 48 kg lw. \hd @ 100 ¢/kg lw. 50 980.80
232.7 Cull ewes 57 kg lw. \hd @ 50 ¢/kg lw. 6 631.955 Cull rams 82 kg lw. \hd @ 50 ¢/kg lw. 205.00
Total Income 74 488.54
Variable Costs:Shearing Ewes, hoggets 1 006 @ 3.52 \hd 3 541.12
Rams 20 @ 5.02 \hd 100.40Crutching Ewes, hoggets 1 000 @ 0.56 \hd 560.00
Rams 20 @ 1.12 \hd 22.40Animal health Drenching Adults/hoggets (broadspect.) 1 005.4 x2@ 0.19 \hd 382.05
Lambs (broadspect.) 1071 @ 0.13 \hd 139.23Adults/hoggets (narrowspect.) 1 005.4 x3@ 0.21 \hd 633.40
Lambs (narrowspect.) 1071 @ 0.14 \hd 149.94Vaccination Adults/hoggets 1 005.4 @ 0.34 \hd 341.84
Lambs 1 071 @ 0.34 \hd 364.14Dipping Adults/hoggets 1 005.4 @ 0.32 \hd 321.73Jetting Adults/hoggets 1 005.4 @ 0.21 \hd 211.13Marking Lambs 811 @ 0.90 \hd 729.90Wool tax Wool revenue $ 16 668 @ 2% 333.36Commission Wool revenue $ 16 668 @ 1.3% 216.68Wool warehousing, testing 16.4 @ 23.39 \bale 383.60Wool cartage 16.4 @ 12.50 \bale 205.00Wool packs 16.4 @ 9.50 \bale 155.80Stock Cartage Sales/ Purchases 1 299.7 @ 1.50 \hd 1 949.55Commission/yard dues Stock sales revenue $57 818 @ 4.5% 2 601.80MLA Levy $57 818 @ 2% 1 156.36

51
Replacements Replacement ewes 263.5 @ 55 \hd 14 492.50
Rams 5 @ 450 \hd 2 250.00
Total Costs 30 776.26
Gross margin 43 712.28Gross margin per ewe 43.71
Since the LP is based upon single breeding units, decimal places are included in the gross margin to determinecosts and income per breeding unit.
Average ewe liveweight: 56 kg
Ewe age structure:Age (years) Number2 2643 2544 2455 237Total joined 1000cfa ewes 233
• It is assumed that ewes are shorn pre-lambing.• DSE rating as determined by model is 2.1 (based upon a 50 kg Merino wether).

52
Enterprise: Merino wethers (19 micron)
Enterprise Unit: 1000 wethersRepresentative Year - 2001 dollar values
Flock parameters:
Adult mortality 2 %Wether cull age 5.5 years
Income:Wool sales
kg/hd(greasy)
Yield(%)
Pcs/blsfactor
Cleanprice($/kg)
Total
983 Wethers 4.75 0.70 0.90 11.17 32 857.98
Stock sales237 Cull wethers 45 kg lw. \hd @ 50 ¢/kg lw. 5 332.50
Total Income 38 190.48
Variable Costs:Shearing Wethers 983 @ 3.52 \hd 3 460.16Crutching Wethers 1 000 @ 0.59 \hd 590.00Animal health Drenching Wethers (broadspect.) 1 000 x2@ 0.19 \hd 380.00
Wethers (narrowspect.) 1 000 x3@ 0.21 \hd 630.00Vaccination Wethers 1 000 @ 0.34 \hd 340.00Dipping Wethers 1 000 @ 0.32 \hd 320.00Jetting Wethers 1 000 @ 0.21 \hd 210.00Wool tax Wool revenue $ 32 858 @ 2% 657.16Commission Wool revenue $ 32 858 @ 1.3% 427.15Wool warehousing, testing 16.7 @ 23.39 \bale 390.61Wool cartage 16.7 @ 12.50 \bale 208.75Wool packs 16.7 @ 9.50 \bale 158.65Stock Cartage Sales/ Purchases 237 @ 1.50 \hd 355.50Commission/yarddues Stock sales revenue $5 333 @ 4.5% 239.99MLA Levy $5 333 @ 2% 106.66 Replacements
Wether hoggets 258 @ 39 \hd 10 062.00
Total Costs 18 536.63
Gross margin 19 653.85Gross margin per wether 19.65
Since the LP is based upon single breeding units, decimal places are included in the gross margin to determinecosts and income per breeding unit.

53
Average wether liveweight: 45 kg
Wether age structure:Age (years) Number1.5 2582.5 2533.5 2474.5 242Total 10005.5 cfa wethers 237
• Hoggets transferred into flock at 17 months.• Wethers are shorn in November.• DSE rating as determined by model is 0.9 (based upon a 50 kg Merino wether).
Supplementary Feeding Enterprise Budgets
Enterprise: Supplementary feedingRepresentative Year - 2001 dollar values
Fodder conservationUnit Cost ($)
Mowing and raking ha 40.00Conditioning ha 10.00Bailing and cartage tonne 30.00Silage wrapping tonne 40.00Feed out cost (hay/silage) tonne 10.00
Purchased supplementsPurchased hay – landed tonne (85%DM, 8 MJ ME/kg) 140.00Purchased grain - landed tonne (88% DM, 12 MJ ME/kg) 150.00
• Other supplementary feed assumptions include that the utilisation rate of hay, silage and grain fed to stock is85% and the dry matter percentage of silage is 45% with an average energy content of 9 ME MJ/kg.
• The model has several constraints including:- a maximum of 10 tonnes (DM basis) of feed grain can be purchased in the year,- a maximum of 10 tonnes (DM basis) of hay can be purchased in the year, and- fodder conservation cannot exceed 10 hectares on the perennial pasture area and 20 hectares of the
forage oats area.

54
Appendix C: Pasture Production Assumptions
Pasture Production (t DM/ha)Perennial Native Forage Oats
January 1.28 0.99 0February 1.42 1.00 0March 1.38 0.81 0.50April 0.90 0.32 0.85May 0.45 0.13 0.56June 0.32 0.10 0.55July 0.30 0.10 0.56August 0.42 0.20 0.85September 0.81 0.48 1.40October 1.30 0.87 1.57November 1.60 1.06 0.70December 1.55 1.03 0
Pasture Quality (MJ ME/kg)Perennial Native Forage Oats
January 10.0 8.0 0.0February 9.5 8.0 0.0March 9.0 8.0 0.0April 8.0 8.0 9.0May 8.0 8.0 9.0June 7.5 7.5 8.0July 7.5 7.5 8.0August 7.5 7.5 8.0September 9.0 8.0 9.0October 10.0 10.0 8.0November 10.7 10.0 8.0December 10.5 9.0 0.0
Pasture carry-over assumptions
DM as % Previous
MonthME as % Previous
monthJanuary 0.9 0.67February 0.9 0.72March 0.9 0.71April 0.9 0.75May 0.9 0.73June 0.9 0.73July 0.9 0.65August 0.9 0.60September 0.9 0.67October 0.9 0.75November 0.9 0.75December 0.9 0.70
It is assumed in the model that a maximum of 50% of pasture grown is available to livestock. In practise thismeans that in the lowest pasture growth month/s of the year the maximum amount of pasture utilised will be50% while in other months pasture utilisation will be less than this amount.

55
NSW Agriculture
Economic Research Report seriesNumber
1 Brennan, J.P. and Bantilan, M.C.S. 1999, Impact of ICRISAT Research on Australian Agriculture, Reportprepared for Australian Centre for International Agricultural Research, Economic Research ReportNo. 1, NSW Agriculture, Wagga Wagga.
2 Davies, B.L., Alford, A. and Hollis, G. 1999, Analysis of ABARE Dairy Data for Six Regions in NSW1991-92 to 1996-97, Economic Research Report No. 2, NSW Agriculture, C.B. Alexander College,Paterson.
3 Brennan, J.P. and Singh, R.P. 2000, Economic Assessment of Improving Nutritional Characteristics ofFeed Grains, Report prepared for Grains Research and Development Corporation, EconomicResearch Report No. 3, Wagga Wagga.
4 Zhao. X., Mullen, J.D., Griffith, G.R., Griffiths, W.E. and Piggott, R.R. 2000, An EquilibriumDisplacement Model of the Australian Beef Industry, Economic Research Report No. 4, NSWAgriculture, Armidale.
5 Griffith, G., I’Anson, K., Hill, D., Lubett, R. and Vere, D. 2001. Previous Demand Elasticity Estimatesfor Australian Meat Products, Economic Research Report No. 5, NSW Agriculture, Armidale.
6 Griffith, G., I’Anson, K., Hill, D. and Vere, D. 2001. Previous Supply Elasticity Estimates for AustralianBroadacre Agriculture, Economic Research Report No. 6, NSW Agriculture, Armidale.
7 Patton, D.A. and Mullen, J.D. 2001, Farming Systems in the Central West of NSW: An EconomicAnalysis, Economic Research Report No. 7, NSW Agriculture, Trangie.
8 Brennan, J.P. and Bialowas, A. 2001, Changes in Characteristics of NSW Wheat Varieties, 1965-1997,Economic Research Report No. 8, NSW Agriculture, Wagga Wagga.
9 Mullen, J.D. 2001, An Economic Perspective on Land Degradation Issues, Economic Research ReportNo. 9, NSW Agriculture, Orange.
10 Singh, R.P., Faour, K.Y., Mullen, J.D. and Jayasuriya, R. 2003, Farming Systems in the MurrumbidgeeIrrigation Area in NSW, Economic Research Report No. 10, NSW Agriculture, Yanco.
11 Brennan, J.P., Aw-Hassan, A., Quade, K.J. and Nordblom, T.L. 2002, Impact of ICARDA Research onAustralian Agriculture, Economic Research Report No. 11, NSW Agriculture, Wagga Wagga.
12 Alford, A., Griffith, G. and Davies, L. 2003, Livestock Farming Systems in the Northern Tablelands ofNSW: An Economic Analysis, Economic Research Report No. 12, NSW Agriculture, Armidale.
13 Alford, A., Griffith, G. and Cacho, O. 2003, A Northern Tablelands Whole-Farm Linear Program forEconomic Evaluation of New Technologies at the Farm Level, Economic Research Report No. 13,NSW Agriculture, Armidale.