liveable, healthy, sustainable · sustainable: melanie lowe1&2, carolyn whitzman1, hannah...
TRANSCRIPT
Liveable, Healthy, Sustainable:
Melanie Lowe1&2, Carolyn Whitzman1, Hannah Badland2, Melanie Davern2, Dominique Hes1, Lu Aye3, Iain Butterworth4, Billie Giles-Corti2 1Faculty of Architecture, Building and Planning2McCaughey VicHealth Centre for Community Wellbeing 3Melbourne School of Engineering4Department of Health, Victorian Government
Place, Health and Liveability Research Program
Research Paper 1 May 2013
What Are the Key Indicators for Melbourne Neighbourhoods?

2
3
CONTENTS
ISBN: 978-0-9804620-2-9
Executive Summary ....................................................................................................................................................... 5
1. Introduction ............................................................................................................................................................... 7
1.1 Why Liveability? Why Health? Why Sustainability? Why Indicators? ...................................................................... 7
1.2 The Place, Health Liveability Research Program .................................................................................................... 8
2. Methods .................................................................................................................................................................... 9
2.1 Electronic Database Searches ............................................................................................................................... 9
2.2 Other Searches ..................................................................................................................................................... 9
2.3 Inclusion and Exclusion Criteria ............................................................................................................................. 9
2.4 Identifying and Evaluating Liveability Indicators .................................................................................................... 10
3. What is Liveability? ................................................................................................................................................. 11
3.1 Definitions of Liveability........................................................................................................................................ 11
3.2 The Relationship between Liveability, Health and Sustainability ............................................................................ 12
4. Liveability Indicators ............................................................................................................................................... 14
4.1 Applications ........................................................................................................................................................ 14
4.2 The Types of Indicators Identified ........................................................................................................................ 15
5. Discussion and Next Steps .................................................................................................................................... 17
6. Appendix A - Indicators: What Might Work in Melbourne ........................................................................................ 19
6.1 Policy Area: Crime and Safety ............................................................................................................................. 20
6.2 Policy Area: Housing ........................................................................................................................................... 21
6.3 Policy Area: Education ........................................................................................................................................ 24
6.4 Policy Area: Employment and Income ................................................................................................................. 27
6.5 Policy Area: Health and Social Services ............................................................................................................... 30
6.6 Policy Area: Transport ......................................................................................................................................... 34
6.7 Policy Area: Public Open Space .......................................................................................................................... 40
6.8 Policy Area: Community Cohesion and Local Democracy .................................................................................... 42
6.9 Policy Area: Leisure and Culture .......................................................................................................................... 45
6.10 Policy Area: Food and Other Local Goods ......................................................................................................... 48
6.11 Policy Area: Natural Environment ....................................................................................................................... 50
7. Appendix B - Databases Searched .......................................................................................................................... 53
8. References .............................................................................................................................................................. 54
Suggested citation: Lowe, M., Whitzman, C., Badland, H., Davern, M., Hes, D., Aye, L., Butterworth, I. and Giles-Corti, B. (2013), Liveable, healthy, sustainable: What are the key indicators for Melbourne neighbourhoods? Research Paper 1, Place, Health and Liveability Research Program, University of Melbourne http://mccaugheycentre.unimelb.edu.au/research/health_and_liveability

4
5
Executive Summary
Over the last decade, ‘liveability’ has become an increasingly popular term used in Australian urban policy, mirroring an international trend. Australian cities tend to fare well in the best-known liveability rankings of cities, because of relatively low crime rates, a high proportion of green open space, relatively good transport systems, and the availability of good educational opportunities in the central parts of its major cities. However, there are concerns about growing disparities within cities, in Australia and internationally.
The Place, Health, and Liveability Research Program was established in July 2011, from a partnership between the University of Melbourne and the Victorian State Government Department of Health. The overall goal of the research program is to create evidence to inform public policy that can build healthy, liveable and sustainable communities in Victoria and beyond.
This research paper, the first arising from this research program, provides an overview of current academic and policy literature on liveability indicators. This literature review is intended to inform future work on the impact of planning policy on health and wellbeing outcomes. It is also intended to inform the current framework of Community Indicators Victoria, a state-wide resource for engaging communities and local governments around wellbeing, and MUtopia, a modelling and visualisation platform for developing sustainable precincts. All of these projects have a strong interest in developing indicators that are evidence-based, specific and quantifiable, relevant to the Australian policy context, and able to be measured at both city-wide and neighbourhood-level scales.
The literature review found a strong overlap between the concepts of liveability and social determinants of health, with environmental sustainability being an underlying determinant of both health and liveability. Eleven policy domains were identified that influence liveability. However, many if not most, indicators found in the literature review need further development and testing if they are to be useful for measuring disparities within cities, and can be conclusively linked to changes in behaviour or health and wellbeing outcomes.

6
7
1 Introduction
1.1WHY LIVEABILITY? WHY HEALTH? WHY SUSTAINABILITY? WHY INDICATORS?
Over the last decade, ‘liveability’ has become an increasingly popular term used in Australian urban policy, mirroring an international trend. For example, the Planning Institute of Australia entitled its 2004 national position paper on the future of cities, Liveable Communities: How the Commonwealth Can Foster Sustainable Cities and Regions [1]. The Government of Western Australia’s state planning policy is Liveable Neighbourhoods [2], and the Australian Government has named liveability as one of three goals in their 2011 national urban policy, Our Cities, Our Future [3]. In Victoria, the Victorian Competition and Efficiency Commission completed an enquiry into enhancing Victoria’s liveability in 2008 [4]. In the same year, the Victorian Growth Areas Authority released a report titled A Strategic Framework for Creating Liveable New Communities [5]. Concern about Melbourne’s urban fringe growth areas has prompted a recent Victorian parliamentary Inquiry into Liveability Options in Outer Suburban Melbourne [6].
There are a wide range of factors that enhance a community, and make it a desirable place to live. Australian cities tend to fare well in the best-known international liveability rankings of cities, such as those produced by the Economist Intelligence Unit, because of relatively low crime rates, high proportions of public open space, relatively good transport systems, and the availability of good educational opportunities, particularly in central parts of capital cities [7, 8].
However, there are concerns about growing disparities within cities in Australia and internationally [9, 10]. Some communities are experiencing significant problems with regards to liveability, such as a lack of affordable housing, marginalisation of lower income populations, poor education, social and health infrastructure, limited access between homes, workplaces and shops, and related dependence on cars, with low rates of walking, cycling and public transport use [11]. Growth areas in Australian cities are a key concern, particularly new low-density outer suburban growth areas. Some growth areas are experiencing such rapid growth in their populations that it is difficult for essential services and infrastructure provision, let alone employment, to keep up [6].
Growing disparities within Australian cities have implications for health and wellbeing as well as liveability. Another recent parliamentary Inquiry into Environmental Design and Public Health in Victoria heard evidence on how some outer suburbs have poorer air quality and access to green spaces, with residents performing less physical activity and have fewer opportunities for social interaction and community building [12]. All of these factors have a direct or indirect negative impact on the health and wellbeing of residents [13, 14].
There is also a strong interest in environmental sustainability assessment tools, such as Green Star rating systems for buildings and developments. These tools have recently been scaled up to neighbourhood/precinct level. The question is how these environmental sustainability indicators and assessment tools might interact with liveability and health indicators, in order to provide a more integrated impact assessment of new developments.
In short, a diverse range of indicators and indices are now being used to measure liveability, and to compare cities and regions. To date, however, inadequate attention has been paid to the validity of liveability measures or their usefulness for research, policy or practice. In particular, intra-city or neighbourhood-scale indicators should be informed by known causal pathways between policy, built environment characteristics, individual behaviours, and health and wellbeing outcomes. There has also been little exploration of the conceptual relationship between indicators of liveability, health and wellbeing and environmental sustainability.
8
1.2THE PLACE, HEALTH AND LIVEABILITY RESEARCH PROGRAM
In response to these research gaps, this research paper provides an overview of current academic and policy-oriented literature on liveability indicators. This literature review was funded by an Interdisciplinary Seed Grant from two University of Melbourne Research Institutes: Social Equity and Sustainable Societies. It was conducted as part of the Place, Health and Liveability Research Program, a joint program of the University of Melbourne’s Faculty of Architecture, Building and Planning and the McCaughey VicHealth Centre for Community Wellbeing (School of Population and Global Health, Faculty of Medicine, Dentistry and Health Sciences). This program involves a partnership between health and urban planning researchers at the University of Melbourne, the North and West Metropolitan Region (NWMR) of the Victorian Department of Health, and the members of the NWMR Regional Management Forum. The overall goal of the research program is to create evidence to inform public policy that can build healthy, liveable and sustainable communities in Victoria and beyond. This literature review is intended to inform future work on the impact of planning policy on health and wellbeing outcomes.
It is also intended to inform the current framework of health and wellbeing used by Community Indicators Victoria, a program based at the University of Melbourne’s McCaughey VicHealth Centre for Community Wellbeing (http://www.communityindicators.net.au/). Community Indicators Victoria is a state-wide resource for engaging communities and local governments around wellbeing. The indicators reviewed will also inform MUtopia, a modelling and visualization platform for developing sustainable precincts (http://mutopia.unimelb.edu.au/), likewise based at the University of Melbourne.
The report begins by outlining the objectives of the review and the methods for reviewing the literature and analysing indicators. It then explores the various definitions of liveability, the close relationship between liveability, health and sustainability, and how indicators have been used. This is followed by a general discussion of the strengths and weakness of the indicators used to date, implications for policy and practice and recommendations for future areas of liveability indicator research. Appendix A lists specific liveability indicators identified in this literature review. Indicators are grouped into 11 policy areas, with the most promising indicators in each being identified.
9
2 Methods
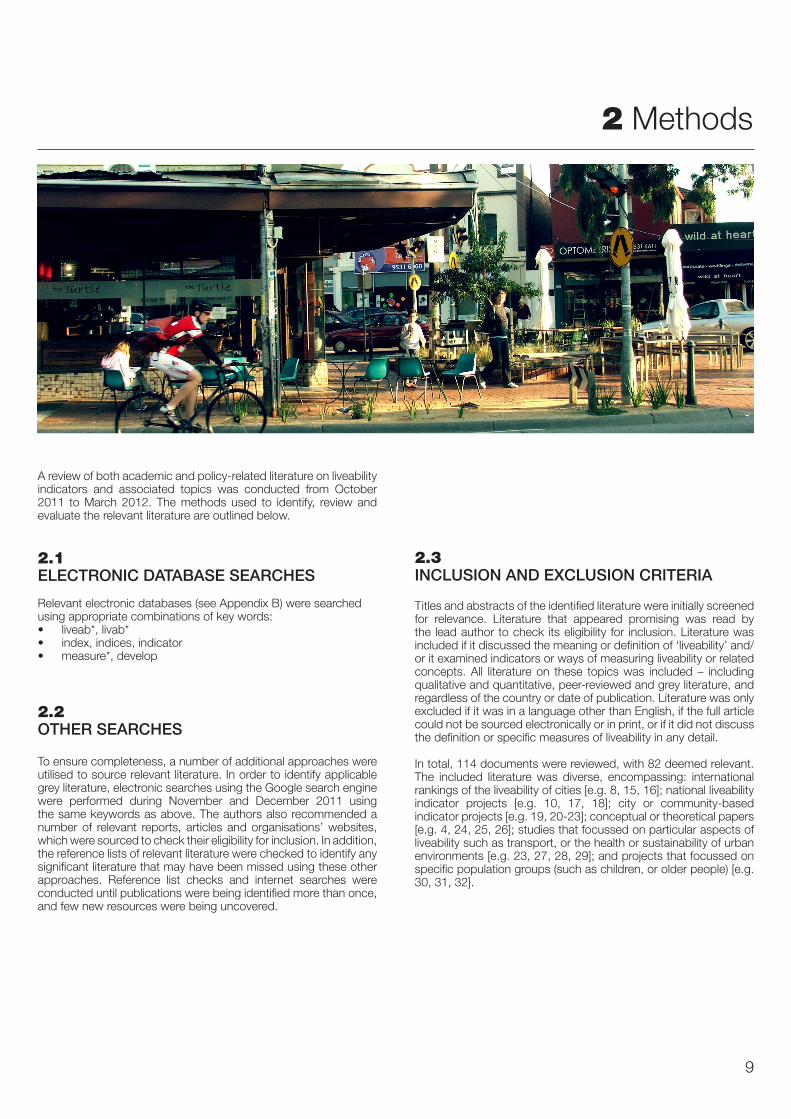
A review of both academic and policy-related literature on liveability indicators and associated topics was conducted from October 2011 to March 2012. The methods used to identify, review and evaluate the relevant literature are outlined below.
2.1 ELECTRONIC DATABASE SEARCHES
Relevant electronic databases (see Appendix B) were searched using appropriate combinations of key words:• liveab*, livab* • index, indices, indicator• measure*, develop
2.2 OTHER SEARCHES
To ensure completeness, a number of additional approaches were utilised to source relevant literature. In order to identify applicable grey literature, electronic searches using the Google search engine were performed during November and December 2011 using the same keywords as above. The authors also recommended a number of relevant reports, articles and organisations’ websites, which were sourced to check their eligibility for inclusion. In addition, the reference lists of relevant literature were checked to identify any significant literature that may have been missed using these other approaches. Reference list checks and internet searches were conducted until publications were being identified more than once, and few new resources were being uncovered.
2.3 INCLUSION AND EXCLUSION CRITERIA
Titles and abstracts of the identified literature were initially screened for relevance. Literature that appeared promising was read by the lead author to check its eligibility for inclusion. Literature was included if it discussed the meaning or definition of ‘liveability’ and/or it examined indicators or ways of measuring liveability or related concepts. All literature on these topics was included – including qualitative and quantitative, peer-reviewed and grey literature, and regardless of the country or date of publication. Literature was only excluded if it was in a language other than English, if the full article could not be sourced electronically or in print, or if it did not discuss the definition or specific measures of liveability in any detail.
In total, 114 documents were reviewed, with 82 deemed relevant. The included literature was diverse, encompassing: international rankings of the liveability of cities [e.g. 8, 15, 16]; national liveability indicator projects [e.g. 10, 17, 18]; city or community-based indicator projects [e.g. 19, 20-23]; conceptual or theoretical papers [e.g. 4, 24, 25, 26]; studies that focussed on particular aspects of liveability such as transport, or the health or sustainability of urban environments [e.g. 23, 27, 28, 29]; and projects that focussed on specific population groups (such as children, or older people) [e.g. 30, 31, 32].
10
2.4 IDENTIFYING AND EVALUATING LIVEABILITY INDICATORS
A focus of this work was to identify and evaluate indicators that have been employed to measure the various determinants of liveability, with a particular interest in measures used at the community scale. Therefore, it was important to adopt an agreed conceptual framework about what defines an indicator and how to assess an indicator’s utility. Whilst there are some similarities between definitions, there appears to be no single accepted definition of an indicator [33]. So as not to unduly narrow the scope of enquiry, a broad definition was adopted for this research:
‘…an indicator is a measure or a set of measures that describes a complex social, economic or physical reality, and a measure is one data point that acts as a gauge to tell us how well or poorly we are doing with respect to an indicator’ [34, p. 104].
In general, both subjective and objective indicators are considered important for measuring liveability [35]. Objective indicators generally use existing or collected data that measures concrete facts (such as the number of doctors per capita). Subjective indicators measure individuals’ beliefs and perceptions about their local environment (such as whether they feel safe walking alone in their neighbourhood after dark), and thus usually involve community surveys.
The literature also suggests that, in order to be useful, indicators should be designed to highlight issues of concern, provide measures of progress, and stimulate discussion for future actions. They must be measurable and quantifiable using valid data sources, defined explicitly, linked to theory, and be sensitive to changes in public policy [5, 33, 34, 36].
Four specific criteria were developed by the authors to assess the utility and the strengths and weaknesses of the liveability indicators identified. These were:
1. Is the indicator significant to liveability and/or the social determinants of health and wellbeing in urban areas?
2. Is the indicator specific and quantifiable?
3. Can the indicator be measured at the appropriate level(s) and scale(s), so that local areas within a city can be compared?
4. Is the indicator relevant to Australian urban policy?
These criteria were used to divide the identified indicators into three categories according to their utility to the Place Health and Liveability Research Program:
1. Indicators that are promising because they meet all or most of the criteria above;
2. Indicators that may be useful but require further development to meet those criteria; and
3. Indicators that are not useful for our purposes, either because they fail to meet the criteria of interest, or because they are redundant due to similar, more promising measures.
Subjective judgements needed to be made when assessing the indicators, particularly with regards to the first criterion, where the relevance and importance of each indicator required appraisal. As Cox et al [37] argue, the selection and use of indicators is informed by debates between competing values and priorities. The subjective nature of the assessment is particularly appropriate in this context, given that liveability itself is a subjective concept, as outlined below.
Preliminary findings of this literature review were workshopped on two occasions towards the end of the project. A workshop was held with approximately 80 local and Victorian state government policymakers and planners, at the North and West Regional Management Forum Integrated Planning Conference in October 2012. Another workshop was held with approximately 50 local and Victorian state government planners and researchers, at the Thriving Neighbourhoods Conference in November 2012. After the draft report was completed, a paper was presented at the Urban Affairs Association Conference in San Francisco, US, in April 2013, as part of a conference stream on indicators. All of the comments from these presentations have been incorporated into the final report.
11
3 What is Liveability?
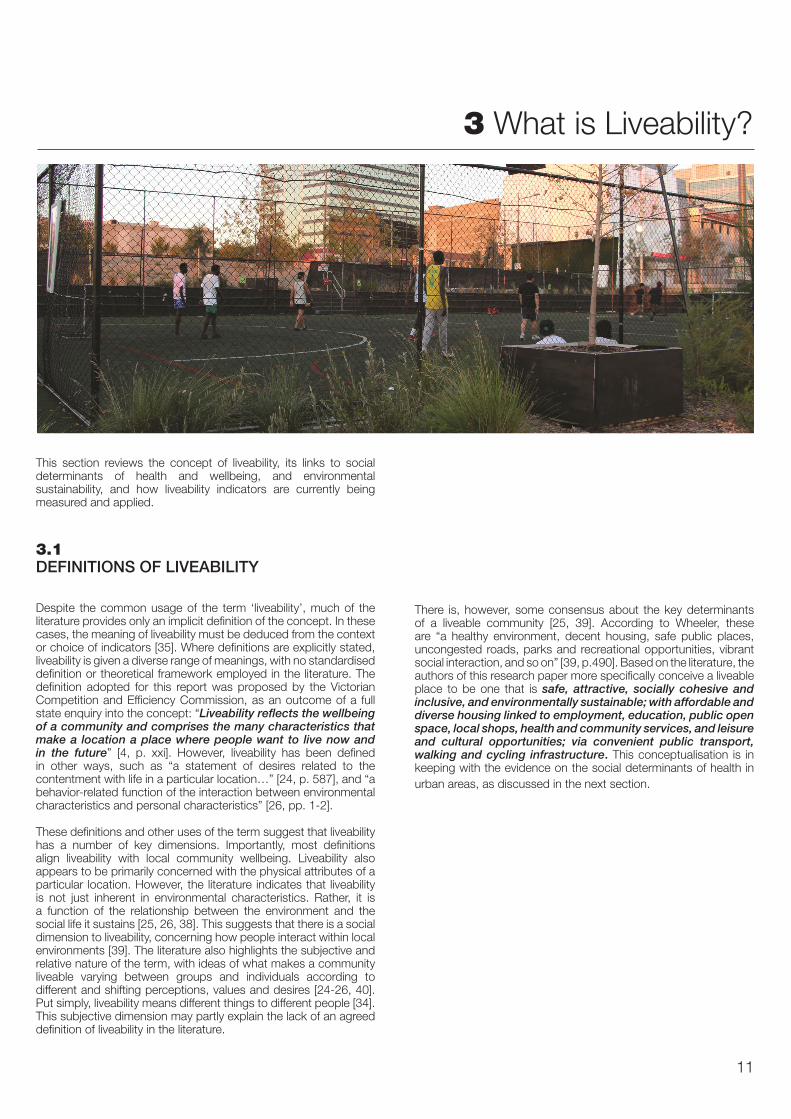
This section reviews the concept of liveability, its links to social determinants of health and wellbeing, and environmental sustainability, and how liveability indicators are currently being measured and applied.
3.1DEFINITIONS OF LIVEABILITY
Despite the common usage of the term ‘liveability’, much of the literature provides only an implicit definition of the concept. In these cases, the meaning of liveability must be deduced from the context or choice of indicators [35]. Where definitions are explicitly stated, liveability is given a diverse range of meanings, with no standardised definition or theoretical framework employed in the literature. The definition adopted for this report was proposed by the Victorian Competition and Efficiency Commission, as an outcome of a full state enquiry into the concept: “Liveability reflects the wellbeing of a community and comprises the many characteristics that make a location a place where people want to live now and in the future” [4, p. xxi]. However, liveability has been defined in other ways, such as “a statement of desires related to the contentment with life in a particular location…” [24, p. 587], and “a behavior-related function of the interaction between environmental characteristics and personal characteristics” [26, pp. 1-2].
These definitions and other uses of the term suggest that liveability has a number of key dimensions. Importantly, most definitions align liveability with local community wellbeing. Liveability also appears to be primarily concerned with the physical attributes of a particular location. However, the literature indicates that liveability is not just inherent in environmental characteristics. Rather, it is a function of the relationship between the environment and the social life it sustains [25, 26, 38]. This suggests that there is a social dimension to liveability, concerning how people interact within local environments [39]. The literature also highlights the subjective and relative nature of the term, with ideas of what makes a community liveable varying between groups and individuals according to different and shifting perceptions, values and desires [24-26, 40]. Put simply, liveability means different things to different people [34]. This subjective dimension may partly explain the lack of an agreed definition of liveability in the literature.
There is, however, some consensus about the key determinants of a liveable community [25, 39]. According to Wheeler, these are “a healthy environment, decent housing, safe public places, uncongested roads, parks and recreational opportunities, vibrant social interaction, and so on” [39, p.490]. Based on the literature, the authors of this research paper more specifically conceive a liveable place to be one that is safe, attractive, socially cohesive and inclusive, and environmentally sustainable; with affordable and diverse housing linked to employment, education, public open space, local shops, health and community services, and leisure and cultural opportunities; via convenient public transport, walking and cycling infrastructure. This conceptualisation is in keeping with the evidence on the social determinants of health in urban areas, as discussed in the next section.
12
3.2 THE RELATIONSHIP BETWEEN LIVEABILITY, HEALTH AND SUSTAINABILITY
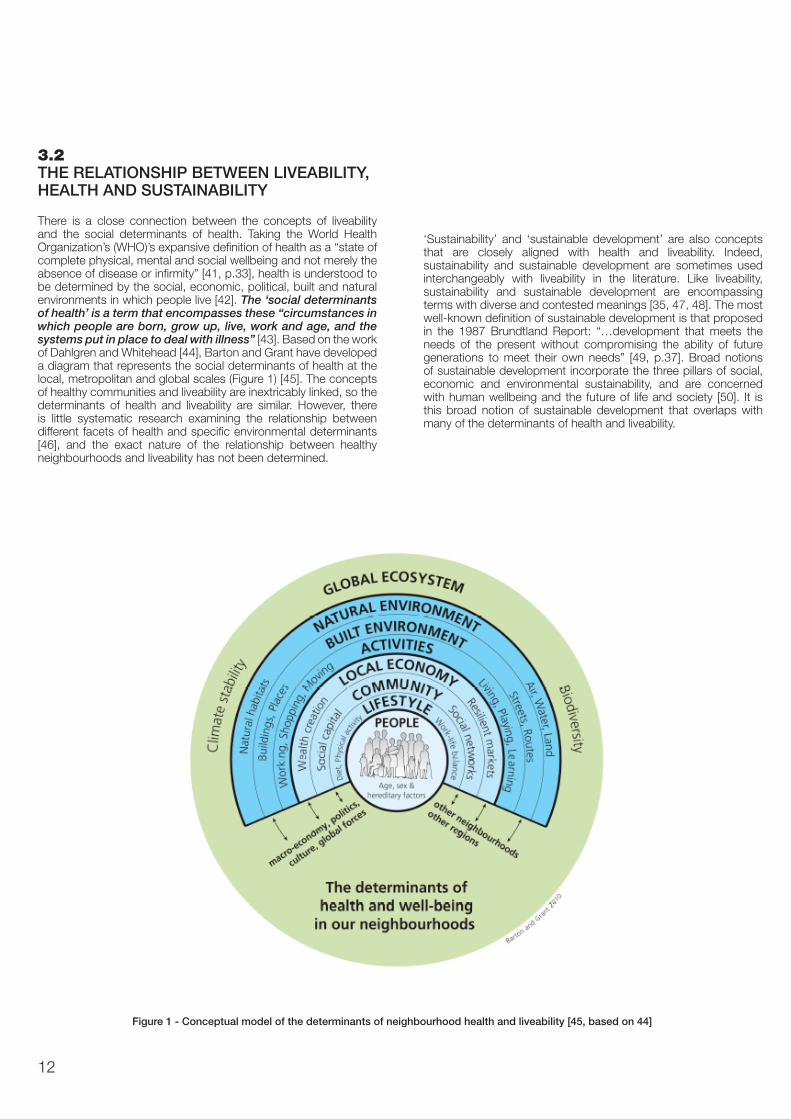
There is a close connection between the concepts of liveability and the social determinants of health. Taking the World Health Organization’s (WHO)’s expansive definition of health as a “state of complete physical, mental and social wellbeing and not merely the absence of disease or infirmity” [41, p.33], health is understood to be determined by the social, economic, political, built and natural environments in which people live [42]. The ‘social determinants of health’ is a term that encompasses these “circumstances in which people are born, grow up, live, work and age, and the systems put in place to deal with illness” [43]. Based on the work of Dahlgren and Whitehead [44], Barton and Grant have developed a diagram that represents the social determinants of health at the local, metropolitan and global scales (Figure 1) [45]. The concepts of healthy communities and liveability are inextricably linked, so the determinants of health and liveability are similar. However, there is little systematic research examining the relationship between different facets of health and specific environmental determinants [46], and the exact nature of the relationship between healthy neighbourhoods and liveability has not been determined.
‘Sustainability’ and ‘sustainable development’ are also concepts that are closely aligned with health and liveability. Indeed, sustainability and sustainable development are sometimes used interchangeably with liveability in the literature. Like liveability, sustainability and sustainable development are encompassing terms with diverse and contested meanings [35, 47, 48]. The most well-known definition of sustainable development is that proposed in the 1987 Brundtland Report: “…development that meets the needs of the present without compromising the ability of future generations to meet their own needs” [49, p.37]. Broad notions of sustainable development incorporate the three pillars of social, economic and environmental sustainability, and are concerned with human wellbeing and the future of life and society [50]. It is this broad notion of sustainable development that overlaps with many of the determinants of health and liveability.
Figure 1 - Conceptual model of the determinants of neighbourhood health and liveability [45, based on 44]
13
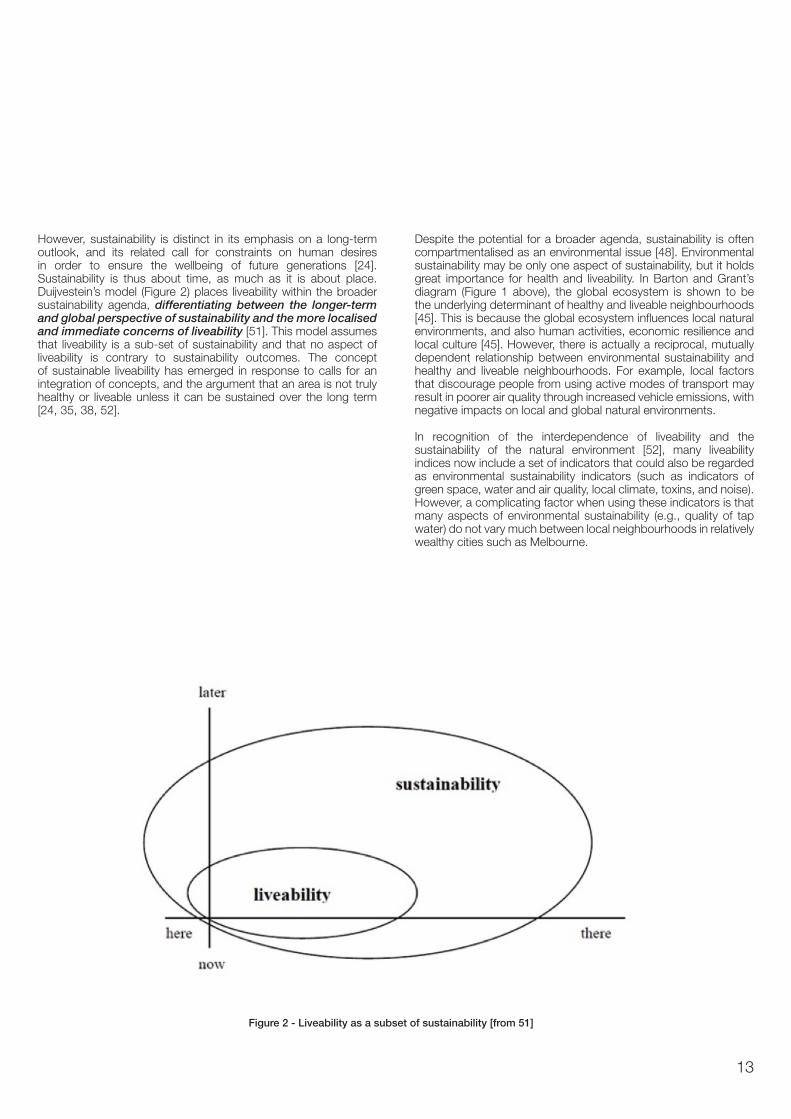
Figure 2 - Liveability as a subset of sustainability [from 51]
Despite the potential for a broader agenda, sustainability is often compartmentalised as an environmental issue [48]. Environmental sustainability may be only one aspect of sustainability, but it holds great importance for health and liveability. In Barton and Grant’s diagram (Figure 1 above), the global ecosystem is shown to be the underlying determinant of healthy and liveable neighbourhoods [45]. This is because the global ecosystem influences local natural environments, and also human activities, economic resilience and local culture [45]. However, there is actually a reciprocal, mutually dependent relationship between environmental sustainability and healthy and liveable neighbourhoods. For example, local factors that discourage people from using active modes of transport may result in poorer air quality through increased vehicle emissions, with negative impacts on local and global natural environments.
In recognition of the interdependence of liveability and the sustainability of the natural environment [52], many liveability indices now include a set of indicators that could also be regarded as environmental sustainability indicators (such as indicators of green space, water and air quality, local climate, toxins, and noise). However, a complicating factor when using these indicators is that many aspects of environmental sustainability (e.g., quality of tap water) do not vary much between local neighbourhoods in relatively wealthy cities such as Melbourne.
However, sustainability is distinct in its emphasis on a long-term outlook, and its related call for constraints on human desires in order to ensure the wellbeing of future generations [24]. Sustainability is thus about time, as much as it is about place. Duijvestein’s model (Figure 2) places liveability within the broader sustainability agenda, differentiating between the longer-term and global perspective of sustainability and the more localised and immediate concerns of liveability [51]. This model assumes that liveability is a sub-set of sustainability and that no aspect of liveability is contrary to sustainability outcomes. The concept of sustainable liveability has emerged in response to calls for an integration of concepts, and the argument that an area is not truly healthy or liveable unless it can be sustained over the long term [24, 35, 38, 52].
14
4 Liveability Indicators
4.1 APPLICATIONS
There are many ways to measure liveability. Individual indicators measure the hypothesised determinants or components of liveability, whilst indices combine a number of different indicators or sub-components of liveability, in an attempt to measure the overall liveability outcomes of an area. Indicators and indices are used in various ways. The choice of indicators/indices is partly determined by the intended purpose of measuring liveability.
Major international studies such as the Mercer Quality of Living Survey and the Economist Intelligent Unit’s Liveability Index rank cities around the world on their current liveability, in order to guide business investment and the appropriate remuneration of expatriates [7, 15]. These comparative studies highlight how liveability can be used as a competitive and place-marketing tool for attracting both people and businesses to a city or region [38]. Other indices are used to compare different neighbourhoods or sub-areas within a city or region, often with a more explicit policy-making focus [20, 27]. Whilst some studies provide a snap-shot of an area’s liveability at one point in time [53], others track the liveability of localities over time [7, 19, 20, 54].
Another group of indices are impact assessment tools. These are used to determine the likely consequences of a proposed policy or development on the liveability of an area, often in the form of a checklist [22, 23, 28, 55, 56]. Impact assessment is not so much concerned with assessing the current environment - rather, it is a policy analysis tool to guide current and future decision-making.
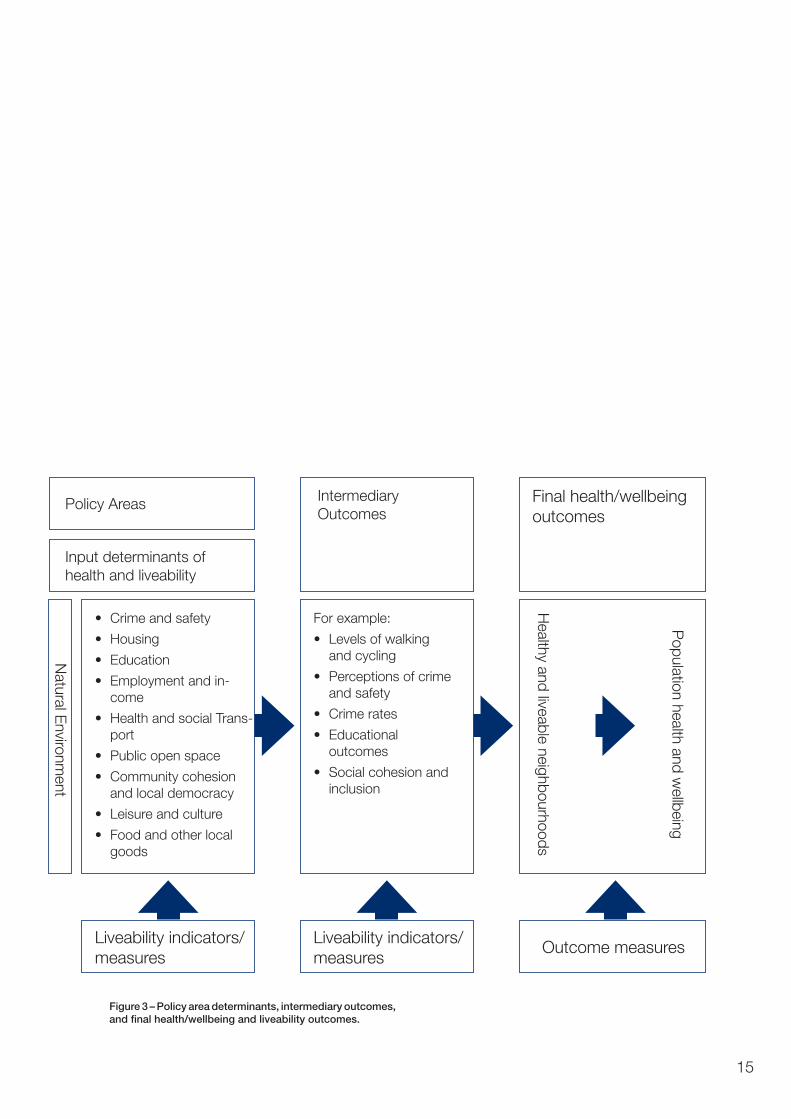
Indicators have been used to measure both hypothesised input determinants of liveability and intermediary outcomes. However, much of the literature does not distinguish between these two different types of measures. Intermediary policy outcomes, such as individual behaviours and perceptions, fall along the pathway between determinants of liveability and the final outcomes of healthy and liveable neighbourhoods and, ultimately, a healthy population.
15
Figure 3 – Policy area determinants, intermediary outcomes, and final health/wellbeing and liveability outcomes.
Final health/wellbeingoutcomes
Policy Areas
Input determinants of health and liveability
Intermediary Outcomes
Natural E
nvironment
• Crime and safety
• Housing
• Education
• Employment and in-come
• Health and social Trans-port
• Public open space
• Community cohesion and local democracy
• Leisure and culture
• Food and other local goods
Liveability indicators/measures
For example:
• Levels of walking and cycling
• Perceptions of crime and safety
• Crime rates
• Educational outcomes
• Social cohesion and inclusion
Liveability indicators/measures
Outcome measures
Healthy and liveable neighbourhoods
Population health and w
ellbeing
16
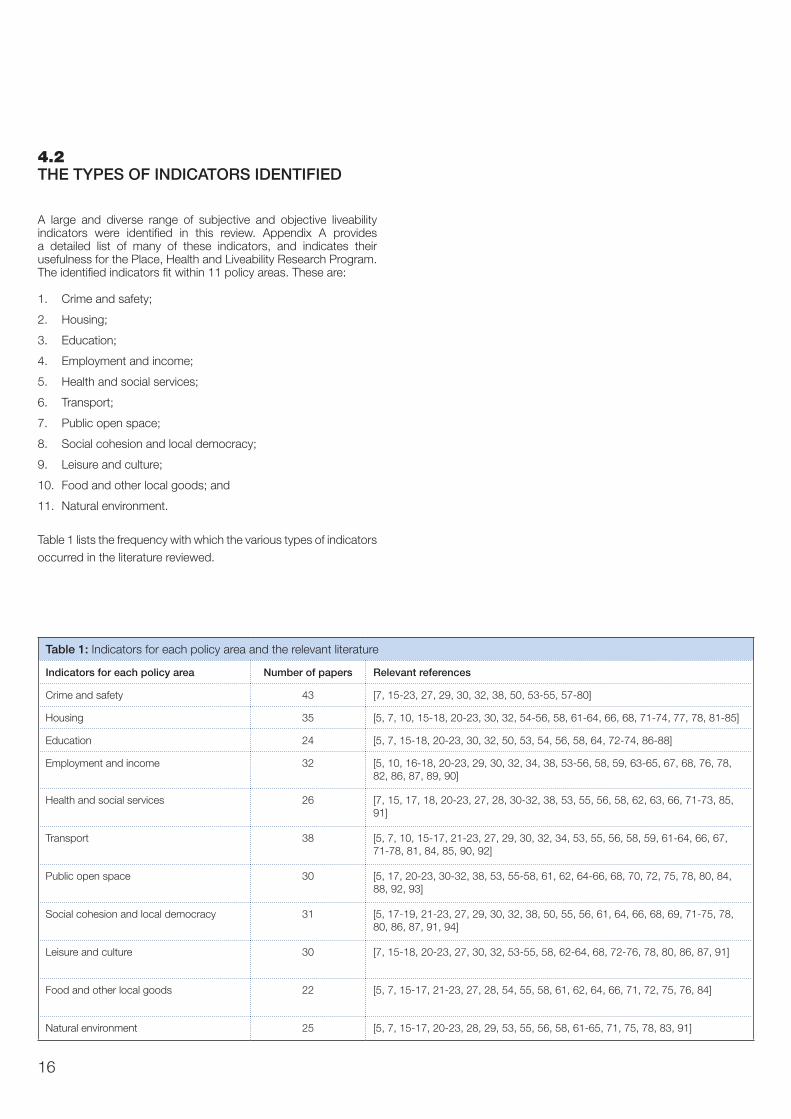
4.2 THE TYPES OF INDICATORS IDENTIFIED
A large and diverse range of subjective and objective liveability indicators were identified in this review. Appendix A provides a detailed list of many of these indicators, and indicates their usefulness for the Place, Health and Liveability Research Program. The identified indicators fit within 11 policy areas. These are:
1. Crime and safety;
2. Housing;
3. Education;
4. Employment and income;
5. Health and social services;
6. Transport;
7. Public open space;
8. Social cohesion and local democracy;
9. Leisure and culture;
10. Food and other local goods; and
11. Natural environment.
Table 1 lists the frequency with which the various types of indicators occurred in the literature reviewed.
Table 1: Indicators for each policy area and the relevant literature
Indicators for each policy area Number of papers Relevant references
Crime and safety 43 [7, 15-23, 27, 29, 30, 32, 38, 50, 53-55, 57-80]
Housing 35 [5, 7, 10, 15-18, 20-23, 30, 32, 54-56, 58, 61-64, 66, 68, 71-74, 77, 78, 81-85]
Education 24 [5, 7, 15-18, 20-23, 30, 32, 50, 53, 54, 56, 58, 64, 72-74, 86-88]
Employment and income 32 [5, 10, 16-18, 20-23, 29, 30, 32, 34, 38, 53-56, 58, 59, 63-65, 67, 68, 76, 78, 82, 86, 87, 89, 90]
Health and social services 26 [7, 15, 17, 18, 20-23, 27, 28, 30-32, 38, 53, 55, 56, 58, 62, 63, 66, 71-73, 85, 91]
Transport 38 [5, 7, 10, 15-17, 21-23, 27, 29, 30, 32, 34, 53, 55, 56, 58, 59, 61-64, 66, 67, 71-78, 81, 84, 85, 90, 92]
Public open space 30 [5, 17, 20-23, 30-32, 38, 53, 55-58, 61, 62, 64-66, 68, 70, 72, 75, 78, 80, 84, 88, 92, 93]
Social cohesion and local democracy 31 [5, 17-19, 21-23, 27, 29, 30, 32, 38, 50, 55, 56, 61, 64, 66, 68, 69, 71-75, 78, 80, 86, 87, 91, 94]
Leisure and culture 30 [7, 15-18, 20-23, 27, 30, 32, 53-55, 58, 62-64, 68, 72-76, 78, 80, 86, 87, 91]
Food and other local goods 22 [5, 7, 15-17, 21-23, 27, 28, 54, 55, 58, 61, 62, 64, 66, 71, 72, 75, 76, 84]
Natural environment 25 [5, 7, 15-17, 20-23, 28, 29, 53, 55, 56, 58, 61-65, 71, 75, 78, 83, 91]
17
5 Discussion and Next Steps
As Innes and Booher state: “millions of dollars and much time of many talented people has been wasted on preparing national, state and local indicator reports that remain on the shelf gathering dust”, at least in part because they “rely on a simplistic model of how information drives policy” [95, p.174]. The challenge, according to these planning scholars, is creating indicators that measure something publicly valued, where the end users are involved in the design and thus ‘own’ the results. Indicators must be clearly associated with a policy or set of possible actions, even if the process of negotiating this symbolic ownership takes five to ten years [95].
According to public health researchers, there is a different challenge for indicators: scant systematic research examining the relationship between different facets of health and wellbeing and specific environmental determinants [46]. In other words, the ‘chain of evidence’ is weak when linking indicators to policies, behaviours, and outcomes.
This project arose from concerns about both these issue. There is a large and growing literature on liveability indicators, and a growing public policy interest in liveability and how to measure it. There is also a broad range of indicators available within a variety of policy areas (see Appendix A). While inter-city indicators, such as the Economist Intelligence Unit’s liveable cities ranking, are perhaps most publicised, there is an increasing variety of intra-city indicators. Most indicators measure liveability for all residents within a community, but some are specific to particular vulnerable groups such as children or older adults.
Whilst there are plenty of indicators to choose from, based on our criteria, many were assessed as needing further development, or were deemed not useful for the purposes of the Place, Health and Liveability Research Program. Many of the liveability indicators used previously were too vague, with most indicators having no evidence of validity or reliability, and some being inappropriate for the Australian policy context. These factors limit their utility for research and guiding urban policy and planning.
In addition, indicators used to compare cities are mostly unhelpful for investigating disparities in liveability and the social determinants of health within cities, which is the principal interest of this research program. Impact assessment indicators (aimed at major new development projects) are also not useful for measuring and comparing existing local communities. However, they can be useful for guiding decision-making about future projects and developments, and provide valuable insights into what should be measured.
Since the Place, Health and Liveability Research Program commenced, there has been increased interest in intra-city indicators at both the federal and the state government levels. At the federal level, the Major Cities Unit has published annual ‘State of Australian Cities’ reports since 2010. While the emphasis is on inter-city rather than neighbourhood level indicators, they have expressed interest in ways to measure and compare improvements in socio-spatial disparities within Australian cities. The federal government has also recently funded the Australian Urban Research Infrastructure Network (AURIN), whose mandate it is to create a statistical ‘commons’ of aggregated data sets. These data sets can then be matched at various scales, allowing, for instance, measurement of the influence of built environment characteristics such as land uses or road traffic counts on individual health outcomes (http://aurin.org.au/). AURIN and another federal data project have funded indicator development projects through the Place, Health, and Liveability Research Program, with the ultimate aim of developing national comparable data sets. In our work with AURIN, we are developing both walkability and liveability GIS-based indicators that can be used across the country to compare the social determinants of health, and develop healthy public policy.
The current Victorian state government is developing a new Metropolitan Planning Strategy. The Ministerial Advisory Committee guiding the strategy recognises that there is a growing divide between “a successful and ‘choice rich’ inner core and a fringe with fewer choices” as well as a “growing distance between were people [can] afford to live and where jobs [are] located” [96, p.26]. They have expressed interest in indicators that measure differential access to employment, education, social and health services, and green space – most of the concerns covered in this research paper.
18
This literature review, and the consultative process behind it, has helped identify promising indicators for the next stage of our Program, as well as indicators that need further development or refinement. In the latter category, health and social services and public open space provision have been noted as policy areas in particular need of better indicators to guide policy. There are useful indicators where Australian data is unavailable and other indicators where data at the appropriate community scale is absent.
Research gaps in terms of causality between indicators and health and wellbeing outcomes have also been identified in this literature review. Furthermore, there is no clear distinction between determinants of liveability, intermediate outcomes (e.g. walking rates), and the final outcome of population health and wellbeing.
In addition, the sheer number and diversity of indicators may be confusing to policy-makers and planners. The idea of one simple ’liveability’ or ‘social sustainability’ indicator is perhaps an impossible dream, but having hundreds of equally weighted indicators is also of limited value. As Cobb and Rixford say, “comprehensiveness may be the enemy of effectiveness” [97, p. 18].
It must also be remembered that the iterative process of creating and updating indicators takes time and is a collaborative process [95]. This report is the result of a year-long discussion between public health, urban planning, architecture, and engineering researchers, and the Victorian Department of Health. It is one of the first ‘products’ of what will hopefully be a long and productive research and research translation process. Further development and refinement of liveability indicators must include an on-going dialogue with local, state and national policymakers, as well as those who implement policy at all of these levels: health planners, land use planners and designers, park and recreation planners, housing and retail developers, transport planners and engineers, education planners, and social and health service providers.
An advantage for the future development of indicators is that Community Indicators Victoria has been extensively used in community planning by many local governments since 2006. This project’s link with MUtopia suggests another area of research: using the indicators to assess potential development scenarios, a form of impact assessment. While MUtopia focuses on environmental sustainability, there is considerable overlap (as this report has demonstrated) between environmental sustainability and health and wellbeing. Certainly, liveability is a term that encompasses both sets of concerns.
Communities and cities are complex systems. The pathways to health and wellbeing result from a combination of individual and household choices that are influenced – but not wholly determined – by environmental factors. It is these factors that community indicators seek to measure, and indirectly influence through that measurement. The question is how to develop indicators that help influence, as well as compare, progress towards a healthy, liveable and sustainable future.
19
6 Appendix A Indicators: What Might Work in Melbourne
This appendix outlines some of the key liveability indicators and measures sourced from the literature. These are grouped into the 11 policy areas that liveability indicators fit within.
Examples of the indicators in each policy area are presented in Tables 2-12, accompanied by brief explanatory notes and discussion. Due to the large number of indicators currently in use, the list presented is not exhaustive – rather, indicators have been chosen to represent the key indicators measured within each policy area. The tables distinguish between subjective and objective indicators. They also specify the level of measurement, being: individual-level measures that can be aggregated to the local government area or other geographical scales as required; social or built environment-level measures; or policy-level measures, which include policy impact assessment items. Indicators that assess intermediary outcomes, as indicated in Figure 3 are also distinguished from the indicators that assess input determinants of liveability.
Finally, the tables separate indicators into the three categories outlined in the Methods – those that are promising; those that may be useful but need further development; and those that are not useful for our purposes.
6.1 POLICY AREA: CRIME AND SAFETY
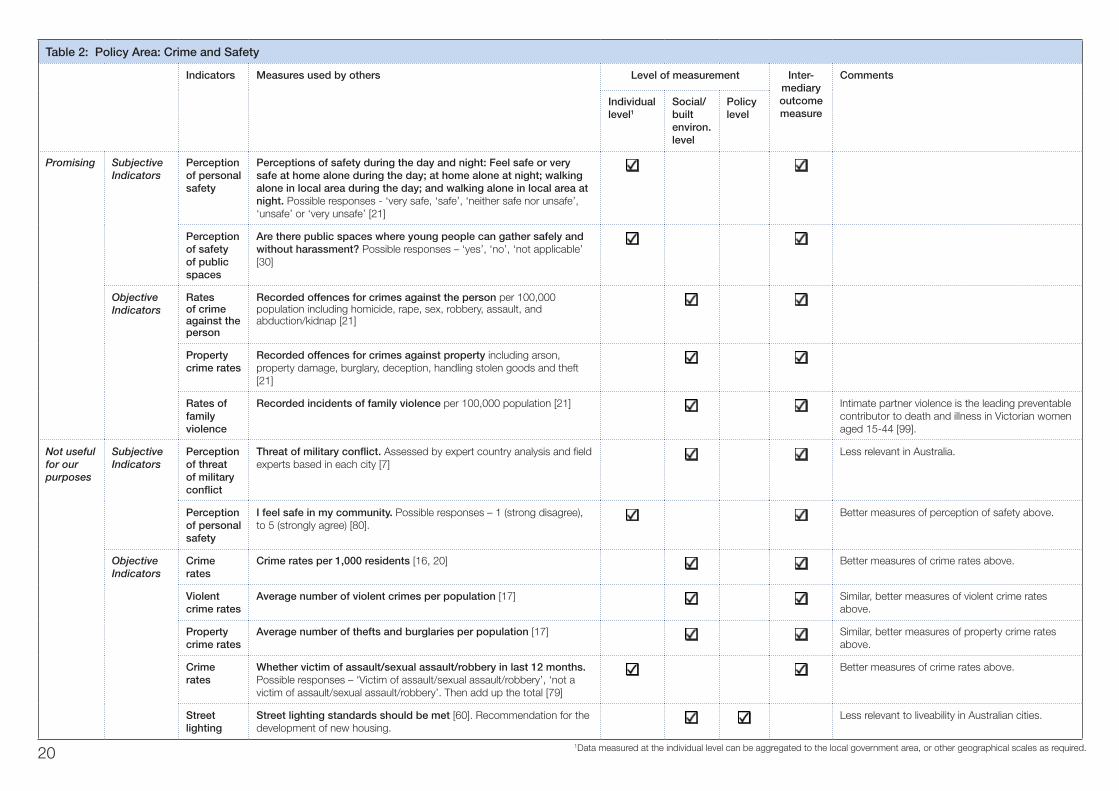
The large number of crime and safety indicators in the liveability literature suggests that this is a key construct of liveability. This policy area also has clear links to health and wellbeing outcomes [98]. The literature implies that areas with lower rates of crime and fear of crime are more liveable, and there are promising indicators of both of these elements. In terms of subjective safety, some indicators ask about overall perceptions of safety, and others ask about safety for specific subgroups such as children. Crime rates are commonly separated into crimes against property and crimes against the person (the latter also known as violent crime). Whilst most crime and safety measures can be regarded as primary outcome measures (with a direct impact on health and wellbeing), some indicators measure the determinants of crime and safety, such as street lighting [60]. Traffic and associated accidents are sometimes included in the crime and safety policy area, as this is an important element of community safety. However, in this research paper, traffic safety indicators are discussed within the Transport policy area. See Table 2 for examples of crime and safety indicators.
20
Table 2: Policy Area: Crime and Safety
Indicators Measures used by others Level of measurement Inter-mediary outcome measure
Comments
Individual level1
Social/built environ. level
Policy level
Promising Subjective Indicators
Perception of personal safety
Perceptions of safety during the day and night: Feel safe or very safe at home alone during the day; at home alone at night; walking alone in local area during the day; and walking alone in local area at night. Possible responses - ‘very safe, ‘safe’, ‘neither safe nor unsafe’, ‘unsafe’ or ‘very unsafe’ [21]
Perception of safety of public spaces
Are there public spaces where young people can gather safely and without harassment? Possible responses – ‘yes’, ‘no’, ‘not applicable’ [30]
Objective Indicators
Rates of crime against the person
Recorded offences for crimes against the person per 100,000 population including homicide, rape, sex, robbery, assault, and abduction/kidnap [21]
Property crime rates
Recorded offences for crimes against property including arson, property damage, burglary, deception, handling stolen goods and theft [21]
Rates of family violence
Recorded incidents of family violence per 100,000 population [21] Intimate partner violence is the leading preventable contributor to death and illness in Victorian women aged 15-44 [99].
Not useful for our purposes
Subjective Indicators
Perception of threat of military conflict
Threat of military conflict. Assessed by expert country analysis and field experts based in each city [7]
Less relevant in Australia.
Perception of personal safety
I feel safe in my community. Possible responses – 1 (strong disagree), to 5 (strongly agree) [80].
Better measures of perception of safety above.
Objective Indicators
Crime rates
Crime rates per 1,000 residents [16, 20] Better measures of crime rates above.
Violent crime rates
Average number of violent crimes per population [17] Similar, better measures of violent crime rates above.
Property crime rates
Average number of thefts and burglaries per population [17] Similar, better measures of property crime rates above.
Crime rates
Whether victim of assault/sexual assault/robbery in last 12 months. Possible responses – ‘Victim of assault/sexual assault/robbery’, ‘not a victim of assault/sexual assault/robbery’. Then add up the total [79]
Better measures of crime rates above.
Street lighting
Street lighting standards should be met [60]. Recommendation for the development of new housing.
Less relevant to liveability in Australian cities.
1Data measured at the individual level can be aggregated to the local government area, or other geographical scales as required.

21
6.2 POLICY AREA: HOUSING
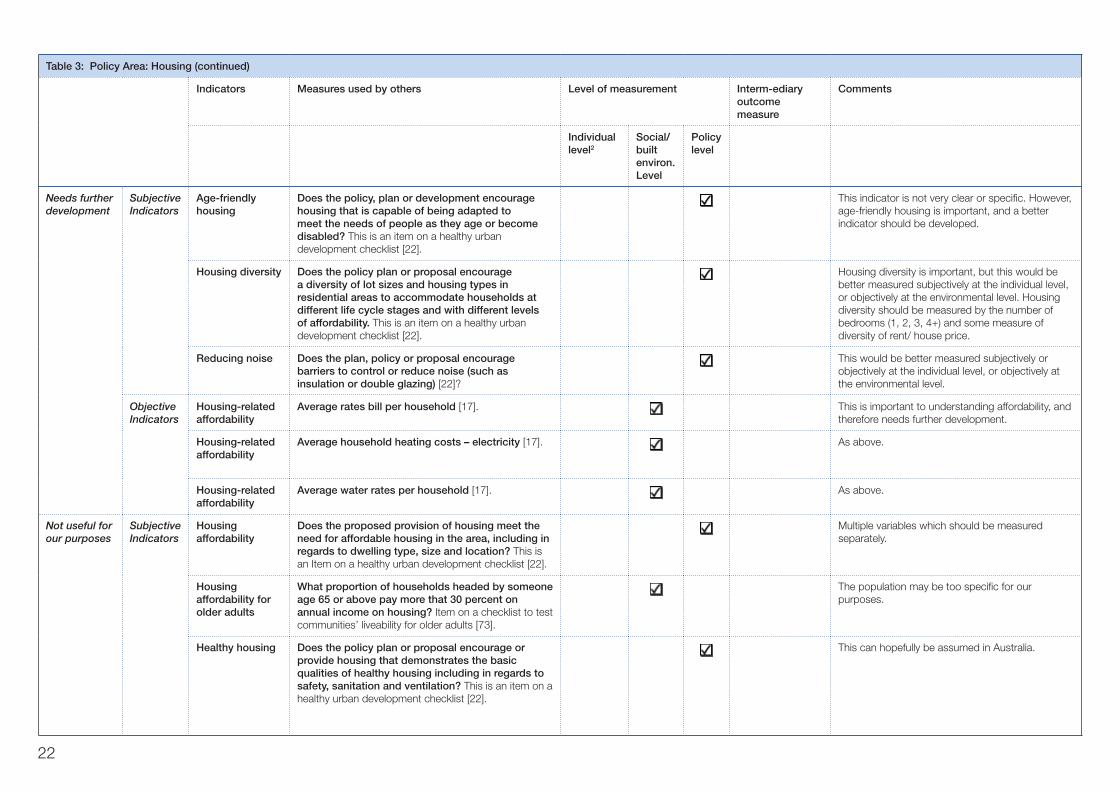
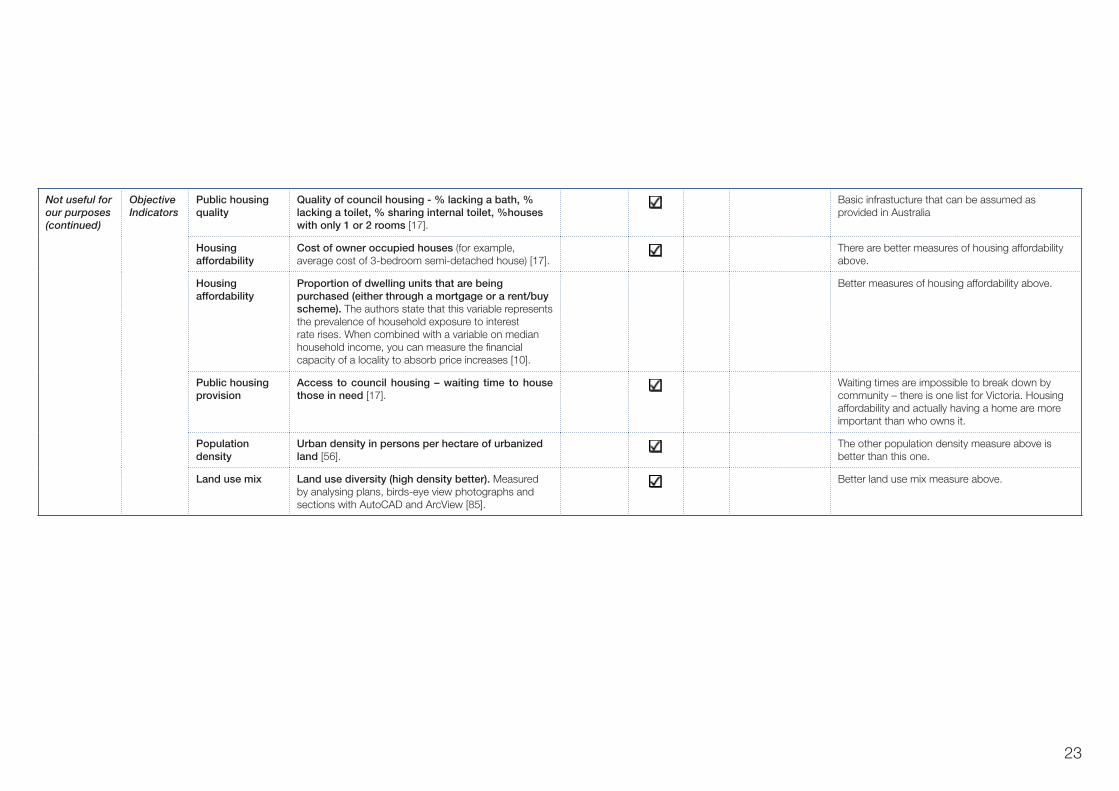
Housing indicators are concerned with the quality and affordability of housing, as well as population and housing density and the mixture of land uses. Indicators are also available for the diversity and the adaptability of the housing stock and housing tenure (see Table 3). Indicators suggest that more liveable areas have a greater mix of land uses, and access to affordable housing relative to income, that is available and adaptable to those in need. Homelessness rates would fit within this policy area, but no indicators of homelessness were identified in this review. There are a wide range of indicators which show some promise in this policy area, and some areas for further development are identified.
Table 3: Policy Area: Housing
Indicators Measures used by others Level of measurement Interm-ediary outcome measure
Comments
Individual level2
Social/built environ. Level
Policy level
Promising Objective Indicators
Housing affordability
Households with housing costs 30% or more of gross income. Sourced from ABS. The measure is expressed as a percentage of all households [21].
Good housing affordability measure.
Housing affordability
Median house or unit/flat price [16, 21] Could also divide by median household income.
Housing affordability
Average cost of private rented accommodation [17]. Could also divide by the average income in an area.
Public housing provision
Occupied private dwellings which are government-owned rental dwellings. Sourced from the Australian Bureau of Statistics. The measure is expressed as a percentage of all occupied private dwellings [21].
While this is a useful measure, housing affordability and actually having a home are more important than who owns it.
Population density
Population density, measured in persons per hectare [58].
It would be good to have benchmarks of population density for different areas.
Land use mix Land use mix (evenness of distribution of several land-use types). Measured by GIS [84].
Good land use mix measure.
2Data measured at the individual level can be aggregated to the local government area, or other geographical scales as required.
22
Table 3: Policy Area: Housing (continued)
Indicators Measures used by others Level of measurement Interm-ediary outcome measure
Comments
Individual level2
Social/built environ. Level
Policy level
Needs further development
Subjective Indicators
Age-friendly housing
Does the policy, plan or development encourage housing that is capable of being adapted to meet the needs of people as they age or become disabled? This is an item on a healthy urban development checklist [22].
This indicator is not very clear or specific. However, age-friendly housing is important, and a better indicator should be developed.
Housing diversity Does the policy plan or proposal encourage a diversity of lot sizes and housing types in residential areas to accommodate households at different life cycle stages and with different levels of affordability. This is an item on a healthy urban development checklist [22].
Housing diversity is important, but this would be better measured subjectively at the individual level, or objectively at the environmental level. Housing diversity should be measured by the number of bedrooms (1, 2, 3, 4+) and some measure of diversity of rent/ house price.
Reducing noise Does the plan, policy or proposal encourage barriers to control or reduce noise (such as insulation or double glazing) [22]?
This would be better measured subjectively or objectively at the individual level, or objectively at the environmental level.
Objective Indicators
Housing-related affordability
Average rates bill per household [17]. This is important to understanding affordability, and therefore needs further development.
Housing-related affordability
Average household heating costs – electricity [17]. As above.
Housing-related affordability
Average water rates per household [17]. As above.
Not useful for our purposes
SubjectiveIndicators
Housing affordability
Does the proposed provision of housing meet the need for affordable housing in the area, including in regards to dwelling type, size and location? This is an Item on a healthy urban development checklist [22].
Multiple variables which should be measured separately.
Housing affordability for older adults
What proportion of households headed by someone age 65 or above pay more that 30 percent on annual income on housing? Item on a checklist to test communities’ liveability for older adults [73].
The population may be too specific for our purposes.
Healthy housing Does the policy plan or proposal encourage or provide housing that demonstrates the basic qualities of healthy housing including in regards to safety, sanitation and ventilation? This is an item on a healthy urban development checklist [22].
This can hopefully be assumed in Australia.
23
Not useful for our purposes(continued)
Objective Indicators
Public housing quality
Quality of council housing - % lacking a bath, % lacking a toilet, % sharing internal toilet, %houses with only 1 or 2 rooms [17].
Basic infrastucture that can be assumed as provided in Australia
Housing affordability
Cost of owner occupied houses (for example, average cost of 3-bedroom semi-detached house) [17].
There are better measures of housing affordability above.
Housing affordability
Proportion of dwelling units that are being purchased (either through a mortgage or a rent/buy scheme). The authors state that this variable represents the prevalence of household exposure to interest rate rises. When combined with a variable on median household income, you can measure the financial capacity of a locality to absorb price increases [10].
Better measures of housing affordability above.
Public housing provision
Access to council housing – waiting time to house those in need [17].
Waiting times are impossible to break down by community – there is one list for Victoria. Housing affordability and actually having a home are more important than who owns it.
Population density
Urban density in persons per hectare of urbanized land [56].
The other population density measure above is better than this one.
Land use mix Land use diversity (high density better). Measured by analysing plans, birds-eye view photographs and sections with AutoCAD and ArcView [85].
Better land use mix measure above.
24
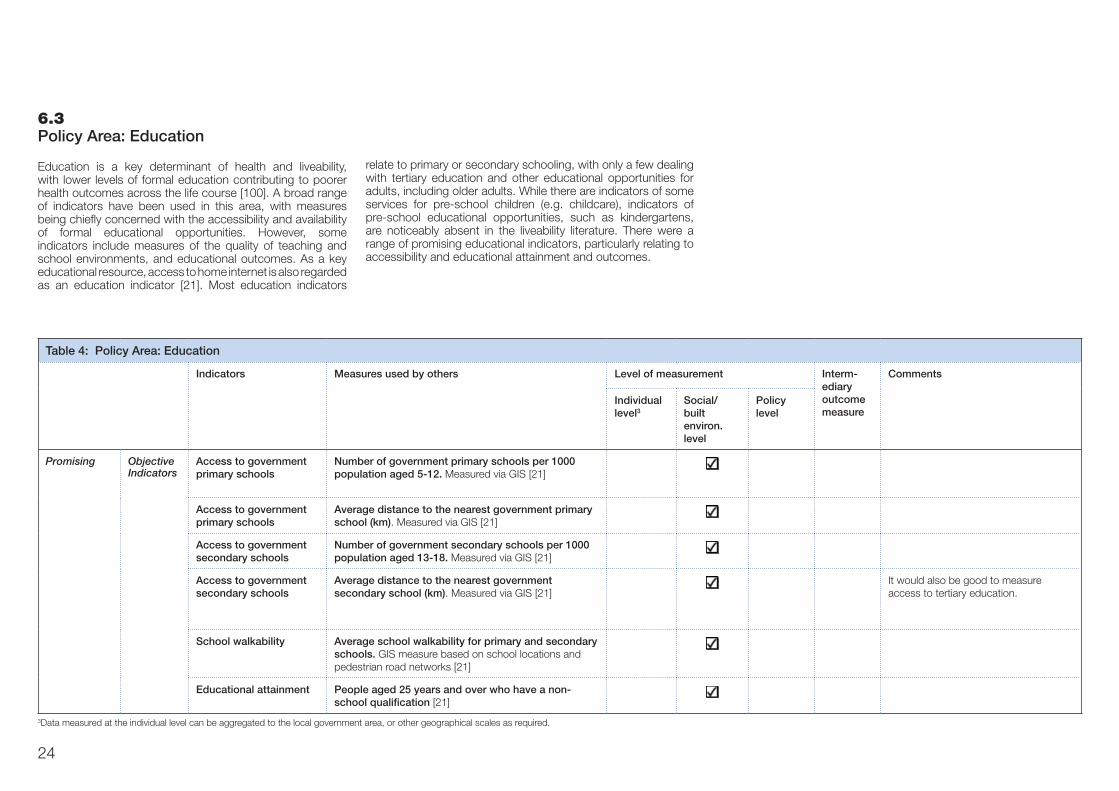
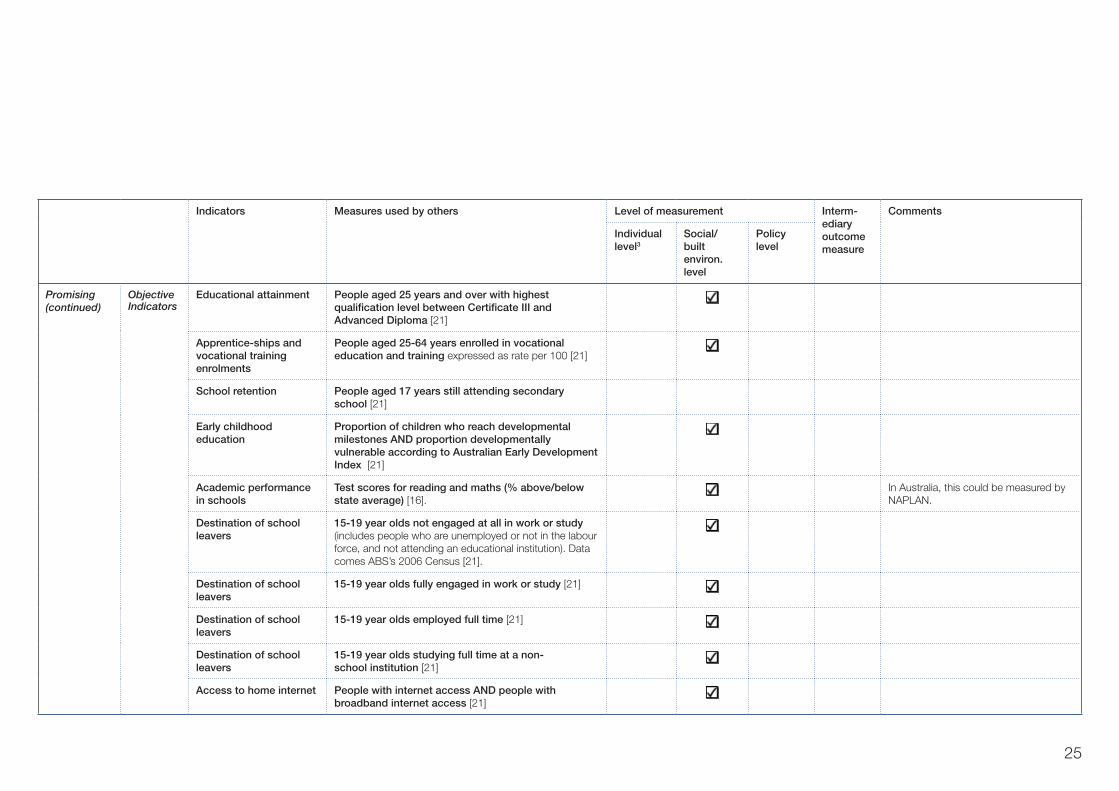
6.3 Policy Area: Education
Education is a key determinant of health and liveability, with lower levels of formal education contributing to poorer health outcomes across the life course [100]. A broad range of indicators have been used in this area, with measures being chiefly concerned with the accessibility and availability of formal educational opportunities. However, some indicators include measures of the quality of teaching and school environments, and educational outcomes. As a key educational resource, access to home internet is also regarded as an education indicator [21]. Most education indicators
Table 4: Policy Area: Education
Indicators Measures used by others Level of measurement Interm-ediary outcome measure
Comments
Individual level3
Social/built environ. level
Policy level
Promising Objective Indicators
Access to government primary schools
Number of government primary schools per 1000 population aged 5-12. Measured via GIS [21]
Access to government primary schools
Average distance to the nearest government primary school (km). Measured via GIS [21]
Access to government secondary schools
Number of government secondary schools per 1000 population aged 13-18. Measured via GIS [21]
Access to government secondary schools
Average distance to the nearest government secondary school (km). Measured via GIS [21]
It would also be good to measure access to tertiary education.
School walkability Average school walkability for primary and secondary schools. GIS measure based on school locations and pedestrian road networks [21]
Educational attainment People aged 25 years and over who have a non-school qualification [21]
relate to primary or secondary schooling, with only a few dealing with tertiary education and other educational opportunities for adults, including older adults. While there are indicators of some services for pre-school children (e.g. childcare), indicators of pre-school educational opportunities, such as kindergartens, are noticeably absent in the liveability literature. There were a range of promising educational indicators, particularly relating to accessibility and educational attainment and outcomes.
3Data measured at the individual level can be aggregated to the local government area, or other geographical scales as required.
25
Indicators Measures used by others Level of measurement Interm-ediary outcome measure
Comments
Individual level3
Social/built environ. level
Policy level
Promising(continued)
Objective Indicators
Educational attainment People aged 25 years and over with highest qualification level between Certificate III and Advanced Diploma [21]
Apprentice-ships and vocational training enrolments
People aged 25-64 years enrolled in vocational education and training expressed as rate per 100 [21]
School retention People aged 17 years still attending secondary school [21]
Early childhood education
Proportion of children who reach developmental milestones AND proportion developmentally vulnerable according to Australian Early Development Index [21]
Academic performance in schools
Test scores for reading and maths (% above/below state average) [16].
In Australia, this could be measured by NAPLAN.
Destination of school leavers
15-19 year olds not engaged at all in work or study (includes people who are unemployed or not in the labour force, and not attending an educational institution). Data comes ABS’s 2006 Census [21].
Destination of school leavers
15-19 year olds fully engaged in work or study [21]
Destination of school leavers
15-19 year olds employed full time [21]
Destination of school leavers
15-19 year olds studying full time at a non-school institution [21]
Access to home internet People with internet access AND people with broadband internet access [21]
26
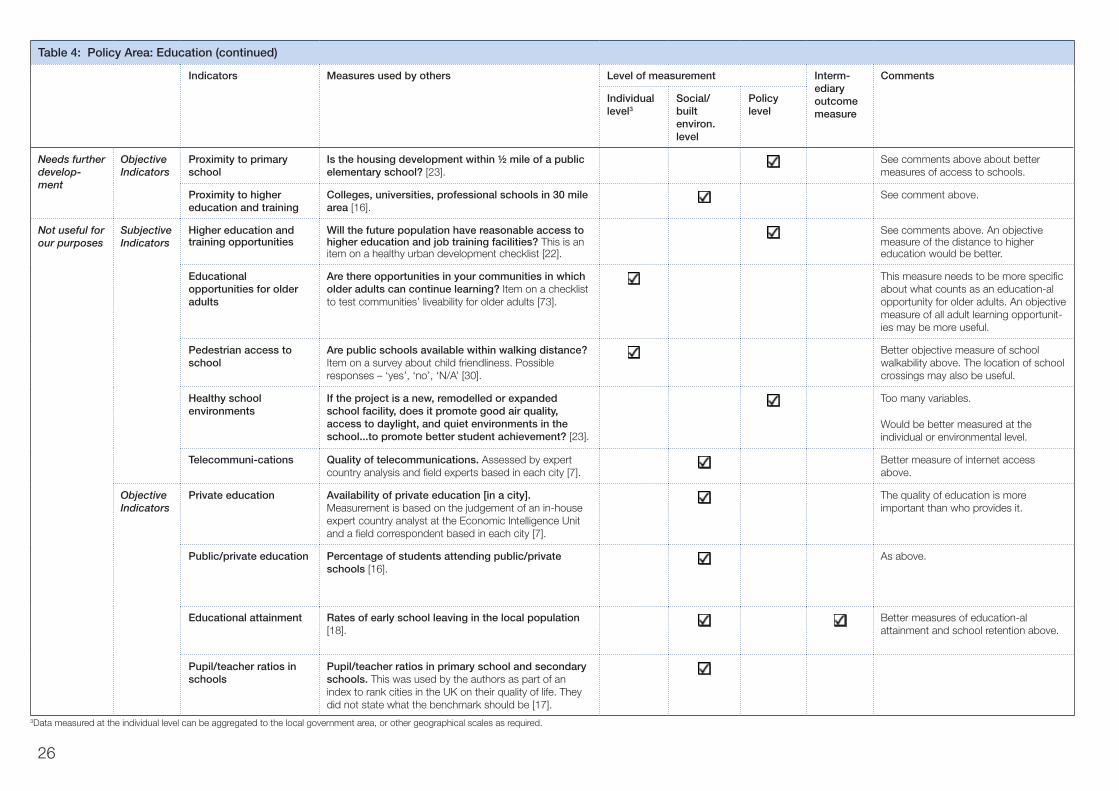
Table 4: Policy Area: Education (continued)
Indicators Measures used by others Level of measurement Interm-ediary outcome measure
Comments
Individual level3
Social/built environ. level
Policy level
Needs further develop-ment
Objective Indicators
Proximity to primary school
Is the housing development within ½ mile of a public elementary school? [23].
See comments above about better measures of access to schools.
Proximity to higher education and training
Colleges, universities, professional schools in 30 mile area [16].
See comment above.
Not useful for our purposes
Subjective Indicators
Higher education and training opportunities
Will the future population have reasonable access to higher education and job training facilities? This is an item on a healthy urban development checklist [22].
See comments above. An objective measure of the distance to higher education would be better.
Educational opportunities for older adults
Are there opportunities in your communities in which older adults can continue learning? Item on a checklist to test communities’ liveability for older adults [73].
This measure needs to be more specific about what counts as an education-al opportunity for older adults. An objective measure of all adult learning opportunit-ies may be more useful.
Pedestrian access to school
Are public schools available within walking distance? Item on a survey about child friendliness. Possible responses – ‘yes’, ‘no’, ‘N/A’ [30].
Better objective measure of school walkability above. The location of school crossings may also be useful.
Healthy school environments
If the project is a new, remodelled or expanded school facility, does it promote good air quality, access to daylight, and quiet environments in the school...to promote better student achievement? [23].
Too many variables.
Would be better measured at the individual or environmental level.
Telecommuni-cations Quality of telecommunications. Assessed by expert country analysis and field experts based in each city [7].
Better measure of internet access above.
Objective Indicators
Private education Availability of private education [in a city]. Measurement is based on the judgement of an in-house expert country analyst at the Economic Intelligence Unit and a field correspondent based in each city [7].
The quality of education is more important than who provides it.
Public/private education Percentage of students attending public/private schools [16].
As above.
Educational attainment Rates of early school leaving in the local population [18].
Better measures of education-al attainment and school retention above.
Pupil/teacher ratios in schools
Pupil/teacher ratios in primary school and secondary schools. This was used by the authors as part of an index to rank cities in the UK on their quality of life. They did not state what the benchmark should be [17].
3Data measured at the individual level can be aggregated to the local government area, or other geographical scales as required.
27
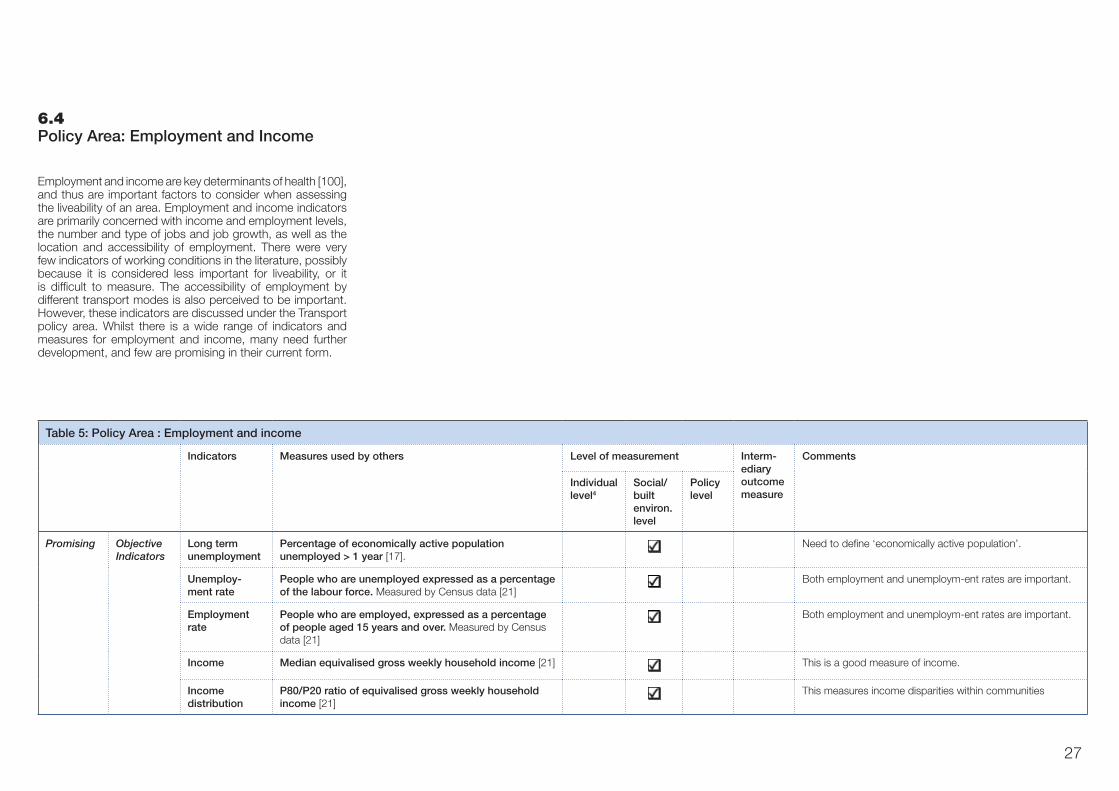
6.4 Policy Area: Employment and Income
Employment and income are key determinants of health [100], and thus are important factors to consider when assessing the liveability of an area. Employment and income indicators are primarily concerned with income and employment levels, the number and type of jobs and job growth, as well as the location and accessibility of employment. There were very few indicators of working conditions in the literature, possibly because it is considered less important for liveability, or it is difficult to measure. The accessibility of employment by different transport modes is also perceived to be important. However, these indicators are discussed under the Transport policy area. Whilst there is a wide range of indicators and measures for employment and income, many need further development, and few are promising in their current form.
Table 5: Policy Area : Employment and income
Indicators Measures used by others Level of measurement Interm-ediary outcome measure
Comments
Individual level4
Social/built environ. level
Policy level
Promising Objective Indicators
Long term unemployment
Percentage of economically active population unemployed > 1 year [17].
Need to define ‘economically active population’.
Unemploy-ment rate
People who are unemployed expressed as a percentage of the labour force. Measured by Census data [21]
Both employment and unemploym-ent rates are important.
Employment rate
People who are employed, expressed as a percentage of people aged 15 years and over. Measured by Census data [21]
Both employment and unemploym-ent rates are important.
Income Median equivalised gross weekly household income [21] This is a good measure of income.
Income distribution
P80/P20 ratio of equivalised gross weekly household income [21]
This measures income disparities within communities
28
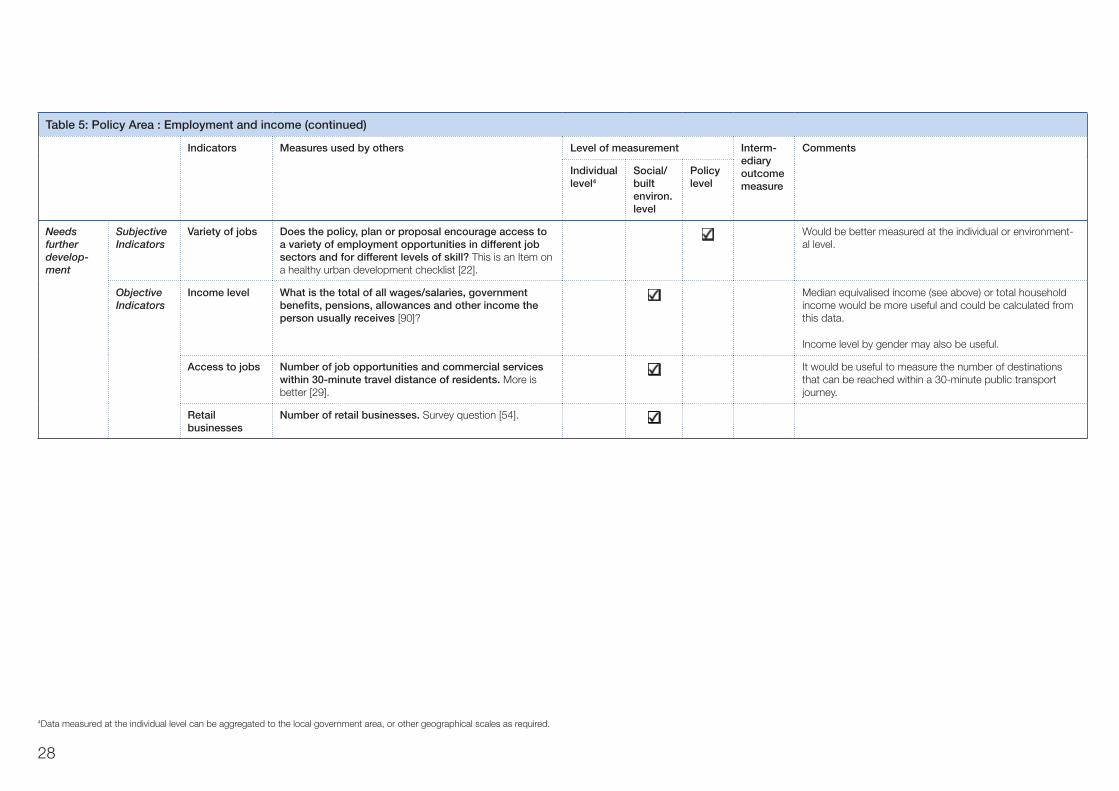
Table 5: Policy Area : Employment and income (continued)
Indicators Measures used by others Level of measurement Interm-ediary outcome measure
Comments
Individual level4
Social/built environ. level
Policy level
Needs further develop-ment
Subjective Indicators
Variety of jobs Does the policy, plan or proposal encourage access to a variety of employment opportunities in different job sectors and for different levels of skill? This is an Item on a healthy urban development checklist [22].
Would be better measured at the individual or environment-al level.
Objective Indicators
Income level What is the total of all wages/salaries, government benefits, pensions, allowances and other income the person usually receives [90]?
Median equivalised income (see above) or total household income would be more useful and could be calculated from this data.
Income level by gender may also be useful.
Access to jobs Number of job opportunities and commercial services within 30-minute travel distance of residents. More is better [29].
It would be useful to measure the number of destinations that can be reached within a 30-minute public transport journey.
Retail businesses
Number of retail businesses. Survey question [54].
4Data measured at the individual level can be aggregated to the local government area, or other geographical scales as required.
29
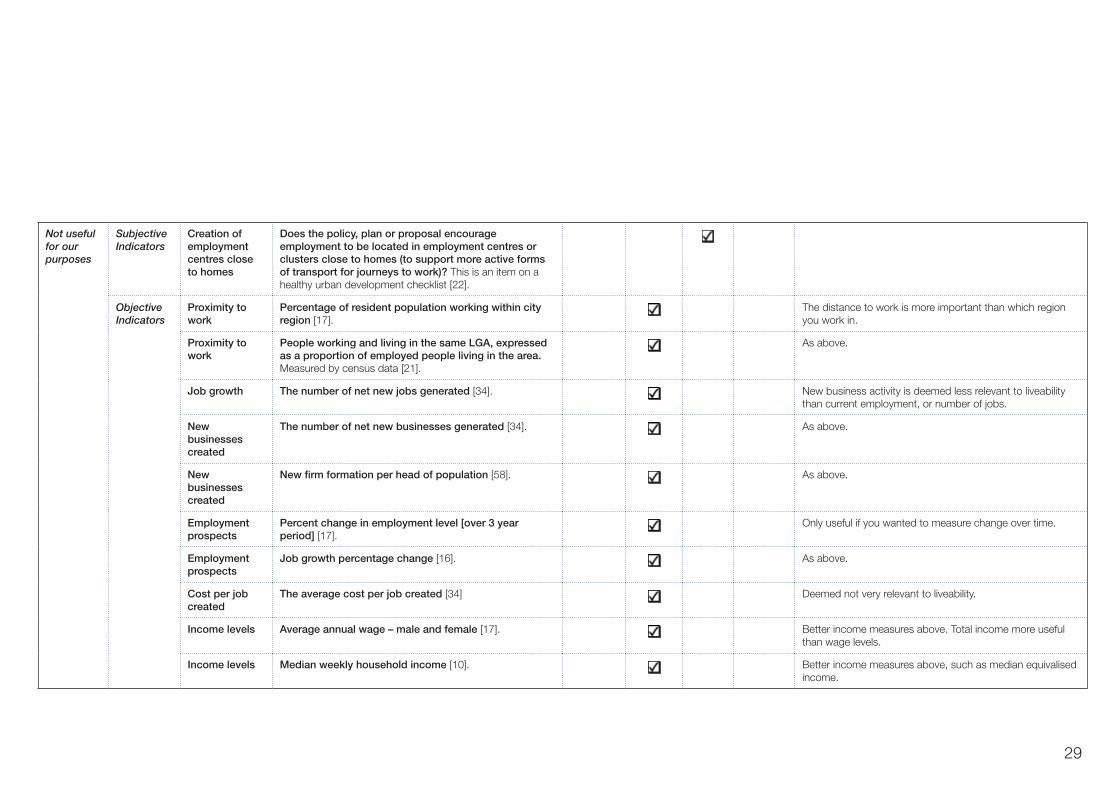
Not useful for our purposes
Subjective Indicators
Creation of employment centres close to homes
Does the policy, plan or proposal encourage employment to be located in employment centres or clusters close to homes (to support more active forms of transport for journeys to work)? This is an item on a healthy urban development checklist [22].
Objective Indicators
Proximity to work
Percentage of resident population working within city region [17].
The distance to work is more important than which region you work in.
Proximity to work
People working and living in the same LGA, expressed as a proportion of employed people living in the area. Measured by census data [21].
As above.
Job growth The number of net new jobs generated [34]. New business activity is deemed less relevant to liveability than current employment, or number of jobs.
New businesses created
The number of net new businesses generated [34]. As above.
New businesses created
New firm formation per head of population [58]. As above.
Employment prospects
Percent change in employment level [over 3 year period] [17].
Only useful if you wanted to measure change over time.
Employment prospects
Job growth percentage change [16]. As above.
Cost per job created
The average cost per job created [34] Deemed not very relevant to liveability.
Income levels Average annual wage – male and female [17]. Better income measures above. Total income more useful than wage levels.
Income levels Median weekly household income [10]. Better income measures above, such as median equivalised income.
30
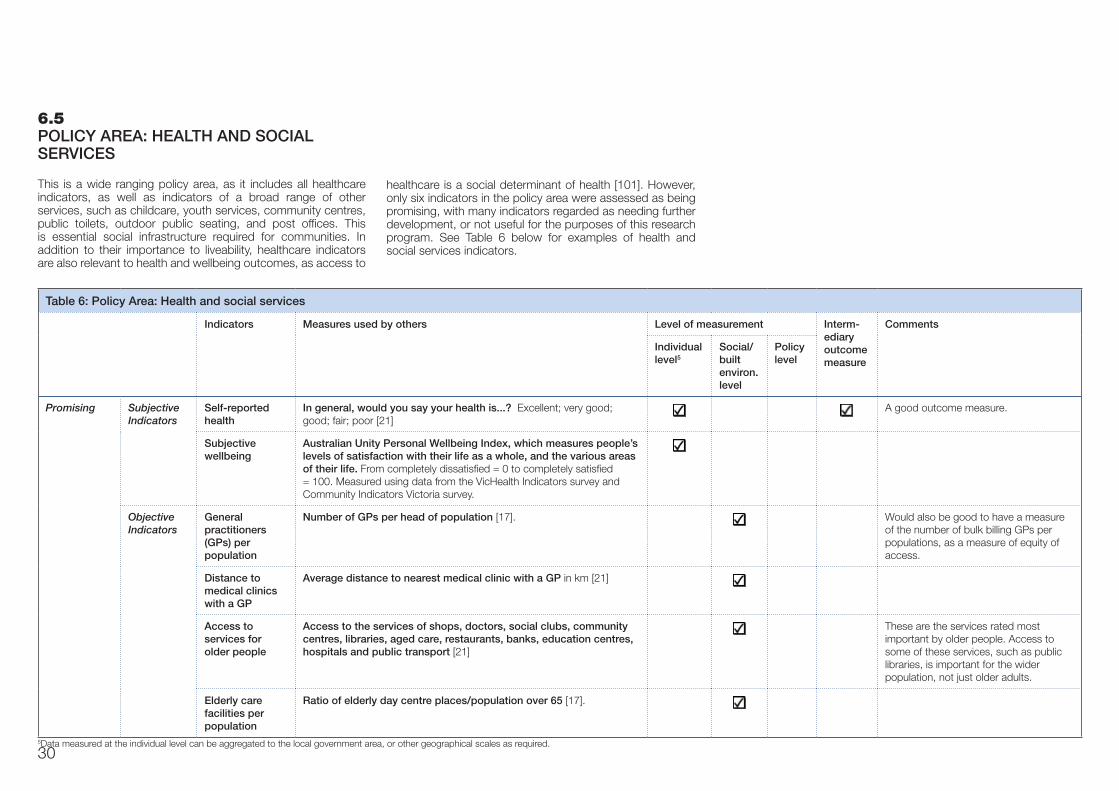
6.5 POLICY AREA: HEALTH AND SOCIAL SERVICES
This is a wide ranging policy area, as it includes all healthcare indicators, as well as indicators of a broad range of other services, such as childcare, youth services, community centres, public toilets, outdoor public seating, and post offices. This is essential social infrastructure required for communities. In addition to their importance to liveability, healthcare indicators are also relevant to health and wellbeing outcomes, as access to
Table 6: Policy Area: Health and social services
Indicators Measures used by others Level of measurement Interm-ediary outcome measure
Comments
Individual level5
Social/built environ. level
Policy level
Promising Subjective Indicators
Self-reported health
In general, would you say your health is...? Excellent; very good; good; fair; poor [21]
A good outcome measure.
Subjective wellbeing
Australian Unity Personal Wellbeing Index, which measures people’s levels of satisfaction with their life as a whole, and the various areas of their life. From completely dissatisfied = 0 to completely satisfied = 100. Measured using data from the VicHealth Indicators survey and Community Indicators Victoria survey.
Objective Indicators
General practitioners (GPs) per population
Number of GPs per head of population [17]. Would also be good to have a measure of the number of bulk billing GPs per populations, as a measure of equity of access.
Distance to medical clinics with a GP
Average distance to nearest medical clinic with a GP in km [21]
Access to services for older people
Access to the services of shops, doctors, social clubs, community centres, libraries, aged care, restaurants, banks, education centres, hospitals and public transport [21]
These are the services rated most important by older people. Access to some of these services, such as public libraries, is important for the wider population, not just older adults.
Elderly care facilities per population
Ratio of elderly day centre places/population over 65 [17].
healthcare is a social determinant of health [101]. However, only six indicators in the policy area were assessed as being promising, with many indicators regarded as needing further development, or not useful for the purposes of this research program. See Table 6 below for examples of health and social services indicators.
5Data measured at the individual level can be aggregated to the local government area, or other geographical scales as required.
31
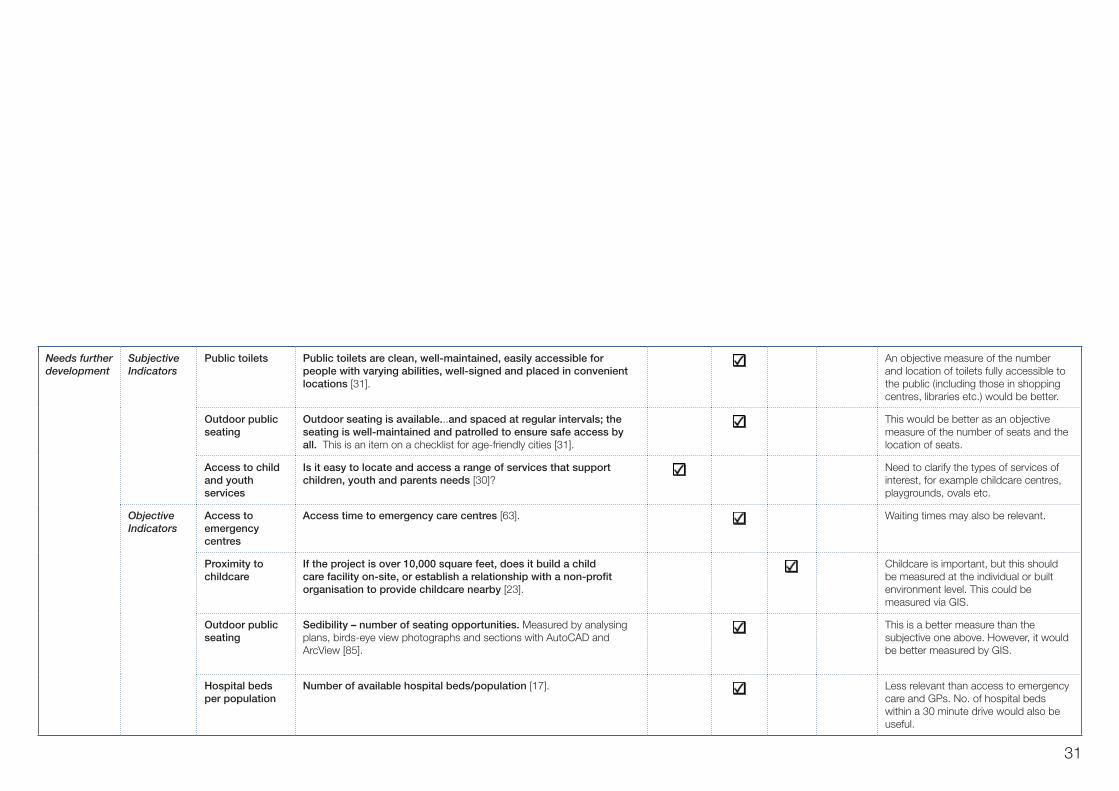
Needs further development
Subjective Indicators
Public toilets Public toilets are clean, well-maintained, easily accessible for people with varying abilities, well-signed and placed in convenient locations [31].
An objective measure of the number and location of toilets fully accessible to the public (including those in shopping centres, libraries etc.) would be better.
Outdoor public seating
Outdoor seating is available...and spaced at regular intervals; the seating is well-maintained and patrolled to ensure safe access by all. This is an item on a checklist for age-friendly cities [31].
This would be better as an objective measure of the number of seats and the location of seats.
Access to child and youth services
Is it easy to locate and access a range of services that support children, youth and parents needs [30]?
Need to clarify the types of services of interest, for example childcare centres, playgrounds, ovals etc.
Objective Indicators
Access to emergency centres
Access time to emergency care centres [63]. Waiting times may also be relevant.
Proximity to childcare
If the project is over 10,000 square feet, does it build a child care facility on-site, or establish a relationship with a non-profit organisation to provide childcare nearby [23].
Childcare is important, but this should be measured at the individual or built environment level. This could be measured via GIS.
Outdoor public seating
Sedibility – number of seating opportunities. Measured by analysing plans, birds-eye view photographs and sections with AutoCAD and ArcView [85].
This is a better measure than the subjective one above. However, it would be better measured by GIS.
Hospital beds per population
Number of available hospital beds/population [17]. Less relevant than access to emergency care and GPs. No. of hospital beds within a 30 minute drive would also be useful.
32
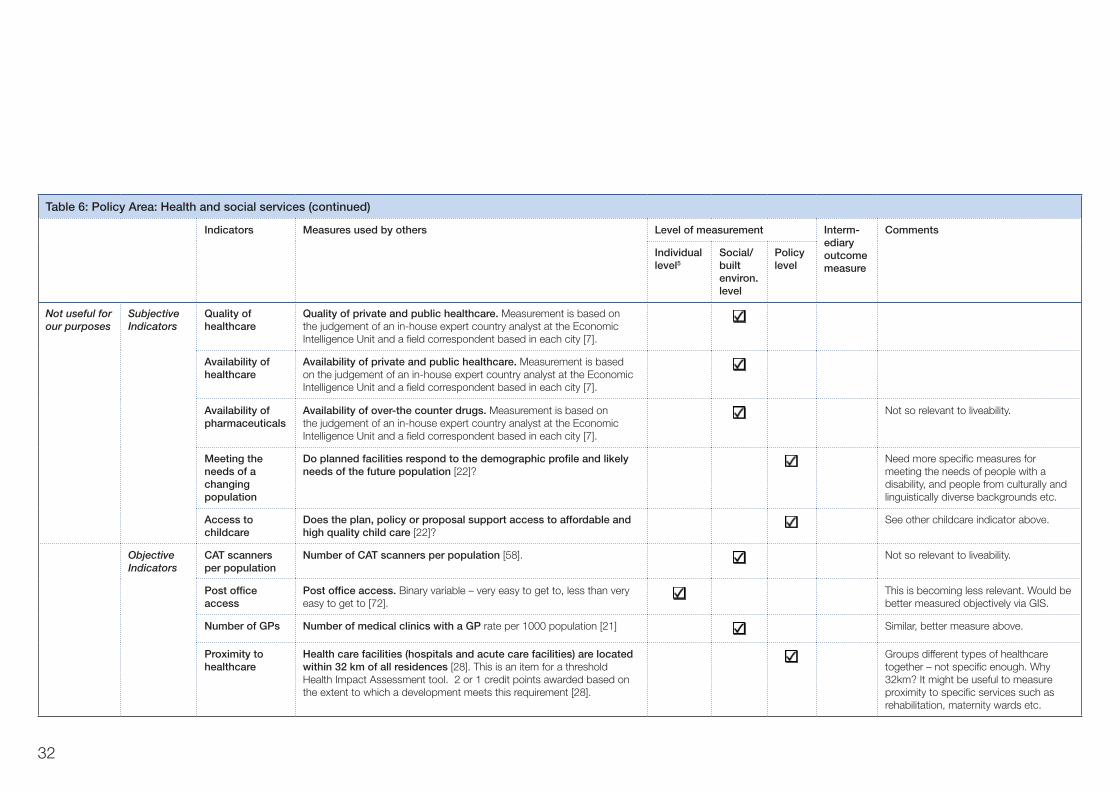
Table 6: Policy Area: Health and social services (continued)
Indicators Measures used by others Level of measurement Interm-ediary outcome measure
Comments
Individual level5
Social/built environ. level
Policy level
Not useful for our purposes
SubjectiveIndicators
Quality of healthcare
Quality of private and public healthcare. Measurement is based on the judgement of an in-house expert country analyst at the Economic Intelligence Unit and a field correspondent based in each city [7].
Availability of healthcare
Availability of private and public healthcare. Measurement is based on the judgement of an in-house expert country analyst at the Economic Intelligence Unit and a field correspondent based in each city [7].
Availability of pharmaceuticals
Availability of over-the counter drugs. Measurement is based on the judgement of an in-house expert country analyst at the Economic Intelligence Unit and a field correspondent based in each city [7].
Not so relevant to liveability.
Meeting the needs of a changing population
Do planned facilities respond to the demographic profile and likely needs of the future population [22]?
Need more specific measures for meeting the needs of people with a disability, and people from culturally and linguistically diverse backgrounds etc.
Access to childcare
Does the plan, policy or proposal support access to affordable and high quality child care [22]?
See other childcare indicator above.
Objective Indicators
CAT scanners per population
Number of CAT scanners per population [58]. Not so relevant to liveability.
Post office access
Post office access. Binary variable – very easy to get to, less than very easy to get to [72].
This is becoming less relevant. Would be better measured objectively via GIS.
Number of GPs Number of medical clinics with a GP rate per 1000 population [21] Similar, better measure above.
Proximity to healthcare
Health care facilities (hospitals and acute care facilities) are located within 32 km of all residences [28]. This is an item for a threshold Health Impact Assessment tool. 2 or 1 credit points awarded based on the extent to which a development meets this requirement [28].
Groups different types of healthcare together – not specific enough. Why 32km? It might be useful to measure proximity to specific services such as rehabilitation, maternity wards etc.
33
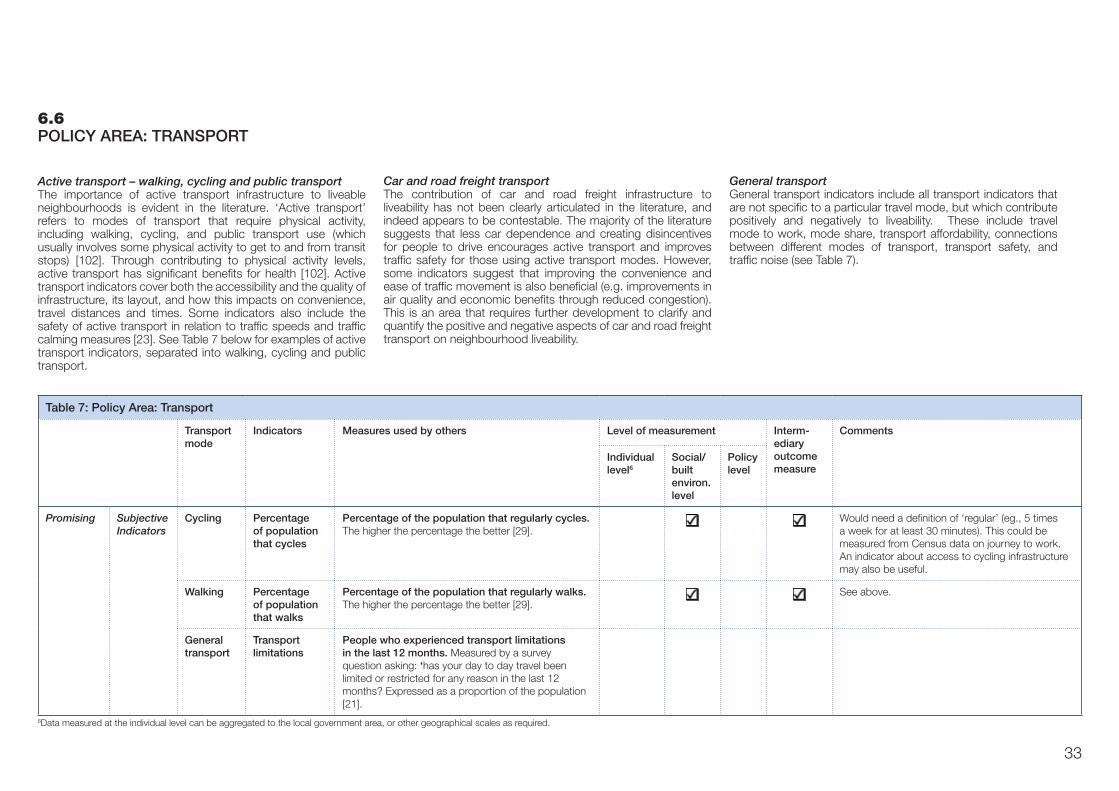
6.6 POLICY AREA: TRANSPORT
Active transport – walking, cycling and public transportThe importance of active transport infrastructure to liveable neighbourhoods is evident in the literature. ‘Active transport’ refers to modes of transport that require physical activity, including walking, cycling, and public transport use (which usually involves some physical activity to get to and from transit stops) [102]. Through contributing to physical activity levels, active transport has significant benefits for health [102]. Active transport indicators cover both the accessibility and the quality of infrastructure, its layout, and how this impacts on convenience, travel distances and times. Some indicators also include the safety of active transport in relation to traffic speeds and traffic calming measures [23]. See Table 7 below for examples of active transport indicators, separated into walking, cycling and public transport.
Car and road freight transportThe contribution of car and road freight infrastructure to liveability has not been clearly articulated in the literature, and indeed appears to be contestable. The majority of the literature suggests that less car dependence and creating disincentives for people to drive encourages active transport and improves traffic safety for those using active transport modes. However, some indicators suggest that improving the convenience and ease of traffic movement is also beneficial (e.g. improvements in air quality and economic benefits through reduced congestion). This is an area that requires further development to clarify and quantify the positive and negative aspects of car and road freight transport on neighbourhood liveability.
Table 7: Policy Area: Transport
Transport mode
Indicators Measures used by others Level of measurement Interm-ediary outcome measure
Comments
Individual level6
Social/built environ. level
Policy level
Promising Subjective Indicators
Cycling Percentage of population that cycles
Percentage of the population that regularly cycles. The higher the percentage the better [29].
Would need a definition of ‘regular’ (eg., 5 times a week for at least 30 minutes). This could be measured from Census data on journey to work. An indicator about access to cycling infrastructure may also be useful.
Walking Percentage of population that walks
Percentage of the population that regularly walks. The higher the percentage the better [29].
See above.
General transport
Transport limitations
People who experienced transport limitations in the last 12 months. Measured by a survey question asking: ‘has your day to day travel been limited or restricted for any reason in the last 12 months? Expressed as a proportion of the population [21].
General transport General transport indicators include all transport indicators that are not specific to a particular travel mode, but which contribute positively and negatively to liveability. These include travel mode to work, mode share, transport affordability, connections between different modes of transport, transport safety, and traffic noise (see Table 7).
6Data measured at the individual level can be aggregated to the local government area, or other geographical scales as required.
34
Table 7: Policy Area: Transport (continued)
Transport mode
Indicators Measures used by others Level of measurement Interm-ediary outcome measure
Comments
Individual level6
Social/built environ. level
Policy level
Promising (continued)
Objective Indicators
Walking Street connectivity
Density of street connectivity (no. of intersections divided by area in square miles). Measured by Geographic Information Systems (GIS) [84]. This indicator does not specifically measure pavement connectivity, but the authors found an association between street connectivity and neighbourhood walking and walking for transport and errands [84].
Public transport
Access to public transport
Proportion of Local Government Area within 400m of a bus or tram stop or 800m of a train station [21]
General transport
Commute time Average commute travel time. Less is better [29]. Only available in Census journey to work data measured every 5 years.
Travel mode to work
How did the person get to work on [census day]? Possible responses – train, bus, ferry, tram, taxi, car – as driver, car – as passenger, truck, motorbike, bicycle, walked only, worked at home, other, did not work [90].
Only available in Census journey to work data measured every 5 years.
Road traffic fatalities
Road traffic fatalities per 100,000 population [21]
Road traffic injuries
Road traffic injuries per 100,000 population [21]
Needs further develop-ment
Subjective Indicators
Cycling Bick racks Bike racks are accessible in public spaces. Item on subjective survey of child friendliness. Possible responses - ‘strongly disagree, ‘disagree’, ‘neutral’, ‘agree’, ‘strongly agree’, ‘unknown’ [30].
This would be better measured objectively. It would be better to measure bike parking in general, including poles and enclosures.
Bicycle network connectivity
Are streets (including bicycle networks) highly connected, offering direct routes to destinations of choice? This is an Item on a healthy urban development checklist [22].
This would be better measured objectively. It also needs to be more specific.
Public transport
Perception of the stroller accessibility of public transport
Is public transit designed for stroller accessibility? Item on subjective survey of child friendliness. Possible responses – ‘yes’, ‘no’, ‘N/A’ [30].
A subjective/ objective indicator of stroller and disability access to public transport may be more useful.
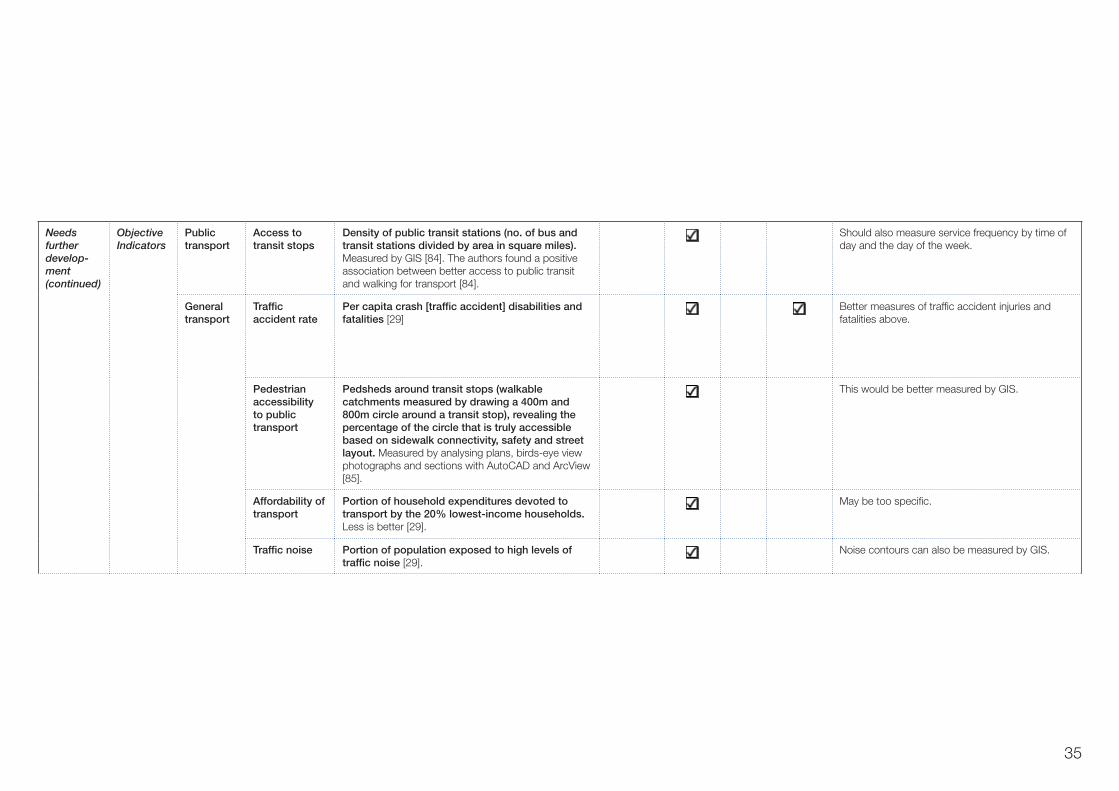
35
Needs further develop-ment(continued)
Objective Indicators
Public transport
Access to transit stops
Density of public transit stations (no. of bus and transit stations divided by area in square miles). Measured by GIS [84]. The authors found a positive association between better access to public transit and walking for transport [84].
Should also measure service frequency by time of day and the day of the week.
General transport
Traffic accident rate
Per capita crash [traffic accident] disabilities and fatalities [29]
Better measures of traffic accident injuries and fatalities above.
Pedestrian accessibility to public transport
Pedsheds around transit stops (walkable catchments measured by drawing a 400m and 800m circle around a transit stop), revealing the percentage of the circle that is truly accessible based on sidewalk connectivity, safety and street layout. Measured by analysing plans, birds-eye view photographs and sections with AutoCAD and ArcView [85].
This would be better measured by GIS.
Affordability of transport
Portion of household expenditures devoted to transport by the 20% lowest-income households. Less is better [29].
May be too specific.
Traffic noise Portion of population exposed to high levels of traffic noise [29].
Noise contours can also be measured by GIS.
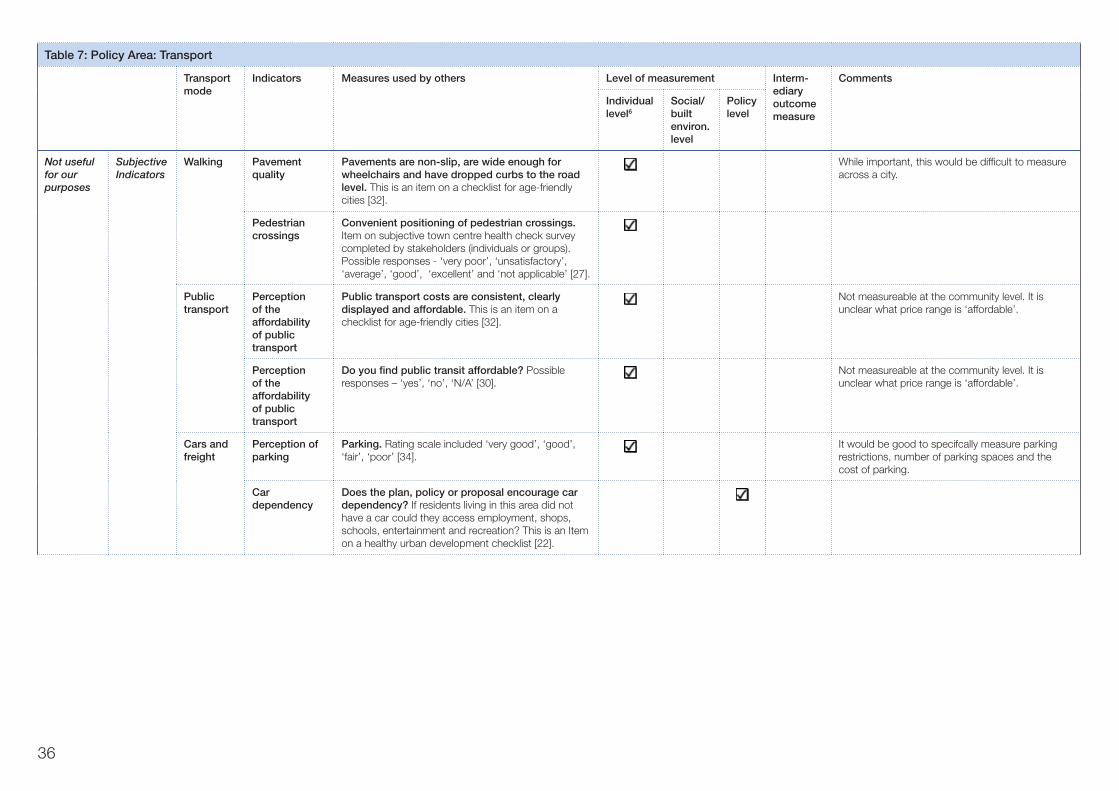
36
Table 7: Policy Area: Transport
Transport mode
Indicators Measures used by others Level of measurement Interm-ediary outcome measure
Comments
Individual level6
Social/built environ. level
Policy level
Not useful for our purposes
SubjectiveIndicators
Walking Pavement quality
Pavements are non-slip, are wide enough for wheelchairs and have dropped curbs to the road level. This is an item on a checklist for age-friendly cities [32].
While important, this would be difficult to measure across a city.
Pedestrian crossings
Convenient positioning of pedestrian crossings. Item on subjective town centre health check survey completed by stakeholders (individuals or groups). Possible responses - ‘very poor’, ‘unsatisfactory’, ‘average’, ‘good’, ‘excellent’ and ‘not applicable’ [27].
Public transport
Perception of the affordability of public transport
Public transport costs are consistent, clearly displayed and affordable. This is an item on a checklist for age-friendly cities [32].
Not measureable at the community level. It is unclear what price range is ‘affordable’.
Perception of the affordability of public transport
Do you find public transit affordable? Possible responses – ‘yes’, ‘no’, ‘N/A’ [30].
Not measureable at the community level. It is unclear what price range is ‘affordable’.
Cars and freight
Perception of parking
Parking. Rating scale included ‘very good’, ‘good’, ‘fair’, ‘poor’ [34].
It would be good to specifcally measure parking restrictions, number of parking spaces and the cost of parking.
Car dependency
Does the plan, policy or proposal encourage car dependency? If residents living in this area did not have a car could they access employment, shops, schools, entertainment and recreation? This is an Item on a healthy urban development checklist [22].
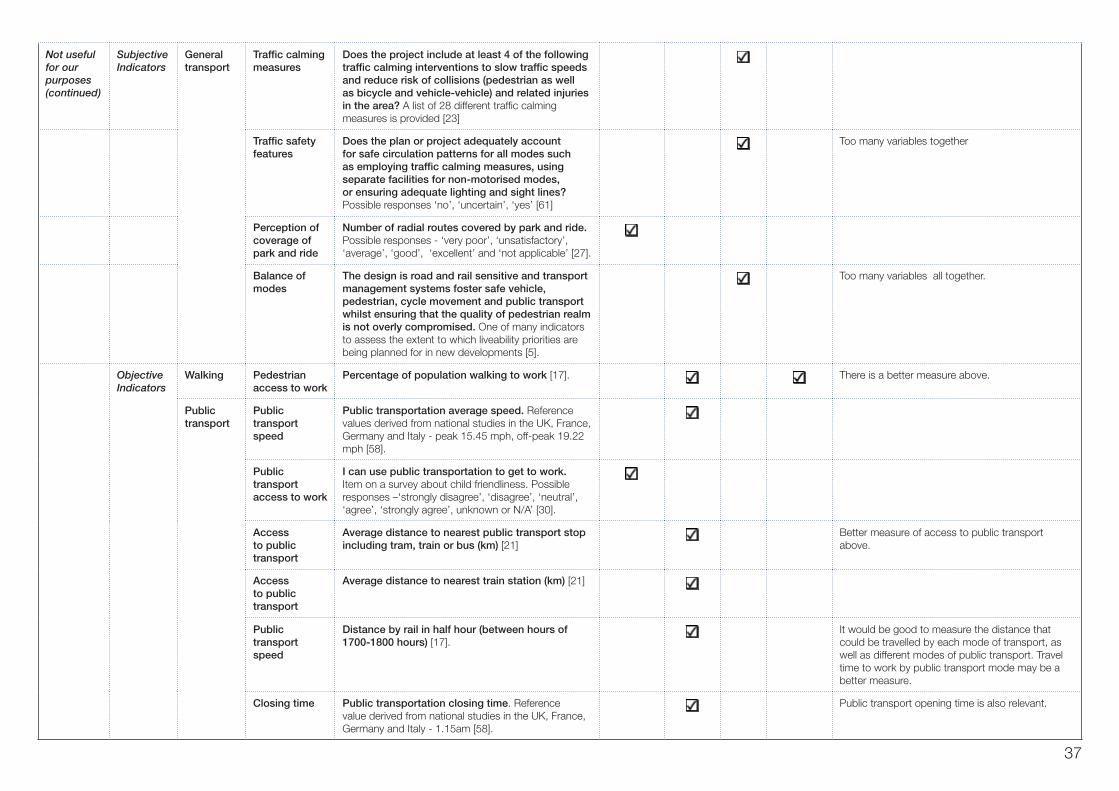
37
Not useful for our purposes(continued)
SubjectiveIndicators
General transport
Traffic calming measures
Does the project include at least 4 of the following traffic calming interventions to slow traffic speeds and reduce risk of collisions (pedestrian as well as bicycle and vehicle-vehicle) and related injuries in the area? A list of 28 different traffic calming measures is provided [23]
Traffic safety features
Does the plan or project adequately account for safe circulation patterns for all modes such as employing traffic calming measures, using separate facilities for non-motorised modes, or ensuring adequate lighting and sight lines? Possible responses ‘no’, ‘uncertain’, ‘yes’ [61]
Too many variables together
Perception of coverage of park and ride
Number of radial routes covered by park and ride. Possible responses - ‘very poor’, ‘unsatisfactory’, ‘average’, ‘good’, ‘excellent’ and ‘not applicable’ [27].
Balance of modes
The design is road and rail sensitive and transport management systems foster safe vehicle, pedestrian, cycle movement and public transport whilst ensuring that the quality of pedestrian realm is not overly compromised. One of many indicators to assess the extent to which liveability priorities are being planned for in new developments [5].
Too many variables all together.
Objective Indicators
Walking Pedestrian access to work
Percentage of population walking to work [17]. There is a better measure above.
Public transport
Public transport speed
Public transportation average speed. Reference values derived from national studies in the UK, France, Germany and Italy - peak 15.45 mph, off-peak 19.22 mph [58].
Public transport access to work
I can use public transportation to get to work. Item on a survey about child friendliness. Possible responses –‘strongly disagree’, ‘disagree’, ‘neutral’, ‘agree’, ‘strongly agree’, unknown or N/A’ [30].
Access to public transport
Average distance to nearest public transport stop including tram, train or bus (km) [21]
Better measure of access to public transport above.
Access to public transport
Average distance to nearest train station (km) [21]
Public transport speed
Distance by rail in half hour (between hours of 1700-1800 hours) [17].
It would be good to measure the distance that could be travelled by each mode of transport, as well as different modes of public transport. Travel time to work by public transport mode may be a better measure.
Closing time Public transportation closing time. Reference value derived from national studies in the UK, France, Germany and Italy - 1.15am [58].
Public transport opening time is also relevant.
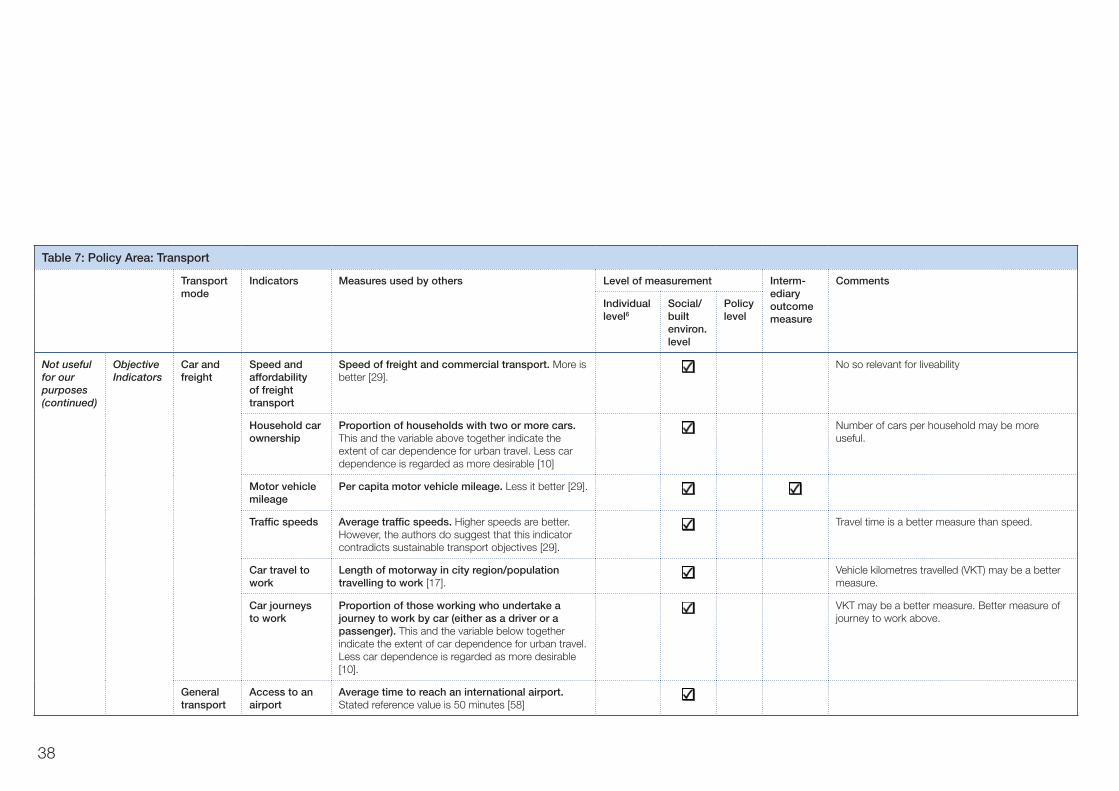
38
Table 7: Policy Area: Transport
Transport mode
Indicators Measures used by others Level of measurement Interm-ediary outcome measure
Comments
Individual level6
Social/built environ. level
Policy level
Not useful for our purposes(continued)
Objective Indicators
Car and freight
Speed and affordability of freight transport
Speed of freight and commercial transport. More is better [29].
No so relevant for liveability
Household car ownership
Proportion of households with two or more cars. This and the variable above together indicate the extent of car dependence for urban travel. Less car dependence is regarded as more desirable [10]
Number of cars per household may be more useful.
Motor vehicle mileage
Per capita motor vehicle mileage. Less it better [29].
Traffic speeds Average traffic speeds. Higher speeds are better. However, the authors do suggest that this indicator contradicts sustainable transport objectives [29].
Travel time is a better measure than speed.
Car travel to work
Length of motorway in city region/population travelling to work [17].
Vehicle kilometres travelled (VKT) may be a better measure.
Car journeys to work
Proportion of those working who undertake a journey to work by car (either as a driver or a passenger). This and the variable below together indicate the extent of car dependence for urban travel. Less car dependence is regarded as more desirable [10].
VKT may be a better measure. Better measure of journey to work above.
General transport
Access to an airport
Average time to reach an international airport. Stated reference value is 50 minutes [58]
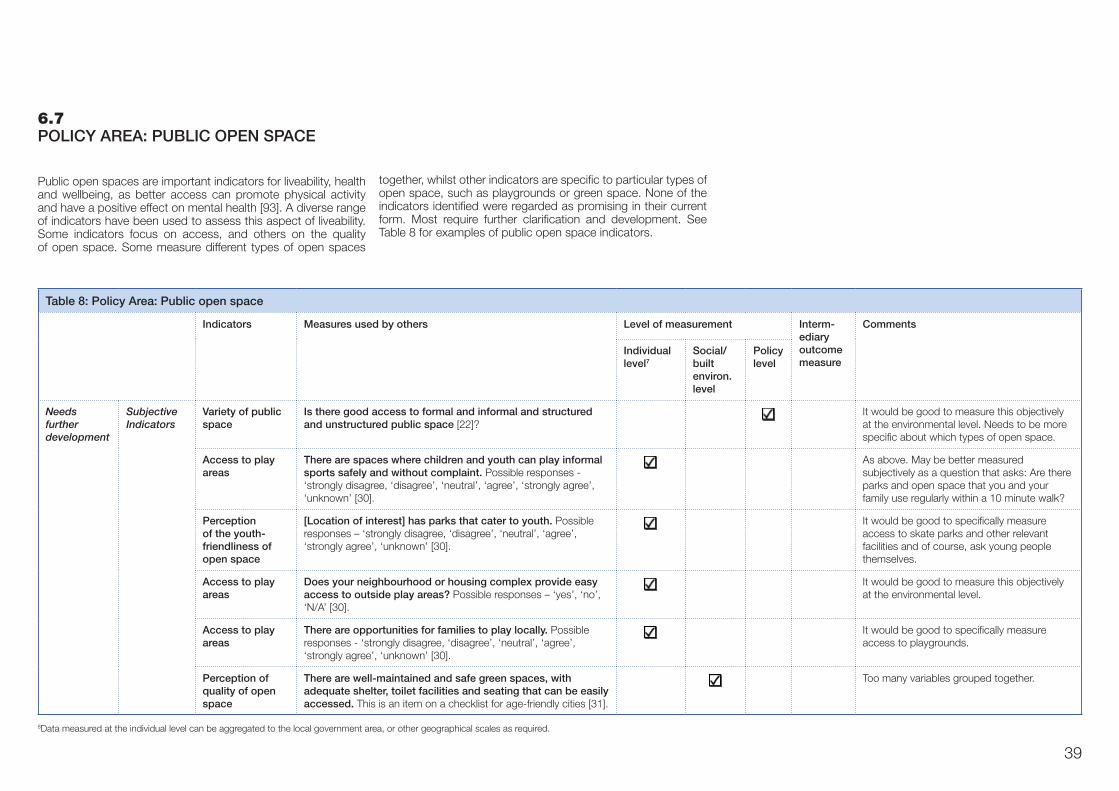
39
6.7 POLICY AREA: PUBLIC OPEN SPACE
Public open spaces are important indicators for liveability, health and wellbeing, as better access can promote physical activity and have a positive effect on mental health [93]. A diverse range of indicators have been used to assess this aspect of liveability. Some indicators focus on access, and others on the quality of open space. Some measure different types of open spaces
8Data measured at the individual level can be aggregated to the local government area, or other geographical scales as required.
together, whilst other indicators are specific to particular types of open space, such as playgrounds or green space. None of the indicators identified were regarded as promising in their current form. Most require further clarification and development. See Table 8 for examples of public open space indicators.
Table 8: Policy Area: Public open space
Indicators Measures used by others Level of measurement Interm-ediary outcome measure
Comments
Individual level7
Social/built environ. level
Policy level
Needs further development
Subjective Indicators
Variety of public space
Is there good access to formal and informal and structured and unstructured public space [22]?
It would be good to measure this objectively at the environmental level. Needs to be more specific about which types of open space.
Access to play areas
There are spaces where children and youth can play informal sports safely and without complaint. Possible responses - ‘strongly disagree, ‘disagree’, ‘neutral’, ‘agree’, ‘strongly agree’, ‘unknown’ [30].
As above. May be better measured subjectively as a question that asks: Are there parks and open space that you and your family use regularly within a 10 minute walk?
Perception of the youth-friendliness of open space
[Location of interest] has parks that cater to youth. Possible responses – ‘strongly disagree, ‘disagree’, ‘neutral’, ‘agree’, ‘strongly agree’, ‘unknown’ [30].
It would be good to specifically measure access to skate parks and other relevant facilities and of course, ask young people themselves.
Access to play areas
Does your neighbourhood or housing complex provide easy access to outside play areas? Possible responses – ‘yes’, ‘no’, ‘N/A’ [30].
It would be good to measure this objectively at the environmental level.
Access to play areas
There are opportunities for families to play locally. Possible responses - ‘strongly disagree, ‘disagree’, ‘neutral’, ‘agree’, ‘strongly agree’, ‘unknown’ [30].
It would be good to specifically measure access to playgrounds.
Perception of quality of open space
There are well-maintained and safe green spaces, with adequate shelter, toilet facilities and seating that can be easily accessed. This is an item on a checklist for age-friendly cities [31].
Too many variables grouped together.
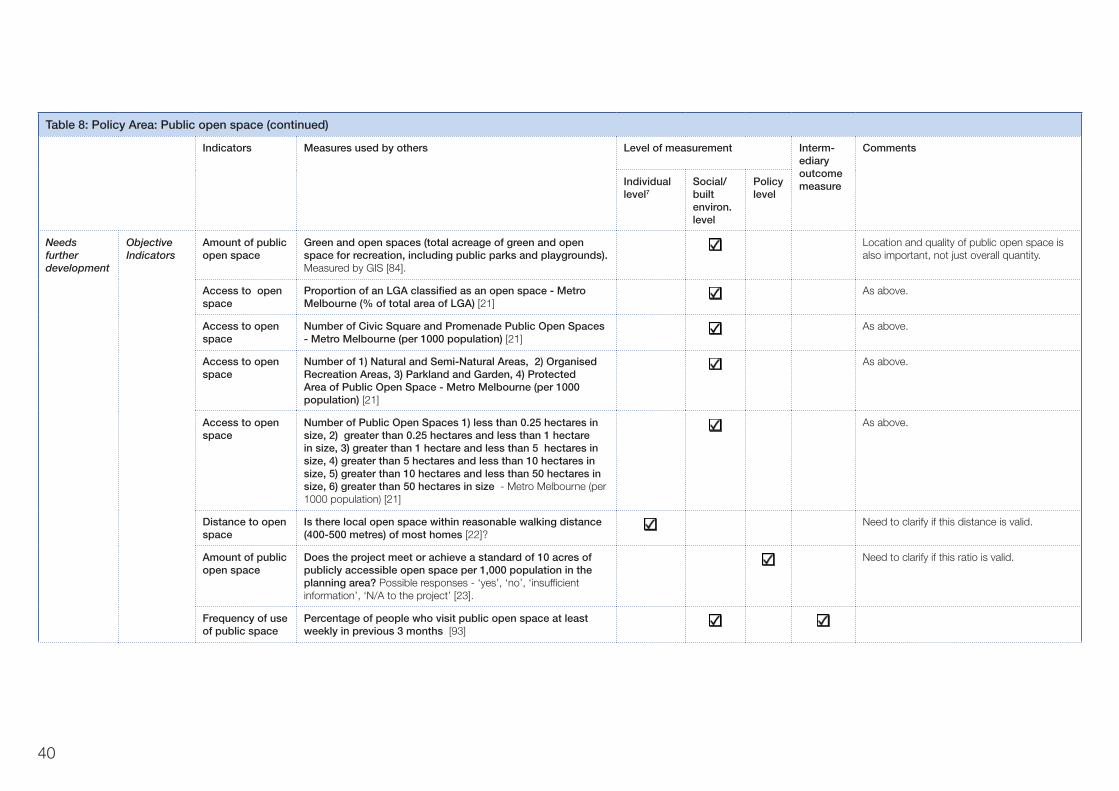
40
Table 8: Policy Area: Public open space (continued)
Indicators Measures used by others Level of measurement Interm-ediary outcome measure
Comments
Individual level7
Social/built environ. level
Policy level
Needs further development
Objective Indicators
Amount of public open space
Green and open spaces (total acreage of green and open space for recreation, including public parks and playgrounds). Measured by GIS [84].
Location and quality of public open space is also important, not just overall quantity.
Access to open space
Proportion of an LGA classified as an open space - Metro Melbourne (% of total area of LGA) [21]
As above.
Access to open space
Number of Civic Square and Promenade Public Open Spaces - Metro Melbourne (per 1000 population) [21]
As above.
Access to open space
Number of 1) Natural and Semi-Natural Areas, 2) Organised Recreation Areas, 3) Parkland and Garden, 4) Protected Area of Public Open Space - Metro Melbourne (per 1000 population) [21]
As above.
Access to open space
Number of Public Open Spaces 1) less than 0.25 hectares in size, 2) greater than 0.25 hectares and less than 1 hectare in size, 3) greater than 1 hectare and less than 5 hectares in size, 4) greater than 5 hectares and less than 10 hectares in size, 5) greater than 10 hectares and less than 50 hectares in size, 6) greater than 50 hectares in size - Metro Melbourne (per 1000 population) [21]
As above.
Distance to open space
Is there local open space within reasonable walking distance (400-500 metres) of most homes [22]?
Need to clarify if this distance is valid.
Amount of public open space
Does the project meet or achieve a standard of 10 acres of publicly accessible open space per 1,000 population in the planning area? Possible responses - ‘yes’, ‘no’, ‘insufficient information’, ‘N/A to the project’ [23].
Need to clarify if this ratio is valid.
Frequency of use of public space
Percentage of people who visit public open space at least weekly in previous 3 months [93]
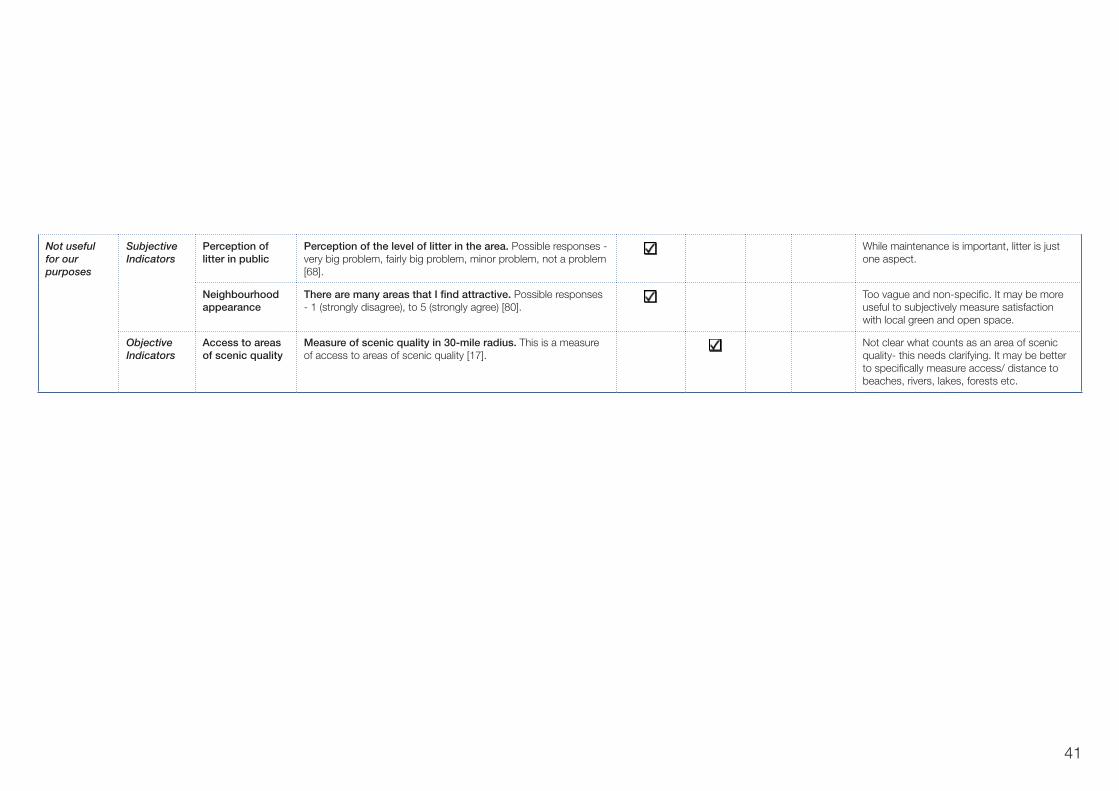
41
Not useful for our purposes
SubjectiveIndicators
Perception of litter in public
Perception of the level of litter in the area. Possible responses - very big problem, fairly big problem, minor problem, not a problem [68].
While maintenance is important, litter is just one aspect.
Neighbourhood appearance
There are many areas that I find attractive. Possible responses - 1 (strongly disagree), to 5 (strongly agree) [80].
Too vague and non-specific. It may be more useful to subjectively measure satisfaction with local green and open space.
Objective Indicators
Access to areas of scenic quality
Measure of scenic quality in 30-mile radius. This is a measure of access to areas of scenic quality [17].
Not clear what counts as an area of scenic quality- this needs clarifying. It may be better to specifically measure access/ distance to beaches, rivers, lakes, forests etc.
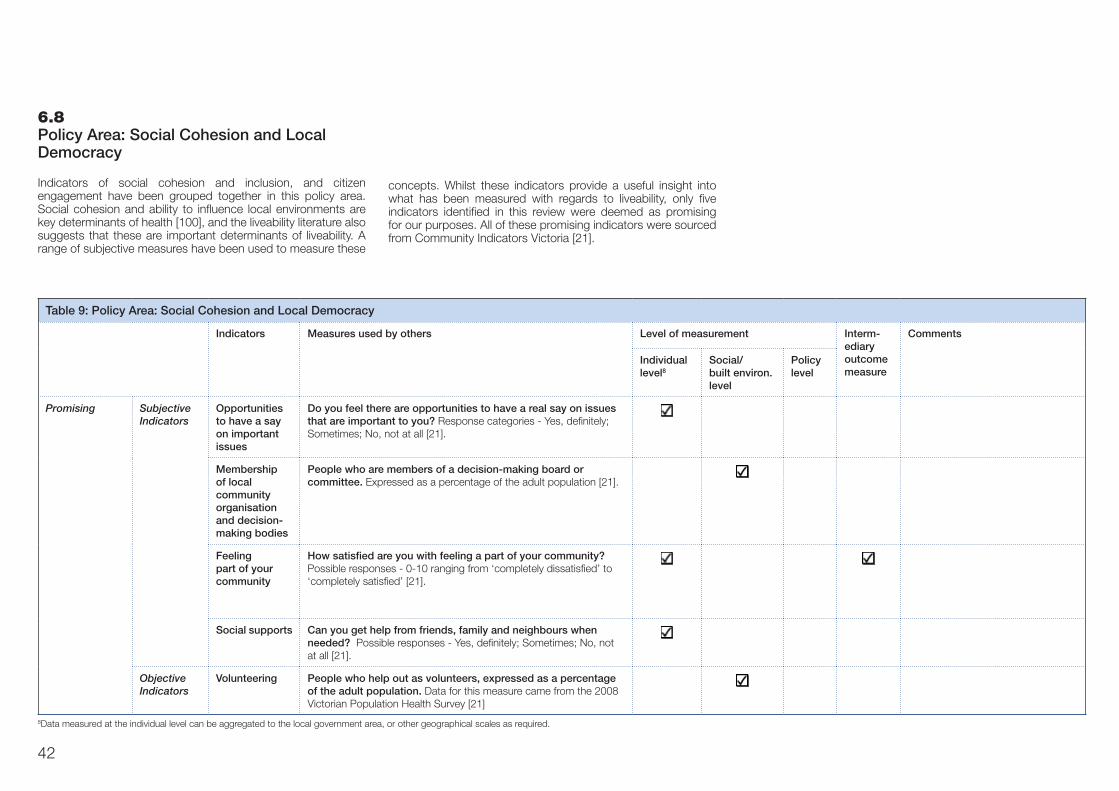
42
6.8 Policy Area: Social Cohesion and Local Democracy
Indicators of social cohesion and inclusion, and citizen engagement have been grouped together in this policy area. Social cohesion and ability to influence local environments are key determinants of health [100], and the liveability literature also suggests that these are important determinants of liveability. A range of subjective measures have been used to measure these
Table 9: Policy Area: Social Cohesion and Local Democracy
Indicators Measures used by others Level of measurement Interm-ediary outcome measure
Comments
Individual level8
Social/built environ. level
Policy level
Promising Subjective Indicators
Opportunities to have a say on important issues
Do you feel there are opportunities to have a real say on issues that are important to you? Response categories - Yes, definitely; Sometimes; No, not at all [21].
Membership of local community organisation and decision-making bodies
People who are members of a decision-making board or committee. Expressed as a percentage of the adult population [21].
Feeling part of your community
How satisfied are you with feeling a part of your community? Possible responses - 0-10 ranging from ‘completely dissatisfied’ to ‘completely satisfied’ [21].
Social supports Can you get help from friends, family and neighbours when needed? Possible responses - Yes, definitely; Sometimes; No, not at all [21].
Objective Indicators
Volunteering People who help out as volunteers, expressed as a percentage of the adult population. Data for this measure came from the 2008 Victorian Population Health Survey [21]
concepts. Whilst these indicators provide a useful insight into what has been measured with regards to liveability, only five indicators identified in this review were deemed as promising for our purposes. All of these promising indicators were sourced from Community Indicators Victoria [21].
8Data measured at the individual level can be aggregated to the local government area, or other geographical scales as required.
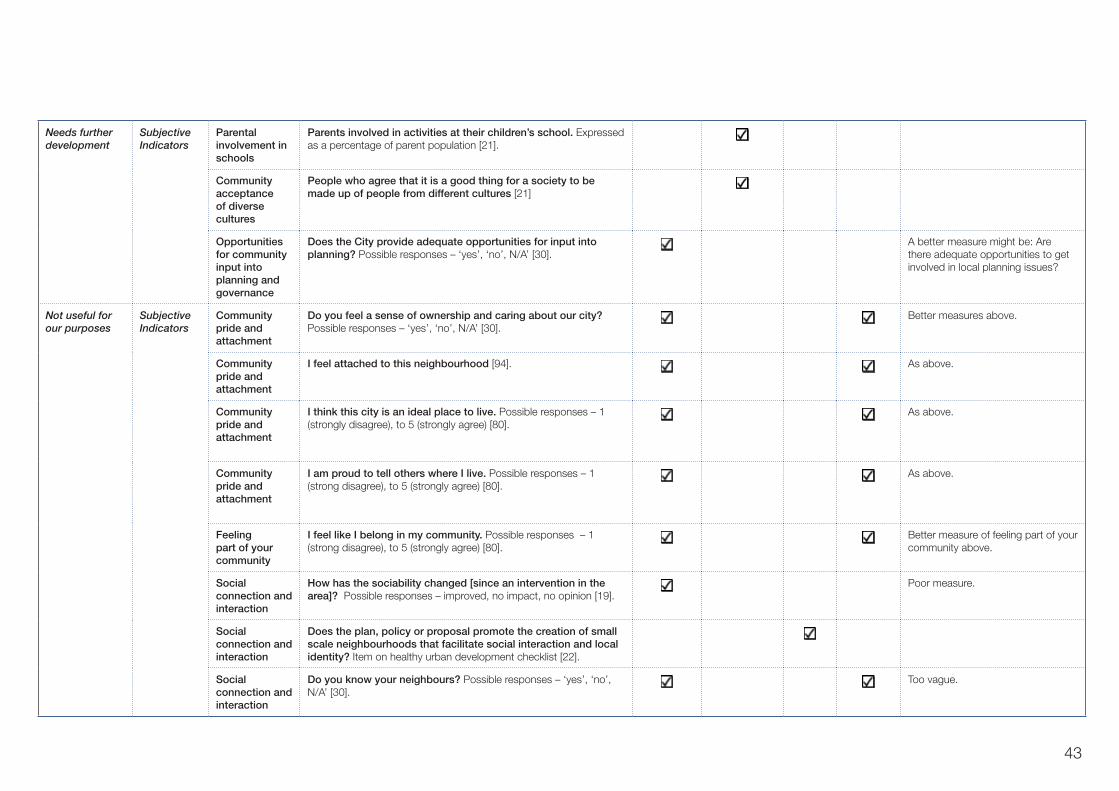
43
Needs further development
Subjective Indicators
Parental involvement in schools
Parents involved in activities at their children’s school. Expressed as a percentage of parent population [21].
Community acceptance of diverse cultures
People who agree that it is a good thing for a society to be made up of people from different cultures [21]
Opportunities for community input into planning and governance
Does the City provide adequate opportunities for input into planning? Possible responses – ‘yes’, ‘no’, N/A’ [30].
A better measure might be: Are there adequate opportunities to get involved in local planning issues?
Not useful for our purposes
SubjectiveIndicators
Community pride and attachment
Do you feel a sense of ownership and caring about our city? Possible responses – ‘yes’, ‘no’, N/A’ [30].
Better measures above.
Community pride and attachment
I feel attached to this neighbourhood [94]. As above.
Community pride and attachment
I think this city is an ideal place to live. Possible responses – 1 (strongly disagree), to 5 (strongly agree) [80].
As above.
Community pride and attachment
I am proud to tell others where I live. Possible responses – 1 (strong disagree), to 5 (strongly agree) [80].
As above.
Feeling part of your community
I feel like I belong in my community. Possible responses – 1 (strong disagree), to 5 (strongly agree) [80].
Better measure of feeling part of your community above.
Social connection and interaction
How has the sociability changed [since an intervention in the area]? Possible responses – improved, no impact, no opinion [19].
Poor measure.
Social connection and interaction
Does the plan, policy or proposal promote the creation of small scale neighbourhoods that facilitate social interaction and local identity? Item on healthy urban development checklist [22].
Social connection and interaction
Do you know your neighbours? Possible responses – ‘yes’, ‘no’, N/A’ [30].
Too vague.
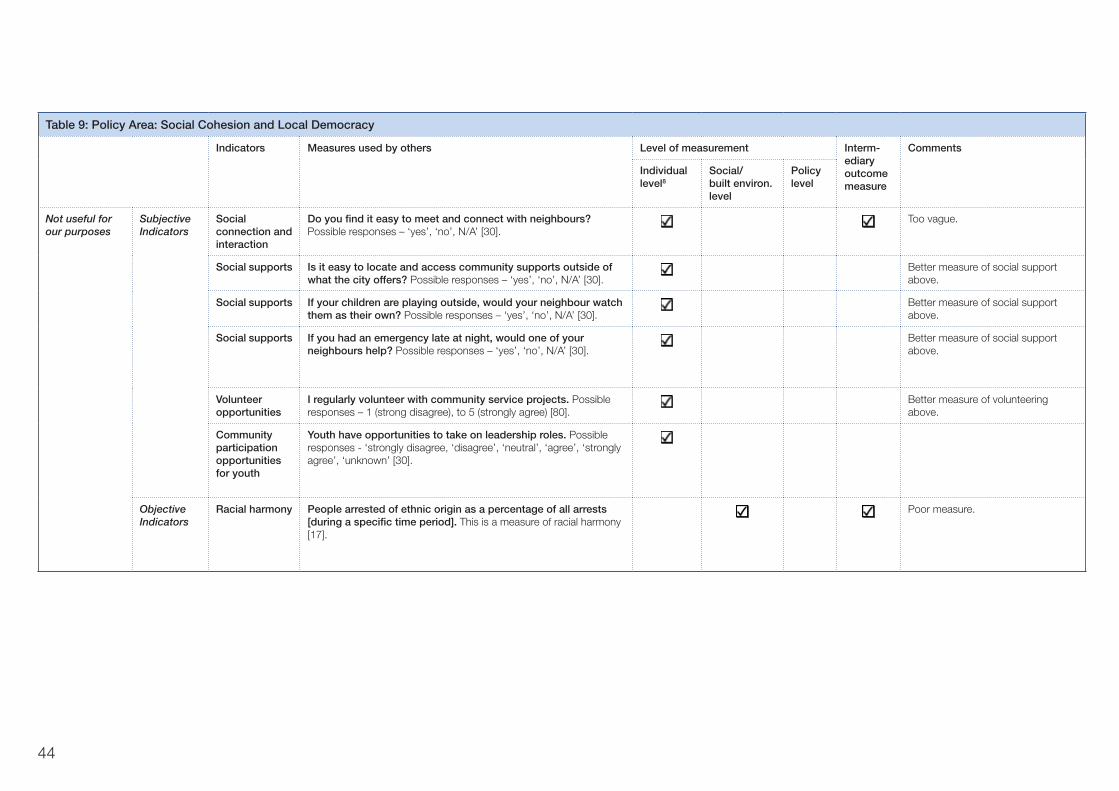
44
Table 9: Policy Area: Social Cohesion and Local Democracy
Indicators Measures used by others Level of measurement Interm-ediary outcome measure
Comments
Individual level8
Social/built environ. level
Policy level
Not useful for our purposes
SubjectiveIndicators
Social connection and interaction
Do you find it easy to meet and connect with neighbours? Possible responses – ‘yes’, ‘no’, N/A’ [30].
Too vague.
Social supports Is it easy to locate and access community supports outside of what the city offers? Possible responses – ‘yes’, ‘no’, N/A’ [30].
Better measure of social support above.
Social supports If your children are playing outside, would your neighbour watch them as their own? Possible responses – ‘yes’, ‘no’, N/A’ [30].
Better measure of social support above.
Social supports If you had an emergency late at night, would one of your neighbours help? Possible responses – ‘yes’, ‘no’, N/A’ [30].
Better measure of social support above.
Volunteer opportunities
I regularly volunteer with community service projects. Possible responses – 1 (strong disagree), to 5 (strongly agree) [80].
Better measure of volunteering above.
Community participation opportunities for youth
Youth have opportunities to take on leadership roles. Possible responses - ‘strongly disagree, ‘disagree’, ‘neutral’, ‘agree’, ‘strongly agree’, ‘unknown’ [30].
Objective Indicators
Racial harmony People arrested of ethnic origin as a percentage of all arrests [during a specific time period]. This is a measure of racial harmony [17].
Poor measure.
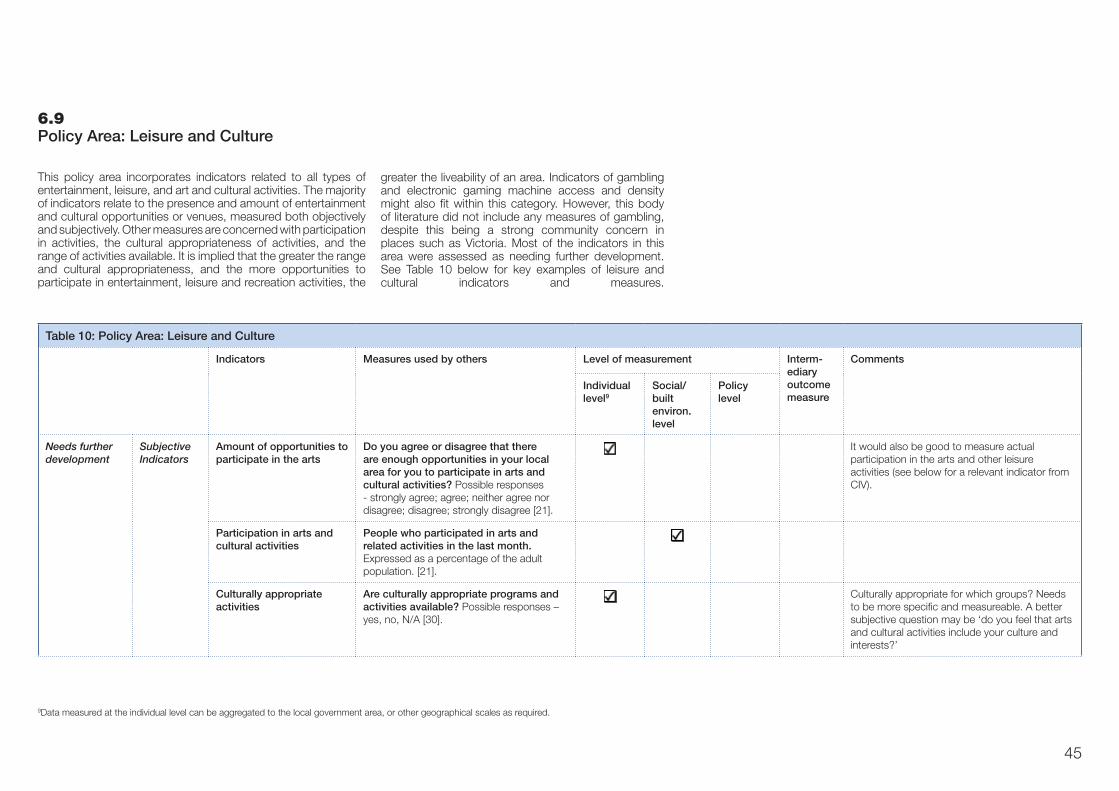
45
6.9 Policy Area: Leisure and Culture
This policy area incorporates indicators related to all types of entertainment, leisure, and art and cultural activities. The majority of indicators relate to the presence and amount of entertainment and cultural opportunities or venues, measured both objectively and subjectively. Other measures are concerned with participation in activities, the cultural appropriateness of activities, and the range of activities available. It is implied that the greater the range and cultural appropriateness, and the more opportunities to participate in entertainment, leisure and recreation activities, the
greater the liveability of an area. Indicators of gambling and electronic gaming machine access and density might also fit within this category. However, this body of literature did not include any measures of gambling, despite this being a strong community concern in places such as Victoria. Most of the indicators in this area were assessed as needing further development. See Table 10 below for key examples of leisure and cultural indicators and measures.
Table 10: Policy Area: Leisure and Culture
Indicators Measures used by others Level of measurement Interm-ediary outcome measure
Comments
Individual level9
Social/built environ. level
Policy level
Needs further development
Subjective Indicators
Amount of opportunities to participate in the arts
Do you agree or disagree that there are enough opportunities in your local area for you to participate in arts and cultural activities? Possible responses - strongly agree; agree; neither agree nor disagree; disagree; strongly disagree [21].
It would also be good to measure actual participation in the arts and other leisure activities (see below for a relevant indicator from CIV).
Participation in arts and cultural activities
People who participated in arts and related activities in the last month. Expressed as a percentage of the adult population. [21].
Culturally appropriate activities
Are culturally appropriate programs and activities available? Possible responses – yes, no, N/A [30].
Culturally appropriate for which groups? Needs to be more specific and measureable. A better subjective question may be ‘do you feel that arts and cultural activities include your culture and interests?’
9Data measured at the individual level can be aggregated to the local government area, or other geographical scales as required.
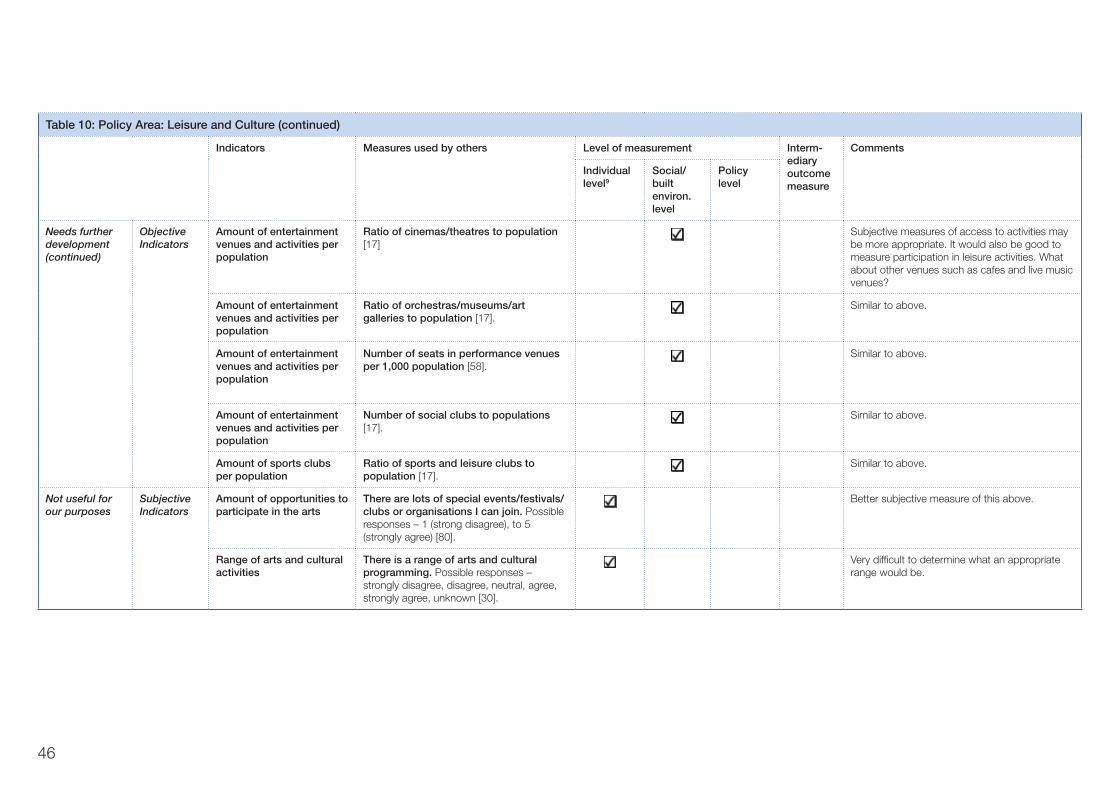
46
Table 10: Policy Area: Leisure and Culture (continued)
Indicators Measures used by others Level of measurement Interm-ediary outcome measure
Comments
Individual level9
Social/built environ. level
Policy level
Needs further development (continued)
Objective Indicators
Amount of entertainment venues and activities per population
Ratio of cinemas/theatres to population [17]
Subjective measures of access to activities may be more appropriate. It would also be good to measure participation in leisure activities. What about other venues such as cafes and live music venues?
Amount of entertainment venues and activities per population
Ratio of orchestras/museums/art galleries to population [17].
Similar to above.
Amount of entertainment venues and activities per population
Number of seats in performance venues per 1,000 population [58].
Similar to above.
Amount of entertainment venues and activities per population
Number of social clubs to populations [17].
Similar to above.
Amount of sports clubs per population
Ratio of sports and leisure clubs to population [17].
Similar to above.
Not useful for our purposes
SubjectiveIndicators
Amount of opportunities to participate in the arts
There are lots of special events/festivals/clubs or organisations I can join. Possible responses – 1 (strong disagree), to 5 (strongly agree) [80].
Better subjective measure of this above.
Range of arts and cultural activities
There is a range of arts and cultural programming. Possible responses – strongly disagree, disagree, neutral, agree, strongly agree, unknown [30].
Very difficult to determine what an appropriate range would be.
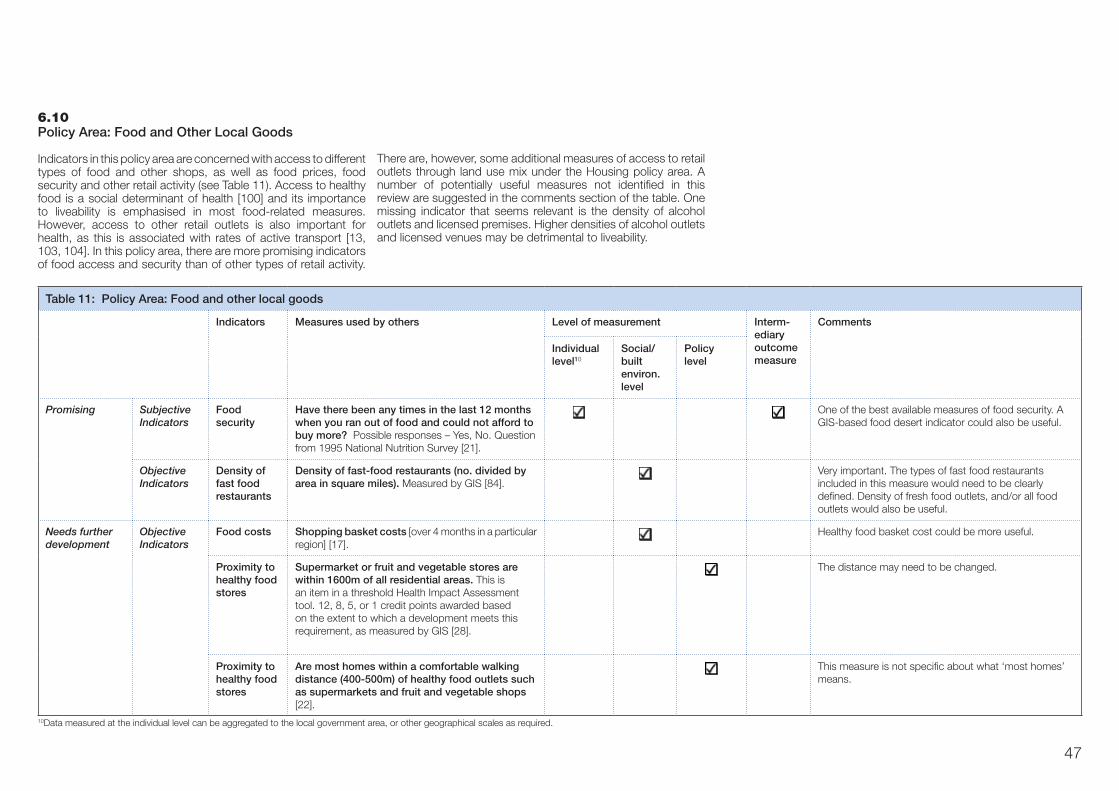
47
6.10 Policy Area: Food and Other Local Goods
Indicators in this policy area are concerned with access to different types of food and other shops, as well as food prices, food security and other retail activity (see Table 11). Access to healthy food is a social determinant of health [100] and its importance to liveability is emphasised in most food-related measures. However, access to other retail outlets is also important for health, as this is associated with rates of active transport [13, 103, 104]. In this policy area, there are more promising indicators of food access and security than of other types of retail activity.
There are, however, some additional measures of access to retail outlets through land use mix under the Housing policy area. A number of potentially useful measures not identified in this review are suggested in the comments section of the table. One missing indicator that seems relevant is the density of alcohol outlets and licensed premises. Higher densities of alcohol outlets and licensed venues may be detrimental to liveability.
Table 11: Policy Area: Food and other local goods
Indicators Measures used by others Level of measurement Interm-ediary outcome measure
Comments
Individual level10
Social/built environ.level
Policy level
Promising Subjective Indicators
Food security
Have there been any times in the last 12 months when you ran out of food and could not afford to buy more? Possible responses – Yes, No. Question from 1995 National Nutrition Survey [21].
One of the best available measures of food security. A GIS-based food desert indicator could also be useful.
Objective Indicators
Density of fast food restaurants
Density of fast-food restaurants (no. divided by area in square miles). Measured by GIS [84].
Very important. The types of fast food restaurants included in this measure would need to be clearly defined. Density of fresh food outlets, and/or all food outlets would also be useful.
Needs further development
Objective Indicators
Food costs Shopping basket costs [over 4 months in a particular region] [17].
Healthy food basket cost could be more useful.
Proximity to healthy food stores
Supermarket or fruit and vegetable stores are within 1600m of all residential areas. This is an item in a threshold Health Impact Assessment tool. 12, 8, 5, or 1 credit points awarded based on the extent to which a development meets this requirement, as measured by GIS [28].
The distance may need to be changed.
Proximity to healthy food stores
Are most homes within a comfortable walking distance (400-500m) of healthy food outlets such as supermarkets and fruit and vegetable shops [22].
This measure is not specific about what ‘most homes’ means.
10Data measured at the individual level can be aggregated to the local government area, or other geographical scales as required.
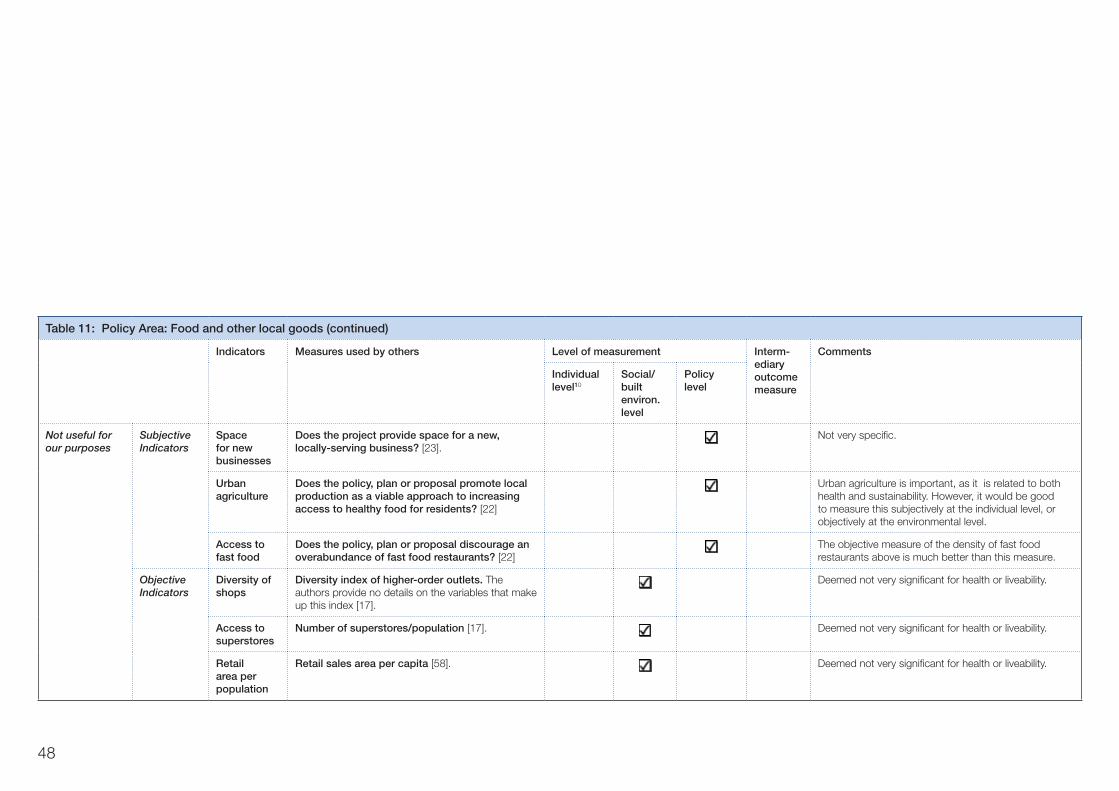
48
Table 11: Policy Area: Food and other local goods (continued)
Indicators Measures used by others Level of measurement Interm-ediary outcome measure
Comments
Individual level10
Social/built environ.level
Policy level
Not useful for our purposes
Subjective Indicators
Space for new businesses
Does the project provide space for a new, locally-serving business? [23].
Not very specific.
Urban agriculture
Does the policy, plan or proposal promote local production as a viable approach to increasing access to healthy food for residents? [22]
Urban agriculture is important, as it is related to both health and sustainability. However, it would be good to measure this subjectively at the individual level, or objectively at the environmental level.
Access to fast food
Does the policy, plan or proposal discourage an overabundance of fast food restaurants? [22]
The objective measure of the density of fast food restaurants above is much better than this measure.
Objective Indicators
Diversity of shops
Diversity index of higher-order outlets. The authors provide no details on the variables that make up this index [17].
Deemed not very significant for health or liveability.
Access to superstores
Number of superstores/population [17]. Deemed not very significant for health or liveability.
Retail area per population
Retail sales area per capita [58]. Deemed not very significant for health or liveability.
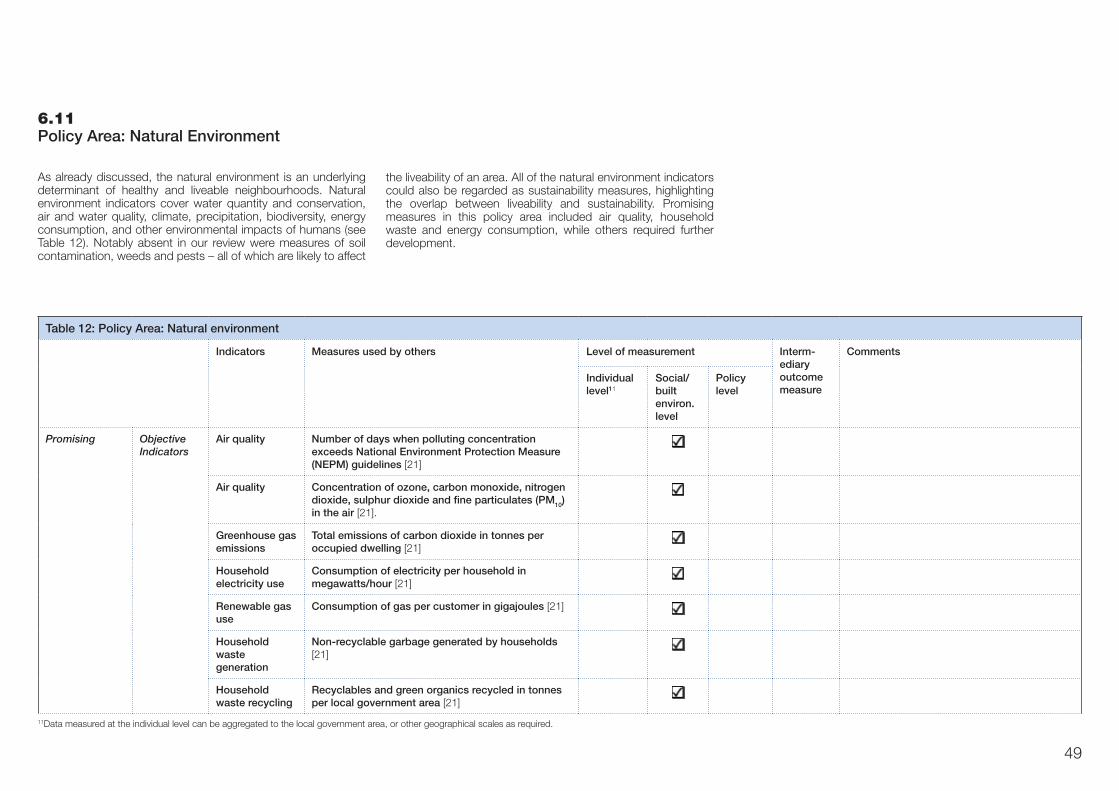
49
6.11 Policy Area: Natural Environment
As already discussed, the natural environment is an underlying determinant of healthy and liveable neighbourhoods. Natural environment indicators cover water quantity and conservation, air and water quality, climate, precipitation, biodiversity, energy consumption, and other environmental impacts of humans (see Table 12). Notably absent in our review were measures of soil contamination, weeds and pests – all of which are likely to affect
the liveability of an area. All of the natural environment indicators could also be regarded as sustainability measures, highlighting the overlap between liveability and sustainability. Promising measures in this policy area included air quality, household waste and energy consumption, while others required further development.
Table 12: Policy Area: Natural environment
Indicators Measures used by others Level of measurement Interm-ediary outcome measure
Comments
Individual level11
Social/built environ. level
Policy level
Promising Objective Indicators
Air quality Number of days when polluting concentration exceeds National Environment Protection Measure (NEPM) guidelines [21]
Air quality Concentration of ozone, carbon monoxide, nitrogen dioxide, sulphur dioxide and fine particulates (PM10) in the air [21].
Greenhouse gas emissions
Total emissions of carbon dioxide in tonnes per occupied dwelling [21]
Household electricity use
Consumption of electricity per household in megawatts/hour [21]
Renewable gas use
Consumption of gas per customer in gigajoules [21]
Household waste generation
Non-recyclable garbage generated by households [21]
Household waste recycling
Recyclables and green organics recycled in tonnes per local government area [21]
11Data measured at the individual level can be aggregated to the local government area, or other geographical scales as required.
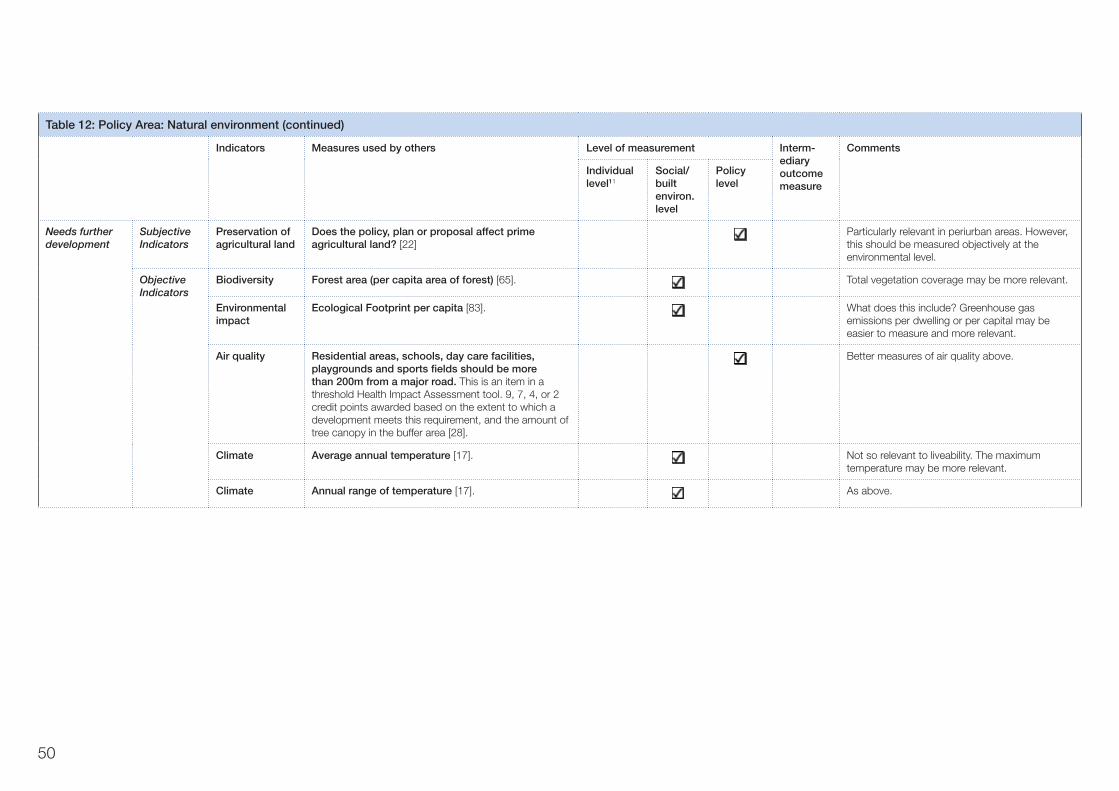
50
Table 12: Policy Area: Natural environment (continued)
Indicators Measures used by others Level of measurement Interm-ediary outcome measure
Comments
Individual level11
Social/built environ. level
Policy level
Needs further development
Subjective Indicators
Preservation of agricultural land
Does the policy, plan or proposal affect prime agricultural land? [22]
Particularly relevant in periurban areas. However, this should be measured objectively at the environmental level.
Objective Indicators
Biodiversity Forest area (per capita area of forest) [65]. Total vegetation coverage may be more relevant.
Environmental impact
Ecological Footprint per capita [83]. What does this include? Greenhouse gas emissions per dwelling or per capital may be easier to measure and more relevant.
Air quality Residential areas, schools, day care facilities, playgrounds and sports fields should be more than 200m from a major road. This is an item in a threshold Health Impact Assessment tool. 9, 7, 4, or 2 credit points awarded based on the extent to which a development meets this requirement, and the amount of tree canopy in the buffer area [28].
Better measures of air quality above.
Climate Average annual temperature [17]. Not so relevant to liveability. The maximum temperature may be more relevant.
Climate Annual range of temperature [17]. As above.
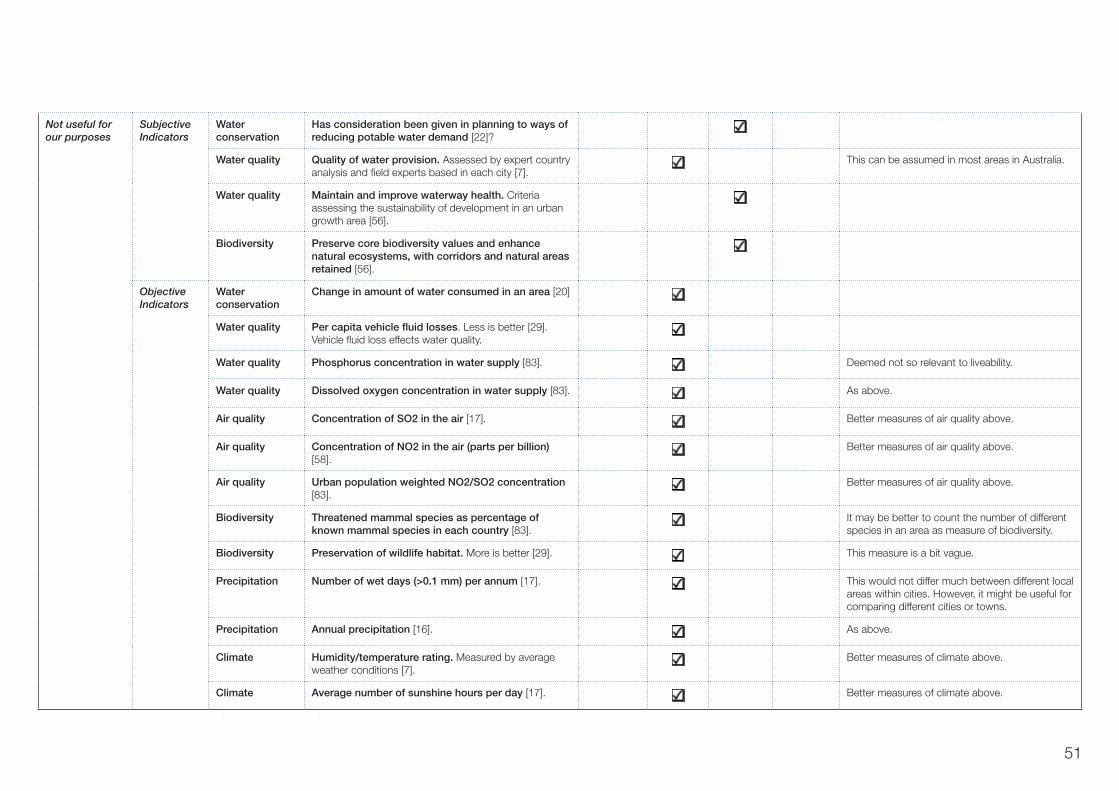
51
Not useful for our purposes
SubjectiveIndicators
Water conservation
Has consideration been given in planning to ways of reducing potable water demand [22]?
Water quality Quality of water provision. Assessed by expert country analysis and field experts based in each city [7].
This can be assumed in most areas in Australia.
Water quality Maintain and improve waterway health. Criteria assessing the sustainability of development in an urban growth area [56].
Biodiversity Preserve core biodiversity values and enhance natural ecosystems, with corridors and natural areas retained [56].
Objective Indicators
Water conservation
Change in amount of water consumed in an area [20]
Water quality Per capita vehicle fluid losses. Less is better [29]. Vehicle fluid loss effects water quality.
Water quality Phosphorus concentration in water supply [83]. Deemed not so relevant to liveability.
Water quality Dissolved oxygen concentration in water supply [83]. As above.
Air quality Concentration of SO2 in the air [17]. Better measures of air quality above.
Air quality Concentration of NO2 in the air (parts per billion) [58].
Better measures of air quality above.
Air quality Urban population weighted NO2/SO2 concentration [83].
Better measures of air quality above.
Biodiversity Threatened mammal species as percentage of known mammal species in each country [83].
It may be better to count the number of different species in an area as measure of biodiversity.
Biodiversity Preservation of wildlife habitat. More is better [29]. This measure is a bit vague.
Precipitation Number of wet days (>0.1 mm) per annum [17]. This would not differ much between different local areas within cities. However, it might be useful for comparing different cities or towns.
Precipitation Annual precipitation [16]. As above.
Climate Humidity/temperature rating. Measured by average weather conditions [7].
Better measures of climate above.
Climate Average number of sunshine hours per day [17]. Better measures of climate above.

52
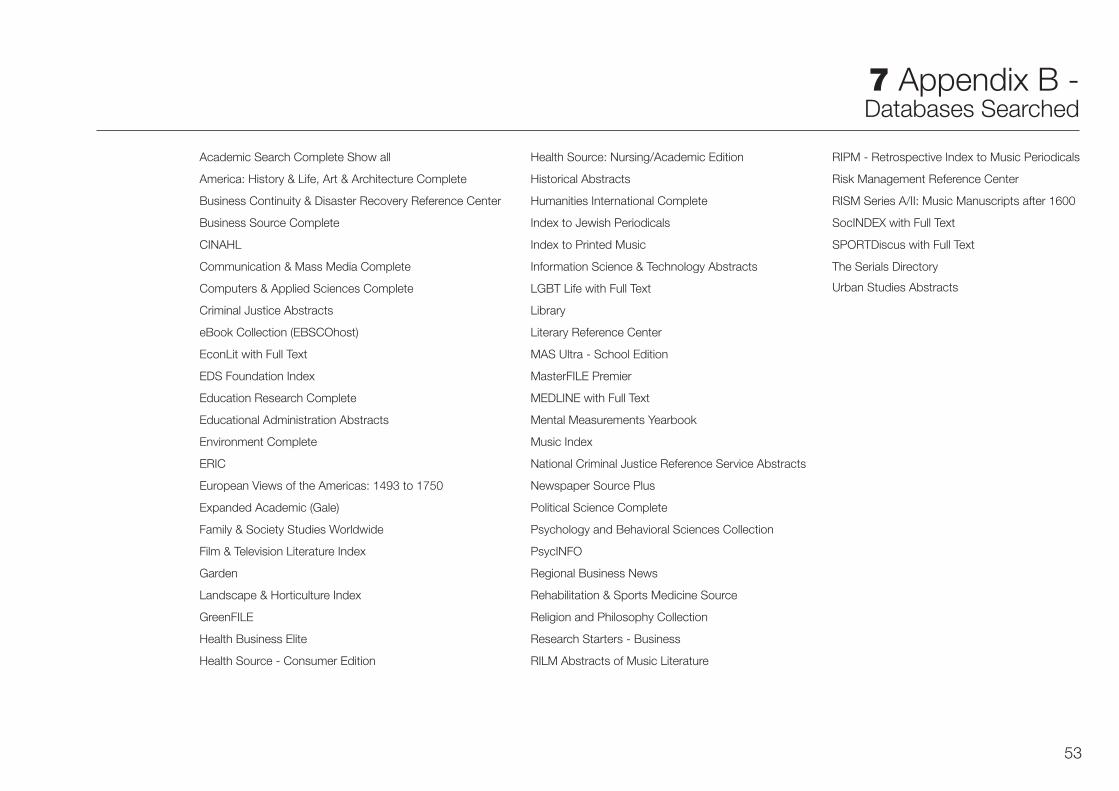
53
7 Appendix B - Databases Searched
Academic Search Complete Show all
America: History & Life, Art & Architecture Complete
Business Continuity & Disaster Recovery Reference Center
Business Source Complete
CINAHL
Communication & Mass Media Complete
Computers & Applied Sciences Complete
Criminal Justice Abstracts
eBook Collection (EBSCOhost)
EconLit with Full Text
EDS Foundation Index
Education Research Complete
Educational Administration Abstracts
Environment Complete
ERIC
European Views of the Americas: 1493 to 1750
Expanded Academic (Gale)
Family & Society Studies Worldwide
Film & Television Literature Index
Garden
Landscape & Horticulture Index
GreenFILE
Health Business Elite
Health Source - Consumer Edition
Health Source: Nursing/Academic Edition
Historical Abstracts
Humanities International Complete
Index to Jewish Periodicals
Index to Printed Music
Information Science & Technology Abstracts
LGBT Life with Full Text
Library
Literary Reference Center
MAS Ultra - School Edition
MasterFILE Premier
MEDLINE with Full Text
Mental Measurements Yearbook
Music Index
National Criminal Justice Reference Service Abstracts
Newspaper Source Plus
Political Science Complete
Psychology and Behavioral Sciences Collection
PsycINFO
Regional Business News
Rehabilitation & Sports Medicine Source
Religion and Philosophy Collection
Research Starters - Business
RILM Abstracts of Music Literature
RIPM - Retrospective Index to Music Periodicals
Risk Management Reference Center
RISM Series A/II: Music Manuscripts after 1600
SocINDEX with Full Text
SPORTDiscus with Full Text
The Serials Directory
Urban Studies Abstracts
54
8 References
1. Planning Institute of Australia, Liveable communities: How the Commonwealth can foster sustainable cities and regions, 2004, Planning Institute of Australia.
2. Western Australian Planning Commission, Liveable neighbourboods: A Western Australian Government sustainable cities initiative, 2007: Perth, Western Australia.
3. Department of Infrastructure and Transport, Our cities, our future: A national urban policy for a productive, liveable and sustainable future, 2011, Department of Infrastructure and Transport, Commonwealth of Australia: Canberra.
4. Victorian Competition and Efficiency Commission, A state of liveability: An enquiry into enhancing Victoria’s liveability, Final report, 2008, Victorian Competition and Efficiency Commission: Melbourne, Victoria.
5. West, S. and M. Badham, A strategic framework for creating liveable new communities: Final report, 2008, Victorian Growth Areas Authority: Melbourne, Victoria.
6. Outer Suburban/Interface Services and Development Committee, Inquiry into liveability options in outer suburban Melbourne, 2012, Parliament of Victoria: Melbourne, Victoria.
7. Economist Intelligence Unit, Liveability ranking report, 2011, Economist Intelligence Unit: London.
8. Economist Intelligence Unit, A summary of the liveabilility ranking and overview, 2012, Economist Intelligence Unit: London.
9. Capon, A., The way we live in our cities. Medical Journal of Australia, 2007. 187(11/12): p. 658 - 661.
10. Dodson, J. and N. Sipe, Unsettling suburbia: The new landscape of oil and morgage vulnerability in Australian cities, Urban Research Program, Research Paper No. 17, 2008, Griffith University: Brisbane, Queensland.
11. Thompson, S. and T. Gallico, Are metropolitan planning frameworks healthy? The broader context, in State of Australian Cities conference 2005, Griffith University: Brisbane, Queensland.
12. Legislative Council Environment and Planning References Committee, Inquiry into environmental design and public health in Victoria, 2012, Department of the Legislative Council, Parliament of Victoria: Melbourne, Victoria.
13. The Healthy Built Environments Program, Healthy built envrionments: A review of the literature. Fact sheets, 2012, The Healthy Built Environments Program, Cities Futures Research Centre, The University of New South Wales: Sydney, NSW.
14. Kent, J., S. Thompson, and A. Capon, Healthy planning, in Planning Australia: An overview of urban and reginal planning, S. Thompson and P. Maginn, Editors. 2012, Cambridge University Press: Port Melbourne, Victoria.
15. Mercer. Mercer 2011 quality of living survey highlights – defining ‘quality of living’. 2011 [cited 2011 2 December]; Available from: http://www.mercer.com/articles/quality-of-living-definition-1436405.
16. Money Magazine. Best places to live: Compare cities. 2011 [cited 2011 24 November ]; Available from: http://apps.money.cnn.com/bestplaces_2011/compare_tool_2011.jsp?id=PL0846355,&view=f.
17. Findlay, A., A. Morris, and R. Rogerson, Where to live in Britain in 1988: Quality of life in British cities. Cities, 1988. 5(3): p. 268-276.
18. Vinson, T., Dropping off the edge: The distribution of disadvantage in Australia, 2007, Jesuit Social Services and Catholic Social Services Australia.
19. Biddulph, M., Evaluating the English Home Zone initiatives. Journal of the American Planning Association, 2010. 76(2): p. 199-218.
20. Cochise County, Cochise Community Foundation, and Cochise College Center for Economic Research. Cochise County - quality of life index. 2011 [cited 2011 4 November]; Available from: http://www.cochise.az.gov/QOLWebSite/index.htm.
21. Community Indicators Victoria. Data framework. 2013 [cited 2013 14 February]; Available from: http://www.communityindicators.net.au/data_framework.
22. NSW Department of Health, Healthy urban development checklist, 2009, NSW Department of Health: Sydney.
23. San Francisco Department of Public Health, Healthy development measurement tool development checklist, Version 3.02, 2010, San Francisco Department of Public Health: San Francisco, California.
24. de Chazal, J., A systems approach to livability and sustainability: Defining terms and mapping relationships to link desires with ecological opportunities and constraints. Systems Research and Behavioral Science, 2010. 27(5): p. 585-597.
55
25. Hankins, K.B. and E.M. Powers, The disappearance of the state from ‘livable’ urban spaces. Antipode, 2009. 41(5): p. 845-866.
26. Pacione, M., Urban liveability: A review. Urban Geography, 1990. 11(1): p. 1-30.
27. Association of Town Centre Management. Town health check: How healthy is your town? 2011 [cited 2011 3 November ]; Available from: http://www.atcm.org/tools/town-centre-healthcheck.php.
28. Design for Health, Health impact assessment: Threshold analysis workbook, 2008, Design for Health, University of Minnesota.
29. Litman, T. and D. Burwell, Issues in sustainable transportation. International Journal of Global Environmental Issues, 2006. 6(4): p. 331-347.
30. Honey-Ray, L. and C. Enns, Child and youth friendly Abbotsford: Community strategy, 2009, City of Abbotsford and Union of British Columbia Municipalities: Abbotsford, Canada.
31. World Health Organization, Global age-friendly cities: A guide, 2007, World Health Organization: Geneva.
32. World Health Organization, Checklist of essential features of age-friendly cities, 2007, World Health Organization: Geneva.
33. Bracken, I., Urban planning methods 1981, Oxford, UK: Routledge.
34. Balsas, C., Measuring the livability of an urban centre: An exploratory study of key performance indicators. Planning Practice & Research, 2004. 19(1): p. 101-110.
35. van Kamp, I., et al., Urban environmental quality and human well-being. Towards a conceptual framework and demarcation of concepts; a literature study. Landscape and Urban Planning, 2003. 65: p. 5-18.
36. Greenwood, T., Bridging the divide between community indicators and government performance measurement. National Civic Review, 2008. Spring: p. 55-59.
37. Cox, D., et al., Developing and using local community wellbeing indicators: Learning from the experience of Community Indicators Victoria. Australian Journal of Social Issues, 2010. 45(1): p. 71-88.
38. van Dorst, M., Sustainable liveability: Privacy zoning as a physical condition for social sustainability, in Environment, health, and sustainable development, A. Abdel-Hadi, M. Tolba, and S. Soliman, Editors. 2010, Hogrefe Publishing: Cambridge, MA. p. 111-125.
39. Wheeler, S., Planning sustainable and livable cities, in The city reader, R. LeGates and F. Stout, Editors. 2003, Routledge: London and New York.
40. Knox, P.L. and H. Mayer, Small town sustainability: Economic, social, and environmental innovation 2009, Basel: Birkhauser.
41. Commission on Social Determinants of Health, Closing the gap in a generation: health equity through action on the social determinants of health. Final Report of the Commission on Social Determinants of Health, 2008, World Health Organisation: Geneva.
42. Rydin, Y., et al., Shaping cities for health: Complexity and the planning of urban environments in the 21st century. The Lancet, 2012. 379(9831): p. 2079-2108.
43. World Health Organization. Social determinants of health: Key concepts. 2012 [cited 2012 27 July]; Available from: http://www.who.int/social_determinants/thecommission/finalreport/key_concepts/en/index.html.
44. Dahlgren, G. and M. Whitehead, Policies and strategies to promote social equity in health: Background document to WHO - strategy paper for Europe, 1991, Institute for Futures Studies: Stockholm.
45. Barton, H. and M. Grant, A health map for the local human habitat. Journal of the Royal Society for the Promotion of Health, 2006. 126(6): p. 252 - 253.
46. Macintyre, S. and A. Ellaway, Neighborhoods and health: An overview, in Neighbourhoods and health, I. Kawachi and L. Berkman, Editors. 2003, Oxford University Press: Oxford, UK. p. 20 - 42.
47. Williams, C. and A. Millington, The diverse and costested meanings of sustainable development. The Geographical Journal, 2004. 170(2): p. 99-104.
48. Drexhage, J. and D. Murphy, Sustainable development: From Brundtland to Rio 2012, 2010, United Nations: New York.
49. World Commission on Environment and Development, Our common future: Report for the World Commission on Environment and Development, 1987, Oxford University Press: Oxford.
50. Bijl, R., Never waste a good crisis: Towards social sustainable development. Social Indicators Research, 2011. 102(1): p. 157-168.
51. Duijvestein, K., Van duurzame ontwikkeling naar duurzaam bouwen en weer terug. Huisvestingseconomie, 2002. 21(3): p. 15-21.
56
52. Newman, P., Sustainability and cities: Extending the metabolism model. Landscape and Urban Planning, 1999. 44(4): p. 219-226.
53. Boyer, R. and D. Savageau, Place related almanac: Your guide to finding the best places to live in America 1989, New York: Prentice Hall.
54. National Trust for Historic Preservation, National main street trends survey, 2003, National Trust for Historic Preservation: Washington, D.C.
55. Barton, H. and M. Grant, Sustainability and health appraisal of policy: The spectrum approach, 2006, WHO Collaborating Centre for Healthy Cities and Urban Policy, University of the West of England: Bristol.
56. Newman, P., The environmental impact of cities. Environment and Urbanization, 2006. 18(2): p. 275-295.
57. Bjorklid, P., Child-friendly cities - sustainable cities?: A child-centred perspective and the child’s perspective, in Environment, health, and sustainable development, A. Abdel-Hadi, M. Tolba, and S. Soliman, Editors. 2010, Hogrefe Publishing: Cambridge, MA. p. 73-86.
58. Cicerchia, A., Measures of optimal centrality: Indicators of city effect and urban overloading. Social Indicators Research, 1999. 46(3): p. 273.
59. Cox, J., M. Thurstain-Goodwin, and C. Tomalin, Town centre vitality & viability: A review of the health check methodology, pilot study, 2000, Centre for Advanced Spatial Analysis, Univerity College London: London.
60. Cozens, P. and D. Hillier, Secured by design - common sense, but not common practice. Town and Country Planning, 2003. 72(6): p. 187-189.
61. Design for Health, Health impact assessment, level 1: Preliminary checklist, Version 2.1, 2007, Design for Health.
62. Design for Health, Rapid health impact assessment toolkit, Version 3.0, 2008, Design for Health, University of Minnesota.
63. Doi, K., M. Kii, and H. Nakanishi, An integrated evaluation method of accessibility, quality of life, and social interaction. Environment & Planning B: Planning & Design, 2008. 35(6): p. 1098-1116.
64. Green Building Council of Australia, Green star communities, Summary of draft pilot credits, 2011, Green Building Council of Australia.
65. Hashimoto, A. and M. Kodama, Has livability of Japan gotten better for 1956-1990?: A DEA approach. Social Indicators Research, 1997. 40(3): p. 359-373.
66. Henderson-Wilson, C., Sustainable high-rise developments: Factors impacting on residents’ health and well-being, in Environment, health, and sustainable development, A. Abdel-Hadi, M. Tolba, and S. Soliman, Editors. 2010, Hogrefe Publishing: Cambridge, MA. p. 59-72.
67. Hogg, S., D. Medway, and J. Harvey, Measuring the effectiveness of town centre management. Town and Country Planning, 2000. 69(4): p. 117-119.
68. Howley, P., M. Scott, and D. Redmond, Sustainability versus liveability: An investigation of neighbourhood satisfaction. Journal of Environmental Planning and Management, 2009. 52(6): p. 847-864.
69. Kleinhans, R., Does social capital affect residents’ propensity to move from restructured neighbourhoods? Housing Studies, 2009. 24(5): p. 629-651.
70. Miles, R., Neighborhood disorder and smoking: Findings of a European urban survey. Social Science & Medicine, 2006. 63(9): p. 2464-2475.
71. Pacione, M., Urban liveability, in Urban geography: A global perspective 2009, Routledge: Abingdon, UK.
72. Parkes, A., A. Kearns, and R. Atkinson, What makes people dissatisfied with their neighbourhoods? Urban Studies, 2002. 39(13): p. 2413-2438.
73. Partners for Livable Communities, A blueprint for action: Developing a livable community for all ages, 2007, Partners for Livable Communities and National Association of Area Agencies on Ageing: Washington, D.C.
74. Partners for Livable Communities, Community empowerment manual, 2011, Partners for Livable Communities: Washington D.C.
75. Southworth, M., Measuring the liveable city. Built Environment, 2003. 29(4): p. 343-354.
76. Tyler, N., Evaluating the health of downtowns: A study of Michigan small cities, 1998, Centre for Community Economic Development, University of Wisconsin - Cooperative Extension: Madison, Wisconsin.
77. van Gent, W., S. Musterd, and W. Ostendorf, Bridging the social divide? Reflections on current Dutch neighbourhood policy. Journal of Housing and the Built Environment, 2009. 24(3): p. 357-368.
78. Walton, D., S.J. Murray, and J.A. Thomas, Relationships between population density and the perceived quality of neighbourhood. Social Indicators Research, 2008. 89(3): p. 405-420.
79. Australian Bureau of Statistics, Crime and safety, Australia, 2005, Australian Bureau of Statistics: Canberra.
57
80. Baker, D.A. and R.J. Palmer, Examining the effects of perceptions of community and recreation participation on quality of life. Social Indicators Research, 2006. 75(3): p. 395-418.
81. Field, K., Measuring the need for primary health care: An index of relative disadvantage. Applied Geography, 2000. 20(4): p. 305-332.
82. Stimson, R., et al. Deriving spatial metropolitan wide patterns of quality of life dimensions from survey data: The case of the Brisbane-South East Queensland region. in Proceedings of the 46th Congress of the European Regional Science Association. 2006. Volos, Greece.
83. Daniel, E., et al., 2005 Environmental Sustainability Index: Benchmarking national environmental stewardship, 2005, Yale Center for Environmental Law & Policy: New Haven, Connecticut.
84. Li, F.Z., et al., Built environment, adiposity, and physical activity in adults aged 50-75. American Journal of Preventive Medicine, 2008. 35(1): p. 38-46.
85. Porta, S. and J. Renne, Linking urban design to sustainability: Formal indicators of social urban sustainability field research in Perth, Western Australia. Urban Design International, 2005. 10(1): p. 51-64.
86. Florida, R., The rise of the creative class 2002, New York: Basic Books.
87. Foreign Policy Magazine. Global Cities Index methodology. 2010 [cited 2011 2 December]; Available from: http://www.foreignpolicy.com/articles/2010/08/18/global_cities_index_methodology.
88. Gill, T., Children and nature: A quasi-systematic review of the empirical evidence, 2011, London Sustainable Development Commission: London.
89. Wilkinson, R. and K. Pickett, The spirit level: Why more equal societies almost always do better 2009, London: Penguin Books.
90. Australian Bureau of Statistics, Census - Household form, 2006, Australian Bureau of Statistics: Canberra.
91. World Health Organization. Urban health: Healthy city checklist. 2011 [cited 2011 30 November]; Available from: http://www.euro.who.int/en/what-we-do/health-topics/environment-and-health/urban-health/activities/healthy-cities/who-european-healthy-cities-network/what-is-a-healthy-city/healthy-city-checklist.
92. Talen, E., Evaluating good urban form in an inner-city neighbourhood: An empirical application. Journal of Architectural & Planning Research, 2005. 22(3): p. 204-228.
93. VicHealth, VicHealth indicators survey 2011: Selected findings, 2012, Victorian Health Promotion Foundation: Melbourne, Victoria.
94. Dekker, K. and G. Bolt, Social cohesion in post-war estates in the Netherlands: Differences between socioeconomic and ethnic groups. Urban Studies, 2005. 42(13): p. 2447-2470.
95. Innes, J. and D. Booher, Indicators for sustainable communities: A strategy building on complexity theory and distributed intelligence. Planning Theory & Practice, 2000. 1(2): p. 173 - 186.
96. Ministerial Advisory Committee for the Metropolitan Planning Strategy, Melbourne, let’s talk about the future, 2012, Department of Planning and Community Development, Victorian Government: Melbourne, Victoria.
97. Cobb, C. and C. Rixford, Lessons learned from the history of social indicators, 1998, Redefining Progress: San Francisco.
98. Lorenc, T., et al., Crime, fear of crime, environment, and mental health and wellbeing: Mapping review of theories and causal pathways. Health & Place, 2012. 18(4): p. 757-765.
99. VicHealth, The health costs of violence: Measuring the burden of disease caused by intimate partner violence. A summary of findings, 2004, VicHealth: Carlton South, Victoria.
100. Wilkinson, R. and M. Marmot, eds. Social determinants of health: The solid facts. 2003, World Health Organisation: Copenhagen, Denmark.
101. Victorian Department of Health, Victorian health priorities framework 2012–2022: Metropolitan health plan, 2011, Department of Health, Victorian Government: Melbourne, Victoria.
102. Planning Institute of Australia, Australian Local Government Association, and National Heart Foundation of Australia, Healthy spaces and places: A national guide to designing places for healthy living - an overview, 2009, Planning Institute of Australia: Kingston, ACT.
103. Sallis, J., R. Millstein, and J. Carlson, Community design for physical activity, in Making healthy places: Designing and building for health, well-being , and sustainability, A. Dannenberg, H. Frumkin, and R. Jackson, Editors. 2011, Island Press: Washington, DC.
104. The Heart Foundation’s National Physical Activity Advisory Committee, Position statement: The built environment and walking, 2009, National Heart Foundation of Australia.

58