live load testing of historic covered timber bridges · live load testing of historic covered...
TRANSCRIPT

Live Load Testing of Historic Covered Timber Bridges
Travis Hosteng, P.E.
Bridge Engineering Center
Iowa State University
ICTB 2013
Las Vegas

Improved Analytical Techniques for Historic Covered Bridges
Acknowledgements:
• ISU: Doug Wood, Dr. Brent Phares, Dr. Terry Wipf, Dr. Dr. Junwon Seo, Dr. Fouad Fanous, Allison Machtemes, Owen Stephes, Justin Dahlberg, Venkata Kollipara
• FPL: Jim Wacker, Doug Rammer
• Numerous City, County, and State employees from Indiana and Vermont who assisted with load testing, provided vehicles and traffic control
Notables

Introduction
Outline
Methodology Cox Ford Bridge Field Testing Test Results Analytical Modeling Load Rating

Introduction
All bridges, including historic covered bridges, open to vehicular traffic are required to be load rated
Currently no established testing or rating procedures for covered timber bridges
Tests repeatedly show: Load tested bridges often perform better than currently assigned ratings

Live load test selected bridges • 3 – Burr Arch (IN), 4 – Queenpost (VT), 4 – Howe (IN)
Collected the following information: Member dimensions Member strains Global/local displacements Material properties (FPL)
Generate analytical model (2D, simplistic) Calibrate model using live load data Apply rating vehicles to calibrated model Develop testing and rating manual for covered
timber bridges
Methodology

3 – Burr Arch (IN)
4 – Queenpost (VT)
4 – Howe (IN)
Collected the following information: Member dimensions
Member strains
Global/local displacements
Material properties (FPL)
Selected Bridges

Cox Ford Covered Bridge
Burr Arch, 1913 (rehab 1975 and 1991)
Parke County, Indiana
Single, simply supported 192 ft (58.5m) span
Posted 5 ton

Field Testing
Static Load
• Truck 1 (~10,500lb), Truck 2 (~19,000lb)
Displacement
• Global
Strain
• Member strains (verticals, diagonals, TC, BC, etc)
Truck 1 Truck 2

Field Testing Cont.
Typical sensor setup: Deflection and Strain

Field Testing Cont.

Field Testing Cont. Static Loading To Collect Deflection & Strain Envelope Data

Field Testing Cont. Static Loading To Collect Deflection & Strain Envelope Data

Field Test Results
Two Key Goals of Collecting Field Data:
1. Quantitatively AND Qualitatively evaluate response of Structure:
Transverse load distribution
Elastic response
End restraint
Truss member response; fixity in member connections
2. Calibrate analytical model

Field Test Results
Midspan Global Displacements

Field Test Results
Strain, Diagonal Truss Member

Analytical Modeling
Model Generation
• STAAD
• Linear elastic approach
• 2-D (one truss)

Analytical Modeling
Initially Pinned-Pinned
Bottom Chord = continuous, beam elements
Top Chord = continuous, beam elements
Diagonal/Verticals = beam elements
Arch = compression elements

Response Parameter – Strain
Compare: FS vs A.SS
• FS - Field strain (measured during live load test)
• A.SS - model strain (strain computed from analytical model)
Percent deviation =F.S−A.S 2
F.S 2
Modify model parameters (dimensions, E, etc.)
Re-evaluate percent deviation until model response correlates with field response
*Result = Calibrated model for load rating*
Model Calibration

Pinned-Pinned revised to Fixed-Fixed
Response bounded by P-P, F-F…as expected
• HOWEVER, rather than modifying end restraint with complex joint fixity parameters (springs), a simpler, more straight forward approach was developed to obtain an accurate model: Fixed supports, pinned member connections, truss
elements for verticals/diagonals/TC, beam element for BC
• Model correlation with field data improved from 40-50% to 75-85%
Model Calibration Cont.

-45
-40
-35
-30
-25
-20
-15
-10
-5
0
5
10
0 20 40 60 80
Mic
ro s
trai
n
Distance of front axle from end of abutment (m)
Analytical bottom
Field top
Field bottom
Analytical top
18
Graphical Calibration:
6 24 30
Top Chords

Graphical Calibration:
-200
-150
-100
-50
0
50
100
150
200
0 20 40 60 80
Mic
ro s
trai
n
Distance of front axle from end of abutment (m)
Analytical bottom
Field top
Field bottom
Analytical top
6 18 24 30 0
Bottom Chords

Graphical Calibration:
-2
0
2
4
6
8
10
12
14
16
18
0 20 40 60 80
Mic
ro s
trai
n
Distance of front axle from end of abutment (m)
Analytical
Field top
Field bottom
6 18 24 30 0
Verticals
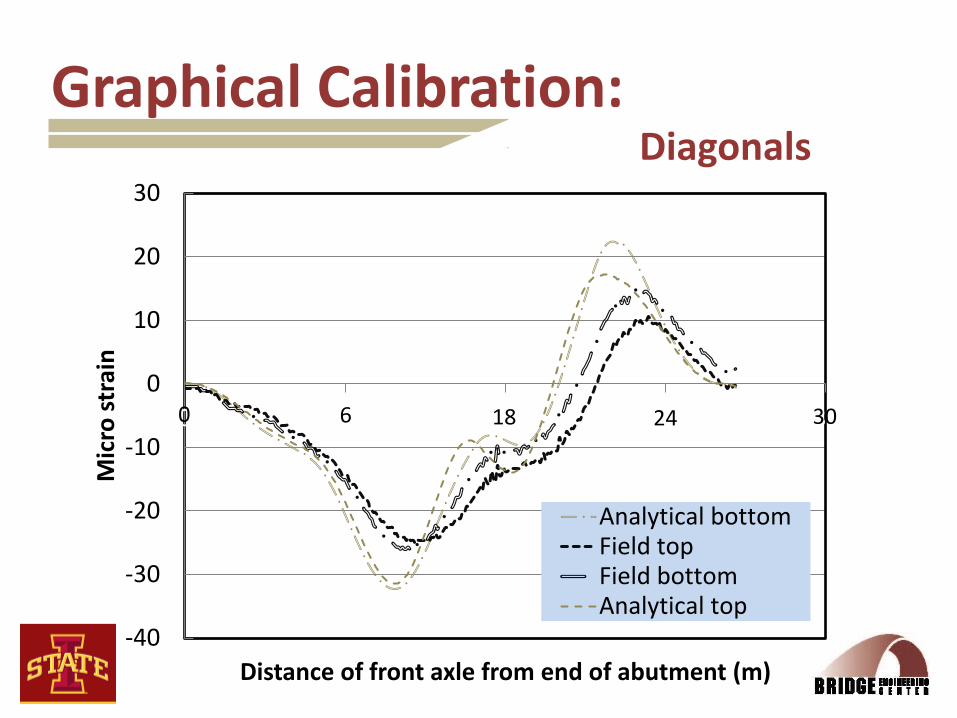
Graphical Calibration:
-40
-30
-20
-10
0
10
20
30
0 20 40 60 80
Mic
ro s
trai
n
Distance of front axle from end of abutment (m)
Analytical bottomField topField bottomAnalytical top
6 18 24 30 0
Diagonals

Load Rating
Create calibrated analytical model
Dead loads
Live loads (AASHTO LRFR Manual)
Impact factor
Calculate member capacities
Perform load rating – input live load vehicle data into model to run simulated rating load on calibrated analytical model

AASHTO LRFD approach to Load Rating • HL-93 (320kN) = HS20 truck plus superimposed lane
load
• 𝑅𝐹 =𝐶−(𝛾𝐷𝐶)(𝐷𝐶)
(𝛾𝐿)(𝐿𝐿+𝐼𝑀)
where: 𝐶 = Capacity;
𝛾𝐷𝐶 = dead-load factor;
DC = dead load;
𝛾𝐿 = live-load factor;
LL = live load;
IM = dynamic load factor
Load Rating Computations:
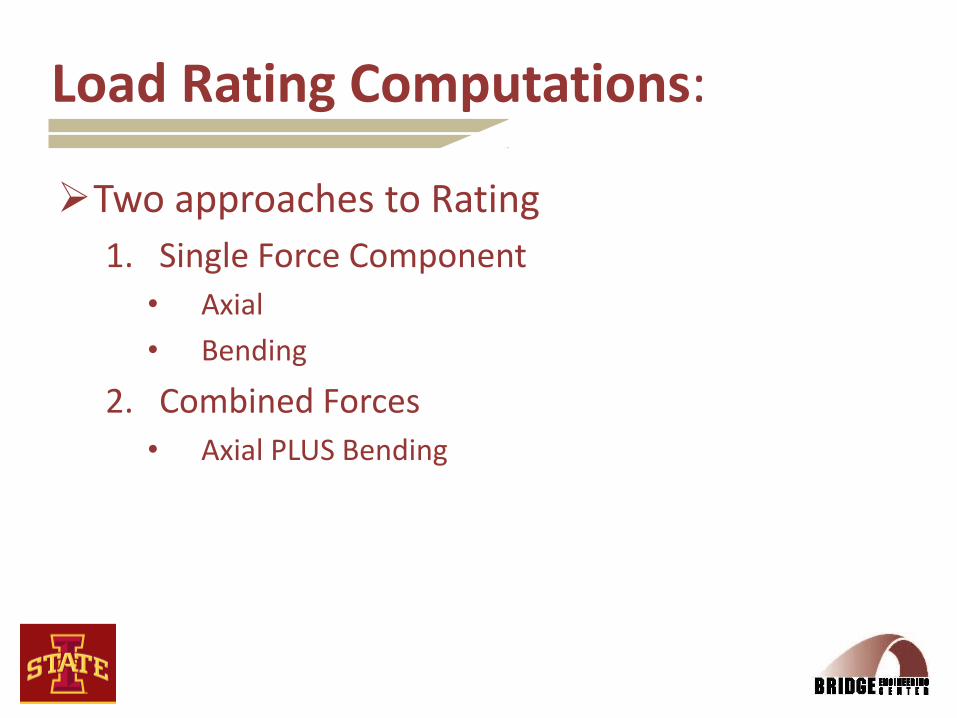
Two approaches to Rating
1. Single Force Component
• Axial
• Bending
2. Combined Forces
• Axial PLUS Bending
Load Rating Computations:

Axial
Calculate member capacity, C
Check lateral buckling (compression)
Calculate unfactored member response to loading, DC & LL
RF =
C− γDC DC − γDW DW ± γp (P)
γL(LL+IM)
Bending
Calculate member moment capacity, C
Calculate unfactored member response to loading, DC & LL
RF =
C− γDC DC − γDW DW ± γp (P)
γL(LL+IM)
Load Rating Computations:
Single Force Component: Axial or Bending

Bottom Chord
Mr - Flexural Bending Capacity
Pr - Axial (tension or compression) Capacity
Mu - Factored Bending Response
Pu - Factored Axial Response
Evaluate Interaction Eq. (IE) for Combined Loading => Load Rating
•Mu
Mr+
Pu
Pr
x≤ 1 x = 1 in tension , 2 in compression
If IE ≤ 1, member capacity ok
If IE > 1, member capacity insufficient
Load Rating Computations:
Combined Forces: Axial PLUS Bending
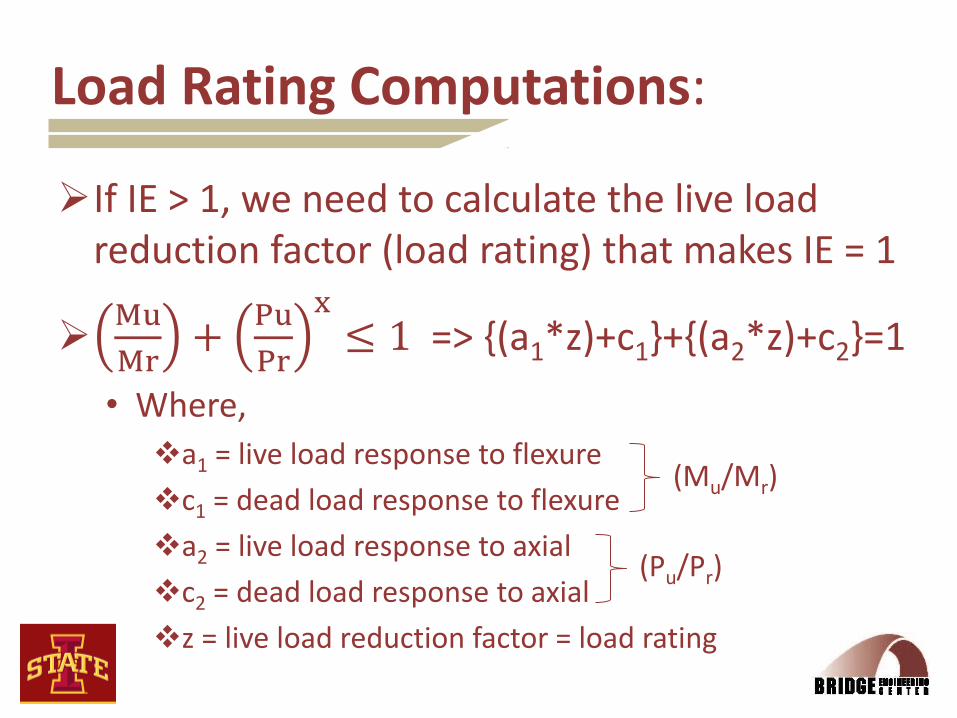
If IE > 1, we need to calculate the live load reduction factor (load rating) that makes IE = 1
Mu
Mr+
Pu
Pr
x≤ 1 => {(a1*z)+c1}+{(a2*z)+c2}=1
• Where,
a1 = live load response to flexure
c1 = dead load response to flexure
a2 = live load response to axial
c2 = dead load response to axial
z = live load reduction factor = load rating
Load Rating Computations:
(Mu/Mr)
(Pu/Pr)

Field testing of Burr Arch, Howe and Queen Post bridges completed
Analytical models calibrated for all 11 bridges
Developed new recommended practices for live load testing, modeling and load rating of historic covered bridges
New engineer’s guide for live load testing, modeling and load rating of historic covered bridges in draft form
Summary

New Zealand Proceedings Paper and Presentation to World Conference on Timber Engineering (completed)
2nd National Conference on Covered Timber Bridges
Final Report and Load Rating Manual (this quarter)
ICTB 2013
Publications

Live load test additional covered bridge types
• 2 more bridge clusters (PA, VT, IN)
King Post
Town Lattice
Truss joint detail investigation
• Bottom chord
Future Work

Thanks for your Attention.
woodcenter.org