little lick creek watershed critical lands analysis with/watershed... · page 2 of 15 figure 1....
TRANSCRIPT
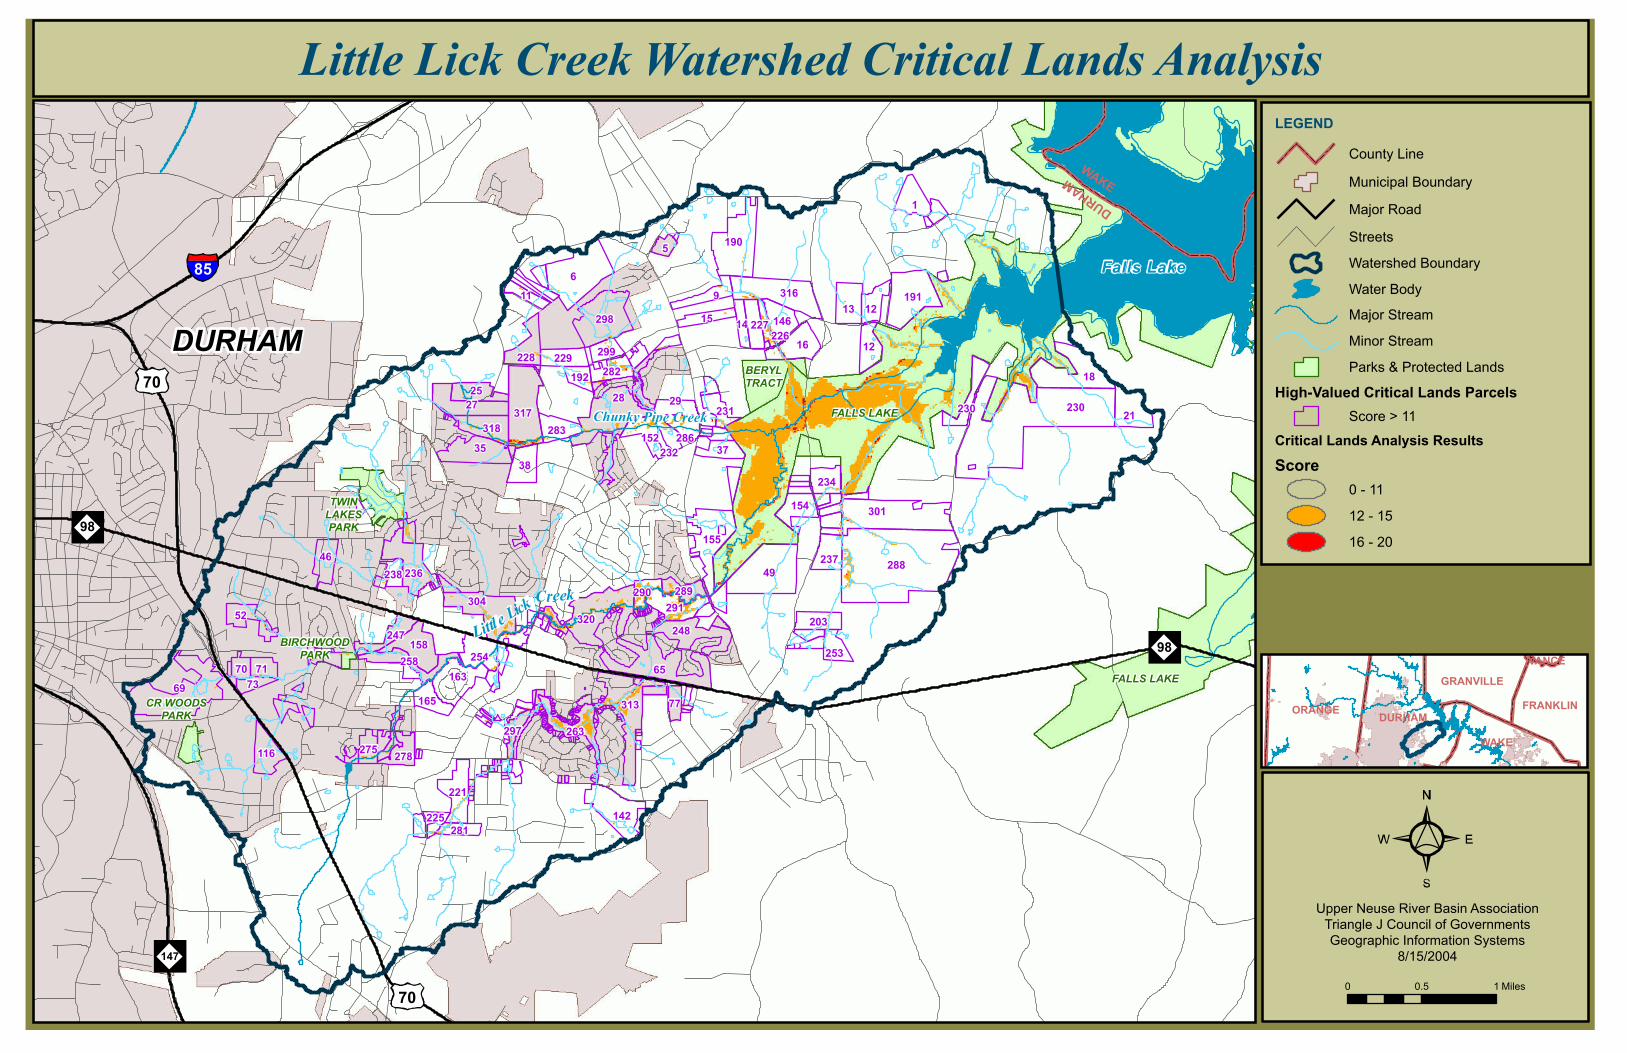
Little Lick Creek Watershed Critical Lands Analysis
DURHAM
DURHAM
WAKE
Falls Lake
98
70
85
70
98
147
Littl e Lick Creek
Chunky Pipe Creek FALLS LAKE
FALLS LAKE
BERYLTRACT
TWINLAKESPARK
CR WOODSPARK
BIRCHWOODPARK
230
288
6
49
65
28
18
301
317
313
190
320
1
298
316
35
191
21
142
236
13
163
248
16
158
38
46
12
318
116
12
228
154
146
37
237
5
229
283
203
234
278
71253
7069
304
155
27
9
221
25
291
263
254258
29
152
52
15
230
282
247
14
165
286
227
11
289
231
7773
275
299
192
290
281
297
232
238
225
226
LEGEND
County Line
Municipal Boundary
Major Road
Streets
Watershed Boundary
Water Body
Major Stream
Minor Stream
Parks & Protected Lands
High-Valued Critical Lands Parcels Score > 11
Critical Lands Analysis Results
Score0 - 11
12 - 15
16 - 20
0 0.5 1 Miles
Upper Neuse River Basin AssociationTriangle J Council of GovernmentsGeographic Information Systems
8/15/2004
ORANGE DURHAM
WAKE
FRANKLIN
GRANVILLE
VANCE
Page 1 of 15
Upper Neuse River Basin Association
Memorandum
To: Deborah Amaral, NC Ecosystem Enhancement Program
From: Chris Dreps, Upper Neuse River Basin Association
Copy: Little Lick Creek Local Watershed Plan Technical Team Members
Date: June 1, 2005
Re: Little Lick Creek Technical Memorandum #2—Suggested approach for critical lands protection analysis
The Little Lick Creek Local Watershed Plan will include a geographic information systems-based analysis of potential land protection areas. The plan seeks to identify lands critical to the protection of vital watershed functions prioritized by the Little Lick Creek Technical Team. Prioritizing lands for protection requires integrating numerous sources of information. In Little Lick Creek, this must be done over a 21 square-mile area with more than 73 stream miles and 9,000 parcels. The GIS provides us with a tool to conduct such integration. This technical memorandum recommends an approach for establishing a GIS analysis based on criteria agreed upon by the Little Lick Creek Technical Team.
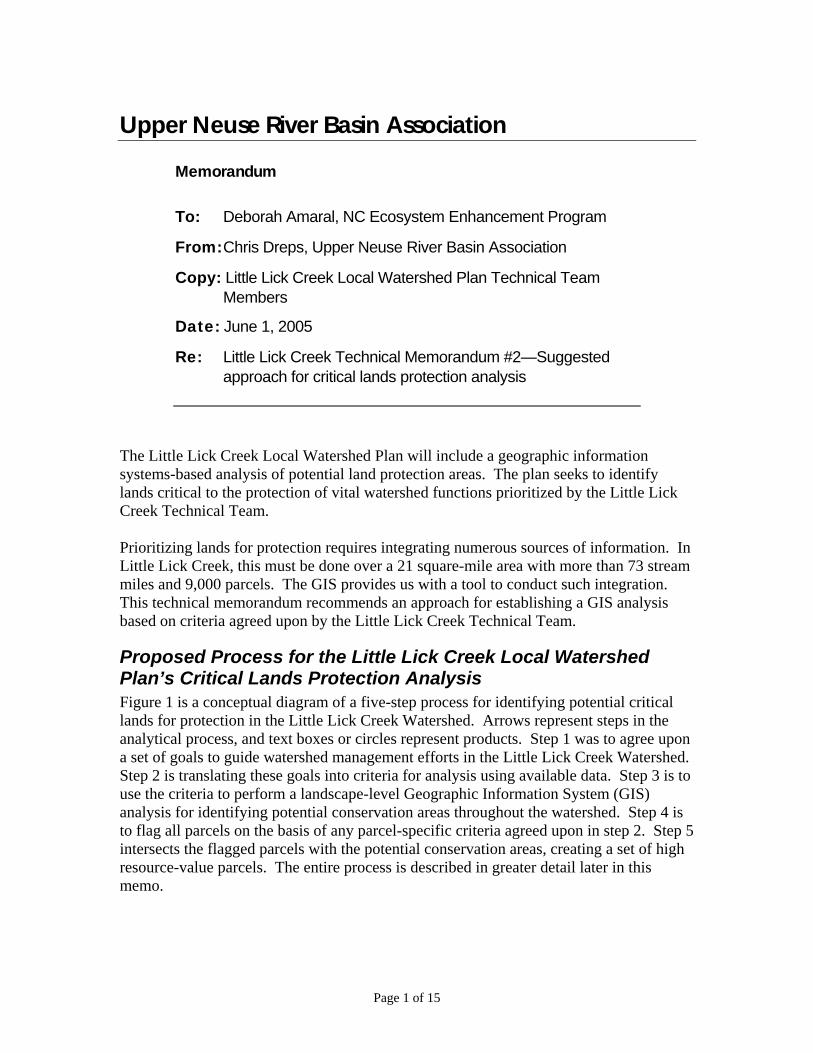
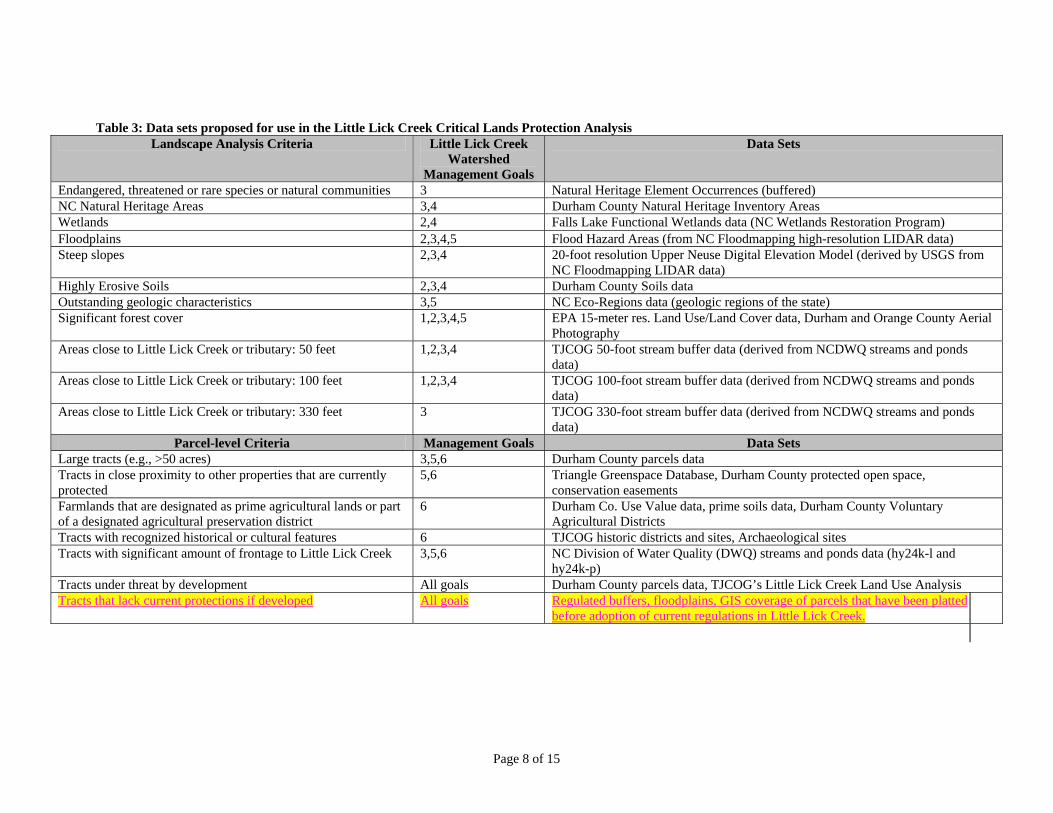
Proposed Process for the Little Lick Creek Local Watershed Plan’s Critical Lands Protection Analysis Figure 1 is a conceptual diagram of a five-step process for identifying potential critical lands for protection in the Little Lick Creek Watershed. Arrows represent steps in the analytical process, and text boxes or circles represent products. Step 1 was to agree upon a set of goals to guide watershed management efforts in the Little Lick Creek Watershed. Step 2 is translating these goals into criteria for analysis using available data. Step 3 is to use the criteria to perform a landscape-level Geographic Information System (GIS) analysis for identifying potential conservation areas throughout the watershed. Step 4 is to flag all parcels on the basis of any parcel-specific criteria agreed upon in step 2. Step 5 intersects the flagged parcels with the potential conservation areas, creating a set of high resource-value parcels. The entire process is described in greater detail later in this memo.
Page 2 of 15
Figure 1. Conceptual diagram of proposed Little Lick Creek critical lands protection analysis The remainder of the memo describes the process illustrated in Figure 1.
Step 1: Set Watershed Planning Goals The Little Lick Creek Technical Team agreed upon several key planning goals at its January 18, 2005 meeting. These goals are listed below.
1. Improve hydrology of the Little Lick Creek Watershed—Little Lick Creek’s natural hydrology is vastly altered from its original state by human development in the watershed and in the stream channel. In recognition that this alteration is the key factor affecting all other water quality and aquatic habitat conditions in the watershed, we should implement management strategies to improve natural hydrology. Strategies should 1) restore hydrologic balance, to the greatest extent practicable, to impacted areas and 2) maintain hydrologic function where it currently exists.
2. Restore and protect aquatic and riparian habitat—in areas where impacts
have occurred, implement projects that will provide measurable improvement to habitat in the stream and riparian system. In areas where good aquatic and riparian habitat exists, protect habitat functions, specifically seeking measures to protect special areas.
3. Improve water quality—implement management strategies that will improve
water quality in the stream system. In the long term, restore Little Lick Creek to a state of non-impairment. This project can help achieve the latter by taking initial
Step 5: Conduct
Final Overlay
Step 3: Perform landscape analysis
Watershed Management
Goals
High resource-value parcels
Flagged parcels
Step 4: Perform parcels-level analysis
Step 2: Establish landscape analysis criteria & prepare data
Step 1: Set goals
Scored hot spots
Data for landscape analysis
Page 3 of 15
monitoring and planning steps in conjunction with the NC Division of Water Quality.
4. Protect water quality and habitat in Falls Lake—Falls Lake is a drinking water
supply for over 300,000 people in the region and an important regional recreation area. The Little Lick Creek Local Watershed Plan seeks to protect these uses through the protection of water quality and habitat in the lake. This can be accomplished through multiple short and long-term management strategies that reduce nutrients, sediments, and toxic pollutants entering the lake from Little Lick Creek.
5. Improve natural conditions for people living in the watershed—Little Lick
Creek is becoming urbanized, and Durham plans to extend the Urban Growth Area through most of the watershed. Search for opportunities to improve human use of managed natural areas and trails, improve aesthetics, and reduce destruction from flooding where these objectives align with the protection of water quality and habitat functions.
6. Foster community stewardship of the watershed—In Little Lick Creek’s
watershed, many diffuse factors may be causing degradation to the watershed. Just as there are many possible causes, the watershed needs many solutions, and these solutions can only be achieved through an active stewardship of the watershed. This project will educate and involve the local community in the creation of the plan, implementation of projects, and long-term stewardship of the watershed.
The goals of the Little Lick Creek Local Watershed Plan focus primarily on protecting and restoring basic functions necessary for the healthy operation of a watershed. Therefore, the resulting lands protection analysis should identify lands that are critical to the protection of these functions. The first three Little Lick Creek watershed planning goals can be described as ecosystem-related goals. These goals focus on protecting functions, such as hydrology, water quality, and aquatic habitat, provided by a watershed ecosystem with relatively low levels of human impact. Table 1 lists the first three goals and some of the major functions that intact riparian areas provide in support of these goals. These functions provide guidance in choosing criteria to guide the GIS critical lands protection analysis. The table is adapted from several sources reviewing the benefits of intact riparian areas (forested areas surrounding streams and wetlands). An example for discussion is the manner in which intact riparian forests can support Little Lick Creek Goal #1 of protecting the watershed’s natural hydrology. When forested areas are developed, the greatest single change to the watershed is the vast increase in surface water runoff. Consider the new Durham County Library East Branch on NC Highway 98. When the forest on this land is cleared and the site developed, the total amount of runoff (inches/year) will increase from two to ten inches a year, even using highly innovative
Page 4 of 15
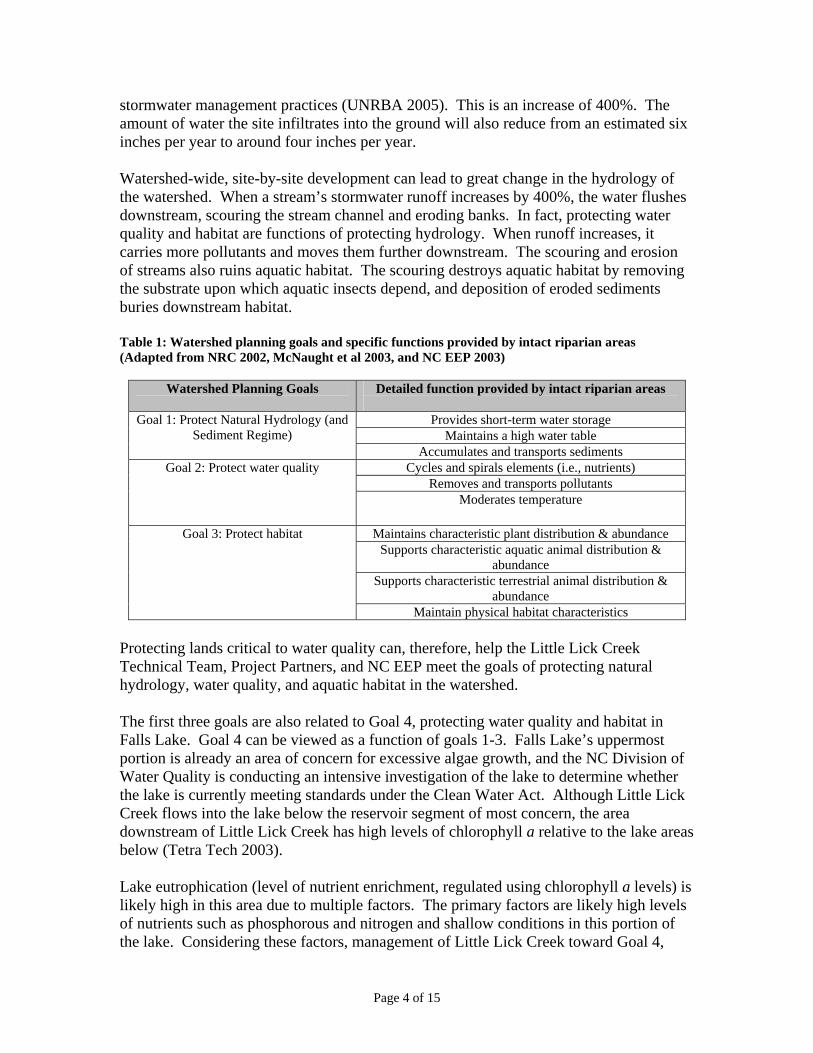
stormwater management practices (UNRBA 2005). This is an increase of 400%. The amount of water the site infiltrates into the ground will also reduce from an estimated six inches per year to around four inches per year. Watershed-wide, site-by-site development can lead to great change in the hydrology of the watershed. When a stream’s stormwater runoff increases by 400%, the water flushes downstream, scouring the stream channel and eroding banks. In fact, protecting water quality and habitat are functions of protecting hydrology. When runoff increases, it carries more pollutants and moves them further downstream. The scouring and erosion of streams also ruins aquatic habitat. The scouring destroys aquatic habitat by removing the substrate upon which aquatic insects depend, and deposition of eroded sediments buries downstream habitat. Table 1: Watershed planning goals and specific functions provided by intact riparian areas (Adapted from NRC 2002, McNaught et al 2003, and NC EEP 2003)
Watershed Planning Goals Detailed function provided by intact riparian areas
Provides short-term water storage Maintains a high water table
Goal 1: Protect Natural Hydrology (and Sediment Regime)
Accumulates and transports sediments Cycles and spirals elements (i.e., nutrients)
Removes and transports pollutants Goal 2: Protect water quality
Moderates temperature
Maintains characteristic plant distribution & abundance Supports characteristic aquatic animal distribution &
abundance Supports characteristic terrestrial animal distribution &
abundance
Goal 3: Protect habitat
Maintain physical habitat characteristics Protecting lands critical to water quality can, therefore, help the Little Lick Creek Technical Team, Project Partners, and NC EEP meet the goals of protecting natural hydrology, water quality, and aquatic habitat in the watershed. The first three goals are also related to Goal 4, protecting water quality and habitat in Falls Lake. Goal 4 can be viewed as a function of goals 1-3. Falls Lake’s uppermost portion is already an area of concern for excessive algae growth, and the NC Division of Water Quality is conducting an intensive investigation of the lake to determine whether the lake is currently meeting standards under the Clean Water Act. Although Little Lick Creek flows into the lake below the reservoir segment of most concern, the area downstream of Little Lick Creek has high levels of chlorophyll a relative to the lake areas below (Tetra Tech 2003). Lake eutrophication (level of nutrient enrichment, regulated using chlorophyll a levels) is likely high in this area due to multiple factors. The primary factors are likely high levels of nutrients such as phosphorous and nitrogen and shallow conditions in this portion of the lake. Considering these factors, management of Little Lick Creek toward Goal 4,
Page 5 of 15
protecting water quality and habitat in Falls Lake, must consider a reduction in the levels of both total phosphorous and total nitrogen entering the lake (Tetra Tech 2003). Tetra Tech’s modeling for the Upper Neuse Plan estimates that Little Lick Creek currently has total phosphorous loading rates (lbs/acre/year) among the top four of the 32 Falls Lake watersheds. In addition, Little Lick Creek’s nitrogen loading rates rank among the top six (Tetra Tech 2002). This means that Little Lick Creek is likely one of the highest contributing watersheds to Falls Lake eutrophication.
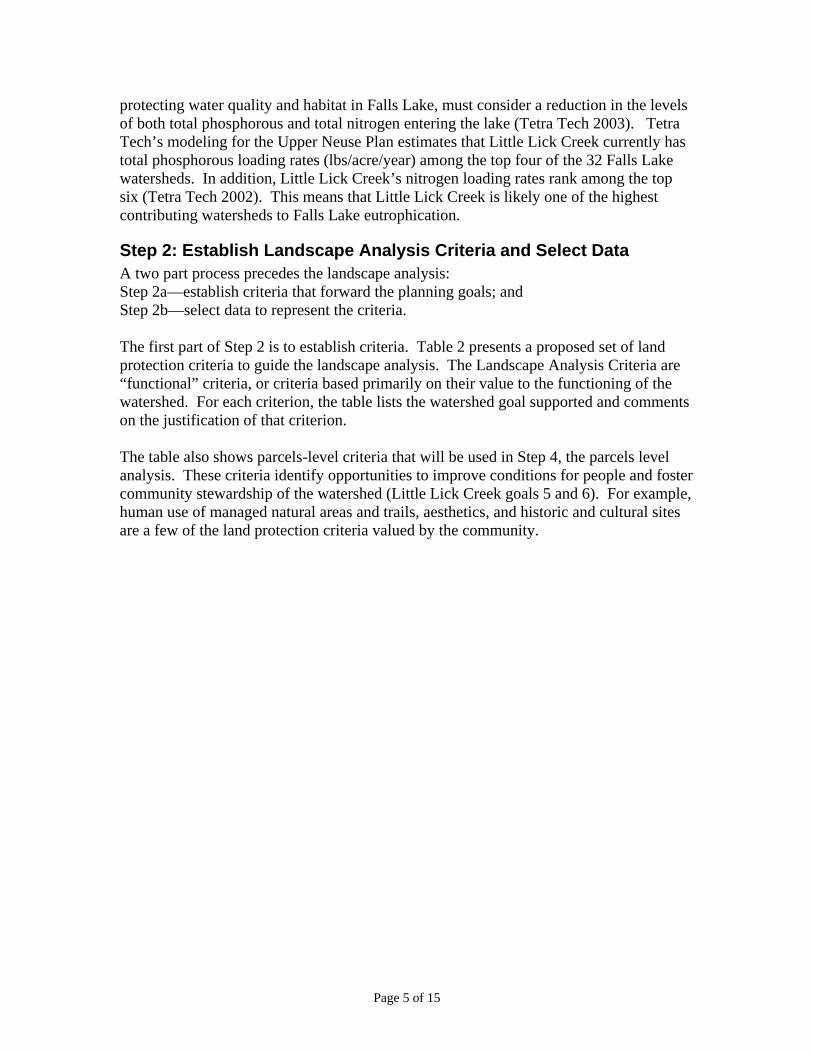
Step 2: Establish Landscape Analysis Criteria and Select Data A two part process precedes the landscape analysis: Step 2a—establish criteria that forward the planning goals; and Step 2b—select data to represent the criteria. The first part of Step 2 is to establish criteria. Table 2 presents a proposed set of land protection criteria to guide the landscape analysis. The Landscape Analysis Criteria are “functional” criteria, or criteria based primarily on their value to the functioning of the watershed. For each criterion, the table lists the watershed goal supported and comments on the justification of that criterion. The table also shows parcels-level criteria that will be used in Step 4, the parcels level analysis. These criteria identify opportunities to improve conditions for people and foster community stewardship of the watershed (Little Lick Creek goals 5 and 6). For example, human use of managed natural areas and trails, aesthetics, and historic and cultural sites are a few of the land protection criteria valued by the community.
Page 6 of 15
Table 2: Criteria and data sets proposed for the Little Lick Creek Critical Lands Protection Analysis
Landscape Analysis Criteria (functional criteria)
Little Lick Creek Watershed
Management Goals
Comments
Endangered, threatened or rare species or natural communities 3 NC Natural Heritage Areas 3,4 Wetlands 2,4 Floodplains 2,3,4,5 All 100-year floodplains Steep slopes near streams or rivers 2,3,4 15% or greater slopes Highly Erosive Soils 2,3,4 Criterion specifically focuses on soil’s k value Outstanding geologic characteristics 3,5 E.g., Diabase sills Significant forest cover 1,2,3,4,5 Further divided by deciduous, pine, or mixed Areas close to Little Lick Creek or tributary: 50 feet 1,2,3,4 Widely identified pollutant removal standard which is the basis for the Neuse nitrogen
removal buffer standard, also referenced in McNaught et al 2003 for habitat protection and sedimentation prevention.
Areas close to Little Lick Creek or tributary: 100 feet 2,3,5 100-foot buffer criteria for the protection of in-stream habitat (McNaught et al 2003) Areas close to Little Lick Creek or tributary: 330 feet 3 330 foot buffer for the protection of riparian habitat (McNaught et al 2003 and Keller et al
1993) Parcel-level Criteria Management Goals Comments
Large tracts (e.g., >50 acres) 3,5,6 Further divided by range of sizes Tracts in close proximity to other properties that are currently protected
5,6
Farmlands that are designated as prime agricultural lands or part of a designated agricultural preservation district
6
Tracts with recognized historical or cultural features 6 Tracts with significant amount of frontage to Little Lick Creek 3,5,6 Over ¼-mile Tracts under threat by development Short-term development threat (e.g. next 10 years) can be analyzed using existing
data. Tracts that lack current protections if developed Previously platted lots in the regulated buffer or floodplain. These lots may be
“grandfathered” from having to meet current protection standards. Goals: 1. Improve watershed hydrology; 2. Improve water quality; 3. Restore/Protect Aquatic and Riparian Habitat; 4. Protect water quality and habitat in Falls Lake; 5. Improve natural conditions for people living in watershed; 6. Foster community stewardship.

Page 7 of 15
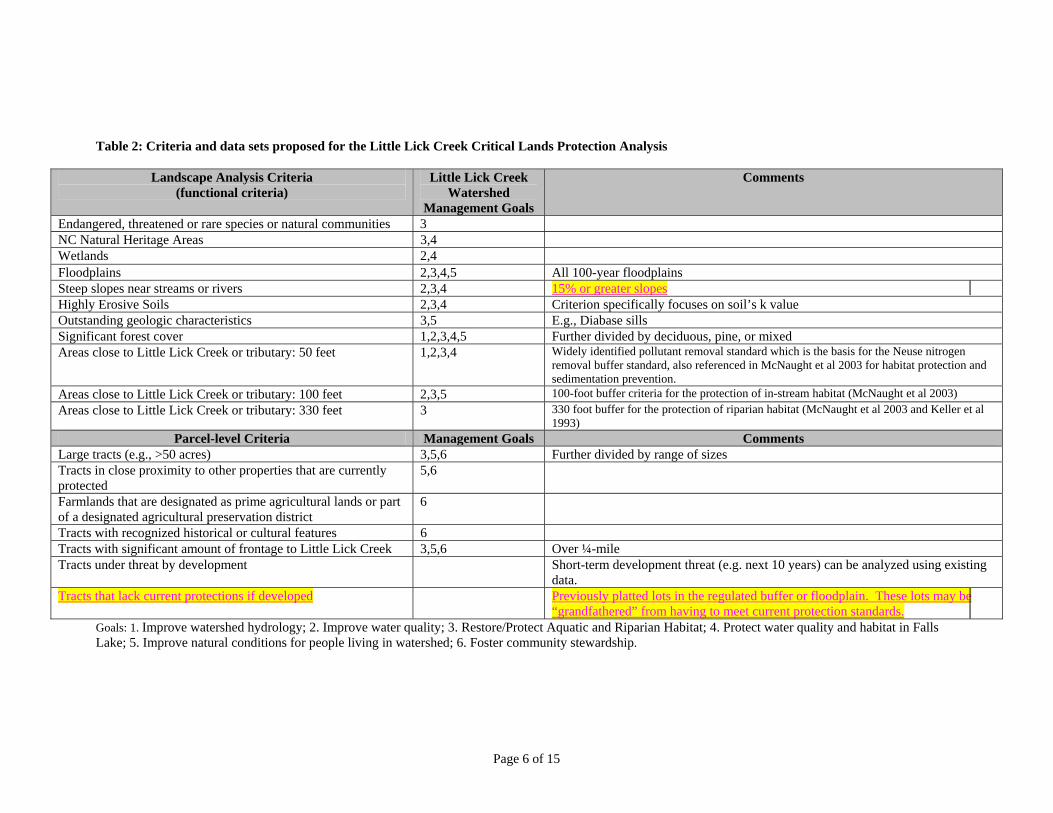
In order to perform the GIS analysis, we must first translate the functional criteria into a GIS analysis. Table 3 lists the criteria, priority level, and data sets that the UNRBA and TJCOG propose in order to operationalize the criteria for the landscape and parcels-level analyses. The landscape analysis will overlay all criteria, and any given point in the watershed will receive a weighting based on the presence or absence of the criteria. For example, a given point within 50 feet of a tributary, in a floodplain, on an outcropping of diabase geology, and under deciduous forest cover will receive a cumulative weighting based on the presence of these 4 criteria.
Page 8 of 15
Table 3: Data sets proposed for use in the Little Lick Creek Critical Lands Protection Analysis Landscape Analysis Criteria Little Lick Creek
Watershed Management Goals
Data Sets
Endangered, threatened or rare species or natural communities 3 Natural Heritage Element Occurrences (buffered) NC Natural Heritage Areas 3,4 Durham County Natural Heritage Inventory Areas Wetlands 2,4 Falls Lake Functional Wetlands data (NC Wetlands Restoration Program) Floodplains 2,3,4,5 Flood Hazard Areas (from NC Floodmapping high-resolution LIDAR data) Steep slopes 2,3,4 20-foot resolution Upper Neuse Digital Elevation Model (derived by USGS from
NC Floodmapping LIDAR data) Highly Erosive Soils 2,3,4 Durham County Soils data Outstanding geologic characteristics 3,5 NC Eco-Regions data (geologic regions of the state) Significant forest cover 1,2,3,4,5 EPA 15-meter res. Land Use/Land Cover data, Durham and Orange County Aerial
Photography Areas close to Little Lick Creek or tributary: 50 feet 1,2,3,4 TJCOG 50-foot stream buffer data (derived from NCDWQ streams and ponds
data) Areas close to Little Lick Creek or tributary: 100 feet 1,2,3,4 TJCOG 100-foot stream buffer data (derived from NCDWQ streams and ponds
data) Areas close to Little Lick Creek or tributary: 330 feet 3 TJCOG 330-foot stream buffer data (derived from NCDWQ streams and ponds
data) Parcel-level Criteria Management Goals Data Sets
Large tracts (e.g., >50 acres) 3,5,6 Durham County parcels data Tracts in close proximity to other properties that are currently protected
5,6 Triangle Greenspace Database, Durham County protected open space, conservation easements
Farmlands that are designated as prime agricultural lands or part of a designated agricultural preservation district
6 Durham Co. Use Value data, prime soils data, Durham County Voluntary Agricultural Districts
Tracts with recognized historical or cultural features 6 TJCOG historic districts and sites, Archaeological sites Tracts with significant amount of frontage to Little Lick Creek 3,5,6 NC Division of Water Quality (DWQ) streams and ponds data (hy24k-l and
hy24k-p) Tracts under threat by development All goals Durham County parcels data, TJCOG’s Little Lick Creek Land Use Analysis Tracts that lack current protections if developed All goals Regulated buffers, floodplains, GIS coverage of parcels that have been platted
before adoption of current regulations in Little Lick Creek.
Page 9 of 15
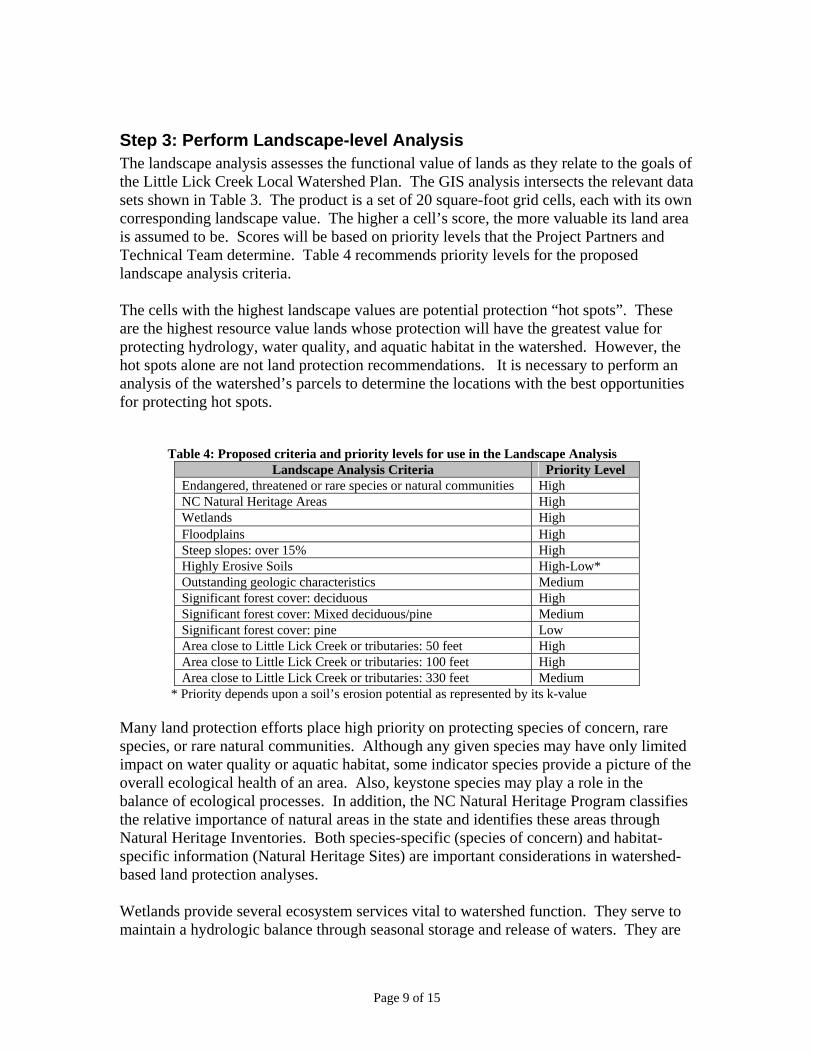
Step 3: Perform Landscape-level Analysis The landscape analysis assesses the functional value of lands as they relate to the goals of the Little Lick Creek Local Watershed Plan. The GIS analysis intersects the relevant data sets shown in Table 3. The product is a set of 20 square-foot grid cells, each with its own corresponding landscape value. The higher a cell’s score, the more valuable its land area is assumed to be. Scores will be based on priority levels that the Project Partners and Technical Team determine. Table 4 recommends priority levels for the proposed landscape analysis criteria. The cells with the highest landscape values are potential protection “hot spots”. These are the highest resource value lands whose protection will have the greatest value for protecting hydrology, water quality, and aquatic habitat in the watershed. However, the hot spots alone are not land protection recommendations. It is necessary to perform an analysis of the watershed’s parcels to determine the locations with the best opportunities for protecting hot spots.
Table 4: Proposed criteria and priority levels for use in the Landscape Analysis Landscape Analysis Criteria Priority Level
Endangered, threatened or rare species or natural communities High NC Natural Heritage Areas High Wetlands High Floodplains High Steep slopes: over 15% High Highly Erosive Soils High-Low* Outstanding geologic characteristics Medium Significant forest cover: deciduous High Significant forest cover: Mixed deciduous/pine Medium Significant forest cover: pine Low Area close to Little Lick Creek or tributaries: 50 feet High Area close to Little Lick Creek or tributaries: 100 feet High Area close to Little Lick Creek or tributaries: 330 feet Medium
* Priority depends upon a soil’s erosion potential as represented by its k-value Many land protection efforts place high priority on protecting species of concern, rare species, or rare natural communities. Although any given species may have only limited impact on water quality or aquatic habitat, some indicator species provide a picture of the overall ecological health of an area. Also, keystone species may play a role in the balance of ecological processes. In addition, the NC Natural Heritage Program classifies the relative importance of natural areas in the state and identifies these areas through Natural Heritage Inventories. Both species-specific (species of concern) and habitat-specific information (Natural Heritage Sites) are important considerations in watershed-based land protection analyses. Wetlands provide several ecosystem services vital to watershed function. They serve to maintain a hydrologic balance through seasonal storage and release of waters. They are
Page 10 of 15
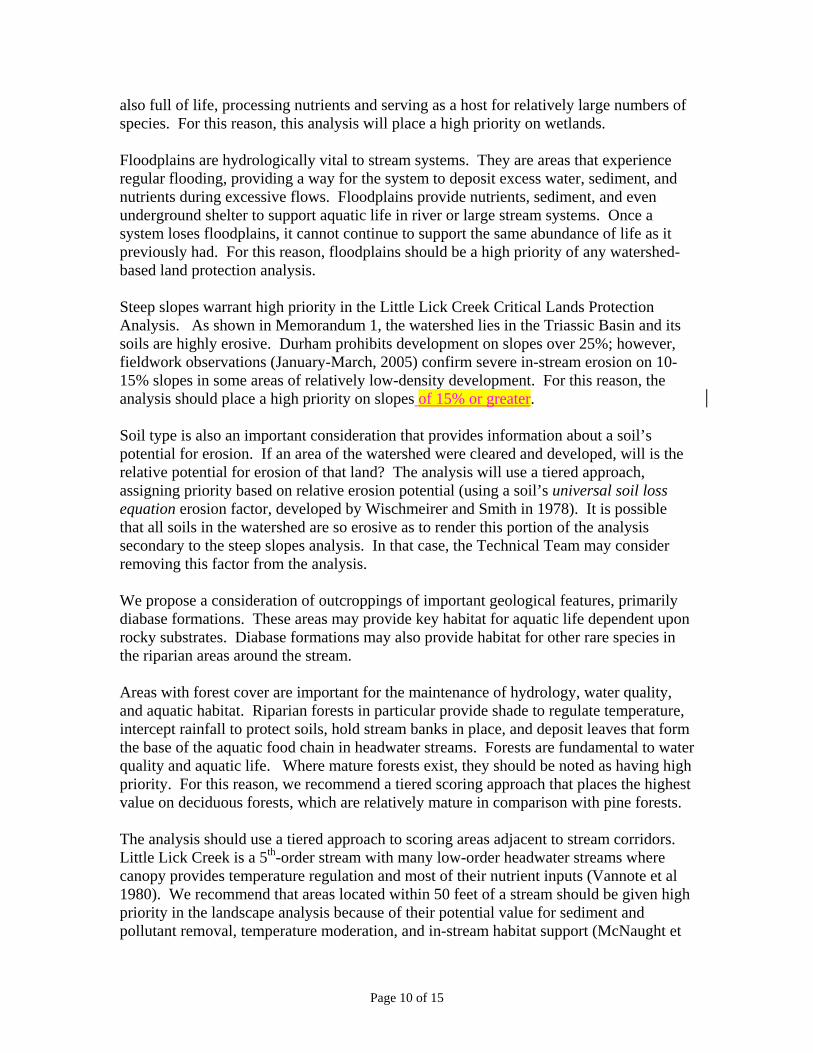
also full of life, processing nutrients and serving as a host for relatively large numbers of species. For this reason, this analysis will place a high priority on wetlands. Floodplains are hydrologically vital to stream systems. They are areas that experience regular flooding, providing a way for the system to deposit excess water, sediment, and nutrients during excessive flows. Floodplains provide nutrients, sediment, and even underground shelter to support aquatic life in river or large stream systems. Once a system loses floodplains, it cannot continue to support the same abundance of life as it previously had. For this reason, floodplains should be a high priority of any watershed-based land protection analysis. Steep slopes warrant high priority in the Little Lick Creek Critical Lands Protection Analysis. As shown in Memorandum 1, the watershed lies in the Triassic Basin and its soils are highly erosive. Durham prohibits development on slopes over 25%; however, fieldwork observations (January-March, 2005) confirm severe in-stream erosion on 10-15% slopes in some areas of relatively low-density development. For this reason, the analysis should place a high priority on slopes of 15% or greater. Soil type is also an important consideration that provides information about a soil’s potential for erosion. If an area of the watershed were cleared and developed, will is the relative potential for erosion of that land? The analysis will use a tiered approach, assigning priority based on relative erosion potential (using a soil’s universal soil loss equation erosion factor, developed by Wischmeirer and Smith in 1978). It is possible that all soils in the watershed are so erosive as to render this portion of the analysis secondary to the steep slopes analysis. In that case, the Technical Team may consider removing this factor from the analysis. We propose a consideration of outcroppings of important geological features, primarily diabase formations. These areas may provide key habitat for aquatic life dependent upon rocky substrates. Diabase formations may also provide habitat for other rare species in the riparian areas around the stream. Areas with forest cover are important for the maintenance of hydrology, water quality, and aquatic habitat. Riparian forests in particular provide shade to regulate temperature, intercept rainfall to protect soils, hold stream banks in place, and deposit leaves that form the base of the aquatic food chain in headwater streams. Forests are fundamental to water quality and aquatic life. Where mature forests exist, they should be noted as having high priority. For this reason, we recommend a tiered scoring approach that places the highest value on deciduous forests, which are relatively mature in comparison with pine forests. The analysis should use a tiered approach to scoring areas adjacent to stream corridors. Little Lick Creek is a 5th-order stream with many low-order headwater streams where canopy provides temperature regulation and most of their nutrient inputs (Vannote et al 1980). We recommend that areas located within 50 feet of a stream should be given high priority in the landscape analysis because of their potential value for sediment and pollutant removal, temperature moderation, and in-stream habitat support (McNaught et
Page 11 of 15
al 2003). Although these areas are protected by state law (15A NCAC 2B .0233, also known as the Neuse Buffer Rule), their value should be noted in the analysis, which identifies landscape value apart from legal considerations. We also recommend placing high priority on areas within 100 feet of the stream because riparian buffer research has shown that this distance is the minimum required for protection of in-stream habitat (McNaught et al 2003, NC Wildlife Resources Commission 2002). In addition, areas located within 330 feet of the stream should be given priority because of their value for protecting the stream bank and providing important wildlife corridors (McNaught et al 2003).
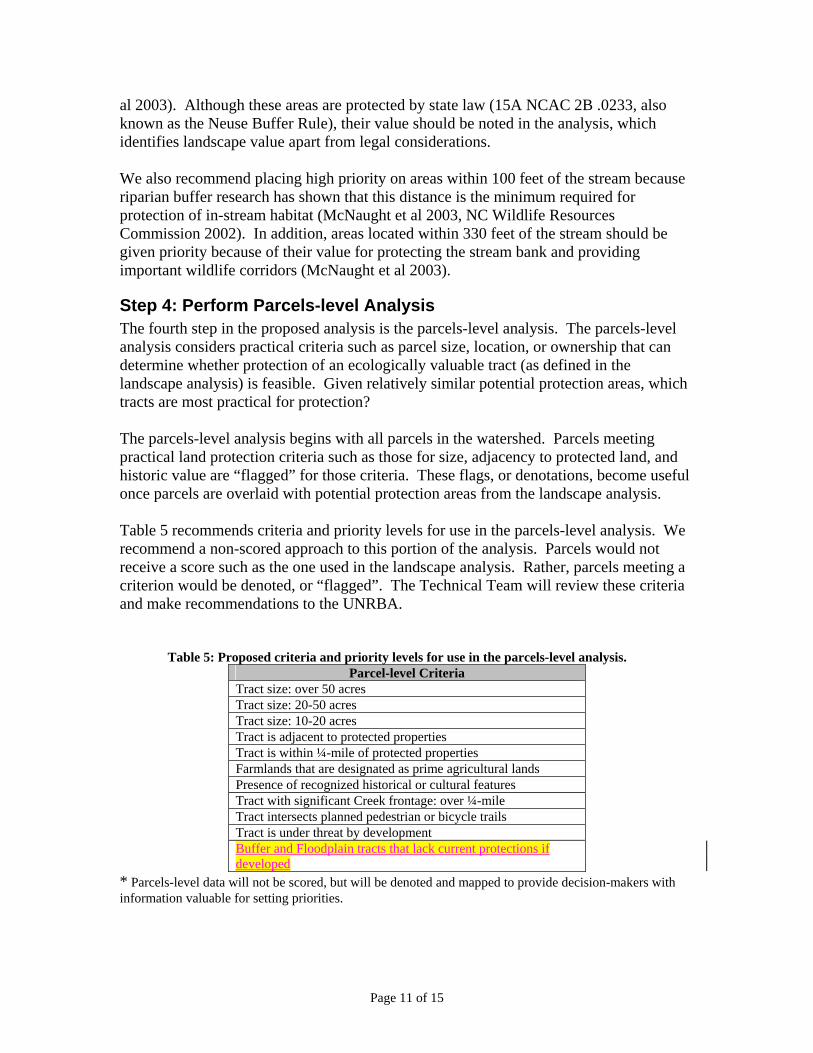
Step 4: Perform Parcels-level Analysis The fourth step in the proposed analysis is the parcels-level analysis. The parcels-level analysis considers practical criteria such as parcel size, location, or ownership that can determine whether protection of an ecologically valuable tract (as defined in the landscape analysis) is feasible. Given relatively similar potential protection areas, which tracts are most practical for protection? The parcels-level analysis begins with all parcels in the watershed. Parcels meeting practical land protection criteria such as those for size, adjacency to protected land, and historic value are “flagged” for those criteria. These flags, or denotations, become useful once parcels are overlaid with potential protection areas from the landscape analysis. Table 5 recommends criteria and priority levels for use in the parcels-level analysis. We recommend a non-scored approach to this portion of the analysis. Parcels would not receive a score such as the one used in the landscape analysis. Rather, parcels meeting a criterion would be denoted, or “flagged”. The Technical Team will review these criteria and make recommendations to the UNRBA.
Table 5: Proposed criteria and priority levels for use in the parcels-level analysis. Parcel-level Criteria
Tract size: over 50 acres Tract size: 20-50 acres Tract size: 10-20 acres Tract is adjacent to protected properties Tract is within ¼-mile of protected properties Farmlands that are designated as prime agricultural lands Presence of recognized historical or cultural features Tract with significant Creek frontage: over ¼-mile Tract intersects planned pedestrian or bicycle trails Tract is under threat by development Buffer and Floodplain tracts that lack current protections if developed
* Parcels-level data will not be scored, but will be denoted and mapped to provide decision-makers with information valuable for setting priorities.
Page 12 of 15
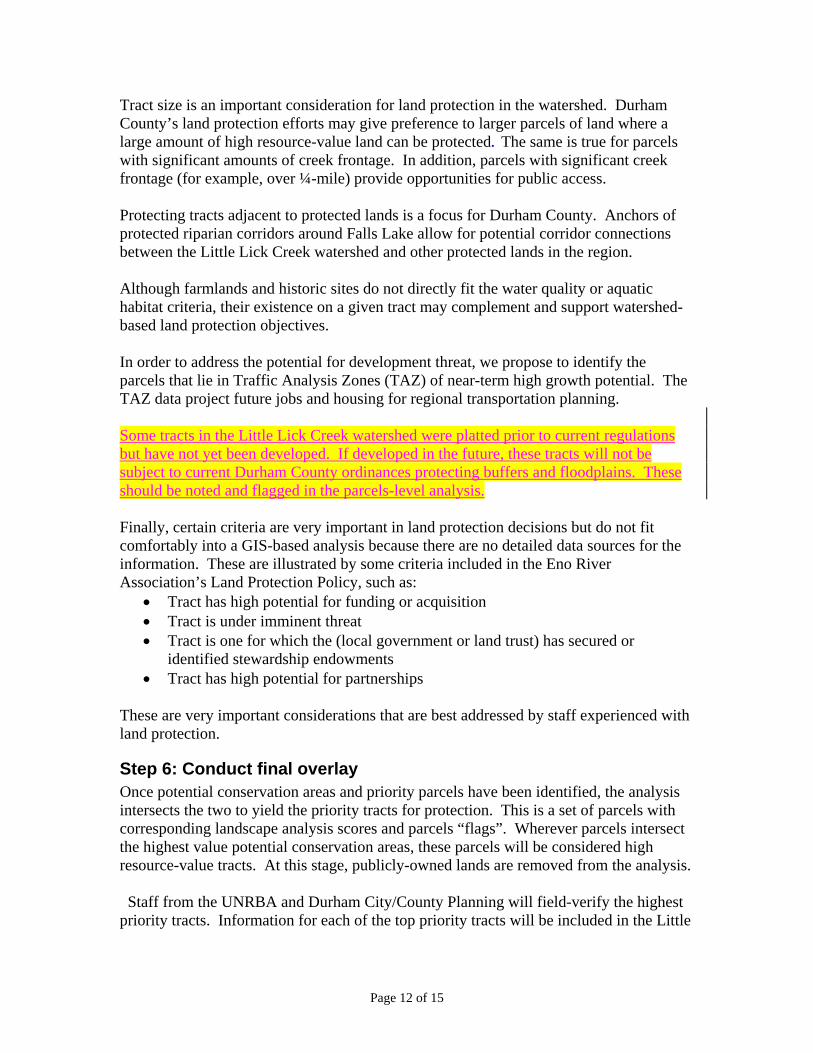
Tract size is an important consideration for land protection in the watershed. Durham County’s land protection efforts may give preference to larger parcels of land where a large amount of high resource-value land can be protected. The same is true for parcels with significant amounts of creek frontage. In addition, parcels with significant creek frontage (for example, over ¼-mile) provide opportunities for public access. Protecting tracts adjacent to protected lands is a focus for Durham County. Anchors of protected riparian corridors around Falls Lake allow for potential corridor connections between the Little Lick Creek watershed and other protected lands in the region. Although farmlands and historic sites do not directly fit the water quality or aquatic habitat criteria, their existence on a given tract may complement and support watershed-based land protection objectives. In order to address the potential for development threat, we propose to identify the parcels that lie in Traffic Analysis Zones (TAZ) of near-term high growth potential. The TAZ data project future jobs and housing for regional transportation planning. Some tracts in the Little Lick Creek watershed were platted prior to current regulations but have not yet been developed. If developed in the future, these tracts will not be subject to current Durham County ordinances protecting buffers and floodplains. These should be noted and flagged in the parcels-level analysis. Finally, certain criteria are very important in land protection decisions but do not fit comfortably into a GIS-based analysis because there are no detailed data sources for the information. These are illustrated by some criteria included in the Eno River Association’s Land Protection Policy, such as:
• Tract has high potential for funding or acquisition • Tract is under imminent threat • Tract is one for which the (local government or land trust) has secured or
identified stewardship endowments • Tract has high potential for partnerships
These are very important considerations that are best addressed by staff experienced with land protection.
Step 6: Conduct final overlay Once potential conservation areas and priority parcels have been identified, the analysis intersects the two to yield the priority tracts for protection. This is a set of parcels with corresponding landscape analysis scores and parcels “flags”. Wherever parcels intersect the highest value potential conservation areas, these parcels will be considered high resource-value tracts. At this stage, publicly-owned lands are removed from the analysis. Staff from the UNRBA and Durham City/County Planning will field-verify the highest priority tracts. Information for each of the top priority tracts will be included in the Little

Page 13 of 15
Lick Creek Local Watershed Plan. The Technical Team will discuss options for presenting the final information for a select group of the highest priority tracts.
• Names the tract (referenced with a number); • Shows a detailed aerial photo of the tract and hot spots; • Describes the tract with some text; • Provides the landscape analysis score and specific criteria met; and • Provides the parcels-level analysis score and specific criteria met.
Page 14 of 15
Conclusion The five-step process described in this memorandum allows the UNRBA and TJCOG to translate functional criteria into an analysis that can be conducted for the entire Little Lick Creek. This will expedite the process of identifying the most valuable lands for protection. The results from the analysis can be considered and modeled as part of potential management strategies for the Little Lick Creek Watershed.
References Keller, Cherry M.E., Chandler S. Robbins and Jeff S. Hatfield. June 1993. “Avian Communities in Riparian Forests of Different Widths in Maryland and Delaware.” Wetlands, Vol. 13, No.2: 137-144. North Carolina Wildlife Resources Commission. August, 2002. Guidance Memorandum to Address and Mitigate Secondary and Cumulative Impacts to Aquatic and Terrestrial Wildlife Resources and Water Quality. Division of Inland Fisheries. Raleigh, NC.
Page 15 of 15
McNaught, David, Joseph Rudek, and Elizabeth Spalt. 2003. Riparian Buffers: Common Sense Protection of North Carolina’s Water. Environmental Defense. Raleigh, NC. Vannote, R.L., G.W. Minshall, K.W. Cummins, J.R. Sedell and C.E. Cushing. 1980. “The River Continuum Concept.” Canadian Journal of Fisheries and Aquatic Sciences 37: 130-137. Tetra Tech. 2002. “Technical Memorandum: Summary of Modeling Tools Used in Assessing Management Measures in the Upper Neuse Watershed.” Prepared for the Upper Neuse River Basin Association by Tetra Tech, Inc. Research Triangle Park, NC. Tetra Tech. 2003. “Upper Neuse Watershed Management Plan”. Prepared for the Upper Neuse River Basin Association, May 2003. Research Triangle Park. UNRBA. 2005. April 15 Presentation by Chris Dreps to the Upper Neuse River Basin Association Board of Directors. Mr. Dreps used the Upper Neuse Site Evaluation Tool to estimate stormwater impacts of the Durham County Library East Branch and Fire Department site. Wischmeirer, W.H. and D.D. Smith. 1978. Predicting rainfall erosion losses-a guide to conservation planning. Agriculture Handbook No. 537, USDA. Washington, DC.