literacy, numeracy, and problem solving in technology ... · literacy, numeracy, and problem...
TRANSCRIPT
Literacy, Numeracy, and Problem Solving in Technology- Rich Environments Among U.S. Adults: Results from the Program for the International Assessment of Adult Competencies 2012
First Look
NCES 2014-008 U.S. DEPARTMENT OF EDUCATION

Photo Credits:
© Creatas/Jupiterimages/Getty Images, Inc. #86538921 © Hemera/Thinkstock/Getty Images, Inc. #100906146 © Brand X Pictures/Jupiterimages/Getty Images, Inc. #86527059 © Pixland/Jupiterimages/Getty Images, Inc. #78630215
Literacy, Numeracy, and Problem Solving in Technology- Rich Environments Among U.S. Adults: Results from the Program for the International Assessment of Adult Competencies 2012
First Look
October 2013
Madeline GoodmanRobert FinneganETS
Leyla MohadjerTom KrenzkeJacquie HoganWestat
Eugene OwenStephen ProvasnikProject OfficersNational Center for Education Statistics
NCES 2014-008
U.S. DEPARTMENT OF EDUCATIONI n s t i t u t e o f E d u c a t i o n S c i e n c e s
U.S. Department of Education Arne Duncan Secretary
Institute of Education Sciences John Q. Easton Director
National Center for Education Statistics Jack Buckley Commissioner
The National Center for Education Statistics (NCES) is the primary federal entity for collecting, analyzing, and reporting data related to education in the United States and other nations. It fulfills a congressional mandate to collect, collate, ana-lyze, and report full and complete statistics on the condition of education in the United States; conduct and publish reports and specialized analyses of the meaning and significance of such statistics; assist state and local education agencies in improv-ing their statistical systems; and review and report on education activities in foreign countries.
NCES activities are designed to address high-priority education data needs; provide consistent, reliable, complete, and accurate indicators of education status and trends; and report timely, useful, and high-quality data to the U.S. Department of Education, the Congress, the states, other education policymakers, practitioners, data users, and the general public. Unless specifically noted, all information contained herein is in the public domain.
We strive to make our products available in a variety of formats and in language that is appropriate to a variety of audiences. You, as our customer, are the best judge of our success in communicating information effectively. If you have any comments or suggestions about this or any other NCES product or report, we would like to hear from you. Please direct your comments to:
NCES, IES, U.S. Department of Education 1990 K Street NW Washington, DC 20006-5651
October 2013
The NCES Home Page address is http://nces.ed.gov. The NCES Publications and Products address is http://nces.ed.gov/pubsearch.
This publication is only available online. To download, view, and print the report as a PDF file, go to the NCES Publications and Products address shown above.
This report was prepared in part under Contract No. ED-04-CO-0059/0030 with Westat. Mention of trade names, commercial products, or organizations does not imply endorsement by the U.S. Government.
Suggested Citation
Goodman, M., Finnegan, R., Mohadjer, L., Krenzke, T., and Hogan, J. (2013). Literacy, Numeracy, and Problem Solving in Technology-Rich Environments Among U.S. Adults: Results from the Program for the International Assessment of Adult Competencies 2012: First Look (NCES 2014-008). U.S. Department of Education. Washington, DC: National Center for Education Statistics. Retrieved [date] from http://nces.ed.gov/pubsearch.
Content Contact
Eugene H. Owen (202) 502-7422 [email protected]
AcknowledgmentsThe authors wish to thank all the individual Americans who participated in the Program for the International Assessment of Adult Competencies (PIAAC) 2011–12. Without their assistance and cooperation, this study would not be possible. The authors also wish to thank all those who contrib-uted to the PIAAC design, implementation, and data collection as well as the writing, production, and review of this report.
iii

This page intentionally left blank.
iv
Contents Page
Acknowledgments ............................................................................................................................... iiiList of Figures .......................................................................................................................................viList of Tables ......................................................................................................................................viiiList of Exhibits ...................................................................................................................................viiiIntroduction ..........................................................................................................................................1Selected Findings ...................................................................................................................................5Figures and Tables .................................................................................................................................7References………….. .........................................................................................................................23More Information About PIAAC ........................................................................................................25Appendix A: Members of the PIAAC Subject Matter Expert Groups .................................................A-1Appendix B: PIAAC Scales and Proficiency-Level Descriptions .........................................................B-1Appendix C: Methodology and Technical Notes ............................................................................... C-1Appendix D: Standard Error Tables (ONLINE ONLY)
v
List of Figures Page
Figure 1-A. Average scores on the PIAAC literacy scale for adults age 16 to 65, by participating country and region: 2012 ........................................................................7
Figure 1-B. Average scores on the PIAAC numeracy scale for adults age 16 to 65, by participating country and region: 2012 ........................................................................8
Figure 1-C. Average scores on the PIAAC problem solving in technology-rich environments scale for adults age 16 to 65, by participating country and region: 2012 ..............................................................................................................9
Figure 2-A. Percentage of adults age 16 to 65 at each level of proficiency on the PIAAC literacy scale, by participating country and region: 2012 ....................................10
Figure 2-B. Percentage of adults age 16 to 65 at each level of proficiency on the PIAAC numeracy scale, by participating country and region: 2012 ................................11
Figure 2-C. Percentage of adults age 16 to 65 at each level of proficiency on the PIAAC problem solving in technology-rich environments scale, by participating country and region: 2012 ......................................................................12
Figure 3-A. Percentage of adults age 16 to 65 at each level of proficiency on the PIAAC literacy scale, by 10-year age intervals: 2012 .......................................................13
Figure 3-B. Percentage of adults age 16 to 65 at each level of proficiency on the PIAAC numeracy scale, by 10-year age intervals: 2012 ...................................................13
Figure 3-C. Percentage of adults age 16 to 65 at each level of proficiency on the PIAAC problem solving in technology-rich environments scale, by 10-year age intervals: 2012 ........................................................................................13
Figure 4-A. Percentage of adults age 16 to 65 at each level of proficiency on the PIAAC literacy scale, by gender: 2012 ............................................................................14
Figure 4-B. Percentage of adults age 16 to 65 at each level of proficiency on the PIAAC numeracy scale, by gender: 2012 ........................................................................14
Figure 4-C. Percentage of adults age 16 to 65 at each level of proficiency on the PIAAC problem solving in technology-rich environments scale, by gender: 2012 .............................................................................................................14
Figure 5-A. Percentage of U.S. adults age 16 to 65 at each level of proficiency on the PIAAC literacy scale, by whether they were born in the United States: 2012 ..................15
Figure 5-B. Percentage of U.S. adults age 16 to 65 at each level of proficiency on the PIAAC numeracy scale, by whether they were born in the United States: 2012 ..............15
Figure 5-C. Percentage of U.S. adults age 16 to 65 at each level of proficiency on the PIAAC problem solving in technology-rich environments scale, by whether they were born in the United States: 2012 ....................................................15
Figure 6-A. Percentage of adults age 16 to 65 at each level of proficiency on the PIAAC literacy scale, by highest level of educational attainment: 2012 ...........................16
Figure 6-B. Percentage of adults age 16 to 65 at each level of proficiency on the PIAAC numeracy scale, by highest level of educational attainment: 2012 .......................16
vi
Figure 6-C. Percentage of adults age 16 to 65 at each level of proficiency on the PIAAC problem solving in technology-rich environments scale, by highest level of educational attainment: 2012 ............................................................16
Figure 7-A. Percentage of U.S. adults age 16 to 65 at each level of proficiency on the PIAAC literacy scale, by race/ethnicity: 2012 .................................................................17
Figure 7-B. Percentage of U.S. adults age 16 to 65 at each level of proficiency on the PIAAC numeracy scale, by race/ethnicity: 2012 .............................................................17
Figure 7-C. Percentage of U.S. adults age 16 to 65 at each level of proficiency on the PIAAC problem solving in technology-rich environments scale, by race/ethnicity: 2012 ...................................................................................................17
Figure 8-A. Percentage of adults age 16 to 65 at each level of proficiency on the PIAAC literacy scale, by frequency with which reading skills are used at work: 2012 .........................................................................................................18
Figure 8-B. Percentage of adults age 16 to 65 at each level of proficiency on the PIAAC numeracy scale, by frequency with which numeracy skills are used at work: 2012 .........................................................................................................18
Figure 8-C. Percentage of adults age 16 to 65 at each level of proficiency on the PIAAC problem solving in technology-rich environments scale, by frequency with which information and communication technology (ICT) skills are used at work: 2012 ...............................................................18
Figure 9-A. Percentage of adults age 16 to 65 at each level of proficiency on the PIAAC literacy scale, by employment status: 2012 .........................................................19
Figure 9-B. Percentage of adults age 16 to 65 at each level of proficiency on the PIAAC numeracy scale, by employment status: 2012 .....................................................19
Figure 9-C. Percentage of adults age 16 to 65 at each level of proficiency on the PIAAC problem solving in technology-rich environments scale, by employment status: 2012 ...........................................................................................19
Figure 10-A. Percentage of U.S. adults age 16 to 65 at each level of proficiency on the PIAAC literacy scale, by self-reported health status: 2012 ...............................................20
Figure 10-B. Percentage of U.S. adults age 16 to 65 at each level of proficiency on the PIAAC numeracy scale, by self-reported health status: 2012 ...........................................20
Figure 10-C. Percentage of U.S. adults age 16 to 65 at each level of proficiency on the PIAAC problem solving in technology-rich environments scale, by self-reported health status: 2012 ................................................................................20
Figure 11-A. Percentage of U.S. adults age 16 to 65 at each level of proficiency on the PIAAC literacy scale, by their responses to a question about whether they have ever been diagnosed or identified as having a learning disability: 2012 ...................21
List of Figures (cont’d) Page
vii
List of Figures (cont’d) Page
Figure 11-B. Percentage of U.S. adults age 16 to 65 at each level of proficiency on the PIAAC numeracy scale, by their responses to a question about whether they have ever been diagnosed or identified as having a learning disability .............................21
Figure 11-C. Percentage of U.S. adults age 16 to 65 at each level of proficiency on the PIAAC problem solving in technology-rich environments scale, by their responses to a question about whether they have ever been diagnosed or identified as having a learning disability: 2012 ...........................................21
List of Tables
Table 1-A. Average scores on the IALS, ALL, and PIAAC literacy scales for adults age 16 to 65, by participating country: Various years, 1994-2012 ........................................................22
Table 1-B. Average scores on the ALL and PIAAC numeracy scales for adults age 16 to 65, by participating country: Various years, 2003-12 ............................................................22
Table C-1. Weighted response rate for the United States, by survey component ............................ C-3
List of ExhibitsExhibit B-1. Description of PIAAC proficiency levels on the literacy scale: 2012 ..............................B-3
Exhibit B-2. Examples of literacy items ............................................................................................B-4
Exhibit B-3. Description of PIAAC proficiency levels on the numeracy scale: 2012 ..........................B-7
Exhibit B-4. Examples of numeracy items ........................................................................................B-8
Exhibit B-5. Description of PIAAC proficiency levels on the problem solving in technology-rich environments scale: 2012 ..................................................................B-11
Exhibit B-6. Examples of problem solving in technology-rich environments items .........................B-12
Exhibit C-1. PIAAC Main Study Yield ............................................................................................ C-5
viii
IntroductionWhat Is PIAAC?The Program for the International Assessment of Adult Competencies (PIAAC) is a cyclical, large-scale study of adult skills and life experience focusing on education and employment that was developed and organized by the Organization for Economic Cooperation and Development (OECD). In the United States, the study was conducted in 2011−12 with a nationally representative sample of 5,000 adults between the ages of 16 and 65. Similar nationally representative samples of adults were surveyed in each of the 22 other participating countries.1
The goal of PIAAC is to assess and compare the basic skills and the broad range of competencies of adults around the world. The assessment focuses on cognitive and workplace skills necessary for successful participation in 21st-century society and the global economy. Specifically, PIAAC measures relationships between individuals’ educational background, workplace experiences and skills, occupa-tional attainment, use of information and communication technology, and cognitive skills in the areas of literacy, numeracy, and problem solving in technology-rich environments.
History of International Adult Literacy AssessmentsPIAAC builds on knowledge and experiences gained from previous international adult assessments—the International Adult Literacy Survey (IALS) and the Adult Literacy and Lifeskills Survey (ALL). Statistics Canada initiated both of these earlier assessments. PIAAC improves upon the content frame-works of these assessments as well as their design and methodologies. PIAAC seeks to ensure continu-ity with previous literacy surveys and includes items from IALS and ALL. PIAAC improves on quality assurance standards, extends the definitions of literacy and numeracy, presents the problem-solving domain to emphasize skills used in technology-rich environments, and provides more information about individuals with low levels of literacy by assessing reading component skills.
What Does PIAAC Measure?PIAAC is designed to assess adults in different countries over a broad range of abilities, from simple reading to complex problem-solving skills. To do this, PIAAC defines four core competency domains of adult cognitive skills that are seen as key to facilitating the social and economic participation of adults in advanced economies: literacy, reading components, numeracy, and problem solving in technology-rich environments. All participating countries and regions are required to assess the literacy and numeracy domains, but the reading components and problem solving in technology-rich environ-ments domains are both optional. The United States assessed all four domains. For a list of the subject experts for each of those domains, see appendix A. For a more detailed description of the four domains, see appendix B.
PIAAC tasks developed for these domains are authentic, culturally appropriate, and drawn from real-life situations that are expected to be important or relevant in different contexts. Tasks are intended to be reflective of adults’ daily lives across cultures, even if not every adult is necessarily familiar with every task. PIAAC is not designed to provide individual scores, but rather it measures how groups of adults perform on the domains. Each respondent takes only a portion of the items in each domain.
1 Data for the Russian Federation are not included in this First Look report because they were received too late for publication.
1
Literacy
The PIAAC literacy framework expands on the definition of literacy previously used in IALS and ALL. PIAAC broadly defines literacy as “understanding, evaluating, using and engaging with written text to participate in society, to achieve one’s goals and to develop one’s knowledge and potential.” (Organization for Economic Cooperation and Development [OECD], 2012.)
Reading components
The primary goal of the PIAAC reading components measure is to provide information about the literacy skills of adults at the lower end of the literacy spectrum—specifically, whether they have the foundational skills to develop the higher literacy and numeracy abilities necessary for functioning in society. The reading components assessment focuses on elements of reading that are comparable across the range of languages in the participating countries: reading vocabulary, sentence comprehension, and basic passage comprehension.
Numeracy
The primary goal of PIAAC’s numeracy assessment is to evaluate basic mathematical and computational skills that are considered fundamental for functioning in everyday work and social life. Numeracy in the PIAAC framework is defined as “the ability to access, use, interpret, and communicate mathematical information and ideas, to engage in and manage mathematical demands of a range of situations in adult life.” (Organization for Economic Cooperation and Development [OECD], 2012.)
Problem solving in technology-rich environments
PIAAC represents the first attempt to assess problem solving in technology-rich environments on a large scale and as a single dimension in an international context. PIAAC defines problem solving in technology-rich environments as “using digital technology, communication tools, and networks to acquire and evaluate information, communicate with others, and perform practical tasks.” (Organization for Economic Cooperation and Development [OECD], 2012.)
Skill use and the background questionnaire
In addition to focusing on the direct measurement of adult competencies in the three main cognitive domains of literacy, numeracy, and problem solving in technology-rich environments, PIAAC also examines adults’ intrapersonal, interpersonal, and professional skills through a background questionnaire. For a more detailed description of the skill use and the background questionnaire, see appendix C.
2
Reporting Results PIAAC results are reported in two ways: as scale scores on a 0–500 scale in three domains (literacy, numeracy, and problem solving in technology-rich environments),2 and as percentages of adults reaching established proficiency levels. PIAAC reports five proficiency levels for literacy and numeracy (Below level 1, Level 1, Level 2, Level 3, and Level 4/5) and four levels for problem solving in technology-rich environments (Below level 1, Level 1, Level 2, and Level 3). Across all countries, only 2 percent of adults performed at Level 5 on many of the variables in the literacy and numeracy scales. This report follows OECD reporting conventions by combining the top two proficiency levels for the literacy and numeracy scales. There were fewer items in the problem solving in technology-rich environments assessment to define the scale, which accounts for why there are fewer proficiency levels in this scale. Appendix B provides information about interpreting the proficiency levels.
The purpose of this First Look report is to introduce PIAAC data through the presentation of data figures and tables and selected findings.3 However, readers are cautioned not to draw causal inferences. Many of the variables examined in this report may be related to one another, but the complex inter- actions and relationships among them have not been explored. The variables examined here are also just a few of the variables that can be examined in these data; they were selected to demonstrate the range of information available from the study. The release of this report is intended to encourage more in-depth analysis of the data using more sophisticated statistical methods.
All statistically significant differences described in this report are at the .05 level. No statistical adjustments to account for multiple comparisons were used. Differences that are statistically significant are discussed using comparative terms such as “higher” and “lower.” Differences that are not statistically significant are either not discussed or referred to as “not measurably different” or “not statistically significant.” In the latter case, failure to find a difference as statistically significant does not necessarily mean that there was no difference. It could be that a real difference cannot be detected by the significance test because of small sample size or imprecise measurement in the sample. If the statistical test is significant, this means that there is convincing evidence (though no guarantee) of a real difference in the population. However, it is important to remember that statistically significant results do not necessarily identify those findings that have policy significance or practical importance. See appendix C for more information about statistical testing.
Trend ResultsThis report presents overall trend comparisons over time for the total adult population in the areas of literacy and numeracy. In literacy, comparisons are made between PIAAC (2012) and both ALL (2003−2008) and IALS (1994−1998). In numeracy, trend comparisons are made between PIAAC (2012) and ALL (2003−2008). In both the literacy and numeracy domains, approximately 60 percent of the items are common between PIAAC and previous international surveys to ensure the compara- bility of these domains.
2 Results from the reading components portion of the assessment are not reported separately in this report, but can be accessed from the International Data Explorer (IDE) at http://www.oecd.org/site/piaac/publicdataandanalysis.htm. These results have not yet been analyzed internationally, but will be part of a forthcoming report from the OECD, which will be followed by an analysis of how U.S. adults performed on this domain. 3 Selected findings are presented for only some figures.
3

This page intentionally left blank.
4
Selected Findings•
•
•
•
•
•
•
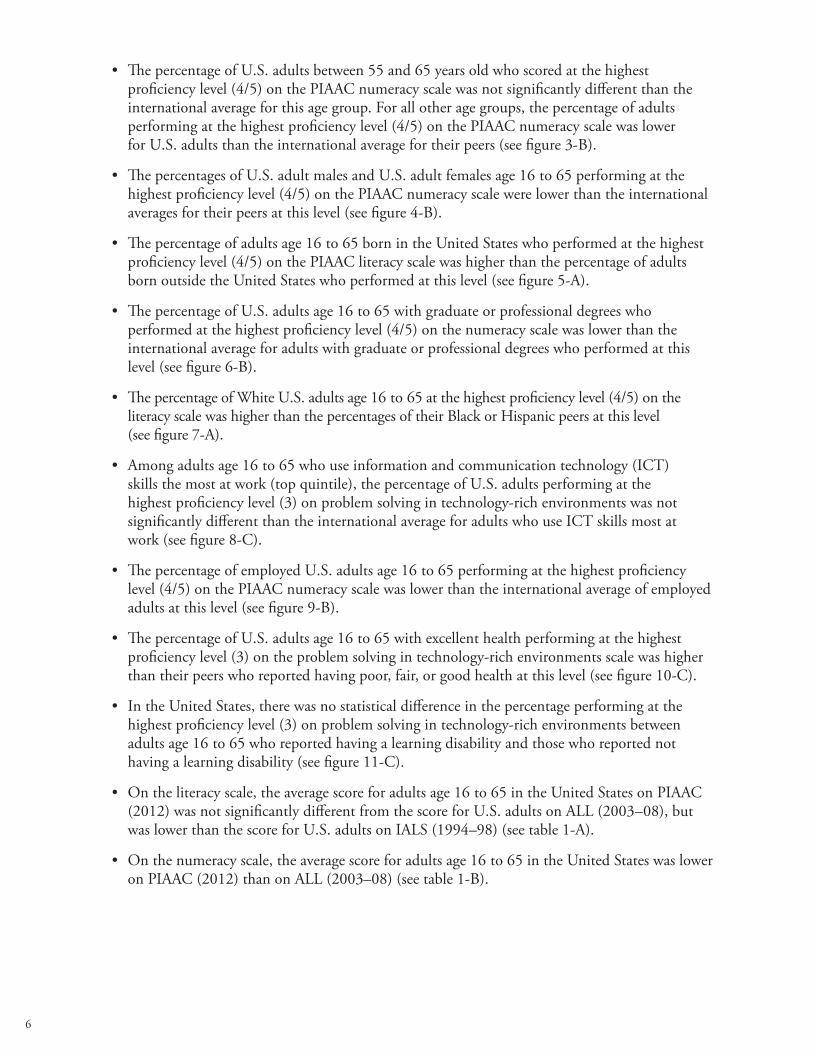
AveragescoresonthePIAACliteracyscaleforadultsage16to65rangedfrom250inItalyto296inJapan.TheU.S.averagescorewas270.ComparedwiththeU.S.averagescore,averagescoresin12countrieswerehigher,in5countriestheywerelower,andin5countriestheywerenotsignificantlydifferent(seefigure1-A).
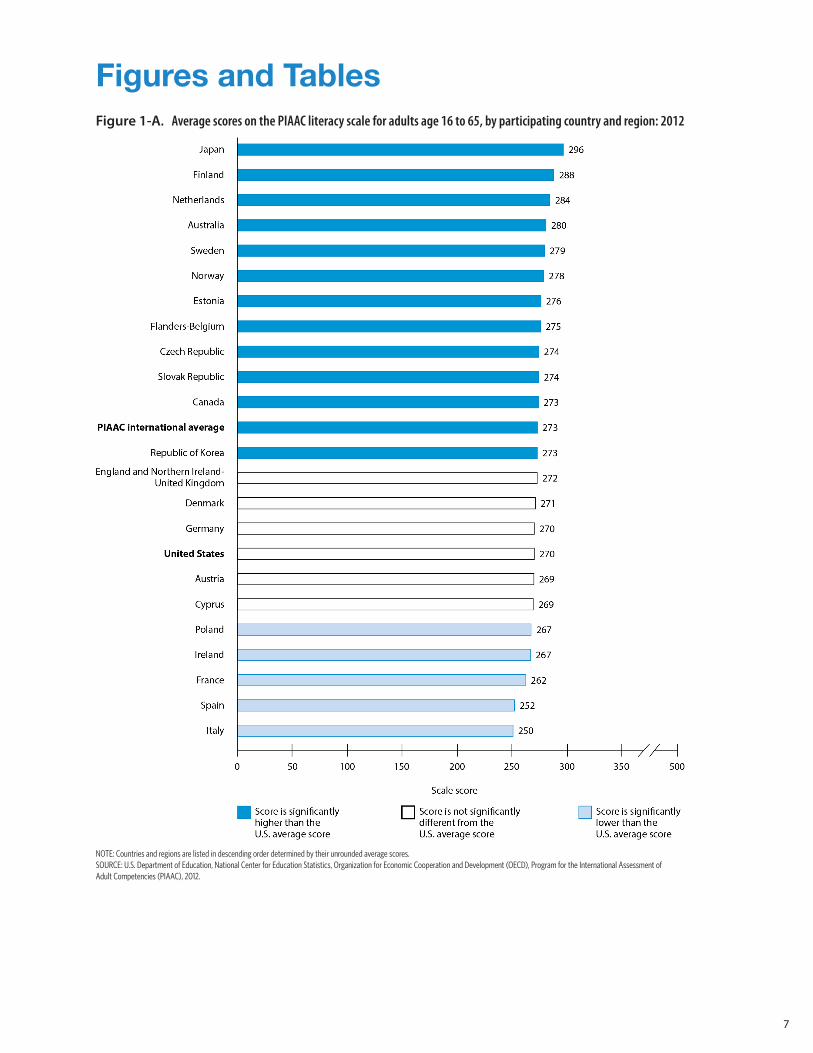
AveragescoresonthePIAACnumeracyscaleforadultsage16to65rangedfrom246inSpainto288inJapan.TheU.S.averagescorewas253.ComparedwiththeU.S.averagescore,aver-agescoresin18countrieswerehigher,in2countriestheywerelower,andin2countriestheywerenotsignificantlydifferent(seefigure1-B).
AveragescoresonthePIAACproblemsolvingintechnology-richenvironmentsscaleforadultsage16to65rangedfrom275inPolandto294inJapan.TheU.S.averagescorewas277.ComparedwiththeU.S.averagescore,averagescoresin14countrieswerehigherandin4countriestheywerenotsignificantlydifferent(seefigure1-C).
TwelvepercentofU.S.adultsage16to65performedatthehighestproficiencylevel(4/5)onthePIAACliteracyscale.ThepercentageofadultsperformingatthislevelwashigherthanintheU.S.in7countries(Japan,Finland,Netherlands,Australia,Sweden,Norway,andCanada),lowerin11countries(Denmark,Poland,CzechRepublic,Austria,France,Ireland,RepublicofKorea,SlovakRepublic,Cyprus,Spain,andItaly),andnotsignificantlydifferentin4countries(EnglandandNorthernIreland-UnitedKingdom,Flanders-Belgium,Estonia,andGermany)(seefigure2-A).
NinepercentofU.S.adultsage16to65performedatthehighestproficiencylevel(4/5)onthePIAACnumeracyscale.ThepercentageofadultsperformingatthislevelwashigherthanintheU.S.in15countries(Finland,Japan,Sweden,Flanders-Belgium,Norway,Netherlands,Denmark,Germany,Australia,Austria,SlovakRepublic,Canada,CzechRepublic,EnglandandNorthernIreland-UnitedKingdom,andEstonia),lowerin3countries(RepublicofKorea,Italy,andSpain),andnotsignificantlydifferentin4countries(France,Poland,Ireland,andCyprus)(seefigure2-B).
SixpercentofU.S.adultsage16to65performedatthehighestproficiencylevel(3)onthePIAACproblemsolvingintechnology-richenvironmentsscale.ThepercentageofadultsperformingatthislevelwashigherthanintheU.S.in8countries(Japan,Finland,Sweden,CzechRepublic,Canada,Germany,Netherlands,andAustralia),lowerin2countries(IrelandandSlovakRepublic),andnotsignificantlydifferentin8countries(Poland,Denmark,Flanders-Belgium,Norway,EnglandandNorthernIreland-UnitedKingdom,Estonia,Austria,andRepublicofKorea)(seefigure2-C).
ThepercentageofU.S.adultsbetween55and65yearsoldwhoscoredatthehighestproficiencylevel(4/5)onthePIAACliteracyscalewashigherthantheinternationalaverageforthisagegroup.Forallotheragegroups,thepercentageofadultsperformingatthehighestproficiencylevelonthePIAACliteracyscalewasnotsignificantlydifferentforU.S.adultsandtheinternationalaveragefortheirpeers(seefigure3-A).
5
•
•
•
•
•
•
•
•
•
•
•
ThepercentageofU.S.adultsbetween55and65yearsoldwhoscoredatthehighestproficiencylevel(4/5)onthePIAACnumeracyscalewasnotsignificantlydifferentthantheinternationalaverageforthisagegroup.Forallotheragegroups,thepercentageofadultsperformingatthehighestproficiencylevel(4/5)onthePIAACnumeracyscalewaslowerforU.S.adultsthantheinternationalaveragefortheirpeers(seefigure3-B).
ThepercentagesofU.S.adultmalesandU.S.adultfemalesage16to65performingatthehighestproficiencylevel(4/5)onthePIAACnumeracyscalewerelowerthantheinternationalaveragesfortheirpeersatthislevel(seefigure4-B).
Thepercentageofadultsage16to65bornintheUnitedStateswhoperformedatthehighestproficiencylevel(4/5)onthePIAACliteracyscalewashigherthanthepercentageofadultsbornoutsidetheUnitedStateswhoperformedatthislevel(seefigure5-A).
ThepercentageofU.S.adultsage16to65withgraduateorprofessionaldegreeswhoperformedatthehighestproficiencylevel(4/5)onthenumeracyscalewaslowerthantheinternationalaverageforadultswithgraduateorprofessionaldegreeswhoperformedatthislevel(seefigure6-B).
ThepercentageofWhiteU.S.adultsage16to65atthehighestproficiencylevel(4/5)ontheliteracyscalewashigherthanthepercentagesoftheirBlackorHispanicpeersatthislevel(seefigure7-A).
Amongadultsage16to65whouseinformationandcommunicationtechnology(ICT)skillsthemostatwork(topquintile),thepercentageofU.S.adultsperformingatthehighestproficiencylevel(3)onproblemsolvingintechnology-richenvironmentswasnotsignificantlydifferentthantheinternationalaverageforadultswhouseICTskillsmostatwork(seefigure8-C).
ThepercentageofemployedU.S.adultsage16to65performingatthehighestproficiencylevel(4/5)onthePIAACnumeracyscalewaslowerthantheinternationalaverageofemployedadultsatthislevel(seefigure9-B).
ThepercentageofU.S.adultsage16to65withexcellenthealthperformingatthehighestproficiencylevel(3)ontheproblemsolvingintechnology-richenvironmentsscalewashigherthantheirpeerswhoreportedhavingpoor,fair,orgoodhealthatthislevel(seefigure10-C).
IntheUnitedStates,therewasnostatisticaldifferenceinthepercentageperformingatthehighestproficiencylevel(3)onproblemsolvingintechnology-richenvironmentsbetweenadultsage16to65whoreportedhavingalearningdisabilityandthosewhoreportednothavingalearningdisability(seefigure11-C).
Ontheliteracyscale,theaveragescoreforadultsage16to65intheUnitedStatesonPIAAC(2012)wasnotsignificantlydifferentfromthescoreforU.S.adultsonALL(2003–08),butwaslowerthanthescoreforU.S.adultsonIALS(1994–98)(seetable1-A).
Onthenumeracyscale,theaveragescoreforadultsage16to65intheUnitedStateswasloweronPIAAC(2012)thanonALL(2003–08)(seetable1-B).
6
Figures and TablesFigure 1-A. Average scores on the PIAAC literacy scale for adults age 16 to 65, by participating country and region: 2012
NOTE: Countries and regions are listed in descending order determined by their unrounded average scores. SOURCE: U.S. Department of Education, National Center for Education Statistics, Organization for Economic Cooperation and Development (OECD), Program for the International Assessment of Adult Competencies (PIAAC), 2012.
7
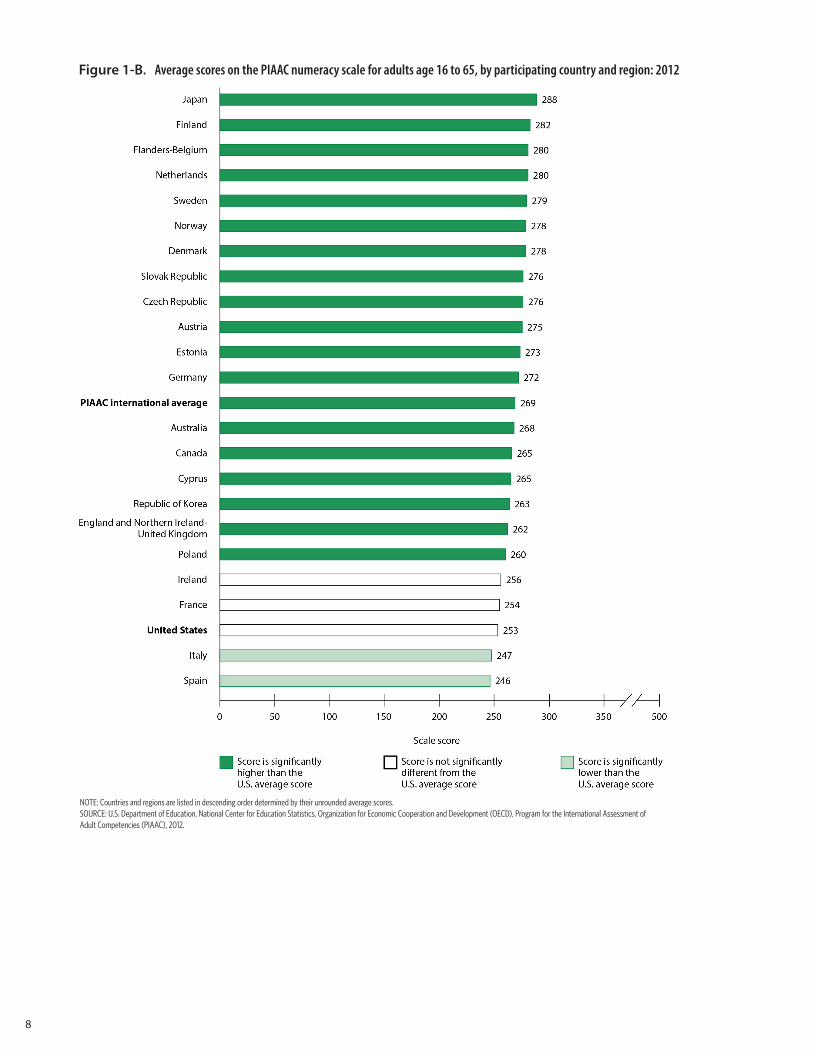
Figure 1-B. Average scores on the PIAAC numeracy scale for adults age 16 to 65, by participating country and region: 2012
NOTE: Countries and regions are listed in descending order determined by their unrounded average scores. SOURCE: U.S. Department of Education, National Center for Education Statistics, Organization for Economic Cooperation and Development (OECD), Program for the International Assessment of Adult Competencies (PIAAC), 2012.
8
Figure 1-C. Average scores on the PIAAC problem solving in technology-rich environments scale for adults age 16 to 65, by participating country and region: 2012
NOTE: Countries and regions are listed in descending order determined by their unrounded average scores. SOURCE: U.S. Department of Education, National Center for Education Statistics, Organization for Economic Cooperation and Development (OECD), Program for the International Assessment of Adult Competencies (PIAAC), 2012.
9
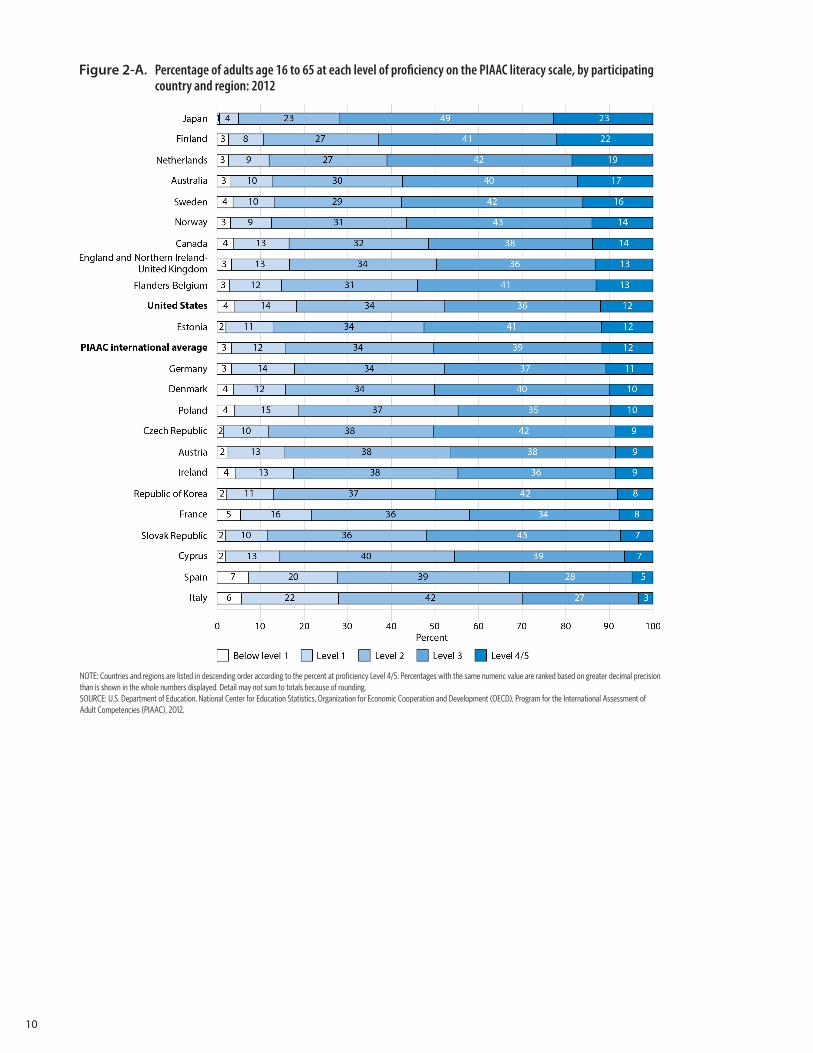
Figure 2-A. Percentage of adults age 16 to 65 at each level of proficiency on the PIAAC literacy scale, by participating country and region: 2012
NOTE: Countries and regions are listed in descending order according to the percent at proficiency Level 4/5. Percentages with the same numeric value are ranked based on greater decimal precision than is shown in the whole numbers displayed. Detail may not sum to totals because of rounding.SOURCE: U.S. Department of Education, National Center for Education Statistics, Organization for Economic Cooperation and Development (OECD), Program for the International Assessment of Adult Competencies (PIAAC), 2012.
10
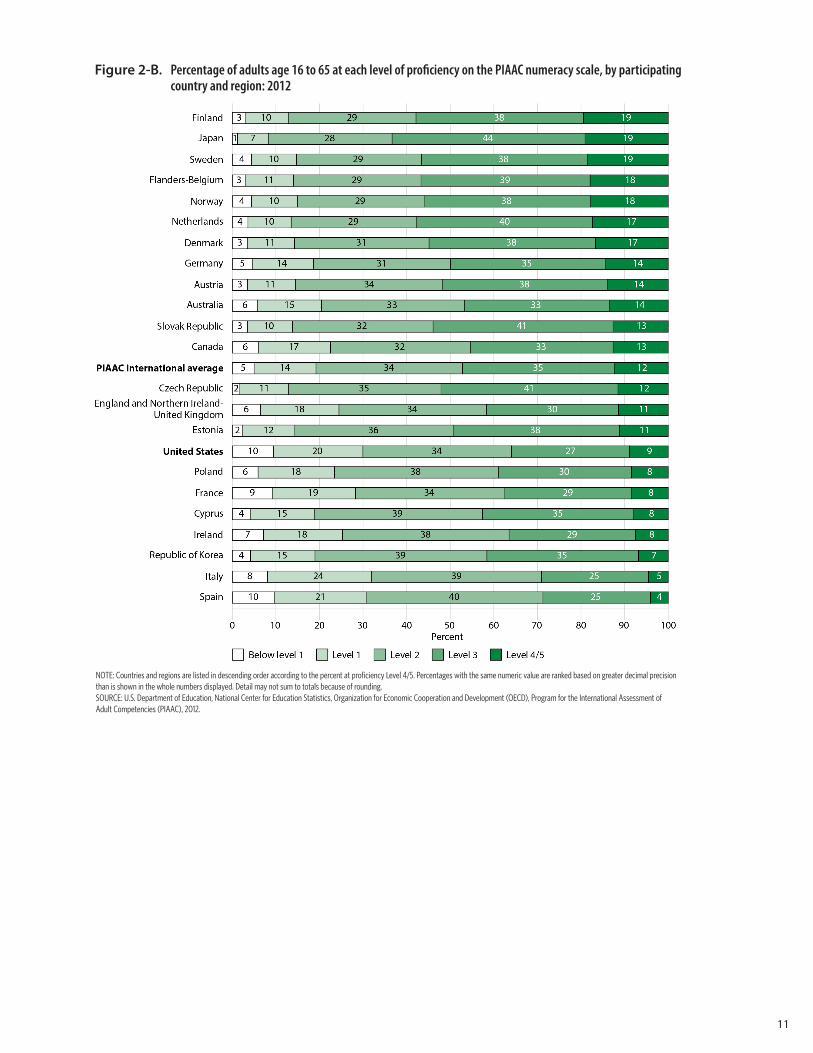
Figure 2-B. Percentage of adults age 16 to 65 at each level of proficiency on the PIAAC numeracy scale, by participating country and region: 2012
NOTE: Countries and regions are listed in descending order according to the percent at proficiency Level 4/5. Percentages with the same numeric value are ranked based on greater decimal precision than is shown in the whole numbers displayed. Detail may not sum to totals because of rounding.SOURCE: U.S. Department of Education, National Center for Education Statistics, Organization for Economic Cooperation and Development (OECD), Program for the International Assessment of Adult Competencies (PIAAC), 2012.
11
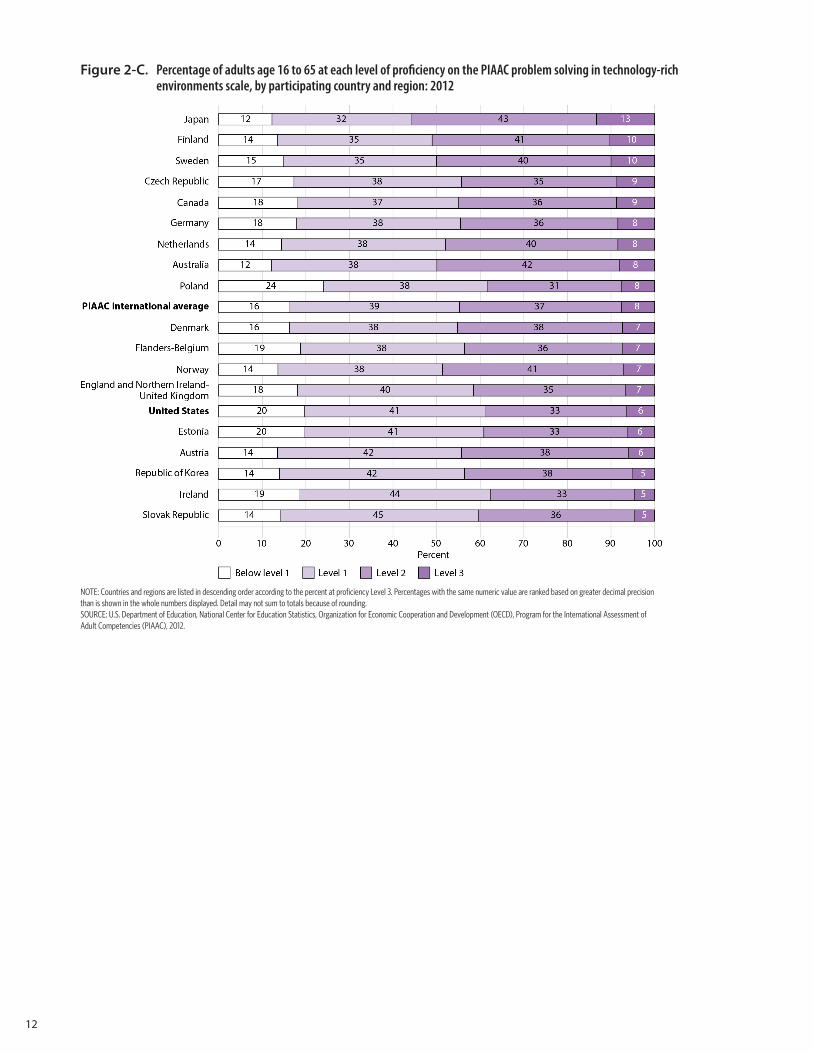
Figure 2-C. Percentage of adults age 16 to 65 at each level of proficiency on the PIAAC problem solving in technology-rich environments scale, by participating country and region: 2012
NOTE: Countries and regions are listed in descending order according to the percent at proficiency Level 3. Percentages with the same numeric value are ranked based on greater decimal precision than is shown in the whole numbers displayed. Detail may not sum to totals because of rounding.SOURCE: U.S. Department of Education, National Center for Education Statistics, Organization for Economic Cooperation and Development (OECD), Program for the International Assessment of Adult Competencies (PIAAC), 2012.
12
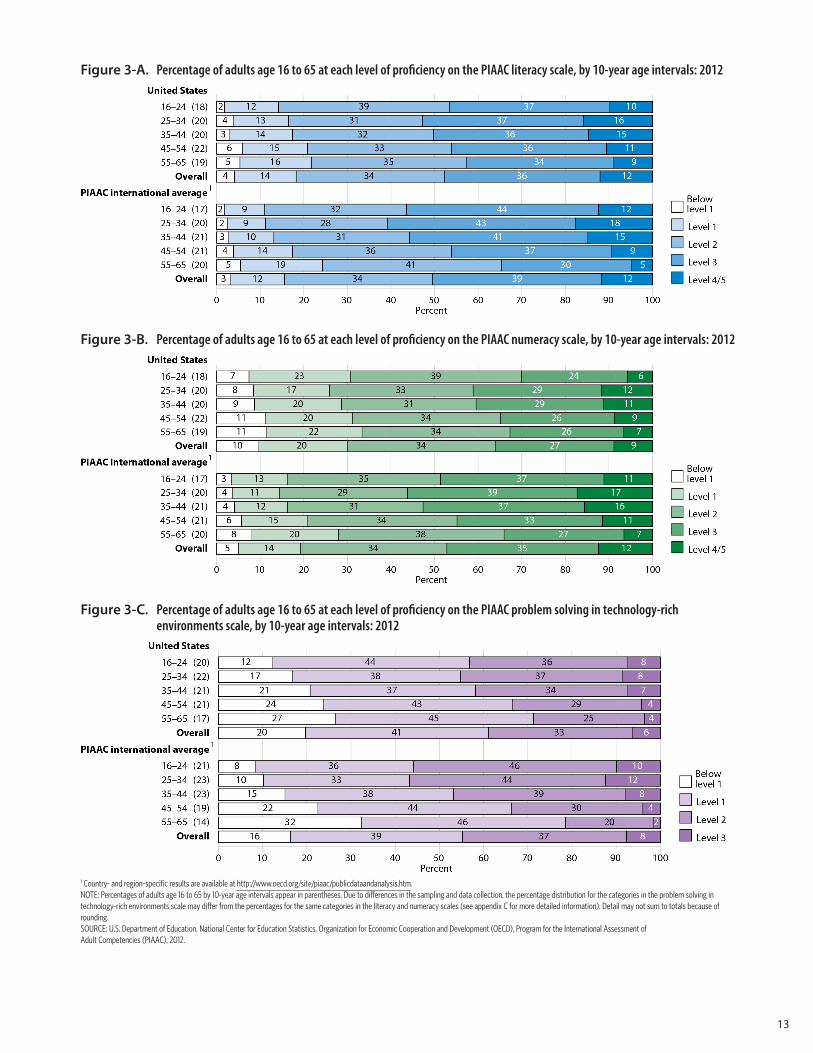
Figure 3-A. Percentage of adults age 16 to 65 at each level of proficiency on the PIAAC literacy scale, by 10-year age intervals: 2012
Figure 3-B. Percentage of adults age 16 to 65 at each level of proficiency on the PIAAC numeracy scale, by 10-year age intervals: 2012
Figure 3-C. Percentage of adults age 16 to 65 at each level of proficiency on the PIAAC problem solving in technology-rich environments scale, by 10-year age intervals: 2012
1 Country- and region-specific results are available at http://www.oecd.org/site/piaac/publicdataandanalysis.htm.NOTE: Percentages of adults age 16 to 65 by 10-year age intervals appear in parentheses. Due to differences in the sampling and data collection, the percentage distribution for the categories in the problem solving in technology-rich environments scale may differ from the percentages for the same categories in the literacy and numeracy scales (see appendix C for more detailed information). Detail may not sum to totals because of rounding.SOURCE: U.S. Department of Education, National Center for Education Statistics, Organization for Economic Cooperation and Development (OECD), Program for the International Assessment of Adult Competencies (PIAAC), 2012.
13
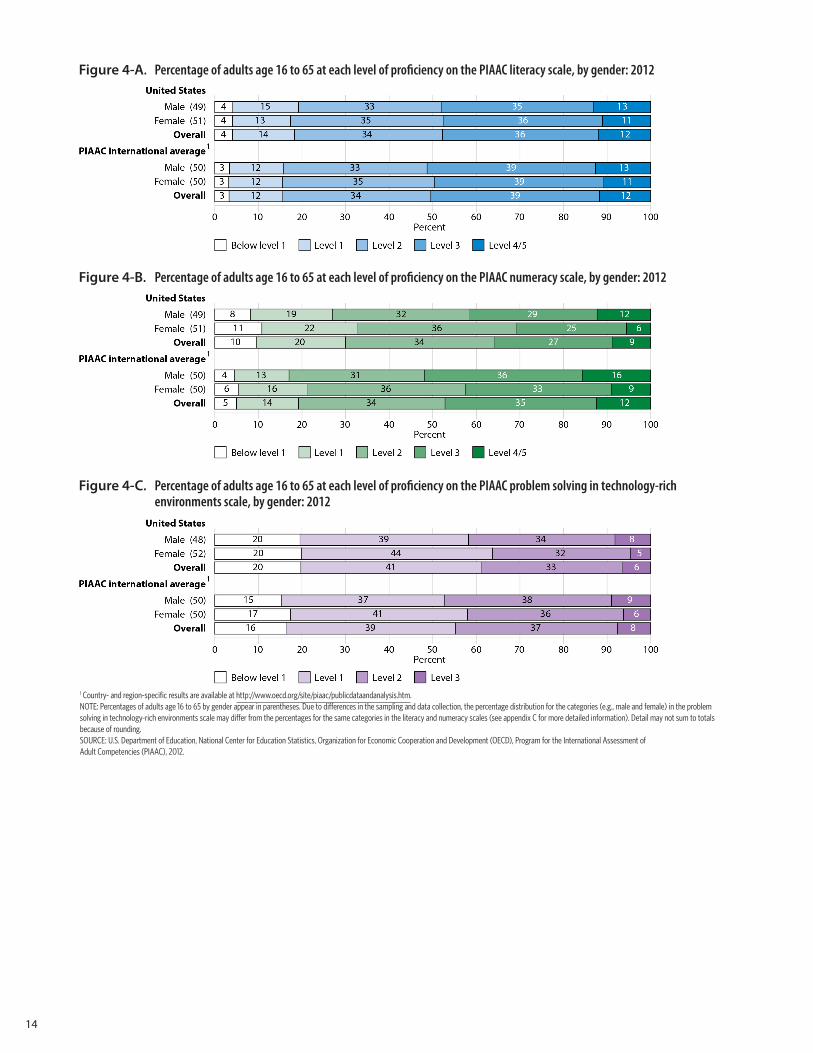
Figure 4-A. Percentage of adults age 16 to 65 at each level of proficiency on the PIAAC literacy scale, by gender: 2012
Figure 4-B. Percentage of adults age 16 to 65 at each level of proficiency on the PIAAC numeracy scale, by gender: 2012
Figure 4-C. Percentage of adults age 16 to 65 at each level of proficiency on the PIAAC problem solving in technology-rich environments scale, by gender: 2012
1 Country- and region-specific results are available at http://www.oecd.org/site/piaac/publicdataandanalysis.htm.NOTE: Percentages of adults age 16 to 65 by gender appear in parentheses. Due to differences in the sampling and data collection, the percentage distribution for the categories (e.g., male and female) in the problem solving in technology-rich environments scale may differ from the percentages for the same categories in the literacy and numeracy scales (see appendix C for more detailed information). Detail may not sum to totals because of rounding.SOURCE: U.S. Department of Education, National Center for Education Statistics, Organization for Economic Cooperation and Development (OECD), Program for the International Assessment of Adult Competencies (PIAAC), 2012.
14
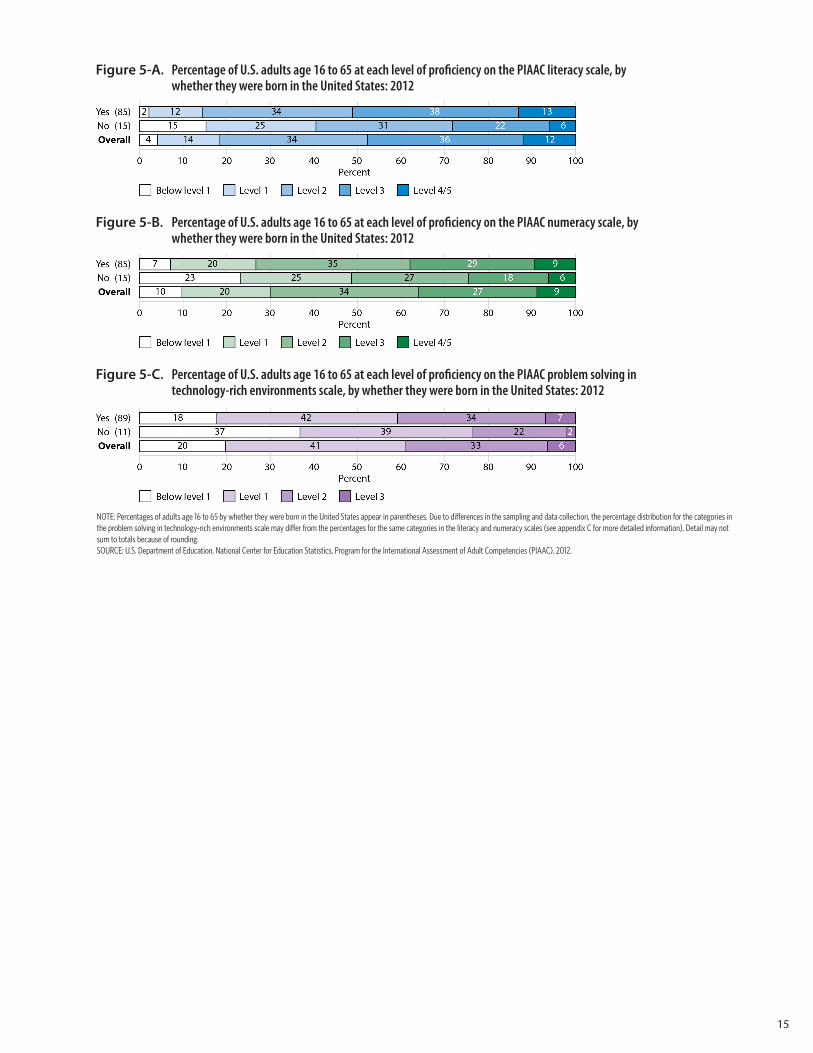
Figure 5-A. Percentage of U.S. adults age 16 to 65 at each level of proficiency on the PIAAC literacy scale, by whether they were born in the United States: 2012
Figure 5-B. Percentage of U.S. adults age 16 to 65 at each level of proficiency on the PIAAC numeracy scale, by whether they were born in the United States: 2012
Figure 5-C. Percentage of U.S. adults age 16 to 65 at each level of proficiency on the PIAAC problem solving in technology-rich environments scale, by whether they were born in the United States: 2012
NOTE: Percentages of adults age 16 to 65 by whether they were born in the United States appear in parentheses. Due to differences in the sampling and data collection, the percentage distribution for the categories in the problem solving in technology-rich environments scale may differ from the percentages for the same categories in the literacy and numeracy scales (see appendix C for more detailed information). Detail may not sum to totals because of rounding.SOURCE: U.S. Department of Education, National Center for Education Statistics, Program for the International Assessment of Adult Competencies (PIAAC), 2012.
15
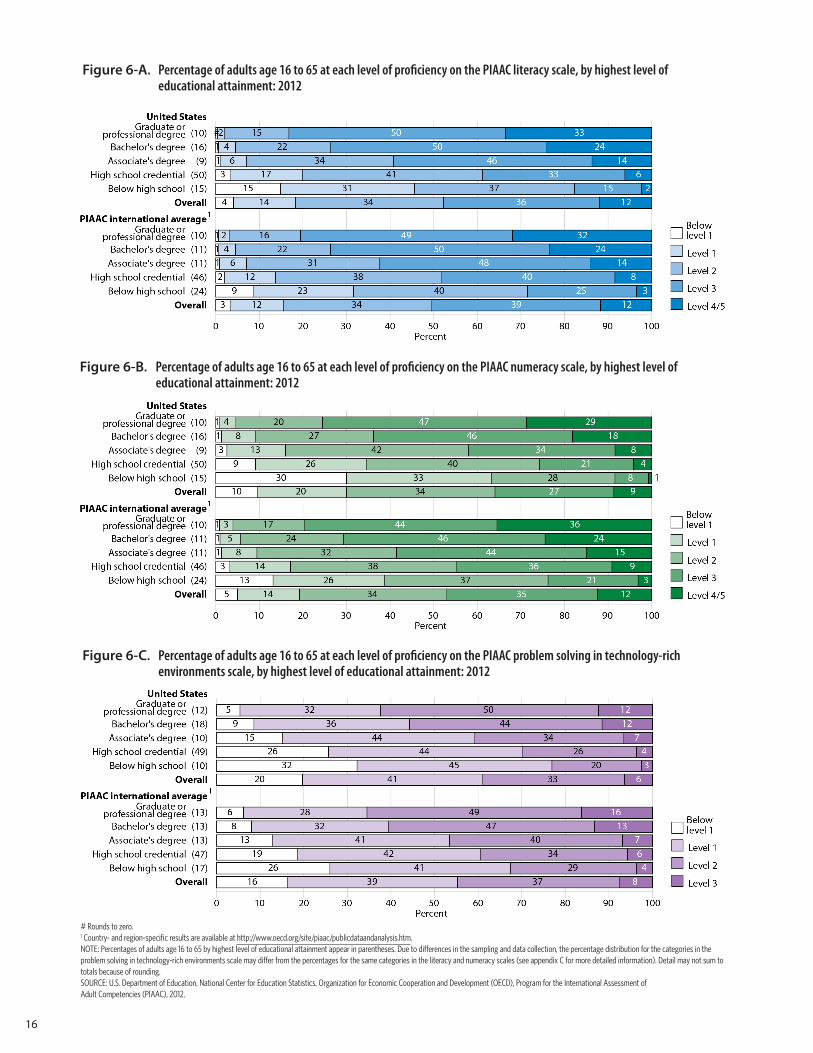
Figure 6-A. Percentage of adults age 16 to 65 at each level of proficiency on the PIAAC literacy scale, by highest level of educational attainment: 2012
Figure 6-B. Percentage of adults age 16 to 65 at each level of proficiency on the PIAAC numeracy scale, by highest level of educational attainment: 2012
Figure 6-C. Percentage of adults age 16 to 65 at each level of proficiency on the PIAAC problem solving in technology-rich environments scale, by highest level of educational attainment: 2012
# Rounds to zero.1 Country- and region-specific results are available at http://www.oecd.org/site/piaac/publicdataandanalysis.htm.NOTE: Percentages of adults age 16 to 65 by highest level of educational attainment appear in parentheses. Due to differences in the sampling and data collection, the percentage distribution for the categories in the problem solving in technology-rich environments scale may differ from the percentages for the same categories in the literacy and numeracy scales (see appendix C for more detailed information). Detail may not sum to totals because of rounding.SOURCE: U.S. Department of Education, National Center for Education Statistics, Organization for Economic Cooperation and Development (OECD), Program for the International Assessment of Adult Competencies (PIAAC), 2012.
16
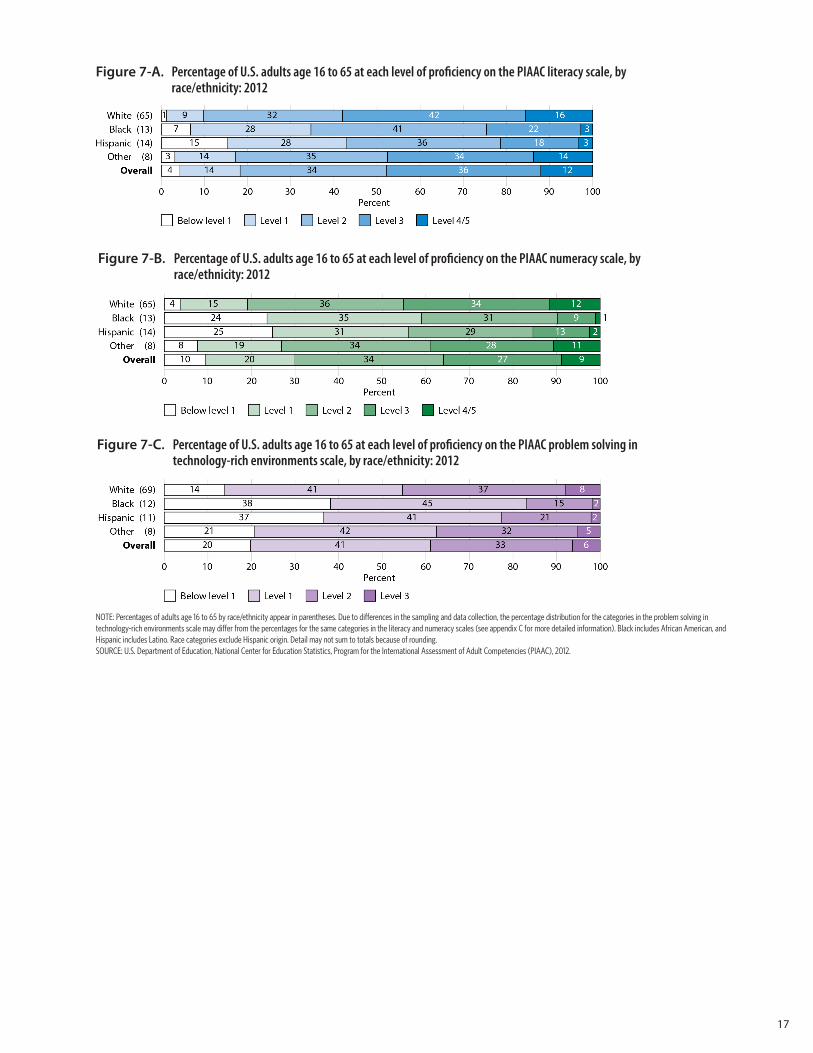
Figure 7-A. Percentage of U.S. adults age 16 to 65 at each level of proficiency on the PIAAC literacy scale, by race/ethnicity: 2012
Figure 7-B. Percentage of U.S. adults age 16 to 65 at each level of proficiency on the PIAAC numeracy scale, by race/ethnicity: 2012
Figure 7-C. Percentage of U.S. adults age 16 to 65 at each level of proficiency on the PIAAC problem solving in technology-rich environments scale, by race/ethnicity: 2012
NOTE: Percentages of adults age 16 to 65 by race/ethnicity appear in parentheses. Due to differences in the sampling and data collection, the percentage distribution for the categories in the problem solving in technology-rich environments scale may differ from the percentages for the same categories in the literacy and numeracy scales (see appendix C for more detailed information). Black includes African American, and Hispanic includes Latino. Race categories exclude Hispanic origin. Detail may not sum to totals because of rounding.SOURCE: U.S. Department of Education, National Center for Education Statistics, Program for the International Assessment of Adult Competencies (PIAAC), 2012.
17
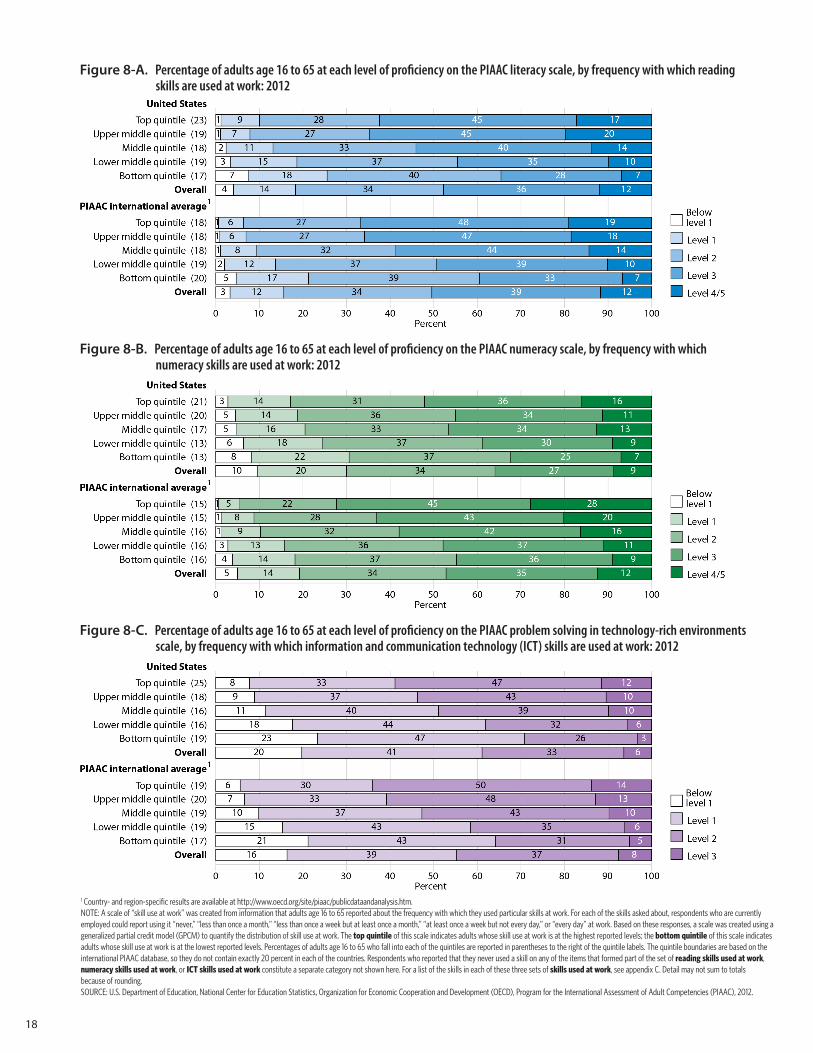
Figure 8-A. Percentage of adults age 16 to 65 at each level of proficiency on the PIAAC literacy scale, by frequency with which reading skills are used at work: 2012
Figure 8-B. Percentage of adults age 16 to 65 at each level of proficiency on the PIAAC numeracy scale, by frequency with which numeracy skills are used at work: 2012
Figure 8-C. Percentage of adults age 16 to 65 at each level of proficiency on the PIAAC problem solving in technology-rich environments scale, by frequency with which information and communication technology (ICT) skills are used at work: 2012
18
1 Country- and region-specific results are available at http://www.oecd.org/site/piaac/publicdataandanalysis.htm.NOTE: A scale of “skill use at work” was created from information that adults age 16 to 65 reported about the frequency with which they used particular skills at work. For each of the skills asked about, respondents who are currently employed could report using it “never,” “less than once a month,” “less than once a week but at least once a month,” “at least once a week but not every day,” or “every day” at work. Based on these responses, a scale was created using a generalized partial credit model (GPCM) to quantify the distribution of skill use at work. The top quintile of this scale indicates adults whose skill use at work is at the highest reported levels; the bottom quintile of this scale indicates adults whose skill use at work is at the lowest reported levels. Percentages of adults age 16 to 65 who fall into each of the quintiles are reported in parentheses to the right of the quintile labels. The quintile boundaries are based on the international PIAAC database, so they do not contain exactly 20 percent in each of the countries. Respondents who reported that they never used a skill on any of the items that formed part of the set of reading skills used at work, numeracy skills used at work, or ICT skills used at work constitute a separate category not shown here. For a list of the skills in each of these three sets of skills used at work, see appendix C. Detail may not sum to totals because of rounding.SOURCE: U.S. Department of Education, National Center for Education Statistics, Organization for Economic Cooperation and Development (OECD), Program for the International Assessment of Adult Competencies (PIAAC), 2012.
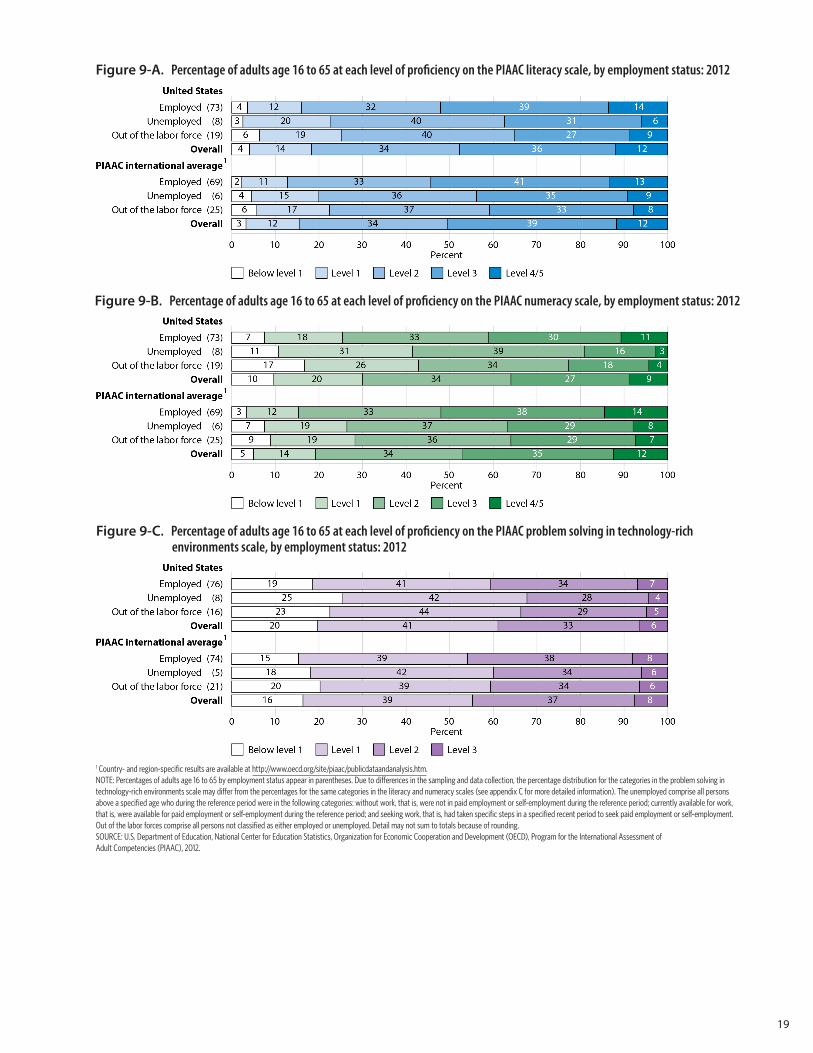
Figure 9-A. Percentage of adults age 16 to 65 at each level of proficiency on the PIAAC literacy scale, by employment status: 2012
Figure 9-B. Percentage of adults age 16 to 65 at each level of proficiency on the PIAAC numeracy scale, by employment status: 2012
Figure 9-C. Percentage of adults age 16 to 65 at each level of proficiency on the PIAAC problem solving in technology-rich environments scale, by employment status: 2012
1 Country- and region-specific results are available at http://www.oecd.org/site/piaac/publicdataandanalysis.htm.NOTE: Percentages of adults age 16 to 65 by employment status appear in parentheses. Due to differences in the sampling and data collection, the percentage distribution for the categories in the problem solving in technology-rich environments scale may differ from the percentages for the same categories in the literacy and numeracy scales (see appendix C for more detailed information). The unemployed comprise all persons above a specified age who during the reference period were in the following categories: without work, that is, were not in paid employment or self-employment during the reference period; currently available for work, that is, were available for paid employment or self-employment during the reference period; and seeking work, that is, had taken specific steps in a specified recent period to seek paid employment or self-employment. Out of the labor forces comprise all persons not classified as either employed or unemployed. Detail may not sum to totals because of rounding.SOURCE: U.S. Department of Education, National Center for Education Statistics, Organization for Economic Cooperation and Development (OECD), Program for the International Assessment of Adult Competencies (PIAAC), 2012.
19
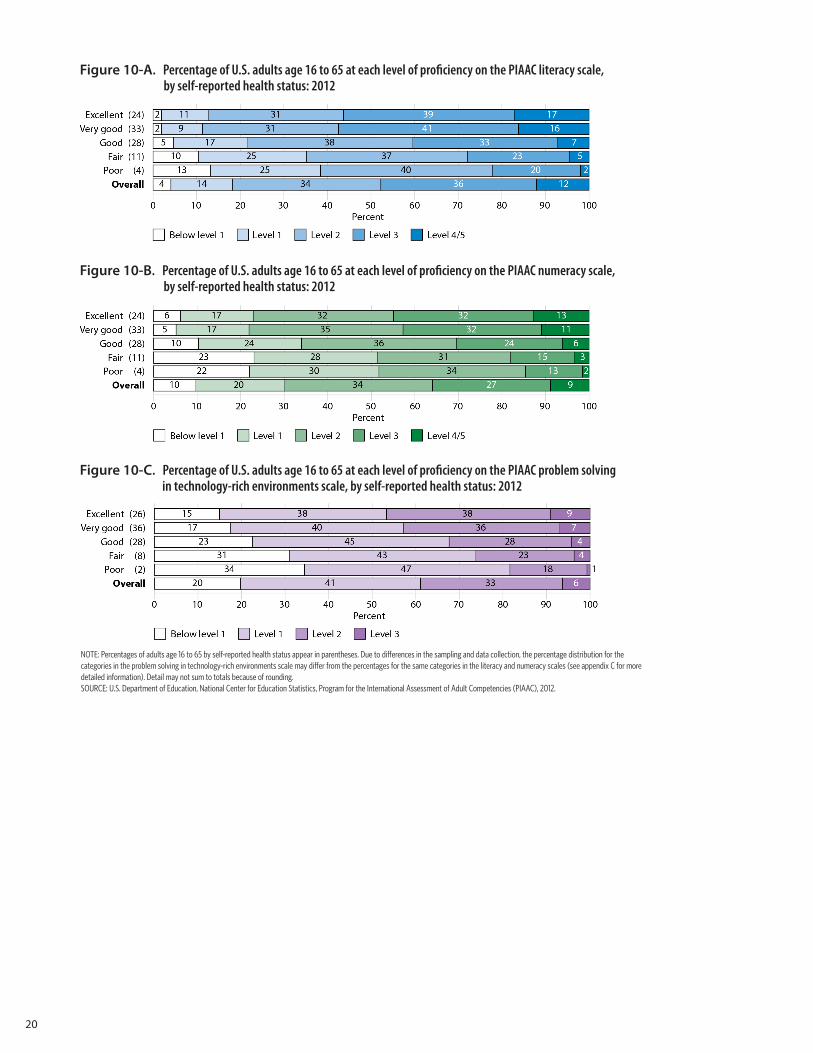
Figure 10-A. Percentage of U.S. adults age 16 to 65 at each level of proficiency on the PIAAC literacy scale, by self-reported health status: 2012
Figure 10-B. Percentage of U.S. adults age 16 to 65 at each level of proficiency on the PIAAC numeracy scale, by self-reported health status: 2012
Figure 10-C. Percentage of U.S. adults age 16 to 65 at each level of proficiency on the PIAAC problem solving in technology-rich environments scale, by self-reported health status: 2012
20
NOTE: Percentages of adults age 16 to 65 by self-reported health status appear in parentheses. Due to differences in the sampling and data collection, the percentage distribution for the categories in the problem solving in technology-rich environments scale may differ from the percentages for the same categories in the literacy and numeracy scales (see appendix C for more detailed information). Detail may not sum to totals because of rounding.SOURCE: U.S. Department of Education, National Center for Education Statistics, Program for the International Assessment of Adult Competencies (PIAAC), 2012.
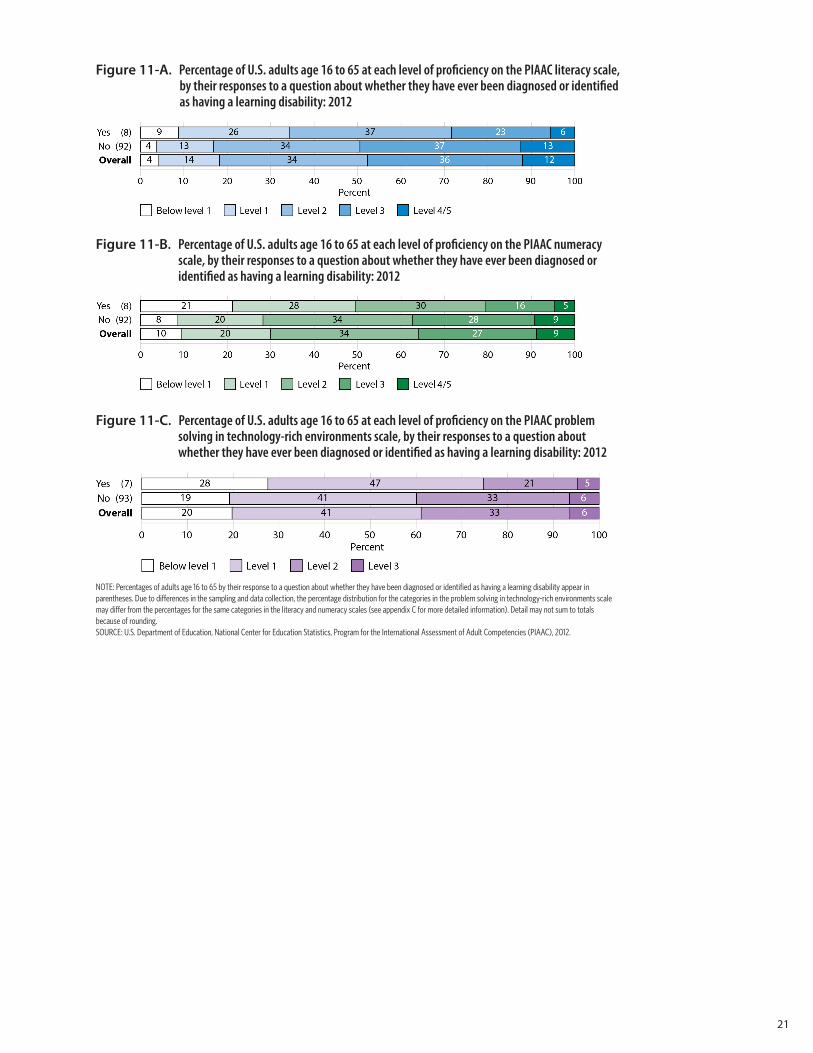
Figure 11-A. Percentage of U.S. adults age 16 to 65 at each level of proficiency on the PIAAC literacy scale, by their responses to a question about whether they have ever been diagnosed or identified as having a learning disability: 2012
Figure 11-B. Percentage of U.S. adults age 16 to 65 at each level of proficiency on the PIAAC numeracy scale, by their responses to a question about whether they have ever been diagnosed or identified as having a learning disability: 2012
Figure 11-C. Percentage of U.S. adults age 16 to 65 at each level of proficiency on the PIAAC problem solving in technology-rich environments scale, by their responses to a question about whether they have ever been diagnosed or identified as having a learning disability: 2012
NOTE: Percentages of adults age 16 to 65 by their response to a question about whether they have been diagnosed or identified as having a learning disability appear in parentheses. Due to differences in the sampling and data collection, the percentage distribution for the categories in the problem solving in technology-rich environments scale may differ from the percentages for the same categories in the literacy and numeracy scales (see appendix C for more detailed information). Detail may not sum to totals because of rounding.SOURCE: U.S. Department of Education, National Center for Education Statistics, Program for the International Assessment of Adult Competencies (PIAAC), 2012.
21
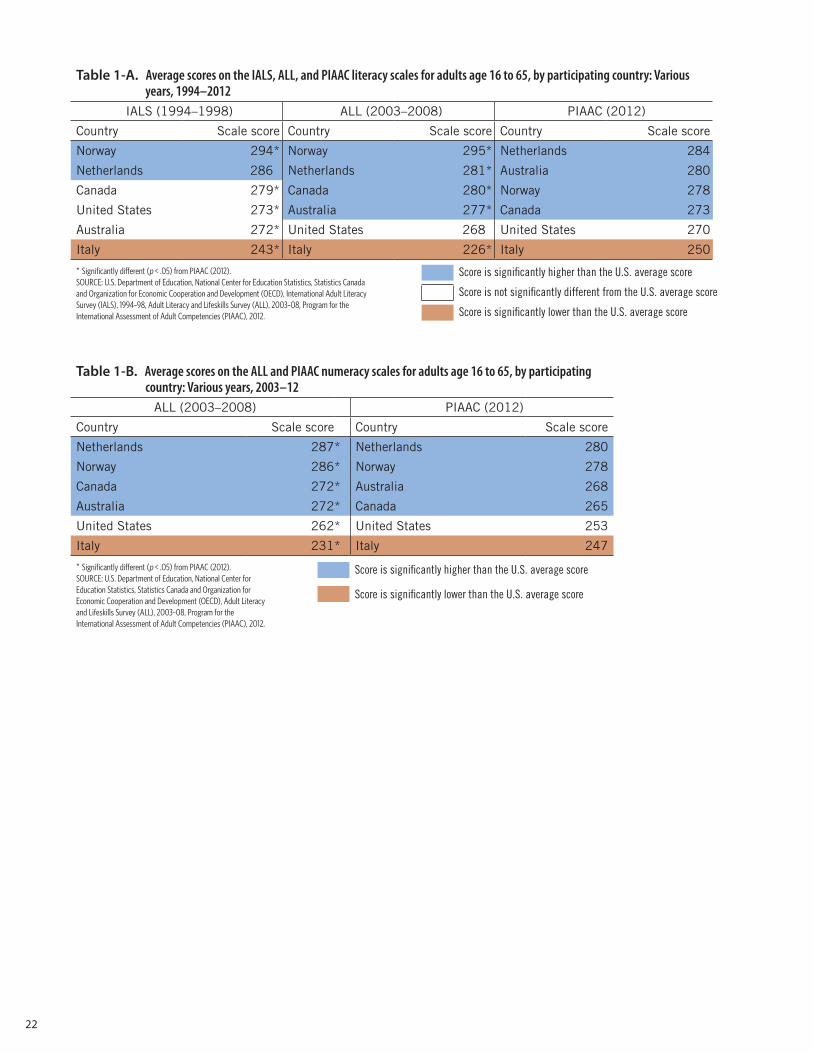
Table 1-A. Average scores on the IALS, ALL, and PIAAC literacy scales for adults age 16 to 65, by participating country: Various years, 1994–2012
22
SOURCE: U.S. Department of Education, National Center for Education Statistics, Statistics Canada and Organization for Economic Cooperation and Development (OECD), International Adult Literacy Survey (IALS), 1994–98, Adult Literacy and Lifeskills Survey (ALL), 2003–08, Program for the International Assessment of Adult Competencies (PIAAC), 2012.
Table 1-B. Average scores on the ALL and PIAAC numeracy scales for adults age 16 to 65, by participating country: Various years, 2003–12
* Significantly different (p < .05) from PIAAC (2012).
* Significantly different (p < .05) from PIAAC (2012).SOURCE: U.S. Department of Education, National Center for Education Statistics, Statistics Canada and Organization for Economic Cooperation and Development (OECD), Adult Literacy and Lifeskills Survey (ALL), 2003–08, Program for the International Assessment of Adult Competencies (PIAAC), 2012.
References Green, F. (2009). Employee Involvement, Technology and Job Tasks. (NIESR Discussion Papers 326).
London. National Institute of Economic and Social Research.
Muraki, E. (1992). A Generalized Partial Credit Model: Application of an EM Algorithm. Applied Psychological Measurement, 16 (2), 159-176.
OECD (2012) Literacy, Numeracy, and Problem Solving in Technology-Rich Environments: Framework for the OECD Survey of Adult Skills, OECD Publishing. http://www.oecd-ilibrary.org/education/literacy-numeracy-and-problem-solving-in-technology-rich-environments_9789264128859-en.
Penfield, R.D., and Bergeron, J.M. (2005). Applying a Weighted Maximum Likelihood Latent Trait Estimator to the Generalized Partial Credit Model. Applied Psychological Measurement, 29 (3): 218-233.
Rust, K.F., and Rao, J.N.K. (1996). Replication Methods for Analyzing Complex Survey Data. Statistical Methods in Medical Research: Special Issue on the Analysis of Complex Surveys, 5: 283-310.
Warm, T.A. (1989). Weighted Likelihood Estimation of Ability in Item Response Theory. Psychometrika, 54: 427-450.
23

This page intentionally left blank.
24
More Information About PIAACThis report is a first look at the PIAAC 2012 results and provides findings for only a few select results. For more PIAAC 2012 results and information about the assessment:
•PreviewandprintaselectionofdataontheperformanceofU.S.adultsonthePIAACassessmentfor various topics across all three domains: http://nces.ed.gov/surveys/piaac/index.asp.
•Findmoreinformationabouttheinternationalresults:http://www.oecd.org/site/piaac/.
•ExplorePIAACdataintheInternationalDataExplorer(IDE):http://www.oecd.org/site/piaac/publicdataandanalysis.htm.
•Accesspublic-usedatafilesthatareavailableathttp://nces.ed.gov/surveys/piaac/index.asp.
•Accessrestricted-usedatafilesthatareavailabletoNCESRestricted-useDataLicensees.Moreinformation on licenses can be found at http://nces.ed.gov/pubsearch/licenses.asp.
25

This page intentionally left blank.
26
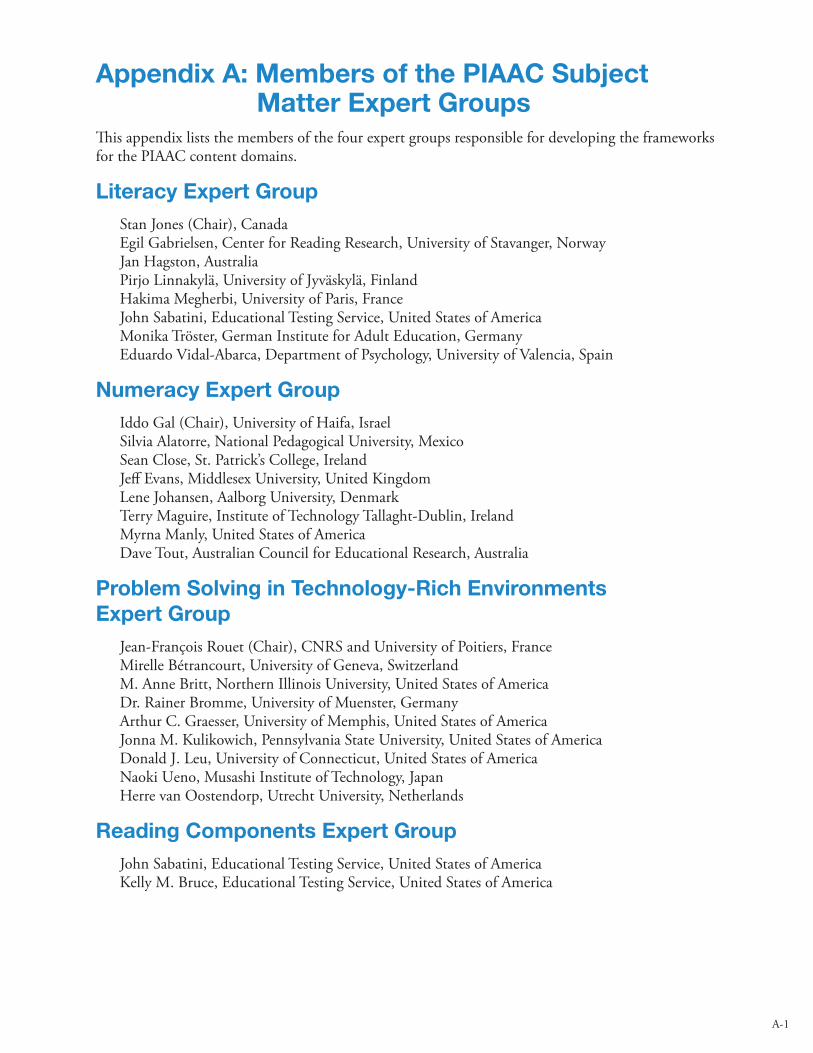
Appendix A: Members of the PIAAC Subject Matter Expert Groups
This appendix lists the members of the four expert groups responsible for developing the frameworks for the PIAAC content domains.
Literacy Expert GroupStan Jones (Chair), CanadaEgil Gabrielsen, Center for Reading Research, University of Stavanger, NorwayJan Hagston, AustraliaPirjo Linnakylä, University of Jyväskylä, FinlandHakima Megherbi, University of Paris, FranceJohn Sabatini, Educational Testing Service, United States of AmericaMonika Tröster, German Institute for Adult Education, GermanyEduardo Vidal-Abarca, Department of Psychology, University of Valencia, Spain
Numeracy Expert GroupIddo Gal (Chair), University of Haifa, IsraelSilvia Alatorre, National Pedagogical University, MexicoSean Close, St. Patrick’s College, IrelandJeff Evans, Middlesex University, United KingdomLene Johansen, Aalborg University, DenmarkTerry Maguire, Institute of Technology Tallaght-Dublin, IrelandMyrna Manly, United States of AmericaDave Tout, Australian Council for Educational Research, Australia
Problem Solving in Technology-Rich Environments Expert Group
Jean-François Rouet (Chair), CNRS and University of Poitiers, FranceMirelle Bétrancourt, University of Geneva, SwitzerlandM. Anne Britt, Northern Illinois University, United States of AmericaDr. Rainer Bromme, University of Muenster, GermanyArthur C. Graesser, University of Memphis, United States of AmericaJonna M. Kulikowich, Pennsylvania State University, United States of AmericaDonald J. Leu, University of Connecticut, United States of AmericaNaoki Ueno, Musashi Institute of Technology, JapanHerre van Oostendorp, Utrecht University, Netherlands
Reading Components Expert GroupJohn Sabatini, Educational Testing Service, United States of AmericaKelly M. Bruce, Educational Testing Service, United States of America
A-1

This page intentionally left blank.
A-2
Appendix B: PIAAC Scales and Proficiency-Level DescriptionsThis appendix describes in more detail the PIAAC scales and the proficiency-level descriptions that accompany these scales. PIAAC proficiency results are also reported in terms of the percentages of adults performing at or “reaching” each of the proficiency levels.
OverviewPIAAC defines four core competency domains of adult cognitive skills that are seen as key to facilitating the social and economic participation of adults in advanced economies:
••••
LiteracyReadingcomponentsNumeracyProblemsolvingintechnology-richenvironments1
As described in appendix C, PIAAC is administered in either paper-and-pencil mode or via computer interface,dependingontheassessmentdomain.Literacyandnumeracyareofferedinbothpaper-and-pencilandcomputermodes.Readingcomponents,whicharedesignedtoprovideinformationabouttheliteracyskillsofadultsatthelowerendoftheliteracyspectrum,areofferedonlyinpaper-and- pencil mode. Problem solving in technology-rich environments is administered via computer only.
TheOECDoverseestheworkofseveralteamsofexpertsinthedevelopmentofassessment frameworksineachofthedomains(seeappendixA).Assessmentframeworksareavailableathttp://www.oecd.org/site/piaac/publications.htm. Information about the item development and proficiency levelsettingprocesswillbeincludedinaforthcomingPIAACtechnicalreportfromOECD.
Literacy
ThePIAACliteracyframeworkexpandsonthedefinitionofliteracypreviouslyusedinIALSandALL.PIAAC broadly defines literacy as “understanding, evaluating, using and engaging with written text to participate in society, to achieve one’s goals and to develop one’s knowledge and potential.”(OrganizationforEconomicCooperationandDevelopment[OECD]2012.)
The purpose of this expanded definition is to highlight the ranges of cognitive processes involved in literacy, focus on a more active role of individuals in society, and include various text types, both in print and electronic formats, in the measurement of literacy.
1Thesedomainswereselectedbasedonprioradultassessmentsofliteracyandnewdevelopmentsinthefieldofadultassessment.
B-1
PIAACitemsincludecontinuoustexts(e.g.,textinsentencesandparagraphs),non-continuoustexts(e.g.,schedules,graphs,andmaps),andelectronictexts(includinghypertextortextininteractiveenvironments,suchasformsandblogs).Taskactivitiesarepresentedinhome,work,andcommunitycontexts, addressing various purposes adults pursue in their everyday lives.
BasedonthePIAACframework,literacytasksincludeitemsinpaper-and-pencilandcomputer-baseddeliverymodesthatcoverarangeofdifficulties—low,middle,andhigh—topresentacomprehensivepicture of the level of adult literacy skills in each country or region.
Reading components
The primary goal of the PIAAC reading components is to provide information about the literacy skills ofadultsatthelowerendoftheliteracyspectrum—specifically,whethertheyhavethefoundationalskills to develop the higher literacy and numeracy abilities necessary to function in society.
The reading components assessment focuses on elements of reading that are comparable across the range of languages in the participating countries and regions: reading vocabulary, sentence comprehen-sion, and basic passage comprehension.
•
•
•
Thereading vocabularysectionasksparticipantstoidentifythebestwordthatshouldbe usedtolabeldifferentgraphicillustrations.Thistaskmeasureswhetherparticipantscan identifycommon,concreteprintwordsusedineverydayadultinteractionsinthecommunity,home,andworkplace.Itisnotmeanttodeterminethevocabularyknowledge(breadthordepth)oftheparticipants.Thesentence comprehensionsectionasksparticipantstoidentifywhethersentencesof varyinggrammatical/syntacticcomplexitymakesense.Thistaskmeasureswhetherpartici- pants can understand and correctly judge the accuracy of the content of sentences.Thebasic passage comprehensionsectionasksparticipantstomakeachoicebetweena correctandanincorrectwordtocompleteasentencewithinapassage.Thistaskmeasureswhetherrespondentscomprehendtextincontextandcanappropriatelyusewordsinways thatcharacterizefluency.
The reading component portion of the assessment is optional for countries and regions participating in PIAAC.Incountriesandregionsthatadoptthereadingcomponentstasks,participantswhodecidenottotakethecomputer-basedassessment,andthosewhofailtopassthecomputer-administeredinformationandcommunicationtechnology(ICT)skillsandliteracy/numeracy“Core”items,aredirectedtothereadingcomponentstasks.(Additionalinformationabouttheadministrationoftheassessmentandthe“Core”itemscanbefoundinappendixC.)DatafromthereadingcomponentsportionoftheassessmentarenotreportedseparatelyinthisFirstLookreport,butcanbeaccessedfromtheInternationalDataExplorer(IDE)athttp://www.oecd.org/site/piaac/publicdataandanalysis.htm.
B-2
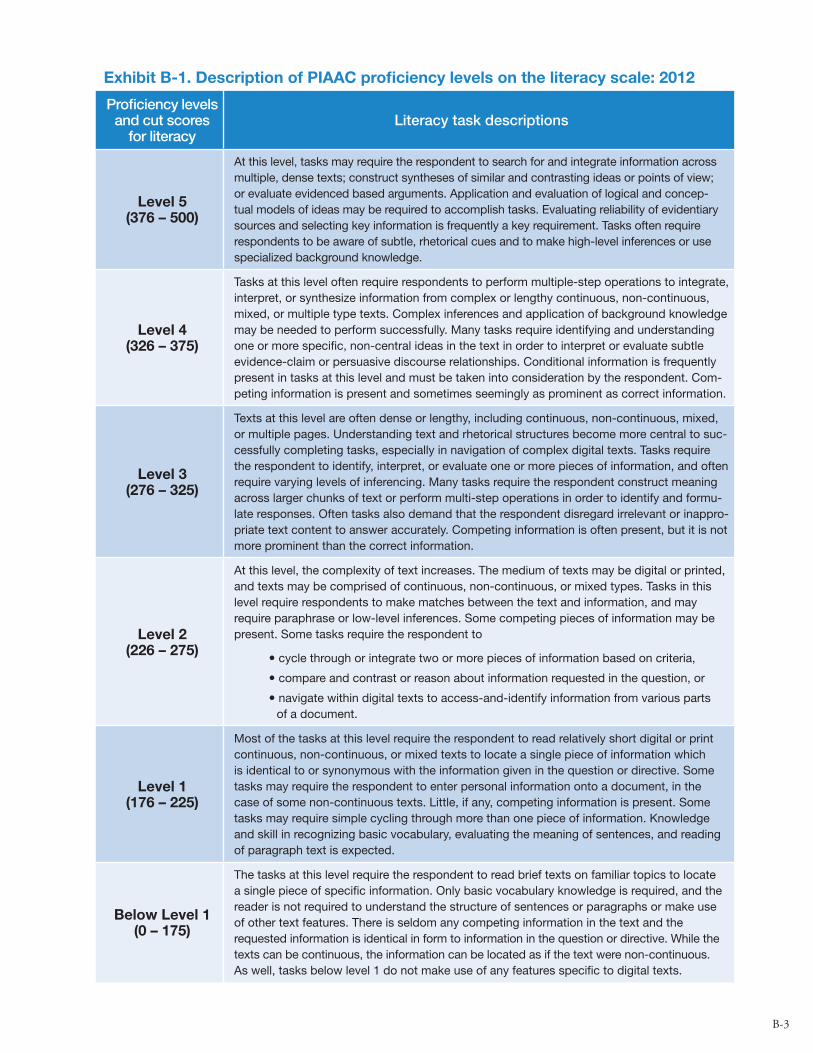
Exhibit B-1. Description of PIAAC proficiency levels on the literacy scale: 2012
Proficiency levels and cut scores
for literacyLiteracy task descriptions
Level 5 (376 – 500)
At this level, tasks may require the respondent to search for and integrate information across multiple, dense texts; construct syntheses of similar and contrasting ideas or points of view; or evaluate evidenced based arguments. Application and evaluation of logical and concep-tual models of ideas may be required to accomplish tasks. Evaluating reliability of evidentiary sources and selecting key information is frequently a key requirement. Tasks often require respondents to be aware of subtle, rhetorical cues and to make high-level inferences or use specialized background knowledge.
Level 4 (326 – 375)
Tasks at this level often require respondents to perform multiple-step operations to integrate, interpret, or synthesize information from complex or lengthy continuous, non-continuous, mixed, or multiple type texts. Complex inferences and application of background knowledge may be needed to perform successfully. Many tasks require identifying and understanding one or more specific, non-central ideas in the text in order to interpret or evaluate subtle evidence-claim or persuasive discourse relationships. Conditional information is frequently present in tasks at this level and must be taken into consideration by the respondent. Com-peting information is present and sometimes seemingly as prominent as correct information.
Level 3 (276 – 325)
Texts at this level are often dense or lengthy, including continuous, non-continuous, mixed, or multiple pages. Understanding text and rhetorical structures become more central to suc-cessfully completing tasks, especially in navigation of complex digital texts. Tasks require the respondent to identify, interpret, or evaluate one or more pieces of information, and often require varying levels of inferencing. Many tasks require the respondent construct meaning across larger chunks of text or perform multi-step operations in order to identify and formu-late responses. Often tasks also demand that the respondent disregard irrelevant or inappro-priate text content to answer accurately. Competing information is often present, but it is not more prominent than the correct information.
Level 2 (226 – 275)
At this level, the complexity of text increases. The medium of texts may be digital or printed, and texts may be comprised of continuous, non-continuous, or mixed types. Tasks in this level require respondents to make matches between the text and information, and may require paraphrase or low-level inferences. Some competing pieces of information may be present. Some tasks require the respondent to
� cycle through or integrate two or more pieces of information based on criteria,
� compare and contrast or reason about information requested in the question, or
� navigate within digital texts to access-and-identify information from various parts of a document.
Level 1 (176 – 225)
Most of the tasks at this level require the respondent to read relatively short digital or print continuous, non-continuous, or mixed texts to locate a single piece of information which is identical to or synonymous with the information given in the question or directive. Some tasks may require the respondent to enter personal information onto a document, in the case of some non-continuous texts. Little, if any, competing information is present. Some tasks may require simple cycling through more than one piece of information. Knowledge and skill in recognizing basic vocabulary, evaluating the meaning of sentences, and reading of paragraph text is expected.
Below Level 1 (0 – 175)
The tasks at this level require the respondent to read brief texts on familiar topics to locate a single piece of specific information. Only basic vocabulary knowledge is required, and the reader is not required to understand the structure of sentences or paragraphs or make use of other text features. There is seldom any competing information in the text and the requested information is identical in form to information in the question or directive. While the texts can be continuous, the information can be located as if the text were non-continuous. As well, tasks below level 1 do not make use of any features specific to digital texts.
B-3
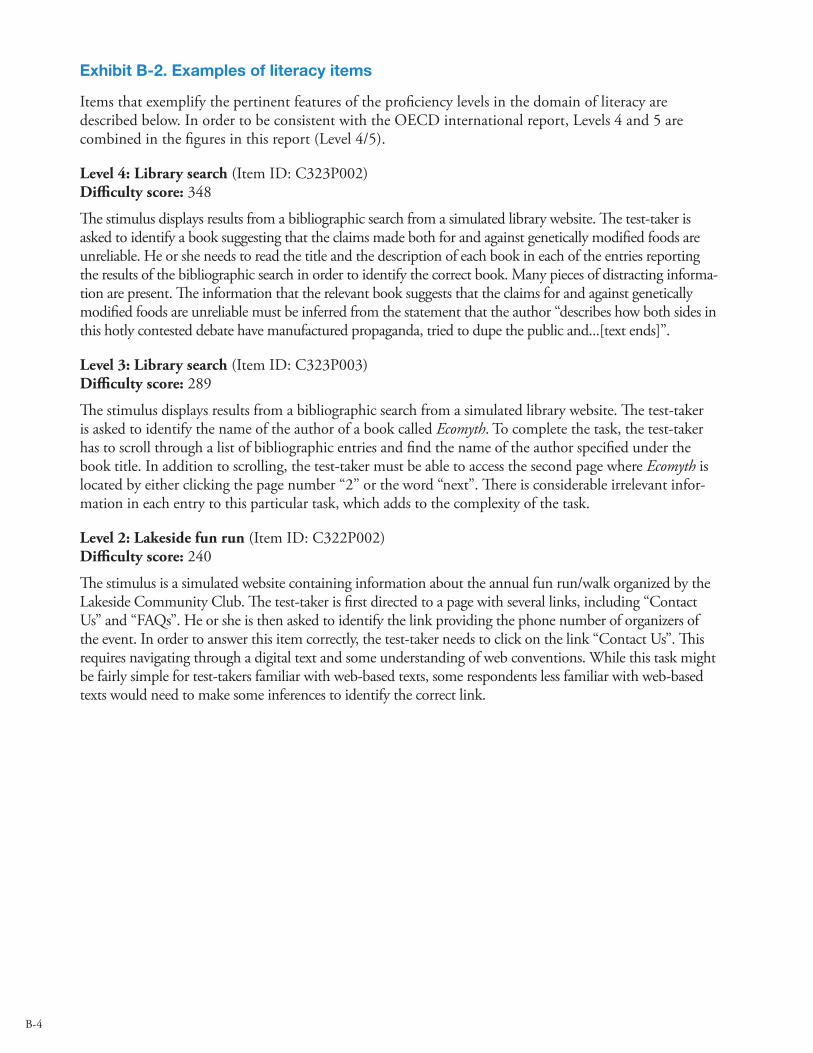
Exhibit B-2. Examples of literacy items
Items that exemplify the pertinent features of the proficiency levels in the domain of literacy are describedbelow.InordertobeconsistentwiththeOECDinternationalreport,Levels4and5arecombinedinthefiguresinthisreport(Level4/5).
Level 4: Library search(ItemID:C323P002)Difficulty score:348
Thestimulusdisplaysresultsfromabibliographicsearchfromasimulatedlibrarywebsite.Thetest-takerisasked to identify a book suggesting that the claims made both for and against genetically modified foods are unreliable. He or she needs to read the title and the description of each book in each of the entries reporting the results of the bibliographic search in order to identify the correct book. Many pieces of distracting informa-tion are present. The information that the relevant book suggests that the claims for and against genetically modifiedfoodsareunreliablemustbeinferredfromthestatementthattheauthor“describeshowbothsidesinthis hotly contested debate have manufactured propaganda, tried to dupe the public and...[text ends]”.
Level 3: Library search(ItemID:C323P003)Difficulty score:289
Thestimulusdisplaysresultsfromabibliographicsearchfromasimulatedlibrarywebsite.Thetest-takeris asked to identify the name of the author of a book called Ecomyth.Tocompletethetask,thetest-takerhas to scroll through a list of bibliographic entries and find the name of the author specified under the booktitle.Inadditiontoscrolling,thetest-takermustbeabletoaccessthesecondpagewhereEcomyth is locatedbyeitherclickingthepagenumber“2”ortheword“next”.Thereisconsiderableirrelevantinfor-mationineachentrytothisparticulartask,whichaddstothecomplexityofthetask.
Level 2: Lakeside fun run(ItemID:C322P002)Difficulty score:240
Thestimulusisasimulatedwebsitecontaininginformationabouttheannualfunrun/walkorganizedbytheLakesideCommunityClub.Thetest-takerisfirstdirectedtoapagewithseverallinks,including“ContactUs”and“FAQs”.Heorsheisthenaskedtoidentifythelinkprovidingthephonenumberoforganizersoftheevent.Inordertoanswerthisitemcorrectly,thetest-takerneedstoclickonthelink“ContactUs”.Thisrequiresnavigatingthroughadigitaltextandsomeunderstandingofwebconventions.Whilethistaskmightbefairlysimplefortest-takersfamiliarwithweb-basedtexts,somerespondentslessfamiliarwithweb-basedtextswouldneedtomakesomeinferencestoidentifythecorrectlink.
B-4
Level 1: Generic medicine(ItemID:C309A321)Difficulty score:219
Thestimulusisashortnewspaperarticleentitled“Genericmedicines:NotfortheSwiss”.Ithastwoparagraphsandatableinthemiddledisplayingthemarketshareofgenericmedicinesin14EuropeancountriesandtheUnitedStates.Thetest-takerisaskedtodeterminethenumberofcountriesinwhichthe generic drug market accounts for 10 percent or more of total drug sales. The test-taker has to count thenumberofcountrieswithamarketsharegreaterthan10percent.Thepercentagesaresortedindescendingordertofacilitatethesearch.Thephrase“drugsales”,however,doesnotappearinthetext;therefore, the test-taker needs to understand that “market share” is a synonym for “drug sales” in order toanswerthequestion.
Below Level 1: Election results(ItemID:C302BC02)Difficulty score: 162
The stimulus consists of a short report of the results of a union election containing several brief paragraphs and a simple table identifying the three candidates in the election and the number of votes they received. Thetest-takerisaskedtoidentifywhichcandidatereceivedthefewestvotes.Heorsheneedstocomparethenumberofvotesthatthethreecandidatesreceivedandidentifythenameofthecandidatewhoreceivedthefewestvotes.Theword“votes”appearsinboththequestionandinthetableandnowhereelseinthetext.
B-5
Numeracy
The primary goal of PIAAC’s numeracy assessment is to evaluate basic mathematical and computationalskillsthatareconsideredfundamentalforfunctioningineverydayworkandsocial life.NumeracyinthePIAACframeworkisdefinedas“the ability to access, use, interpret, and com- municate mathematical information and ideas, to engage in and manage mathematical demands of a range of situations in adult life.”(OrganizationforEconomicCooperationandDevelopment[OECD]2012.)
The PIAAC numeracy domain is built on previous large-scale assessments of this domain, school-orientedassessments,andareviewofrequirementsofworkplaceskills,adultlearning,andmathematicsand statistics education. The tasks that measure this domain involve managing a situation or solving a probleminapracticalcontext—inhome,work,orcommunitysettings.Thesetasksaskrespondents toworkwithnumbers,proportions,measurements,andstatisticalconcepts,andthencallforpartici-pants to compute, interpret, and communicate the results and mathematical content. The situations and problems presented in these tasks involve objects or pictures, text, numbers, graphs, and technology-based displays. They also require basic mathematical skills in computation, proportions andpercentages,anunderstandingofmeasurementconceptsandprocedures,andworkingwithsimpleformulas.Respondentsalsoencountermorecomplexitemsthatrequireusingmodelstopredictfutureneeds, and an understanding of basic statistical concepts and displays.
In addition, PIAAC numeracy assessment items
• aresetinauthenticandculturallyappropriatecontexts,•measuredifferentlevelsofability,and•usethestandardmeasuringsystemsoftheparticipatingcountryorregion.
Numeracytasksincludeitemsinpaper-and-pencilandcomputer-baseddeliverymodesthatcoverarangeofdifficulties—low,middle,andhigh—topresentacomprehensivepictureofthelevelofadultnumeracyskills in each country or region.
B-6
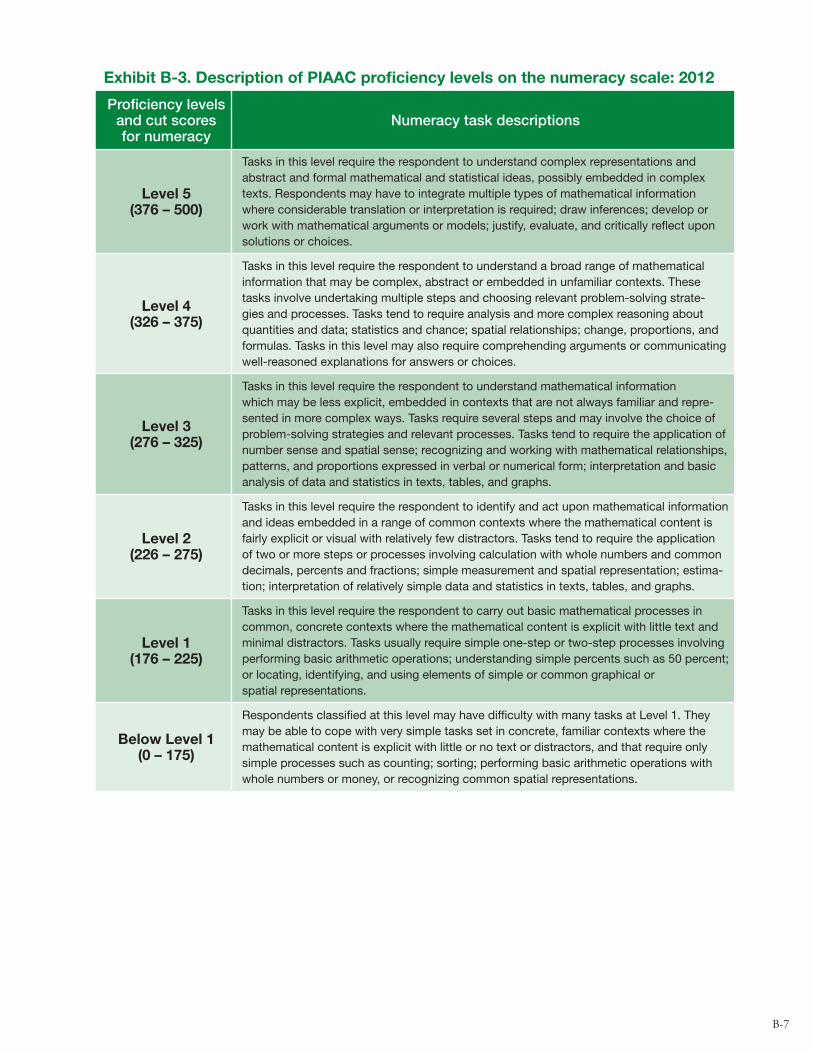
Exhibit B-3. Description of PIAAC proficiency levels on the numeracy scale: 2012
Proficiency levels and cut scores for numeracy
Numeracy task descriptions
Level 5 (376 – 500)
Tasks in this level require the respondent to understand complex representations and abstract and formal mathematical and statistical ideas, possibly embedded in complex texts. Respondents may have to integrate multiple types of mathematical information where considerable translation or interpretation is required; draw inferences; develop or work with mathematical arguments or models; justify, evaluate, and critically reflect upon solutions or choices.
Level 4 (326 – 375)
Tasks in this level require the respondent to understand a broad range of mathematical information that may be complex, abstract or embedded in unfamiliar contexts. These tasks involve undertaking multiple steps and choosing relevant problem-solving strate-gies and processes. Tasks tend to require analysis and more complex reasoning about quantities and data; statistics and chance; spatial relationships; change, proportions, and formulas. Tasks in this level may also require comprehending arguments or communicating well-reasoned explanations for answers or choices.
Level 3 (276 – 325)
Tasks in this level require the respondent to understand mathematical information which may be less explicit, embedded in contexts that are not always familiar and repre-sented in more complex ways. Tasks require several steps and may involve the choice of problem-solving strategies and relevant processes. Tasks tend to require the application of number sense and spatial sense; recognizing and working with mathematical relationships, patterns, and proportions expressed in verbal or numerical form; interpretation and basic analysis of data and statistics in texts, tables, and graphs.
Level 2 (226 – 275)
Tasks in this level require the respondent to identify and act upon mathematical information and ideas embedded in a range of common contexts where the mathematical content is fairly explicit or visual with relatively few distractors. Tasks tend to require the application of two or more steps or processes involving calculation with whole numbers and common decimals, percents and fractions; simple measurement and spatial representation; estima-tion; interpretation of relatively simple data and statistics in texts, tables, and graphs.
Level 1 (176 – 225)
Tasks in this level require the respondent to carry out basic mathematical processes in common, concrete contexts where the mathematical content is explicit with little text and minimal distractors. Tasks usually require simple one-step or two-step processes involving performing basic arithmetic operations; understanding simple percents such as 50 percent; or locating, identifying, and using elements of simple or common graphical or spatial representations.
Below Level 1 (0 – 175)
Respondents classified at this level may have difficulty with many tasks at Level 1. They may be able to cope with very simple tasks set in concrete, familiar contexts where the mathematical content is explicit with little or no text or distractors, and that require only simple processes such as counting; sorting; performing basic arithmetic operations with whole numbers or money, or recognizing common spatial representations.
B-7
Exhibit B-4. Examples of numeracy items
Items that exemplify the pertinent features of the proficiency levels in the domain of numeracy are describedbelow.InordertobeconsistentwiththeOECDinternationalreport,Levels4and5arecombinedinthefiguresinthisreport(Level4/5).Noitemsmappedatlevel5innumeracy.
Level 4: Education level(ItemID:C632P001)Difficulty score:354
Thestimulusforthisitemconsistsoftwostacked-columnbargraphspresentingthedistributionoftheMexicanpopulationbyyearsofschoolingformenandwomenseparately.They-axisofeachofthegraphsislabeled“percentage”with6gridlineslabeled“0%”,“20%”,“40%”,“60%”,“80%”,and“100%”.Thex-axisislabeled“year”anddataispresentedfor1960,1970,1990,2000,and2005.Alegendidentifiesthreecategories of schooling: “more than 6 years of schooling”, “up to 6 years of schooling”, and “no schooling”. Thetest-takerisaskedtoapproximatewhatpercentageofmeninMexicohadmorethan6yearsofschoolingin1970,choosingfromapull-downmenuthathas10responsecategories:“0-10%”,“10-20%”,andsoon.
Level 3: Package(ItemID:C657P001)Difficulty score:315
The stimulus for this item consists of an illustration of a box constructed from folded cardboard. The dimensionsofthecardboardbaseareidentified.Thetest-takerisaskedtoidentifywhichplanbest represents the assembled box out of four plans presented in the stimulus.
Level 2: Logbook(ItemID:C613A520)Difficulty score:250
Thestimulusforthisitemconsistsofapagefromamotorvehiclelogbookwithcolumnsforthedateofthetrip(startandfinish),thepurposeofthetrip,theodometerreading(startandfinish),thedistancetravelled,thedateofentryandthedriver’snameandsignature.Forthefirstdateoftravel(June5),thecolumn for the distance travelled is completed. The instructions inform the test-taker that “a salesman driveshisowncarandmustkeeparecordofthemileshetravelsinaMotorVehicleLog.Whenhetravels,hisemployerpayshim$0.35permileplus$40.00perdayforvariouscostssuchasmeals.”Thetest-takerisaskedtocalculatehowmuchhewillbepaidforthetriponJune5.
B-8
Level 1: Candles(ItemID:C615A602)Difficulty score: 221
The stimulus for this item consists of a photo of a box containing tea light candles. The packaging identi-fiestheproduct(tealightcandles),thenumberofcandlesinthebox(105candles)anditsweight.Whilethe packaging partially covers the top layer of candles, it can be seen that the candles are packed in five rowsofsevencandleseach.Theinstructionsinformthetest-takerthatthereare105candlesinaboxandaskshimorhertocalculatehowmanylayersofcandlesarepackedinthebox.
Below Level 1: Price tag (ItemID:C602A501)Difficulty score:168
The stimulus for this item consists of four supermarket price tags. These identify the product, the price per pound,thenetweight,thedatepackedandthetotalprice.Thetest-takerisaskedtoindicatetheitemthatwaspackedfirstbysimplycomparingthedatesonthepricetags.
B-9
Problem solving in technology-rich environments
PIAAC represents the first attempt to assess problem solving in technology-rich environments on a large scale and as a single dimension in an international context. PIAAC defines problem solving in technology-rich environments as “using digital technology, communication tools, and networks to acquire and evaluate information, communicate with others, and perform practical tasks.” (OrganizationforEconomicCooperationandDevelopment[OECD],2012.)
Digitaltechnologyhasrevolutionizedaccesstoinformationandcommunicationcapabilitiesoverthepasttwodecades.Inparticular,theInternethasincreasedinstantaneousaccesstolargeamountsofinformation and has expanded instant voice, text, and graphics capabilities across the globe. In order to effectivelyoperateintheseenvironments,itisnecessarytohave
•
•
knowledgeofhowvarioustechnologicalenvironmentsarestructured(e.g.,anunderstanding ofthebasicsoftheenvironment,includinghowtousecommandnames,drop-downmenus,namingprotocolsforfilesandfolders,andlinksinawebpage);andtheabilitytointeracteffectivelywithdigitalinformation;understandelectronictexts,images,graphics,andnumericaldata;andlocate,evaluate,andcriticallyjudgethevalidity,accuracy,and appropriateness of the accessed information.
These skills constitute the core aspects of the problem solving in technology-rich environments domain.
Itemsinthisdomainpresenttasksofvaryingdifficultyinsimulatedsoftwareapplicationsusing commandsandfunctionscommonlyfoundinemail,webpages,andspreadsheets.Thesetasksrangefrom purchasing particular goods or services online and finding interactive health information to managing personal information and business finances.
PIAACrecognizesthediversityofdigitaltechnologiesandthefactthattheyareevolvingatarapidpace,butduetoimplementationconstraints,thefirstroundofPIAACwaslimitedtousingcom- putersandsimulatedcomputernetworks.Thetasksassessingproblemsolvingintechnology-richenvironmentswereonlyadministeredviacomputerandthereforeonlythosetakingthecomputerizedassessment received a score in this domain.
B-10
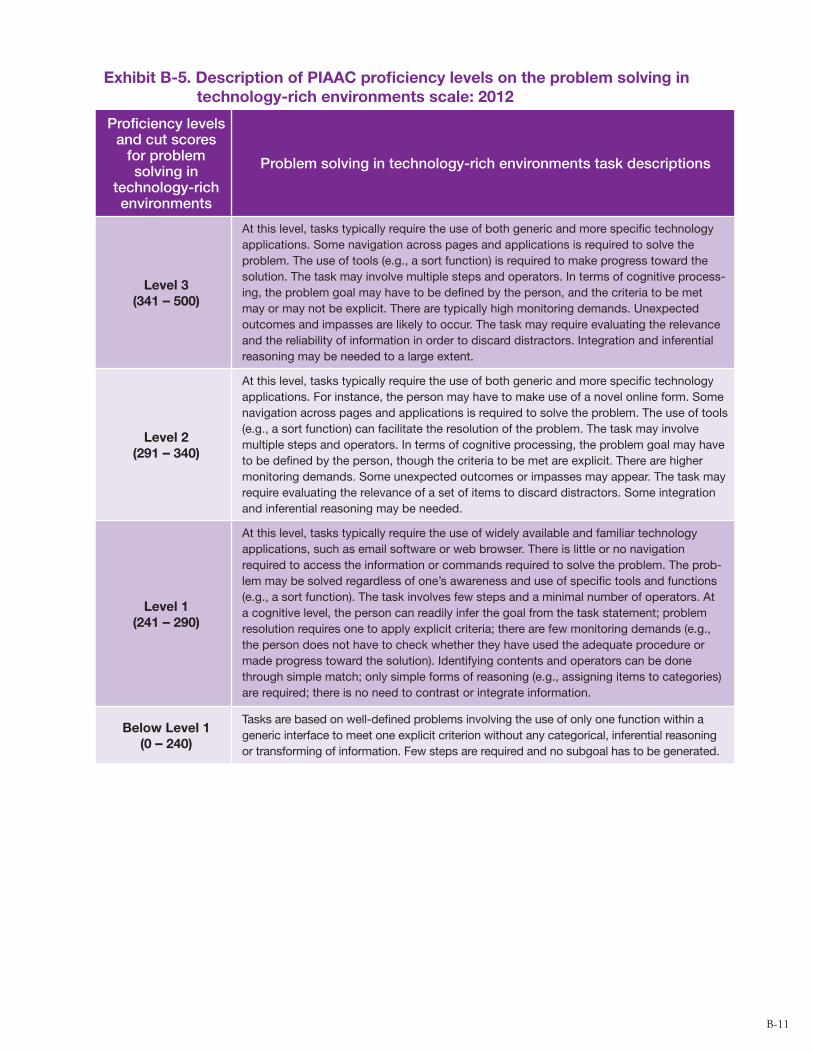
Exhibit B-5. Description of PIAAC proficiency levels on the problem solving in technology-rich environments scale: 2012
Proficiency levels and cut scores
for problem solving in
technology-rich environments
Problem solving in technology-rich environments task descriptions
Level 3 (341 – 500)
At this level, tasks typically require the use of both generic and more specific technology applications. Some navigation across pages and applications is required to solve the problem. The use of tools (e.g., a sort function) is required to make progress toward the solution. The task may involve multiple steps and operators. In terms of cognitive process-ing, the problem goal may have to be defined by the person, and the criteria to be met may or may not be explicit. There are typically high monitoring demands. Unexpected outcomes and impasses are likely to occur. The task may require evaluating the relevance and the reliability of information in order to discard distractors. Integration and inferential reasoning may be needed to a large extent.
Level 2 (291 – 340)
At this level, tasks typically require the use of both generic and more specific technology applications. For instance, the person may have to make use of a novel online form. Some navigation across pages and applications is required to solve the problem. The use of tools (e.g., a sort function) can facilitate the resolution of the problem. The task may involve multiple steps and operators. In terms of cognitive processing, the problem goal may have to be defined by the person, though the criteria to be met are explicit. There are higher monitoring demands. Some unexpected outcomes or impasses may appear. The task may require evaluating the relevance of a set of items to discard distractors. Some integration and inferential reasoning may be needed.
Level 1 (241 – 290)
At this level, tasks typically require the use of widely available and familiar technology applications, such as email software or web browser. There is little or no navigation required to access the information or commands required to solve the problem. The prob-lem may be solved regardless of one’s awareness and use of specific tools and functions (e.g., a sort function). The task involves few steps and a minimal number of operators. At a cognitive level, the person can readily infer the goal from the task statement; problem resolution requires one to apply explicit criteria; there are few monitoring demands (e.g., the person does not have to check whether they have used the adequate procedure or made progress toward the solution). Identifying contents and operators can be done through simple match; only simple forms of reasoning (e.g., assigning items to categories) are required; there is no need to contrast or integrate information.
Below Level 1 (0 – 240)
Tasks are based on well-defined problems involving the use of only one function within a generic interface to meet one explicit criterion without any categorical, inferential reasoning or transforming of information. Few steps are required and no subgoal has to be generated.
B-11
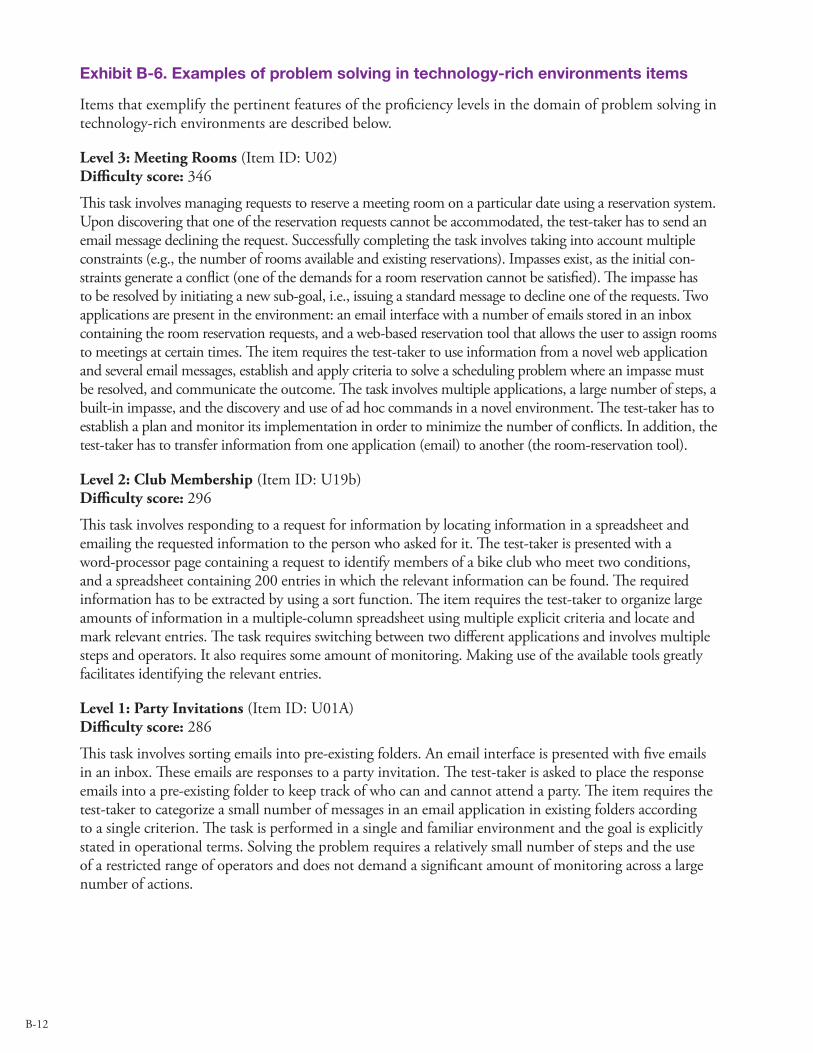
Exhibit B-6. Examples of problem solving in technology-rich environments items
Items that exemplify the pertinent features of the proficiency levels in the domain of problem solving in technology-richenvironmentsaredescribedbelow.
Level 3: Meeting Rooms(ItemID:U02)Difficulty score:346
This task involves managing requests to reserve a meeting room on a particular date using a reservation system. Upon discovering that one of the reservation requests cannot be accommodated, the test-taker has to send an emailmessagedecliningtherequest.Successfullycompletingthetaskinvolvestakingintoaccountmultipleconstraints(e.g.,thenumberofroomsavailableandexistingreservations).Impassesexist,astheinitialcon-straintsgenerateaconflict(oneofthedemandsforaroomreservationcannotbesatisfied).Theimpassehastoberesolvedbyinitiatinganewsub-goal,i.e.,issuingastandardmessagetodeclineoneoftherequests.Twoapplicationsarepresentintheenvironment:anemailinterfacewithanumberofemailsstoredinaninboxcontainingtheroomreservationrequests,andaweb-basedreservationtoolthatallowstheusertoassignroomstomeetingsatcertaintimes.Theitemrequiresthetest-takertouseinformationfromanovelwebapplicationandseveralemailmessages,establishandapplycriteriatosolveaschedulingproblemwhereanimpassemustbe resolved, and communicate the outcome. The task involves multiple applications, a large number of steps, a built-in impasse, and the discovery and use of ad hoc commands in a novel environment. The test-taker has to establishaplanandmonitoritsimplementationinordertominimizethenumberofconflicts.Inaddition,thetest-takerhastotransferinformationfromoneapplication(email)toanother(theroom-reservationtool).
Level 2: Club Membership(ItemID:U19b)Difficulty score: 296
This task involves responding to a request for information by locating information in a spreadsheet and emailingtherequestedinformationtothepersonwhoaskedforit.Thetest-takerispresentedwithaword-processorpagecontainingarequesttoidentifymembersofabikeclubwhomeettwoconditions,andaspreadsheetcontaining200entriesinwhichtherelevantinformationcanbefound.Therequiredinformationhastobeextractedbyusingasortfunction.Theitemrequiresthetest-takertoorganizelargeamounts of information in a multiple-column spreadsheet using multiple explicit criteria and locate and markrelevantentries.Thetaskrequiresswitchingbetweentwodifferentapplicationsandinvolvesmultiplesteps and operators. It also requires some amount of monitoring. Making use of the available tools greatly facilitates identifying the relevant entries.
Level 1: Party Invitations(ItemID:U01A)Difficulty score:286
Thistaskinvolvessortingemailsintopre-existingfolders.Anemailinterfaceispresentedwithfiveemailsin an inbox. These emails are responses to a party invitation. The test-taker is asked to place the response emailsintoapre-existingfoldertokeeptrackofwhocanandcannotattendaparty.Theitemrequiresthetest-takertocategorizeasmallnumberofmessagesinanemailapplicationinexistingfoldersaccordingto a single criterion. The task is performed in a single and familiar environment and the goal is explicitly statedinoperationalterms.Solvingtheproblemrequiresarelativelysmallnumberofstepsandtheuseof a restricted range of operators and does not demand a significant amount of monitoring across a large number of actions.
B-12
Appendix C: Methodology and Technical NotesThis appendix describes the assessment design, sampling, data collection, weighting, and variance estimation, scaling, and statistical testing procedures used to collect and analyze the data for PIAAC. PIAAC’s household data collection was conducted from August 25, 2011 through April 3, 2012.
Assessment DesignThe PIAAC psychometric assessment design was complex because the assessment measured four domains—literacy, numeracy, reading components, and problem solving in technology-rich environ-ments—across two modes of administration—paper-and-pencil and computer instruments. In sum-mary, the PIAAC psychometric assessment design provided for the following information:
•
•
••
•
•
•
Readingcomponentskillsamonglowerperformingadultsineachparticipatingcountry,aswellasamongthosewhoreportednotknowinghowtouseacomputer.Populationdistributionsinliteracy,whichcouldbelinkedtotheInternationalAdultLiteracySurvey(IALS)andAdultLiteracyandLifeskillsSurvey(ALL).Populationdistributionsinnumeracy,whichcouldbelinkedtoALL.Accurateestimatesofpopulationdistributionsandabaselinemeasureofproblemsolvingintechnology-rich environments for future estimation of trends over time.Insightsintostrategiesandprocessesthatadultsusewhentheyrespondedtothetaskson problem solving in technology-rich environments.Pairwisecovarianceestimatesamongthevariousmeasures,includingtherelationshipsbetweenliteracyandnumeracy,literacyandreadingcomponentsskills,literacyandproblemsolvingintechnology-richenvironments,numeracyandreadingcomponentsskills,andnumeracyandproblem solving in technology-rich environments.Informationthatcouldbeusedtoanalyzetherelationshipbetweenthemeasuredcompetenciesand the PIAAC behavioral measures and social/economic measures (from the responses to the backgroundquestionsandjobrequirementsapproachmodule,explainedin“OverviewoftheSkillUseScalesinPIAAC”).
PIAACwasdesignedasacomputer-basedassessment.Respondentswhohadlittleornofamiliaritywith computers, however, were directed to a pencil-and-paper version of the assessment that tested skillsinthedomainsofliteracyandnumeracyonly.Approximately15percentoftherespondentsweredirectedtothepaper-and-pencilpath.Regardlessofwhethertheytooktheassessmentinthecomputerorpencil-and-paperformat,allrespondentsfirsttooka“Core”testtoassesstheircapacitytoundertakethe full assessment. Those who were unsuccessful at the Core test were directed to the assessment of reading components. Those who succeeded at the Core test proceeded to the full assessment.
ThePIAACassessmentfortheUnitedStatesincludedanadaptiveelementthatallowedforautomaticscoring.Basedontheirperformanceatdifferentpointsintheassessment,respondentstakingthecomputer-basedversionweredirectedtodifferent“testlets”thatcontaineditemsofdifferentaveragedifficulty in the domains of literacy and numeracy.
C-1
SamplingThe 2012 PIAAC assessment included a nationally representative probability sample of 9,468 households. This household sample was selected on the basis of a four-stage, stratified area sample: (1)primarysamplingunits(PSUs)consistingofcountiesorgroupsofcontiguouscounties; (2)secondarysamplingunits(referredtoassegments)consistingofareablocks;(3)housingunitscontaininghouseholds;and(4)eligiblepersonswithinhouseholds.Person-leveldatawerecollectedthroughascreener,abackgroundquestionnaire,andtheassessment.Thescreenerinstrumentwasconductedusingacomputer-assistedpersonalinterviewingsystem(CAPI)andcollectedinformationthat included age and gender of all household members. It determined which household member or memberswas/wereeligibleforthestudyandselectsthesampleperson(s).Ofthe9,468sampledhouse-holds, 1,285 were either vacant or not a dwelling unit, resulting in a sample of 8,183 households. In the sample, there were 1,267 households without an adult age 16 to 65. A total of 5,686 of the 6,916 households with eligible adults completed the screener (up to two adults per household could be selectedtocompletethequestionnaire),whichwasusedtoselectsurveyrespondents.Thefinal screener response rate was 86.5 percent weighted.
Basedonthescreenerdata,6,100respondentsage16to65wereselectedtocompletethebackgroundquestionnaireandtheassessment;4,898actuallycompletedthebackgroundquestionnaire.Ofthe1,202respondentswhodidnotcompletethebackgroundquestionnaire,112wereunabletodosobecause of a literacy-related barrier: either the inability to communicate in English or Spanish (the twolanguagesinwhichthebackgroundquestionnairewasadministered)oramentaldisability.Twentyotherswereunabletocompletethequestionnaireduetotechnicalproblems.Thefinalresponserate forthebackgroundquestionnaire—whichincludedrespondentswhocompleteditandrespondentswho were unable to complete it because of a language problem or mental disability—was 82.2 percent weighted.
Ofthe4,898adultsage16to65whocompletedthebackgroundquestionnaire,4,820completedtheadult literacy assessment. An additional 22 were unable to complete the assessment for literacy-related reasons. Another 11 were unable to do so due to technical problems. The final response rate for the overallassessment—whichincludedrespondentswhoansweredatleastonequestiononeachscaleandthe 22 respondents who were unable to do so because of a language problem, mental disability, or tech-nical problem—was 99.0 percent weighted.
AsdescribedbyPIAACTechnicalStandard4.3.3,acompletedcasecontainedatleastthefollowing:
•
•
•
Responsestokeybackgroundquestions,includingage,gender,highestlevelofschooling,andemploymentstatus;andAcompletedCoreinstrument1(i.e.,theintervieweraskedtherespondentallCorequestionsorthe Core instrument was not completed for a literacy-related reason [e.g., because of a language difficulty] or because the respondent was unable to read or write in any of a country’s PIAAC officiallanguages);orResponsestoageandgenderforliteracy-relatednonrespondentstothebackground questionnaire/JobRequirementsApproach(explainedin“OverviewoftheSkillUseModuleScalesinPIAAC”).
Casesthatexperiencedtechnicalproblemsduringtheadministrationofthebackgroundquestionnaireortheassessmentwerealsocountedascompleted.Toavoidpenalizingcountriesforplatformconfigura-
1 For a full description of the Core instrument, see the section on Data Collection.
C-2
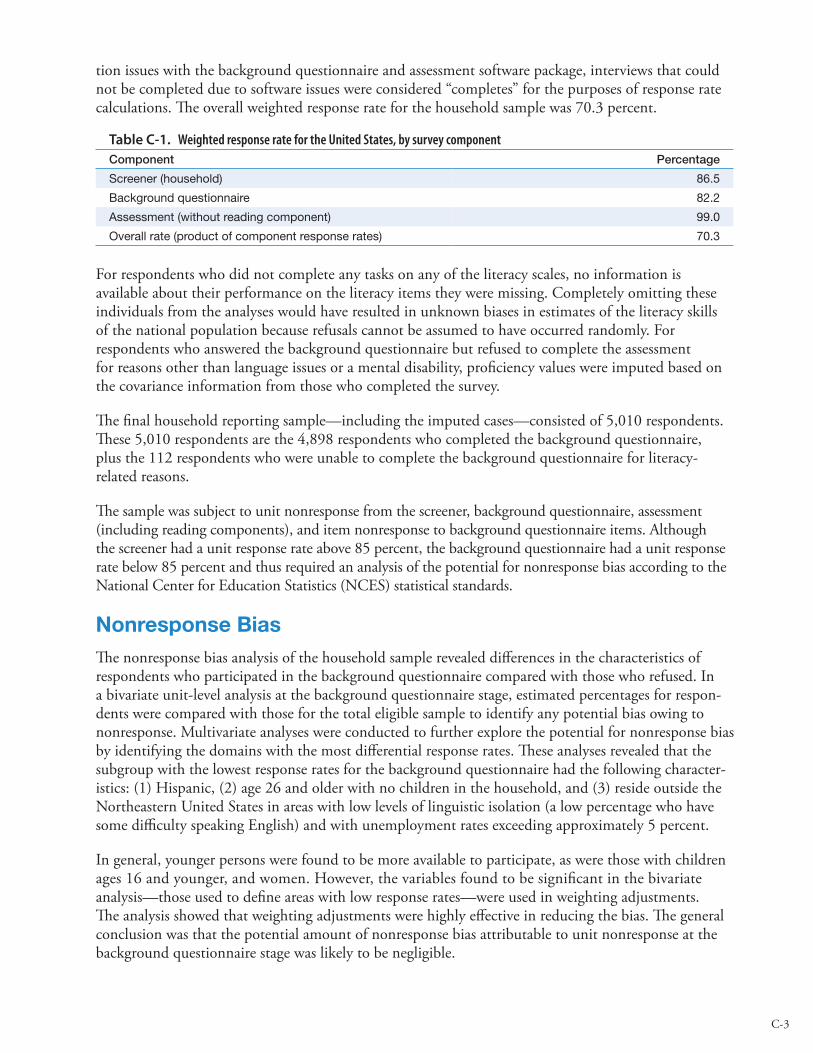
tionissueswiththebackgroundquestionnaireandassessmentsoftwarepackage,interviewsthatcouldnotbecompletedduetosoftwareissueswereconsidered“completes”forthepurposesofresponseratecalculations. The overall weighted response rate for the household sample was 70.3 percent.
Table C-1. Weighted response rate for the United States, by survey componentComponent Percentage
Screener (household) 86.5
Background questionnaire 82.2
Assessment (without reading component) 99.0
Overall rate (product of component response rates) 70.3
Forrespondentswhodidnotcompleteanytasksonanyoftheliteracyscales,noinformationis available about their performance on the literacy items they were missing. Completely omitting these individualsfromtheanalyseswouldhaveresultedinunknownbiasesinestimatesoftheliteracyskills of the national population because refusals cannot be assumed to have occurred randomly. For respondentswhoansweredthebackgroundquestionnairebutrefusedtocompletetheassessment for reasons other than language issues or a mental disability, proficiency values were imputed based on the covariance information from those who completed the survey.
The final household reporting sample—including the imputed cases—consisted of 5,010 respondents. These5,010respondentsarethe4,898respondentswhocompletedthebackgroundquestionnaire, plusthe112respondentswhowereunabletocompletethebackgroundquestionnaireforliteracy- related reasons.
Thesamplewassubjecttounitnonresponsefromthescreener,backgroundquestionnaire,assessment(includingreadingcomponents),anditemnonresponsetobackgroundquestionnaireitems.Althoughthescreenerhadaunitresponserateabove85percent,thebackgroundquestionnairehadaunitresponseratebelow85percentandthusrequiredananalysisofthepotentialfornonresponsebiasaccordingtotheNationalCenterforEducationStatistics(NCES)statisticalstandards.
Nonresponse BiasThe nonresponse bias analysis of the household sample revealed differences in the characteristics of respondentswhoparticipatedinthebackgroundquestionnairecomparedwiththosewhorefused.Inabivariateunit-levelanalysisatthebackgroundquestionnairestage,estimatedpercentagesforrespon-dents were compared with those for the total eligible sample to identify any potential bias owing to nonresponse.Multivariateanalyseswereconductedtofurtherexplorethepotentialfornonresponsebiasby identifying the domains with the most differential response rates. These analyses revealed that the subgroupwiththelowestresponseratesforthebackgroundquestionnairehadthefollowingcharacter-istics:(1)Hispanic,(2)age26andolderwithnochildreninthehousehold,and(3)resideoutsidetheNortheasternUnitedStatesinareaswithlowlevelsoflinguisticisolation(alowpercentagewhohavesomedifficultyspeakingEnglish)andwithunemploymentratesexceedingapproximately5percent.
In general, younger persons were found to be more available to participate, as were those with children ages16andyounger,andwomen.However,thevariablesfoundtobesignificantinthebivariate analysis—thoseusedtodefineareaswithlowresponserates—wereusedinweightingadjustments.Theanalysisshowedthatweightingadjustmentswerehighlyeffectiveinreducingthebias.Thegeneralconclusion was that the potential amount of nonresponse bias attributable to unit nonresponse at the backgroundquestionnairestagewaslikelytobenegligible.
C-3
Data CollectionWheneverpossible,interviewersadministeredthebackgroundquestionnaireandassessmentinaprivatesetting(e.g.,homeorlibrary).Usingthecomputerizedinterviewandassessmentsoftwareprovidedbythe PIAAC Consortium2,theinterviewerreadthebackgroundquestionnairequestionsfromalaptopandenteredallresponsesdirectlyintothelaptop.Skippatternsandfollow-upprobesforcontradictoryorout-of-rangeresponseswereprogrammedintotheinterviewsoftware.Atthecompletionoftheback-groundquestionnaire,theparticipantwasadministeredthecomputer-basedCoreorthepaper-and-pencilbasedCoreiftheparticipantcouldnotorwouldnotusethecomputer.UponthecompletionandscoringoftheCoretasks,therespondentwasroutedtothecomputer-basedassessment(CBA),thepaper-basedassessment(PBA)ofliteracyandnumeracy,orthepaper-basedreadingcomponents.Thebackgroundquestionnaireandtheassessmenttookapproximatelytwohourstocomplete,howeverthetime varied by the respondent. The number of assessment items also varied based on the respondents’ performance on the Core and the adaptive routing implemented in the automated portion of the assessment.
The progress through the assessment was controlled by the computer based on the respondent’s performance on various components of the assessment. The PIAAC assessment was composed of the following components:
•TheCoreconsistedofthreemodules:theCBACoreStage1,theCBACoreStage2,andthePBA Core.¢
¢
¢
TheCBACoreStage1includedsixtasksandwasdesignedtodetermineiftheparticipanthadthebasicsetofskillsneededtocompletethecomputer-basedassessment.TopasstheCBA Core Stage 1, the participant needed to correctly answer at least three of the first five tasks,plusthesixthtask(highlightingtext).CBACoreStage1questionswereautomaticallyscored by the computer, and a participant who passed the CBA Core Stage 1 continued on to the CBA Core Stage 2. A participant who did not pass the CBA Core Stage 1 was routed to the PBA Core.TheCBACoreStage2includedsixtasksthatmeasuredbasicliteracyandnumeracyskillsnecessarytoundertaketheassessment.CBACoreStage2questionswereautomaticallyscored by the computer, and a participant who passed the CBA Core Stage 2 continued on to the computer-based assessment. A participant who did not pass the CBA Core Stage 2 was routed directly to the paper-based reading components section.ThePBACoreconsistedofeighttasksandmeasuredbasicliteracyandnumeracyskills necessarytoundertaketheassessment.PBACorequestionswereinterviewerscoredandentered into the computer to determine if the participant passed the PBA Core. A partici-pant who passed the PBA Core continued on to the paper-based assessment of literacy and numeracy and then to the paper-based reading components section. A participant who did not pass the PBA Core was routed directly to the reading components section.
2 ThePIAACConsortiumincludesthefollowingorganizations:EducationalTestingService(ETS),Westat,cApStAn,theResearchCentreforEducationandtheLaborMarket(ROA),gesis-ZUMACentreforSurveyResearch,GermanInstituteforInternationalEducationResearch(DIPF),andtheDataProcessingCentreoftheInternationalAssociationfortheEvaluationofEducationalAchievement(IEA).Inadditiontotheseorganizations,PIAACisaidedbynumerousnationalcontracting partners.
C-4
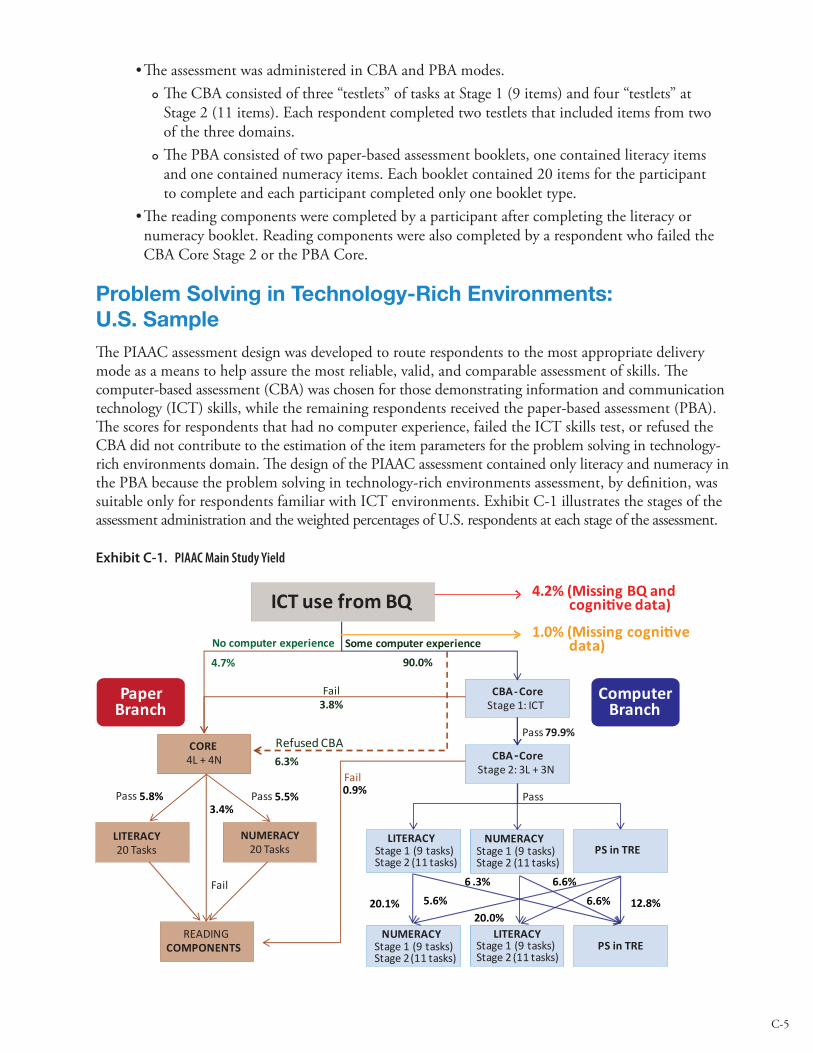
•TheassessmentwasadministeredinCBAandPBAmodes.¢
¢
TheCBAconsistedofthree“testlets”oftasksatStage1(9items)andfour“testlets”at Stage2(11items).Eachrespondentcompletedtwotestletsthatincludeditemsfromtwo of the three domains. ThePBAconsistedoftwopaper-basedassessmentbooklets,onecontainedliteracyitems andonecontainednumeracyitems.Eachbookletcontained20itemsfortheparticipant tocompleteandeachparticipantcompletedonlyonebooklettype.
•Thereadingcomponentswerecompletedbyaparticipantaftercompletingtheliteracyor numeracybooklet.ReadingcomponentswerealsocompletedbyarespondentwhofailedtheCBA Core Stage 2 or the PBA Core.
Problem Solving in Technology-Rich Environments: U.S. SampleThe PIAAC assessment design was developed to route respondents to the most appropriate delivery modeasameanstohelpassurethemostreliable,valid,andcomparableassessmentofskills.The computer-basedassessment(CBA)waschosenforthosedemonstratinginformationandcommunicationtechnology(ICT)skills,whiletheremainingrespondentsreceivedthepaper-basedassessment(PBA).Thescoresforrespondentsthathadnocomputerexperience,failedtheICTskillstest,orrefusedtheCBA did not contribute to the estimation of the item parameters for the problem solving in technology-rich environments domain. The design of the PIAAC assessment contained only literacy and numeracy in the PBA because the problem solving in technology-rich environments assessment, by definition, was suitableonlyforrespondentsfamiliarwithICTenvironments.ExhibitC-1illustratesthestagesoftheassessmentadministrationandtheweightedpercentagesofU.S.respondentsateachstageoftheassessment.
NUMERACYStage 1 (9 tasks)Stage 2 (11 tasks)
LITERACYStage 1 (9 tasks)Stage 2 (11 tasks)
PS in TRE
PS in TRENUMERACY
Stage 1 (9 tasks)Stage 2 (11 tasks)
LITERACYStage 1 (9 tasks)Stage 2 (11 tasks)
No computer experience
4.7%
Some computer experience
90.0%
Fail3.8%
Fail
FailPassPass Pass
Pass 79.9%
Paper Branch
ComputerBranch
Refused CBA6.3%
4.2% (Missing BQ and cognitive data)
1.0% (Missing cognitive data)
ICT use from BQ
CBA- CoreStage 1: ICT
CBA-CoreStage 2: 3L + 3N
CORE4L + 4N
LITERACY20 Tasks
NUMERACY20 Tasks
READINGCOMPONENTS
5.8% 5.5%3.4%
0.9%
20.1%20.0%
12.8%6.6%5.6%
6 .3% 6.6%
Exhibit C-1. PIAAC Main Study Yield
C-5
Weighting and Variance EstimationA complex sample design was used to select assessment respondents. The properties of a sample selected through a complex design could be very different from those of a simple random sample in which every individualinthetargetpopulationhasanequalchanceofselectionandinwhichtheobservationsfromdifferent sampled individuals can be considered statistically independent of one another. Therefore, thepropertiesofthesampleforthecomplexdatacollectiondesignweretakenintoaccountduringtheanalysis of the data.
Onewayofaddressingthepropertiesofthesampledesignwasbyusingsampling weights to account for the fact that the probabilities of selection were not identical for all respondents. The sampling weights werefurtheradjustedfornonresponsetothescreenerandbackgroundquestionnaire,extremeweightsweretrimmed,andweightsforallrespondentscalibratedtotheU.S.CensusBureau’s2010AmericanCommunity Survey population totals for those age 16 to 65. Since literacy-related nonrespondents to thescreener,thebackgroundquestionnaire,andtheassessmentaresimilarinproficiency,theweights oftheliteracy-relatednonresponsecaseswerenotadjustedduringthescreener-levelnonresponseadjust-ment.Instead,thebackgroundquestionnaireweightsforthebackgroundquestionnaireandassessmentliteracy-relatedcaseswereadjustedtoaccountfortheliteracy-relatedscreenernonrespondents.This adjustmentwasnecessaryprimarilytoallowtheliteracy-relatedbackgroundquestionnaireandassessmentnonrespondents to represent the literacy-related screener nonrespondents in the calibration procedure.
All population and subpopulation characteristics based on the PIAAC data used sampling weights in their estimation. The statistics presented in this report are estimates of group and subgroup performance based on a sample of respondents, rather than the values that could be calculated if every person in the nation answeredeveryquestionontheinstrument.Therefore,itisimportanttohavemeasuresofthedegreeofuncertainty of the estimates. Accordingly, in addition to providing estimates of percentages of respondents and their average scale scores, this report provides information about the uncertainty of each statistic in theformofstandarderrorsontheU.S.PIAACwebsiteathttp://nces.ed.gov/surveys/piaac/results/ summary.aspx.
Because the assessment used clustered sampling, conventional formulas for estimating sampling variability(e.g.,standarderrors)thatassumesimplerandomsamplingandhenceindependenceof observations would have been inappropriate for this report. For this reason, the PIAAC assessment usedapairedjackknifereplicationapproach(sometimesreferredtoasJK2)toestimatestandarderrors(RustandRao,1996).
Overview of the Skill Use Scales in PIAACInPIAAC,theskillsofapopulationweremeasurednotonlydirectlythroughthecognitive instruments,butalsoindirectlythroughthebackgroundquestionnairethataskedrespondents toreportontheiruseofskillsbothinandoutsideofwork.Thefrequencyandtypeofactivities associatedwithreading,writing,numeracy,andinformationtechnologyweretargetedintheback-groundquestionnaireusingmultipleitemsthatweresimilarlywordedtoapplytoactivitiesbothinandoutsideofwork.Inaddition,otherareas,particularlythoseinvolvingintrapersonal,interpersonal,andothergeneric“soft”skillsnotincludedinthedirectassessment,wereaddressedthroughasetofself- reportedquestions.Examplesofsomeofthesequestionsincludehowindividualsdealwithnewinforma-tionandtheextenttowhichindividualsliketolearnnewthings.ThissetofquestionsmadeupamodulewithinthequestionnairethatwasspecificallydevelopedforthePIAACproject:theJobRequirementsApproach(JRA)Module(Green2009).WhenthePIAACConsortiumdevelopedandimplemented
C-6
PIAAC, they were able to construct 13 scales based on a cross-country analysis of comparability, reliability, and convergent as well as discriminant validity. The 13 scales are:
•••
••••
Influence
ICTathomeICTatwork
LearningatworkNumeracyathomeNumeracyatworkPlanning
••••••
ReadingathomeReadingatworkReadinesstolearnTaskdiscretionWritingathomeWritingatwork
Thesescaleswereconstructedusingitemresponsetheory(IRT),morespecificallythegeneralizedpartialcreditmodel(GPCM),andperson-specificlevelsofskillusewereestimatedusingweightedlikelihoodestimation(WLE;Warm1989,Muraki1992,Penfield&Bergeron2005).Scalevalueswerederived for all respondents who reported at least some limited activities in each of these domains. Those who reportednoskilluseineachofthe13areasarenotrepresentedonanyofthese13scales.Nevertheless,they provide important information with respect to the percentage of people in each participating countrywhodonotuseparticulartypesofskillseitherinoroutsideofwork.
Skill Use Derived Variables
Theskillusevariablesreportedonpage18consistofrespondents’answerstomultiplequestionsinthebackgroundquestionnaire.Reading skills used at workincluderespondents’answerstoquestionsregardingfrequencyofengagementinthefollowingactivities:readdirectionsorinstructions;readlet-ters,memosoremails;readarticlesinnewspapers,magazinesornewsletters;readarticlesinprofessionaljournalsorscholarlypublications;readmanualsorreferencematerials;readbills,invoices,bankstate-mentsorotherfinancialstatements;readdiagrams,mapsorschematics.Numeracy skills used at work includerespondents’answerstoquestionsregardingfrequencyofengagementinthefollowingactivi-ties:calculateprices,costsorbudgets;useorcalculatefractions,decimalsorpercentages;useacalcula-tor;preparecharts,graphsortables;usesimplealgebraorformulas;usemoreadvancedmathorstatis-ticssuchascalculus,complexalgebra,trigonometryoruseofregressiontechniques.ICT skills3 used at workincludesrespondents’answersaboutthefrequencywithwhichtheyuseemail;usetheInternettounderstandissuesrelatedtowork;useofawordprocessor;useofprogramminglanguagetoprogramorwritecomputercode;participateinreal-timediscussionsontheInternet.Therespondents’answerstoquestionsregardingthefrequencyuseoftheseskillsrangefrom“never,”“lessthanonceamonth,”“lessthanonceaweekbutatleastonceamonth,”“atleastonceaweekbutnoteveryday,”to“Everyday.”Respondentswhoareinthehigherquintilesusedtheseskillsmoreoftenthantherespondentswhoareinthelowerquintiles.
3 ICTskillsreferstoinformationandcommunicationtechnologyskills.
C-7
Scaling
InformationonscalinginthePIAACassessmentcanbefoundontheOECDPIAACwebsiteat http://www.oecd.org/site/piaac/.
Statistical Testing
The statistical comparisons in this report were based on the t statistic. Statistical significance was determined by calculating a t value for the difference between a pair of means or proportions, and comparing this value with published tables of values at a certain level of significance, called the alpha level. The alpha level is an a priori statement of the probability of inferring that a difference exists when, in fact, it does not. Findings from t-testsarereportedbasedonastatisticalsignificance(oralphalevel)setat.05,withoutadjustmentsformultiplecomparisons.
C-8

This page intentionally left blank.

Literacy, Numeracy, and Problem Solving in Technology-Rich Environments Among U.S. Adults:Results from the Program for the International Assessment of Adult Competencies 2012
First Look
NCES 2014-008U.S. DEPARTMENT OF EDUCATION
www.ed.gov ies.ed.gov