literacy boost belajar indonesia midline & endline report...literacy boost belajar indonesia...
TRANSCRIPT
Literacy Boost Midline & Endline Report
1
Literacy Boost
BELAJAR Indonesia
Midline & Endline Report
August 2014
Lauren Pisani, Ni Luh Putu Satyaning, Benny Giri, Carolyn Alesbury, Marie
de Fretes
With special thanks to Save the Children staff and our team of enumerators:
Harun Anggo, Asyikin, Maria Lakaseru, Neny Wakanno, Ignasia Aton,
Ambrosius Tanono, Robertus Acong, Hiasintus Sekundus, Januarius Bria,
Paskalis Teti, Wendelinus Inta, Wilbrodus Gasa, Yansen Bau, Yohanes Nino,
Yulius Leto, Frida Roman, Maria Seran, Melpi Marpaung, Theodora Ruing,
Viktoria Fatin, Yovita Ikun, Yovita Nahak, Susana Edon

Literacy Boost Midline & Endline Report
2
Executive Summary
In 2012, Save the Children started to implement Literacy Boost methodology in Belu district, NTT
province, Indonesia. The results of the 2012-2013 pilot Literacy Boost program in Belu demonstrated
improvement in the literacy skills and behavior of children. Consequently, Save the Children expanded the scope of interventions through Better Literacy for Academic Result (BELAJAR) program. As an
evaluation for BELAJAR program, two assessments have been conducted in May-June 2014.
The first assessment evaluated the one-year BELAJAR program intervention in Belu. The sample
includes 652 children (326 boys, 326 girls) from the same 35 schools sampled in 2013, with 20 second
graders sampled per school. The result showed the increasing of BELAJAR children literacy skill in
2014, compared to the result in 2013. There was a significantly higher number of BELAJAR than
comparison children transitioning from non-readers to readers in 2014. On average, BELAJAR children
show mastery of basic skills like letter identification and common word reading, and advances in the
more advanced skills of fluency, accuracy and reading comprehension. The second assessment
evaluated the two-year ANCP program intervention in Belu. The sample includes 389 second graders
(199 boys, 190 girls) from the same 20 schools sample in 2012 and 2013. At each school where data
was collected, 20 second graders were sampled. The result demonstrated the stronger literacy skill in
second graders assessed in 2013 and 2014 than second graders assessed in 2012.
In 2014, across Literacy Boost schools in both assessments reading skill averages show no significant
differences between the children who are native Indonesian speakers and those who are not. This is an
important improvement from 2013 when the overall tendency was for second language learners to
have weaker literacy skills than native speakers of Indonesian. In addition, this trend of non-native
Indonesian speakers having weaker language skills than native speakers continues in 2014 for control
schools.
As recommendations, communities and Save the Children staff who support them should continue to
work to consistently offer out-of-school reading opportunities to children. Analyses indicate that the
amount of participation in Literacy Boost activities outside of school is directly related to stronger
reading skill gains and a decrease in the likelihood of being a struggling student (defined as scoring at
least one standard deviation below the average letter and common word scores). In addition, parents
should be encouraged and reminded to continue to support their children’s literacy development at
home as this is another critical aspect of reading skill improvement.
With more and more students beginning able to read independently program focus can shift toward
teaching and cultivating comprehension skills. Helping children grow from readers who can understand
the basic idea of a text to those who can think critically about what they’re reading is difficult but
ultimately the goal of reading, and if children can begin cultivating these skills at a young age they will be
better prepared to apply them in and outside of school as they get older.
Literacy Boost Midline & Endline Report
3
Contents
Executive Summary ....................................................................................................................................................2
Introduction ................................................................................................................................................................4
2013 – 2014 BELAJAR Evaluation ..............................................................................................................................5
A. Context ...........................................................................................................................................................5
B. Methods .........................................................................................................................................................5
Results and Analysis....................................................................................................................................................8
C. Characteristics of Students .............................................................................................................................8
Home Literacy Environment (HLE) .........................................................................................................................9
Community Reading Activities................................................................................................................................9
D. Results of Reading Skills by Sub-Test ........................................................................................................... 10
E. Learning Equity and Struggling Students ..................................................................................................... 12
Literacy Boost Participation................................................................................................................................. 13
F. Low Performing Students ............................................................................................................................ 14
G. Conclusion ....................................................................................................................................................... 15
2012 – 2014 ANCP Evaluation ................................................................................................................................ 16
A. Context ........................................................................................................................................................ 16
B. Methods ...................................................................................................................................................... 16
Results and Analysis................................................................................................................................................. 20
C. Characteristics of Students .............................................................................................................................. 20
Home Literacy Environment (HLE) ...................................................................................................................... 20
Community Reading Activities............................................................................................................................. 21
D. Results of Reading Skills by Sub-Test .............................................................................................................. 22
E. Learning Equity and Struggling Students ......................................................................................................... 24
Literacy Boost Participation................................................................................................................................. 24
E. Conclusion ....................................................................................................................................................... 25
Appendix A. Background information ..................................................................................................................... 26
Appendix B. Regression Results .............................................................................................................................. 30
Appendix C. Inter-rater reliability ........................................................................................................................... 34

Literacy Boost Midline & Endline Report
4
Introduction
In 2012, Save the Children began its Literacy Boost program in 20 schools in Belu district on West
Timor island, implementing both teacher-focused and community interventions. Literacy Boost teacher
trainings began several months after the baseline assessment in July, and included training sessions
featuring how to teach the five key reading skills (letter knowledge, phonemic awareness, fluency,
vocabulary and comprehension) as well as how to follow learners' progress in developing these skills
using formative assessments. Broad -based community mobilization including establishing reading
awareness, as well as Reading Camps and Book Banks in all villages surrounding the schools were
rolled out over the school year before the next data collection in July 2013.
The key research questions to be explored in this report include:
1. What can students’ literacy score gains from 2013-2014 tell us about learners’ emergent
reading skills? What does this mean for BELAJAR programming?
2. How do learners’ reading skills vary by student background, school environment, and home
literacy environment? What does this mean for targeting BELAJAR’s two strands of
intervention? 3. Who are the struggling students in 2014, and are they similar or different to those in 2013?
The 2013, students in Literacy Boost schools made significantly larger gains in concepts about print and
listening comprehension than students in comparison schools, controlling for baseline differences.
However, there was not a statistically significant impact of the program in letter identification,
individual word reading or reading accuracy. In addition, students who did not speak Indonesian as
their primary language tended to perform significantly worse than their peers who have grown up
speaking Indonesian, overall. However, the gap between Indonesian speakers and those that speak a
mother tongue at home was smaller in Literacy Boost schools. 2013 monitoring data also revealed that
students in schools that participated in more program activities scored higher than their peers in less
involved schools. Teacher training and community intervention sessions continued into the 2014
school year and this report includes a follow-up endline report with schools that have experienced the
Literacy Boost program for two years. Analyses will focus on the skills of children in 2014 and whether
differences in home language seen in 2013 persist in 2014.
Finally, the results of the 2012-2013 pilot Literacy Boost program in Belu demonstrated improvement
in the literacy skills and behavior of children. Consequently, Save the Children expanded the scope of
interventions in the Better Literacy for Academic Result (BELAJAR) program. In July 2013, a baseline
data collection was undertaken to ensure that programmatic needs were accounted for within the new
schools in the project. The 20 baseline intervention schools represent all schools where the Literacy
Boost program is being undertaken as part of BELAJAR. This report will begin by reporting on the
2013-2014 evaluation and finish with results from the 2014 follow-up study of schools that have
received Literacy Boost for two years.

Literacy Boost Midline & Endline Report
5
2013 – 2014 BELAJAR Evaluation
A. Context
Belu District, along with most of NTT province, is one of the poorer areas of Indonesia. The province
had an average GDP/capita of just $527 compared to the average for Indonesia—$3,223 in 2011. As
the district is on the border of Indonesia and Timor-Leste many people in the area are refugees from
the conflict. In 2011, Belu district has total 140 primary schools across 12 sub-districts. This BELAJAR
evaluation involved 35 schools, 20 BELAJAR target schools and 15 control schools, across five sub-
districts. BELAJAR target schools are located in Lasiolat and Raihat sub-district, while the control
schools are located in Lamaknen and Lamaknen Selatan sub-district.
B. Methods
Sampling
The 2013 BELAJAR sample included 626 students (319 boys, 307 girls) who were enrolled in Grade 2
in 35 schools, 20 receiving the Literacy Boost program and 15 receiving no intervention. At each
school where data was collected, 20 children in Grade 2 were sampled. Student background
information was collected by asking children basic questions about their home and family. The 2014
sample includes 652 children (326 boys, 326 girls) from the same 35 schools sampled in 2013, with 20
grade 2 children sampled per school. The same schools were sampled in 2013 and 2014, and an
attempt was made to follow the same children from one year to the next. Therefore, this study will
report on average scores and learning gains for students present at both the baseline and endline
assessments.
Analyses
This analysis has two purposes. First, we will investigate the literacy skills of Literacy Boost learners
and the comparison learners in 2014. Special attention will be given to the skill growth between 2013
and 2014 for both groups. The second purpose is to assess what skills the students currently have, and
what areas and skills Literacy Boost should focus on.
To test the comparability of learners in the samples, this report will use comparison of means through
two-tailed t-tests, with clustered standard errors to account for the grouping of student-level data
within schools. Summary statistics will be used to analyze learners’ performance in each of the reading
sub-tests. Finally, this report will look to multilevel regression models to explore relationships between
literacy skills and student background characteristics and home literacy environment.
Comparing several different groupings of learners is possible with this data. Of particular interest are
children who do not speak Indonesian at home, girls, children with few socioeconomic resources and children with weak home literacy environments. Data in this report will be disaggregated by group only
when the aforementioned clustered t-tests indicate statistically significant differences between groups.
Instruments
Literacy Boost Midline & Endline Report
6
The assessment tool used for the 2014 data collection is the same as was used for the baseline data
collection in 2013, with the exception of students’ participation in community reading activities like
Book Banks and Reading Camps. Table 1 offers an example of background indicators as well as a
detailed description of reading indicators. Information about inter-rater reliability for this assessment is
in Appendix C.
Table 1: Assessment Instruments
Student background Examples
General Sex, age, language spoken at home, work
School-related Distance to walk to school, repetition history
Socioeconomic status Type of home, household size, household amenities/possessions
Home Literacy Environment
Access to print Materials present in home, types of materials
Reading at home Presence and percentage of family members who children see read,
and who have someone read to them
Participation in community
reading activities
Participation in reading buddy, reading camp, book creation and book
bank activities.
Reading Outcome Description
Concepts about Print Familiarity with books (e.g. cover, direction of text); 11 items
Alphabet knowledge Number of letters/sounds known of 52
Fluency Number of words in a connected text read correctly in a minute
Accuracy Percentage of words in a connected text read correctly
Comprehension Ten comprehension questions answered correctly after reading text
aloud
In addition, the Literacy Boost program involves the follow main components:
1. a 9-module teacher training on explicit reading instruction;
2. provision of community-based Book Banks
3. establishing a Reading Buddy system in schools in which older children read to younger
children;
4. conducting regular community reading awareness sessions with parents
5. conducting weekly Reading Camps run by trained Reading Camp Leaders
6. conducting Story Time activities in the community
At the time of this midline assessment in May 2014, Table 2 details the activities that had been
implemented by Save the Children and the length of the intervention prior to the assessment.
Literacy Boost Midline & Endline Report
7
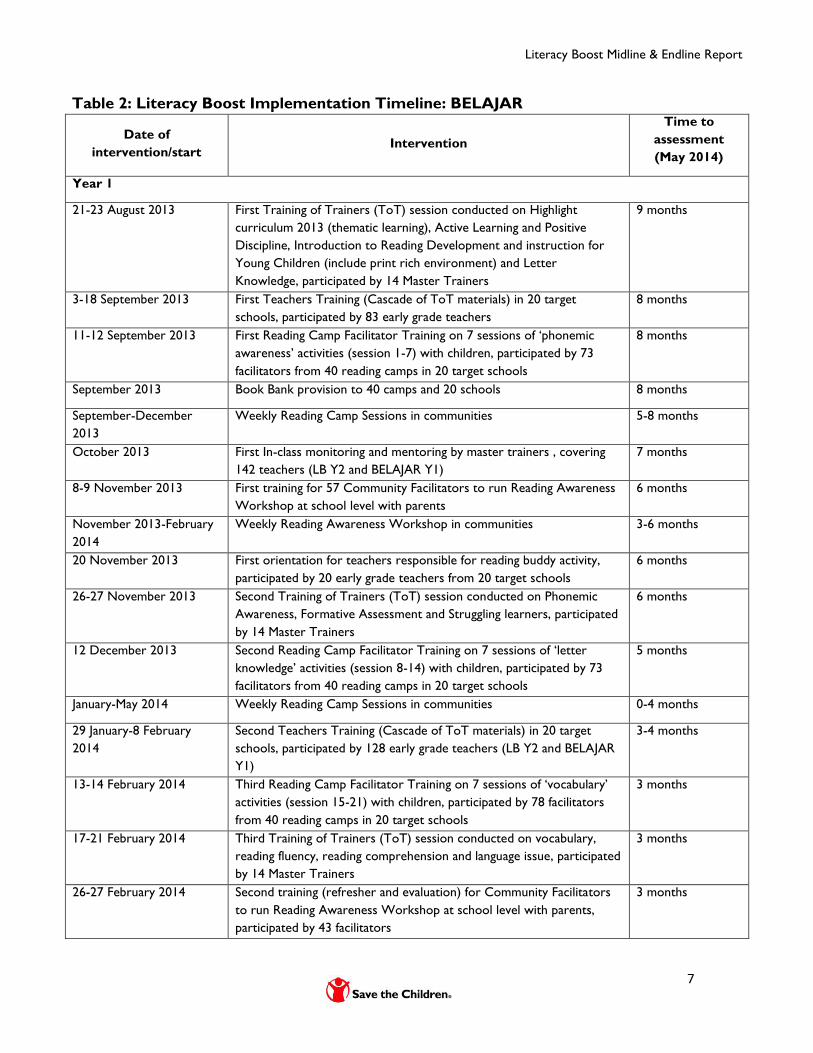
Table 2: Literacy Boost Implementation Timeline: BELAJAR
Date of
intervention/start Intervention
Time to
assessment
(May 2014)
Year 1
21-23 August 2013 First Training of Trainers (ToT) session conducted on Highlight
curriculum 2013 (thematic learning), Active Learning and Positive
Discipline, Introduction to Reading Development and instruction for
Young Children (include print rich environment) and Letter
Knowledge, participated by 14 Master Trainers
9 months
3-18 September 2013 First Teachers Training (Cascade of ToT materials) in 20 target
schools, participated by 83 early grade teachers
8 months
11-12 September 2013 First Reading Camp Facilitator Training on 7 sessions of ‘phonemic
awareness’ activities (session 1-7) with children, participated by 73
facilitators from 40 reading camps in 20 target schools
8 months
September 2013 Book Bank provision to 40 camps and 20 schools 8 months
September-December
2013
Weekly Reading Camp Sessions in communities 5-8 months
October 2013 First In-class monitoring and mentoring by master trainers , covering
142 teachers (LB Y2 and BELAJAR Y1)
7 months
8-9 November 2013 First training for 57 Community Facilitators to run Reading Awareness
Workshop at school level with parents
6 months
November 2013-February
2014
Weekly Reading Awareness Workshop in communities 3-6 months
20 November 2013 First orientation for teachers responsible for reading buddy activity,
participated by 20 early grade teachers from 20 target schools
6 months
26-27 November 2013 Second Training of Trainers (ToT) session conducted on Phonemic
Awareness, Formative Assessment and Struggling learners, participated
by 14 Master Trainers
6 months
12 December 2013 Second Reading Camp Facilitator Training on 7 sessions of ‘letter
knowledge’ activities (session 8-14) with children, participated by 73
facilitators from 40 reading camps in 20 target schools
5 months
January-May 2014 Weekly Reading Camp Sessions in communities 0-4 months
29 January-8 February
2014
Second Teachers Training (Cascade of ToT materials) in 20 target
schools, participated by 128 early grade teachers (LB Y2 and BELAJAR
Y1)
3-4 months
13-14 February 2014 Third Reading Camp Facilitator Training on 7 sessions of ‘vocabulary’
activities (session 15-21) with children, participated by 78 facilitators
from 40 reading camps in 20 target schools
3 months
17-21 February 2014 Third Training of Trainers (ToT) session conducted on vocabulary,
reading fluency, reading comprehension and language issue, participated
by 14 Master Trainers
3 months
26-27 February 2014 Second training (refresher and evaluation) for Community Facilitators
to run Reading Awareness Workshop at school level with parents,
participated by 43 facilitators
3 months
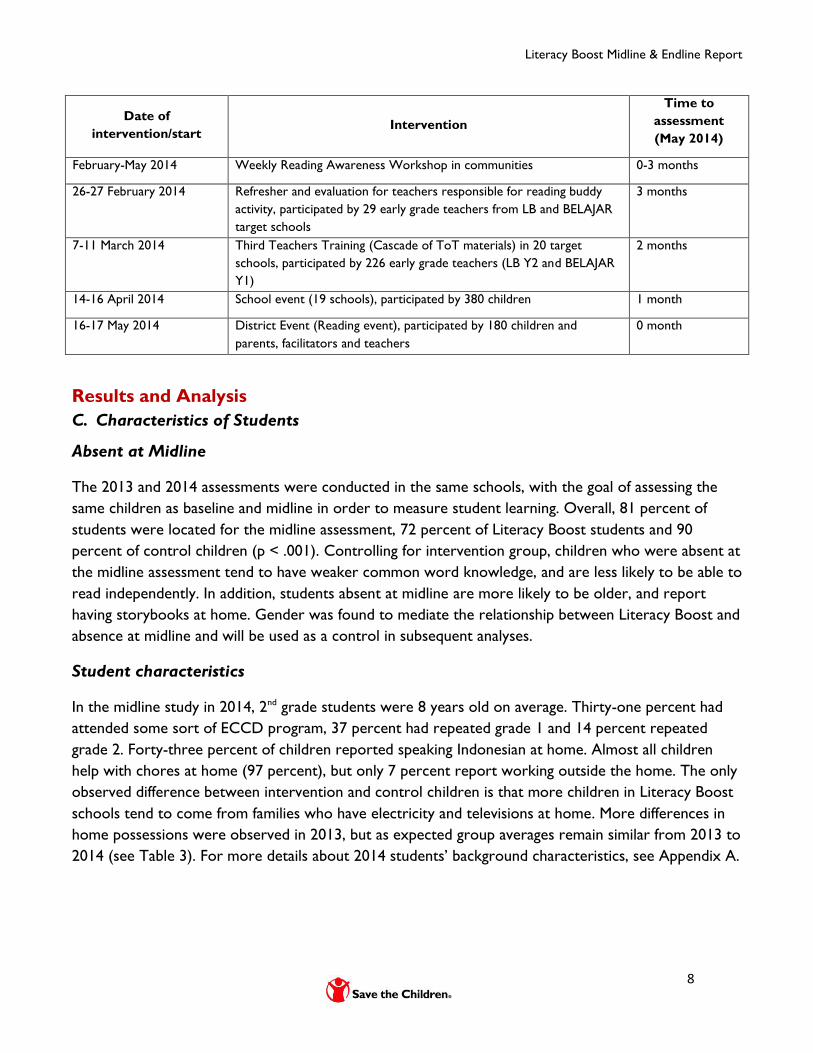
Literacy Boost Midline & Endline Report
8
Date of
intervention/start Intervention
Time to
assessment
(May 2014)
February-May 2014 Weekly Reading Awareness Workshop in communities 0-3 months
26-27 February 2014 Refresher and evaluation for teachers responsible for reading buddy
activity, participated by 29 early grade teachers from LB and BELAJAR
target schools
3 months
7-11 March 2014 Third Teachers Training (Cascade of ToT materials) in 20 target
schools, participated by 226 early grade teachers (LB Y2 and BELAJAR
Y1)
2 months
14-16 April 2014 School event (19 schools), participated by 380 children 1 month
16-17 May 2014 District Event (Reading event), participated by 180 children and
parents, facilitators and teachers
0 month
Results and Analysis
C. Characteristics of Students
Absent at Midline
The 2013 and 2014 assessments were conducted in the same schools, with the goal of assessing the
same children as baseline and midline in order to measure student learning. Overall, 81 percent of
students were located for the midline assessment, 72 percent of Literacy Boost students and 90
percent of control children (p < .001). Controlling for intervention group, children who were absent at
the midline assessment tend to have weaker common word knowledge, and are less likely to be able to
read independently. In addition, students absent at midline are more likely to be older, and report
having storybooks at home. Gender was found to mediate the relationship between Literacy Boost and
absence at midline and will be used as a control in subsequent analyses.
Student characteristics
In the midline study in 2014, 2nd grade students were 8 years old on average. Thirty-one percent had
attended some sort of ECCD program, 37 percent had repeated grade 1 and 14 percent repeated
grade 2. Forty-three percent of children reported speaking Indonesian at home. Almost all children
help with chores at home (97 percent), but only 7 percent report working outside the home. The only
observed difference between intervention and control children is that more children in Literacy Boost
schools tend to come from families who have electricity and televisions at home. More differences in
home possessions were observed in 2013, but as expected group averages remain similar from 2013 to
2014 (see Table 3). For more details about 2014 students’ background characteristics, see Appendix A.

Literacy Boost Midline & Endline Report
9
Table 3. Items owned by family in 2013 and 2014, by group
2013 2014
Control
(N=235)
Literacy Boost
(N=241)
Significant
Difference
Control
(N=235)
Literacy Boost
(N=241)
Significant
Difference
Electricity 38% 65% ** 47% 73% **
Latrine 60% 73%
60% 72% *
TV 13% 37% *** 19% 40% ***
Refrigerator 3% 9% * 3% 6%
Motorcycle 21% 33% ** 23% 32%
Computer 0% 4% * 1% 2% *p < .05, **p < .01, ***p < .001
Home Literacy Environment (HLE)
Table 4 displays 2013 and 2014 averages for key measures of home literacy environment. In both 2013
and 2014 the majority of students came from households where parents were actively engaged in
literacy activities at home. In 2014, significantly more Literacy Boost students reported having more
textbooks and storybooks at home, compared to students in comparison schools. The overall number
of types of materials at home is also higher for Literacy Boost students compared to control students
in 2014.
Table 4. 2013 and 2014 average scores for students’ home literacy environments, by
group
2013 2014
Control
(N=235)
Literacy
Boost
(N=241)
Significant
Difference
Control
(N=235)
Literacy
Boost
(N=241)
Significant
Difference
Textbook 62% 69% 73% 87% **
Religious book 74% 75% 79% 82%
Magazine 3% 12% *** 6% 7%
Newspaper 13% 24% ** 22% 30%
Storybook 48% 47% 47% 66% ***
# Types of reading materials 2.0 2.3 * 2.3 2.7 **
Family member seen reading 86% 91% 86% 87%
Family member helps child study 93% 96% 92% 95%
Family member reads to child 65% 79% ** 68% 72%
Family member tells stories to
child 63% 72% 70% 71% *p < .05, **p < .01, ***p < .001
Community Reading Activities
Literacy Boost Midline & Endline Report
10
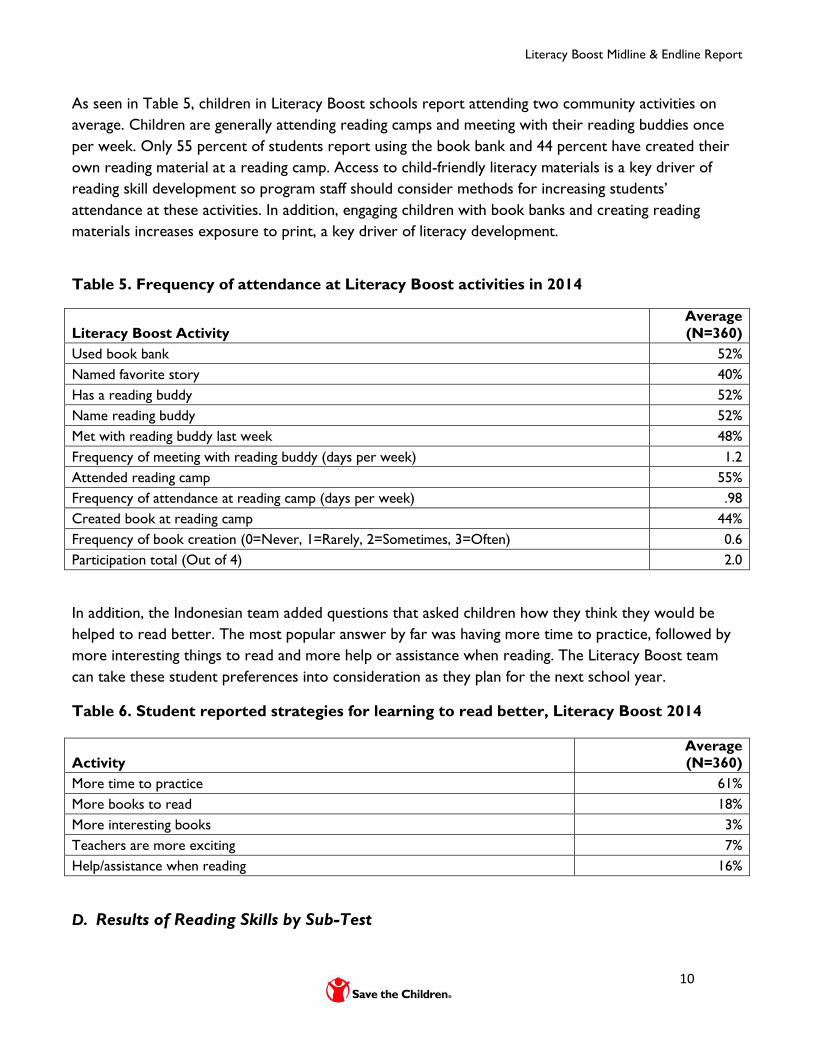
As seen in Table 5, children in Literacy Boost schools report attending two community activities on
average. Children are generally attending reading camps and meeting with their reading buddies once
per week. Only 55 percent of students report using the book bank and 44 percent have created their
own reading material at a reading camp. Access to child-friendly literacy materials is a key driver of
reading skill development so program staff should consider methods for increasing students’
attendance at these activities. In addition, engaging children with book banks and creating reading
materials increases exposure to print, a key driver of literacy development.
Table 5. Frequency of attendance at Literacy Boost activities in 2014
Literacy Boost Activity
Average
(N=360)
Used book bank 52%
Named favorite story 40%
Has a reading buddy 52%
Name reading buddy 52%
Met with reading buddy last week 48%
Frequency of meeting with reading buddy (days per week) 1.2
Attended reading camp 55%
Frequency of attendance at reading camp (days per week) .98
Created book at reading camp 44%
Frequency of book creation (0=Never, 1=Rarely, 2=Sometimes, 3=Often) 0.6
Participation total (Out of 4) 2.0
In addition, the Indonesian team added questions that asked children how they think they would be
helped to read better. The most popular answer by far was having more time to practice, followed by
more interesting things to read and more help or assistance when reading. The Literacy Boost team
can take these student preferences into consideration as they plan for the next school year.
Table 6. Student reported strategies for learning to read better, Literacy Boost 2014
Activity
Average
(N=360)
More time to practice 61%
More books to read 18%
More interesting books 3%
Teachers are more exciting 7%
Help/assistance when reading 16%
D. Results of Reading Skills by Sub-Test

Literacy Boost Midline & Endline Report
11
In this section we examine average scores for 2nd grade students in each literacy skill area in 2013 and
gains made in 2014. Figure 1 displays that on average the literacy skills of 2nd grade students in both
intervention and control schools have improved from 2013 to 2014. It is not clear why control
students have gained skills on the same magnitude as Literacy Boost students, but there are no
significant literacy skill gain differences between the two groups.
Figure 1. Average Gain Score for Grade 2 Students in 2013 and 2014
Enabling students to read with comprehension is the one of the primary goals of Literacy Boost. With
the expanded comprehension questions used in 2013 and 2014 it is easier to analyze which level of
comprehension students are achieving. Readers with comprehension are those students who can read
a grade-level text independently and answer at least 80 percent of comprehension questions correctly.
In 2014, 18 percent of grade 2 Literacy Boost students achieved this highest level of comprehension,
compared to 4 percent in 2013. Given the mastery that students are showing across the more basic
skills, growth in this area of reading comprehension would be an appropriate goal for future
assessments.
48%
65%
33%
8%
26%
13%
28%
58%
69%
38%
7%
27%
14%
32%
28%
20%
38%
15%
44%
20%
34%
24%
20%
40%
17%
51%
27%
42%
0%
10%
20%
30%
40%
50%
60%
70%
80%
90%
100%
CAP Letter ID Common words Fluency Accuracy Reading comprehension Reader
Control 2013 LB 2013 Control Gain LB Gain
Literacy Boost Midline & Endline Report
12
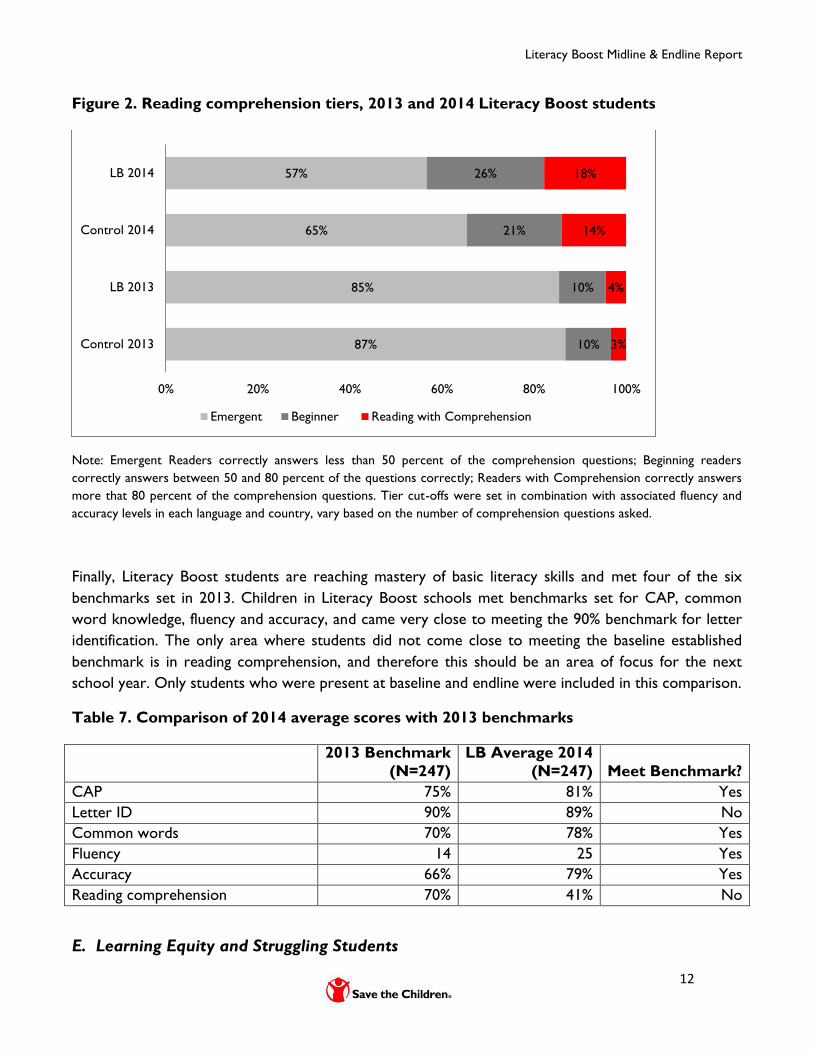
Figure 2. Reading comprehension tiers, 2013 and 2014 Literacy Boost students
Note: Emergent Readers correctly answers less than 50 percent of the comprehension questions; Beginning readers
correctly answers between 50 and 80 percent of the questions correctly; Readers with Comprehension correctly answers
more that 80 percent of the comprehension questions. Tier cut-offs were set in combination with associated fluency and
accuracy levels in each language and country, vary based on the number of comprehension questions asked.
Finally, Literacy Boost students are reaching mastery of basic literacy skills and met four of the six
benchmarks set in 2013. Children in Literacy Boost schools met benchmarks set for CAP, common
word knowledge, fluency and accuracy, and came very close to meeting the 90% benchmark for letter
identification. The only area where students did not come close to meeting the baseline established
benchmark is in reading comprehension, and therefore this should be an area of focus for the next
school year. Only students who were present at baseline and endline were included in this comparison.
Table 7. Comparison of 2014 average scores with 2013 benchmarks
2013 Benchmark
(N=247)
LB Average 2014
(N=247) Meet Benchmark?
CAP 75% 81% Yes
Letter ID 90% 89% No
Common words 70% 78% Yes
Fluency 14 25 Yes
Accuracy 66% 79% Yes
Reading comprehension 70% 41% No
E. Learning Equity and Struggling Students
87%
85%
65%
57%
10%
10%
21%
26%
3%
4%
14%
18%
0% 20% 40% 60% 80% 100%
Control 2013
LB 2013
Control 2014
LB 2014
Emergent Beginner Reading with Comprehension

Literacy Boost Midline & Endline Report
13
Learning Equity
This section will review the results of multivariate analyses predicting children’s reading skill in 2014,
with emphasis on equity. Overall, there are few significant differences between student’s reading skills
by gender, socioeconomic status (estimated by household items), or HLE in the overall sample or
within Literacy Boost schools. One difference observed is that across both groups and within
Literacy Boost schools only, girls are more likely to independent readers than boys. Also,
within Literacy Boost schools, children who reported doing more chores tended to have
stronger CAP and accuracy skills than children doing fewer chores at home.
We do continue to observe that similar to 2013 overall across both groups, children who do not speak
Indonesian at home having significantly weaker skills compared to children who do speak Indonesian at
home, specifically in the areas of CAP and reading comprehension. However, in Literacy Boost
schools alone there are no significant differences between the literacy skills of children
who are native Indonesian speakers and those who are not. This is an important
improvement given the overall tendency of second language learners to have weaker
literacy skills than native speakers of Indonesian.
Literacy Boost Participation
The major different between Literacy Boost students tends to be the frequency with which they attend
out of school literacy activities. Across CAP, fluency, accuracy and reading comprehension, children
who participate in more activities have stronger early reading skills (fluency not shown in Figure 3).
While this may not be surprising it is an important reminder that schools, families and Save the
Children staff should continue to find ways to offer these opportunities to children and encourage
their participation.
Figure 3. Relationship between Literacy Boost activity participation and literacy skills
77% 79% 82% 84% 86%
68% 72%
76% 81%
85%
33% 37%
41% 45%
48%
0%
10%
20%
30%
40%
50%
60%
70%
80%
90%
100%
0 1 2 3 4
% C
orr
ect
# LB activities attended
CAP
Accuracy
Reading comprehension

Literacy Boost Midline & Endline Report
14
F. Low Performing Students
Part of the 2013 BELAJAR program included an effort to focus on the lowest performing students. The
bottom 20% of students, which we will refer to as “low beginners”, could not read a single word from
the list of 20 most common words from a 2nd grade textbook at baseline in 2013. They also knew less
than 30 of 52 upper and lowercase letters, and 3/4 of the low beginners knew less than half the
concepts about print questions.
In order to understand how to best support this group of students it is important to understand how
these students’ background and behavior differ from their peers and likely influence their poor
performance. We also need to monitor which students continue struggling after a year of Literacy
Boost programming, and this will be the first point investigate here.
Overall in 2014, being a struggling student was defined by scoring at least one standard deviation below
the mean scores of letter and common word knowledge. Using this definition, 18 percent of students
were defined as struggling, 23 percent of control students and 12 percent of Literacy Boost students.
Looking back to 2013, of the 101 students defined as ‘low beginners’ in 2013, 32 were still struggling in
2014. Within this small group of students analyses find that significantly more control students who
were low beginners in 2013 continued to struggle in 2014 compared to Literacy Boost students.
Figure 4. Struggling students in 2013 and 2014, by group
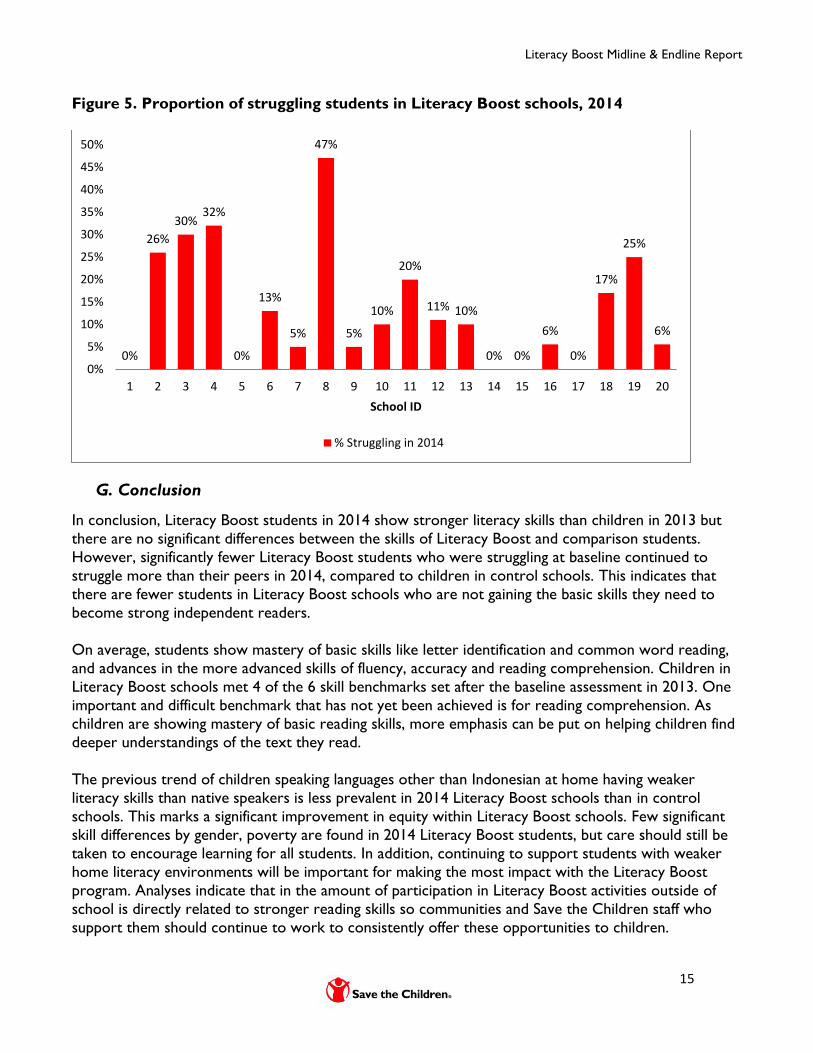
Within Literacy Boost schools, there is considerable variation in the proportion of students struggling
in each school, similar to 2013. Figure 5 displays the proportion if students scoring at least one
standard deviation below the mean letter and word knowledge scores in Literacy Boost schools.
Finally, the only variable found to predict being a struggling student was participation in
Literacy Boost activities. Students who participated in more literacy activities outside of
school were less likely to be struggling in 2014.
22% 23%
9%
17%
12%
2%
0%
10%
20%
30%
40%
50%
Low Beginner 2013 Struggling student 2014 Struggling in 2013 & 2014
Control Literacy Boost
Literacy Boost Midline & Endline Report
15
Figure 5. Proportion of struggling students in Literacy Boost schools, 2014
G. Conclusion
In conclusion, Literacy Boost students in 2014 show stronger literacy skills than children in 2013 but
there are no significant differences between the skills of Literacy Boost and comparison students.
However, significantly fewer Literacy Boost students who were struggling at baseline continued to
struggle more than their peers in 2014, compared to children in control schools. This indicates that
there are fewer students in Literacy Boost schools who are not gaining the basic skills they need to
become strong independent readers.
On average, students show mastery of basic skills like letter identification and common word reading,
and advances in the more advanced skills of fluency, accuracy and reading comprehension. Children in
Literacy Boost schools met 4 of the 6 skill benchmarks set after the baseline assessment in 2013. One
important and difficult benchmark that has not yet been achieved is for reading comprehension. As
children are showing mastery of basic reading skills, more emphasis can be put on helping children find
deeper understandings of the text they read.
The previous trend of children speaking languages other than Indonesian at home having weaker
literacy skills than native speakers is less prevalent in 2014 Literacy Boost schools than in control
schools. This marks a significant improvement in equity within Literacy Boost schools. Few significant
skill differences by gender, poverty are found in 2014 Literacy Boost students, but care should still be
taken to encourage learning for all students. In addition, continuing to support students with weaker
home literacy environments will be important for making the most impact with the Literacy Boost
program. Analyses indicate that in the amount of participation in Literacy Boost activities outside of
school is directly related to stronger reading skills so communities and Save the Children staff who
support them should continue to work to consistently offer these opportunities to children.
0%
26%
30% 32%
0%
13%
5%
47%
5%
10%
20%
11% 10%
0% 0%
6%
0%
17%
25%
6%
0%
5%
10%
15%
20%
25%
30%
35%
40%
45%
50%
1 2 3 4 5 6 7 8 9 10 11 12 13 14 15 16 17 18 19 20
School ID
% Struggling in 2014
Literacy Boost Midline & Endline Report
16
2012 – 2014 ANCP Evaluation
A. Context
Belu District, along with most of NTT province, is one of the poorer areas of Indonesia. The province
had an average GDP/capita of just $527 compared to the average for Indonesia—$3,223 in 2011. As
the district is on the border of Indonesia and Timor-Leste many people in the area are refugees from
the conflict. In 2011, Belu district has total 140 primary schools across 12 sub-districts. This ANCP
evaluation involved 20 ANCP-LB target schools across seven sub-districts. These 20 schools are
located in Kakulukmesak, Tasifeto Barat, Atambua Kota, Atambua Selatan, Raimanuk, Lasiolat, and
Tasifeto Timur sub-district.
B. Methods
Sampling
The 2012 sample included 395 students (199 boys, 196 girls) who were enrolled in Grade 2 in 20
Literacy Boost schools. The 2013 sample included 334 students (158 boys, 176 girls) who were
enrolled in Grade 2 in 20 Literacy Boost schools. The 2014 sample includes 389 children (199 boys,
190 girls) from 20 Literacy Boost schools. At each school where data was collected, 20 children in
Grade 2 were sampled. The same schools were sampled in 2012, 2013 and 2014, but the same children
were not followed from one year to the next. Therefore, this study will report on average scores in
2012, 2013 and 2014 but cannot speak to learning gains made by a specific group of students.
Analyses
This analysis has two purposes. First, we will investigate the literacy skills of Literacy Boost learners
and in 2012, 2013, and 2014. The second purpose is to assess what skills the students currently have,
and what areas and skills Literacy Boost should focus on.
To test the comparability of learners in the samples, this report will use comparison of means through
two-tailed t-tests, with clustered standard errors to account for the grouping of student-level data
within schools. Summary statistics will be used to analyze learners’ performance in each of the reading
sub-tests. Finally, this report will look to multilevel regression models to explore relationships between
literacy skills and student background characteristics and home literacy environment.
Comparing several different groupings of learners is possible with this data. Of particular interest are
children who do not speak Indonesian at home, girls, children with few socioeconomic resources and
children with weak home literacy environments. Data in this report will be disaggregated by group only
when the aforementioned clustered t-tests indicate statistically significant differences between groups.
Instruments
The assessment tool used for this endline data collection is slightly different than the tool used for the
baseline data collection in 2012 and 2013. The main differences being that 2014 assessment included a
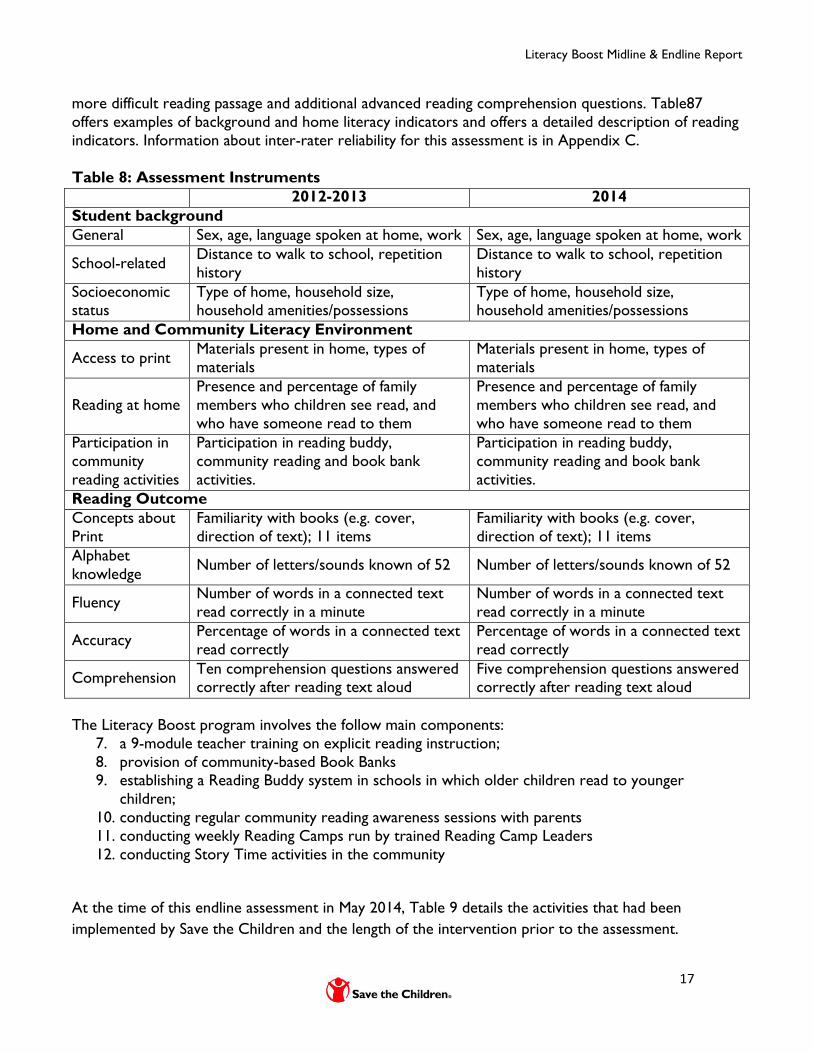
Literacy Boost Midline & Endline Report
17
more difficult reading passage and additional advanced reading comprehension questions. Table87
offers examples of background and home literacy indicators and offers a detailed description of reading
indicators. Information about inter-rater reliability for this assessment is in Appendix C.
Table 8: Assessment Instruments
2012-2013 2014
Student background
General Sex, age, language spoken at home, work Sex, age, language spoken at home, work
School-related Distance to walk to school, repetition
history
Distance to walk to school, repetition
history
Socioeconomic status
Type of home, household size, household amenities/possessions
Type of home, household size, household amenities/possessions
Home and Community Literacy Environment
Access to print Materials present in home, types of
materials
Materials present in home, types of
materials
Reading at home
Presence and percentage of family
members who children see read, and
who have someone read to them
Presence and percentage of family
members who children see read, and
who have someone read to them
Participation in
community
reading activities
Participation in reading buddy,
community reading and book bank
activities.
Participation in reading buddy,
community reading and book bank
activities.
Reading Outcome
Concepts about
Familiarity with books (e.g. cover,
direction of text); 11 items
Familiarity with books (e.g. cover,
direction of text); 11 items
Alphabet
knowledge Number of letters/sounds known of 52 Number of letters/sounds known of 52
Fluency Number of words in a connected text
read correctly in a minute
Number of words in a connected text
read correctly in a minute
Accuracy Percentage of words in a connected text
read correctly
Percentage of words in a connected text
read correctly
Comprehension Ten comprehension questions answered correctly after reading text aloud
Five comprehension questions answered correctly after reading text aloud
The Literacy Boost program involves the follow main components:
7. a 9-module teacher training on explicit reading instruction;
8. provision of community-based Book Banks 9. establishing a Reading Buddy system in schools in which older children read to younger
children;
10. conducting regular community reading awareness sessions with parents
11. conducting weekly Reading Camps run by trained Reading Camp Leaders
12. conducting Story Time activities in the community
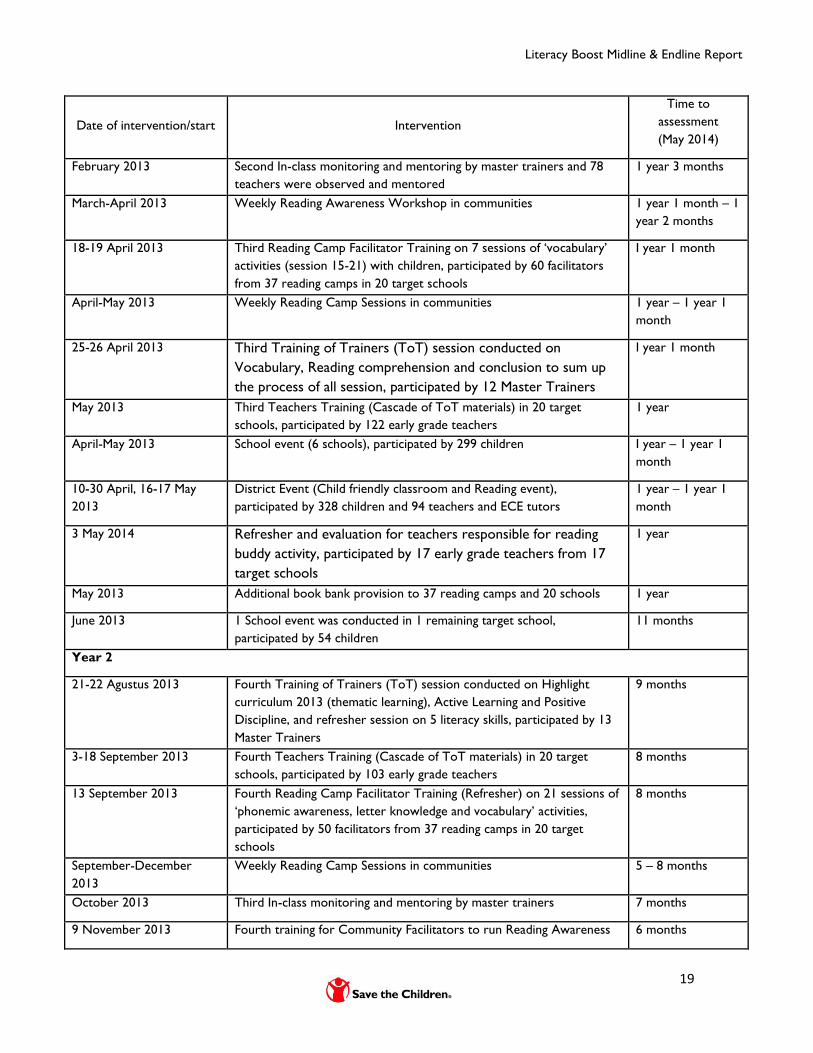
At the time of this endline assessment in May 2014, Table 9 details the activities that had been
implemented by Save the Children and the length of the intervention prior to the assessment.

Literacy Boost Midline & Endline Report
18
Table 9: Literacy Boost Implementation Timeline
Date of intervention/start Intervention
Time to
assessment
(May 2014)
Year 1
09-10 October 2012 First Training of Trainers (ToT) session conducted on Introduction to
Reading Development and instruction for Young Children (include
print rich environment), Letter Knowledge and Phonemic Awareness,
participated by 14 Master Trainers
1 year 7 months
17-24 October 2012 First Teachers Training (Cascade of ToT materials) in 20 target
schools, participated by 90 early grade teachers
1 year 7 months
18-19 October 2012 First Reading Camp Facilitator Training on 7 sessions of ‘phonemic
awareness’ activities (session 1-7) with children, participated by 64
facilitators from 37 reading camps in 20 target schools
1 year 7 months
October-December 2012 Weekly Reading Camp Sessions in communities I year 5 months – I
year 7 months
07-08 November 2012 First training for 34 Community Facilitators to run Reading Awareness
Workshop at school level with parents
1 year 6 months
November 2012 Read a thon period 1 year 6 months
December 2012-January
2013
School event (5 schools), participated by 57 children 1 year 4 months –
1 year 5 months
December 2012-January
2013
Weekly Reading Awareness Workshop in communities 1 year 4 months –
1 year 5 months
November 2012 First In-class monitoring and mentoring by master trainers and 51
teachers were observed and mentored
1 year 6 months
10-11 January 2013 Second Reading Camp Facilitator Training on 7 sessions of ‘letter
knowledge’ activities (session 8-14) with children, participated by 57
facilitators from 37 reading camps in 20 target schools
1 year 4 months
January-March 2013 Weekly Reading Camp Sessions in communities 1 year 2 months –
1 year 4 months
January 2013 Book Bank Delivery to 37 reading camps and 20 schools 1 year 4 months
17-18 January 2013 Second Training of Trainers (ToT) session conducted on
Formative Assessment, Language Issue in Literacy Classroom
and Reading Fluency, participated by 14 Master Trainers
1 year 4 months
31 January 2013 First orientation for teachers responsible for reading buddy
activity, participated by 20 early grade teachers from 20 target
schools
1 year 4 months
6 February to 5 March
2013
Second Teachers Training (Cascade of ToT materials) in 20 target
schools, participated by 132 early grade teachers
1 year 2 months –
1 year 3 months
25 February 2013 Second training (refresher and evaluation) for Community Facilitators
to run Reading Awareness Workshop at school level with parents,
participated by 20 facilitators
1 year 3 months
Literacy Boost Midline & Endline Report
19
Date of intervention/start Intervention
Time to
assessment
(May 2014)
February 2013 Second In-class monitoring and mentoring by master trainers and 78
teachers were observed and mentored
1 year 3 months
March-April 2013 Weekly Reading Awareness Workshop in communities 1 year 1 month – 1
year 2 months
18-19 April 2013 Third Reading Camp Facilitator Training on 7 sessions of ‘vocabulary’
activities (session 15-21) with children, participated by 60 facilitators
from 37 reading camps in 20 target schools
I year 1 month
April-May 2013 Weekly Reading Camp Sessions in communities 1 year – 1 year 1
month
25-26 April 2013 Third Training of Trainers (ToT) session conducted on
Vocabulary, Reading comprehension and conclusion to sum up
the process of all session, participated by 12 Master Trainers
I year 1 month
May 2013 Third Teachers Training (Cascade of ToT materials) in 20 target
schools, participated by 122 early grade teachers
1 year
April-May 2013 School event (6 schools), participated by 299 children I year – 1 year 1
month
10-30 April, 16-17 May
2013
District Event (Child friendly classroom and Reading event),
participated by 328 children and 94 teachers and ECE tutors
1 year – 1 year 1
month
3 May 2014 Refresher and evaluation for teachers responsible for reading
buddy activity, participated by 17 early grade teachers from 17
target schools
1 year
May 2013 Additional book bank provision to 37 reading camps and 20 schools 1 year
June 2013 1 School event was conducted in 1 remaining target school,
participated by 54 children
11 months
Year 2
21-22 Agustus 2013 Fourth Training of Trainers (ToT) session conducted on Highlight
curriculum 2013 (thematic learning), Active Learning and Positive
Discipline, and refresher session on 5 literacy skills, participated by 13
Master Trainers
9 months
3-18 September 2013 Fourth Teachers Training (Cascade of ToT materials) in 20 target
schools, participated by 103 early grade teachers
8 months
13 September 2013 Fourth Reading Camp Facilitator Training (Refresher) on 21 sessions of
‘phonemic awareness, letter knowledge and vocabulary’ activities,
participated by 50 facilitators from 37 reading camps in 20 target
schools
8 months
September-December
2013
Weekly Reading Camp Sessions in communities 5 – 8 months
October 2013 Third In-class monitoring and mentoring by master trainers 7 months
9 November 2013 Fourth training for Community Facilitators to run Reading Awareness 6 months
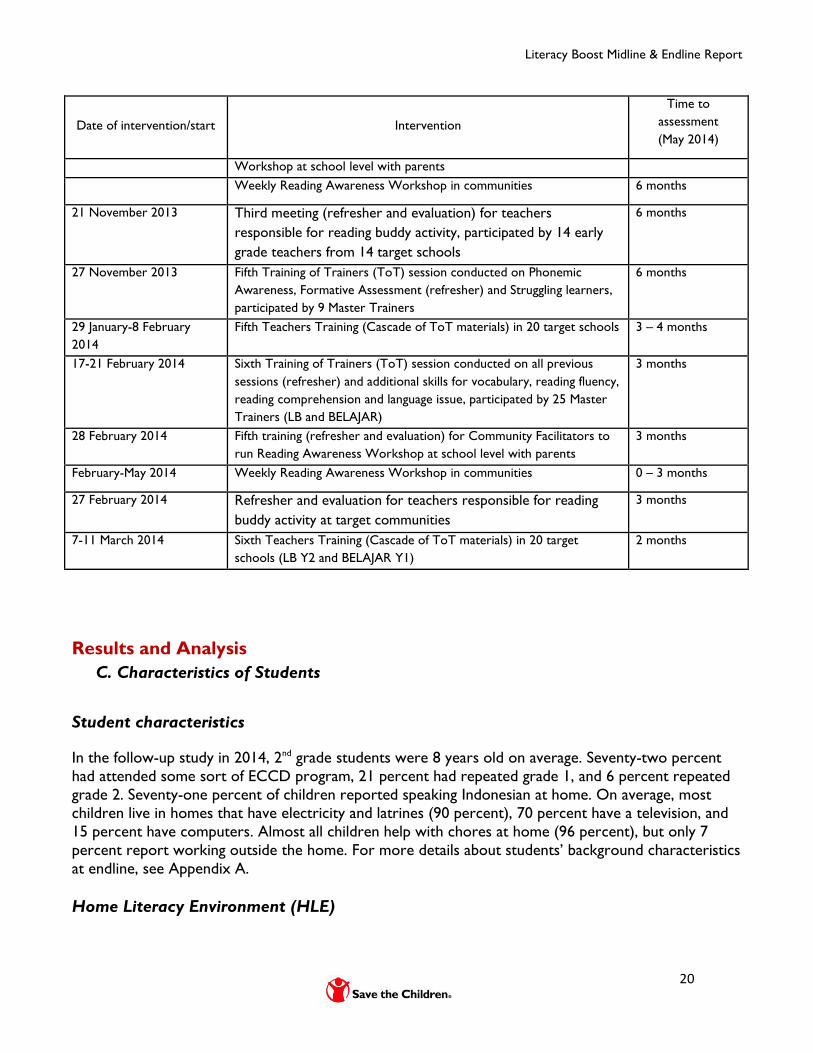
Literacy Boost Midline & Endline Report
20
Date of intervention/start Intervention
Time to
assessment
(May 2014)
Workshop at school level with parents
Weekly Reading Awareness Workshop in communities 6 months
21 November 2013 Third meeting (refresher and evaluation) for teachers
responsible for reading buddy activity, participated by 14 early
grade teachers from 14 target schools
6 months
27 November 2013 Fifth Training of Trainers (ToT) session conducted on Phonemic
Awareness, Formative Assessment (refresher) and Struggling learners,
participated by 9 Master Trainers
6 months
29 January-8 February
2014
Fifth Teachers Training (Cascade of ToT materials) in 20 target schools 3 – 4 months
17-21 February 2014 Sixth Training of Trainers (ToT) session conducted on all previous
sessions (refresher) and additional skills for vocabulary, reading fluency,
reading comprehension and language issue, participated by 25 Master
Trainers (LB and BELAJAR)
3 months
28 February 2014 Fifth training (refresher and evaluation) for Community Facilitators to
run Reading Awareness Workshop at school level with parents
3 months
February-May 2014 Weekly Reading Awareness Workshop in communities 0 – 3 months
27 February 2014 Refresher and evaluation for teachers responsible for reading
buddy activity at target communities
3 months
7-11 March 2014 Sixth Teachers Training (Cascade of ToT materials) in 20 target
schools (LB Y2 and BELAJAR Y1)
2 months
Results and Analysis
C. Characteristics of Students
Student characteristics
In the follow-up study in 2014, 2nd grade students were 8 years old on average. Seventy-two percent
had attended some sort of ECCD program, 21 percent had repeated grade 1, and 6 percent repeated
grade 2. Seventy-one percent of children reported speaking Indonesian at home. On average, most
children live in homes that have electricity and latrines (90 percent), 70 percent have a television, and
15 percent have computers. Almost all children help with chores at home (96 percent), but only 7
percent report working outside the home. For more details about students’ background characteristics
at endline, see Appendix A.
Home Literacy Environment (HLE)
Literacy Boost Midline & Endline Report
21
Table 10 displays 2012, 2013 and 2014 averages for key measures of home literacy environment. Since
2012 the majority of students have been living in households where parents were actively engaged in
literacy activities at home. The proportion of children from homes where family members are engaging
them in literacy activities, and the proportion of homes with child-friendly reading materials remain
high in 2013 and 2014 and tend to be highest in 2013. Twenty additional schools were added to the
program in 2014 so it could be the case that due to increasing program delivery from 20 schools to 40
schools reduced the intensive focus that the 2013 schools received. The variation could also be
random, but program staff may want to engage a group of parents in a focus group discussion or some
other forum about how and when they engage in literacy activities with their children. Children may be
receiving more exposure to reading outside of school through Literacy Boost activities but parents and
caretakers are still key supporters of their children’s literacy development.
Table 10. Average 2012, 2013 and 2014 scores for students’ home literacy environments
2012 2013 2014
See someone at home reading 83% 89% 92%
Someone at home helps child study 95% 98% 96%
Someone at home reads to child 76% 84% 78%
Someone at home tells stories to child 69% 83% 75%
# of types of reading materials 2.9 3.3 3.0
Storybooks at home 55% 69% 61%
Community Reading Activities
As seen in Table 11, overall children report participating in about 2 out of 4 Literacy Boost activities
on average in 2013 and 2014. However, 98 percent of children in 2013 could name their reading
buddy, compared to 60 percent in 2014, and 89 percent reported meeting with their buddy in the past
week, compared to 50 percent in 2014. Similarly, 68 percent of children reported creating their own
reading materials in 2013, compared to 33 percent in 2014. This may reflect a shift in the availability of
different activities or difficulties with continuing to offer Literacy Boost activities for children. For
example, twenty additional schools were added to the program in 2014 so it could be the case that
due to increasing program delivery from 20 schools to 40 schools reduced the intensive focus that the
2013 schools received. Program staff should investigate these variations, and meet with teachers,
school groups and parents to discuss methods for continuing to support and promote Literacy Boost
activities. If new materials are needed for book banks, teachers, parents and older students could get
together to write new short stories for students. In addition, new activities like a Read-a-thon could be
introduced to maintain students’ excitement around reading outside of school.
Table 11. Frequency of attendance at Literacy Boost activities, by year
2013 2014
Used book bank 57% 52%
Named favorite story 73% 42%
Has a reading buddy 66% 61%
Name reading buddy 98% 60%
Literacy Boost Midline & Endline Report
22
Met with reading buddy last week 89% 50%
Frequency of meeting with reading buddy (days per week) 1.5 1.2
Attended reading camp 55% 46%
Frequency of attendance at reading camp (days per week) 0.9 0.9
Created book at reading camp 68% 33%
Frequency of book creation (1=Rarely, 2=Sometimes, 3=Often) 1.0 0.5
Participation total (Out of 4) 1.8 1.9
In addition, the Indonesian team added questions that asked children how they think they would be
helped to read better. The most popular answer by far was having more time to practice, followed by
more interesting things to read and more help or assistance when reading. The Literacy Boost team
can take these student preferences into consideration as they plan for the next school year.
Table 12. Student reported strategies for learning to read better, Literacy Boost 2014
Activity Average
More time to practice 63.2%
More books to read 17.7%
More interesting books 2.8%
Teachers are more exciting 9.3%
Help/assistance when reading 17.7%
Other 1.3%
D. Results of Reading Skills by Sub-Test
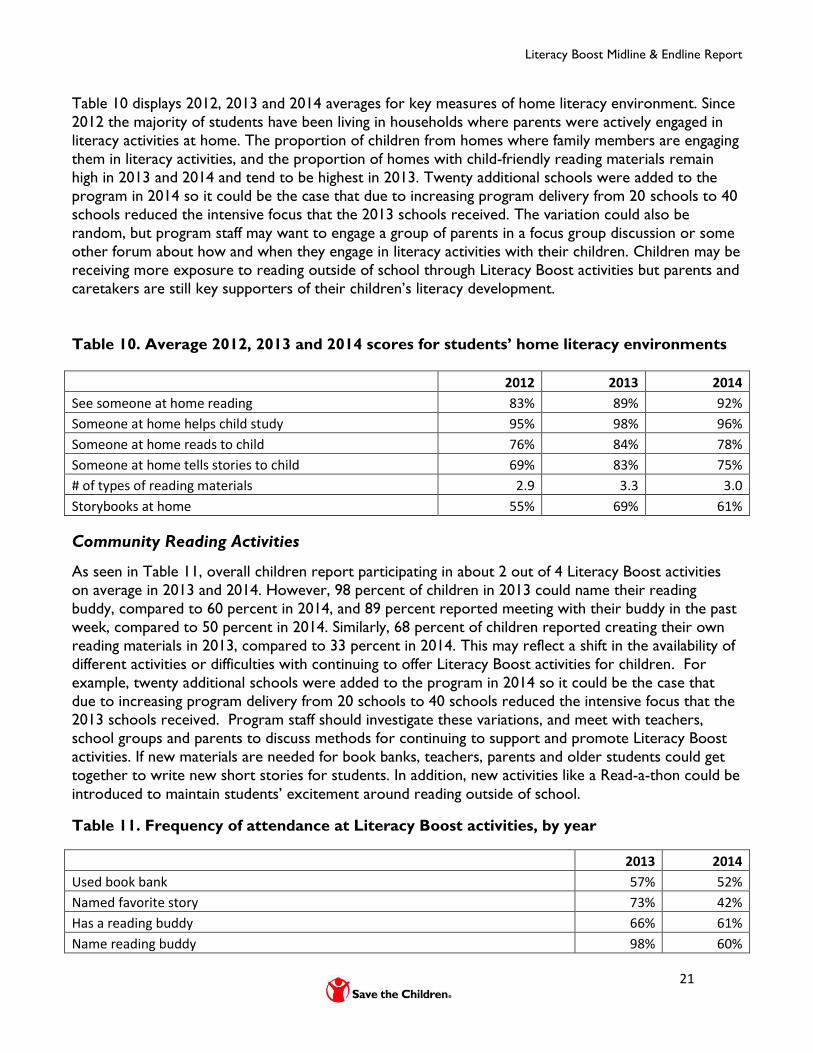
In this section we examine average scores for 2nd grade students in each literacy skill area in 2012,
2013 and 2014. Figure 4 provide summaries of average scores on each subtest for all students in 2012,
2013 and 2014. On average, students show mastery of basic skills and strong scores for more advanced
skills as well. Reductions in reading comprehension from 2013 to 2014 should be interpreted with
caution as the number of reading comprehension questions was expanded from 5 to 10 and included
more evaluative questions in 2014.
Literacy Boost Midline & Endline Report
23
Figure 6. Average Literacy Scores for Grade 2 Literacy Boost students in 2012, 2013 and
2014
Enabling students to read with comprehension is the one of the primary goals of Literacy Boost. With
the expanded comprehension questions used in 2014 it is easier to analyze which level of
comprehension students are achieving. Readers with comprehension are those students who can read
a grade-level text independently and answer at least 80 percent of comprehension questions correctly.
In 2014, 28 percent of grade 2 students fell into this highest level of comprehension. Given the mastery
that students are showing across the more basic skills, growth in this area of reading comprehension
would be an appropriate goal for future assessments.
Figure 5 displays changes in the proportion of students reading with comprehension from 2012 to
2014. However, this figure should be interpreted with caution as the reading passage as well as the
amount and difficulty of the comprehension questions changed between 2013 and 2014.
Literacy Boost Midline & Endline Report
24
Figure 7. Reading comprehension tiers, 2014 Literacy Boost students
Note: Emergent Readers correctly answers less than 50 percent of the comprehension questions; Beginning readers
correctly answers between 50 and 80 percent of the questions correctly; Readers with Comprehension correctly answers
more that 80 percent of the comprehension questions. Tier cut-offs were set in combination with associated fluency and
accuracy levels in each language and country, vary based on the number of comprehension questions asked.
E. Learning Equity and Struggling Students
This section will use data from 2014 to focus on learning differences between students experiencing
different types of disadvantages. Specifically we will focus on girls, children from socioeconomically
disadvantaged homes, and those with the fewest home literacy resources.
Learning Equity
Overall, few equity related differences are found between students’ skill profiles in 2014. Previously,
children who did not speak Indonesian at home were found to have weaker advanced literacy skills,
and those differences continue to be observed for CAP and reading comprehension in this sample. The
gender differences observed are that girls’ having stronger common word knowledge and fluency skills
than boys. Additionally, children who attended an early childhood program tend to have more
advanced CAP skills.
Literacy Boost Participation
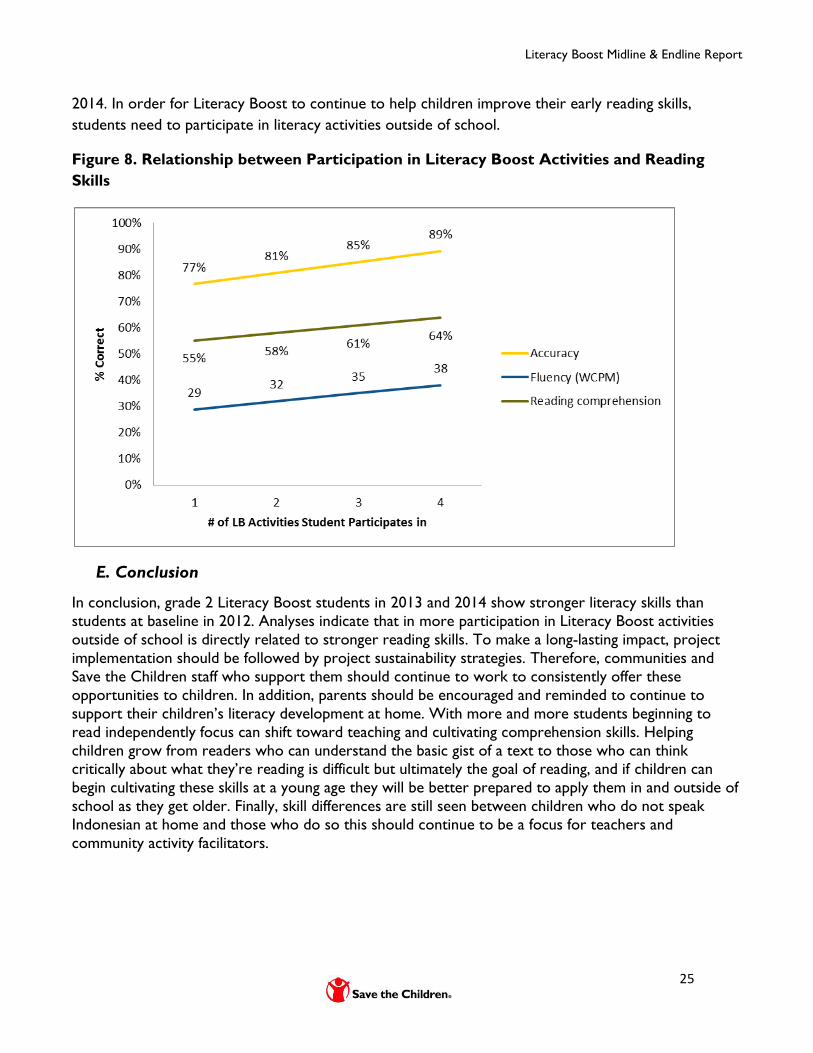
Although analyses did not find strong relationships between SES or HLE and reading skills, there is a
significant relationship between participation in Literacy Boost activities and all skills. That is, the more
Literacy Boost activities children report engaging in, the stronger their literacy skills. Figure 5 displays
this relationship for the higher order skills of fluency, accuracy and reading comprehension. These
results are particularly salient given the reduction in participation of some activities between 2013 and
Literacy Boost Midline & Endline Report
25
2014. In order for Literacy Boost to continue to help children improve their early reading skills,
students need to participate in literacy activities outside of school.
Figure 8. Relationship between Participation in Literacy Boost Activities and Reading
Skills
E. Conclusion
In conclusion, grade 2 Literacy Boost students in 2013 and 2014 show stronger literacy skills than
students at baseline in 2012. Analyses indicate that in more participation in Literacy Boost activities
outside of school is directly related to stronger reading skills. To make a long-lasting impact, project
implementation should be followed by project sustainability strategies. Therefore, communities and
Save the Children staff who support them should continue to work to consistently offer these
opportunities to children. In addition, parents should be encouraged and reminded to continue to
support their children’s literacy development at home. With more and more students beginning to
read independently focus can shift toward teaching and cultivating comprehension skills. Helping
children grow from readers who can understand the basic gist of a text to those who can think critically about what they’re reading is difficult but ultimately the goal of reading, and if children can
begin cultivating these skills at a young age they will be better prepared to apply them in and outside of
school as they get older. Finally, skill differences are still seen between children who do not speak
Indonesian at home and those who do so this should continue to be a focus for teachers and
community activity facilitators.
Literacy Boost Midline & Endline Report
26
Appendix A. Background information
Table A1. Background, Socioeconomic, Health, Home Learning Environment and Literacy Characteristics for
students present and baseline and midline: BELAJAR 2014
Control (N=243) Literacy Boost (N=247) Average (N=490)
Sex 50% 54% 52%
Age 8.5 7.9 8.2
Attended ECCD 31% 29% 30%
Repeat Grade 1 40% 36% 38%
Repeat Grade 2 18% 11% 15%
Speaks Indonesian at home 35% 52% 43%
Electricity 46% 76% 61%
Latrine 61% 75% 68%
TV 19% 43% 31%
Refrigerator 3% 5% 4%
Motorcycle 23% 33% 28%
Computer 1% 4% 2%
Total Household items 2.2 3.1 2.6
Textbook 73% 87% 80%
Religious book 79% 82% 81%
Magazine 6% 7% 6%
Newspaper 22% 30% 26%
Storybook 47% 66% 57%
# types of reading material 2.3 2.7 2.5
# people in home 4.3 4.3 4.3
% adults in home 53% 53% 53%
% women in home 54% 56% 55%
# people seen reading 2.1 2.3 2.2
% people seen reading 49% 54% 52%
# people help with studying 2.4 2.6 2.5
% people help with studying 58% 63% 60%
# people reading to child 1.6 1.7 1.6
% people reading to child 36% 40% 38%
# people telling stories 1.6 1.7 1.6
% people telling stories 37% 40% 39%
# people playing games 3.2 3.0 3.1
% people playing games 73% 69% 71%
Anyone at home seen reading 86% 87% 87%
Anyone at home helping study 92% 95% 93%
Anyone at home reading to child 68% 73% 70%
Anyone at home telling stories 68% 72% 70%
Anyone at home playing games 95% 96% 95%
Literacy Boost Midline & Endline Report
27
Control (N=243) Literacy Boost (N=247) Average (N=490)
Does chores at home 97% 98% 97%
Morning chores 0.7 0.8 0.7
Afternoon chores 1.2 1.1 1.2
Evening chores 0.7 0.7 0.7
Weekend chores 1.4 1.5 1.4
Does work outside the home 8% 7% 7%
Morning work 0.0 0.3 0.2
Afternoon work 1.0 0.9 0.9
Evening work 0.2 0.1 0.1
Weekend work 1.2 1.1 1.2
Morning studying 0.3 0.3 0.3
Afternoon studying 0.6 0.7 0.6
Evening studying 1.3 1.3 1.3
Weekend studying 1.0 1.0 1.0
Reading frequency (0=Never, 3=Often) 2.5 2.7 2.6
What do you do to learn to read?
More time to practice 59% 61% 60%
More books to read 10% 18% 14%
More interesting books 0% 3% 2%
Teachers are more exciting 6% 7% 7%
Help/assistance when reading 20% 16% 18%
Exchange books in community 19% 25% 22%
Why miss school?
School closed 1% 1% 1%
No teacher 5% 5% 5%
Sick 5% 9% 7%
Playing 10% 8% 9%
Ate breakfast 96% 96% 96%
Breakfast size (1= small, 2=normal) 1.9 1.9 1.9
Ate lunch 100% 100% 100%
Lunch size (1=small, 2=normal) 2.0 2.0 2.0
Use mosquito net 79% 86% 83% *p<.05, **p<.01, ***p<.001
Literacy Boost Midline & Endline Report
28
Table A2. Background, Socioeconomic, Health, Home Learning Environment and Literacy Characteristics for
Literacy Boost Students: ANCP 2014
Literacy Boost
Sex 48.8%
Age 7.87
Attended ECCD 72.5%
Repeat Grade 1 20.8%
Repeat Grade 2 5.9%
Speaks Indonesian at home 71.5%
Electricity 89.7%
Latrine 90.2%
TV 70.4%
Refrigerator 33.2%
Motorcycle 61.7%
Computer 14.9%
Total Household items 3.6
# people in home 4.4
% adults in home 51.6%
% women in home 57.9%
# people seen reading 2.6
% people seen reading 59.1%
# people help with studying 2.9
% people help with studying 67.6%
# people reading to child 1.9
% people reading to child 43.4%
# people telling stories 2.0
% people telling stories 45.0%
# people playing games 3.0
% people playing games 67.0%
Does chores at home 96.1%
Morning chores 0.8
Afternoon chores 1.1
Evening chores 0.7
Weekend chores 1.4
Does work outside the home 0.1
Morning work 0.0
Afternoon work 0.1
Evening work 0.0
Weekend work 0.1
Morning studying 0.6
Afternoon studying 0.9
Literacy Boost Midline & Endline Report
29
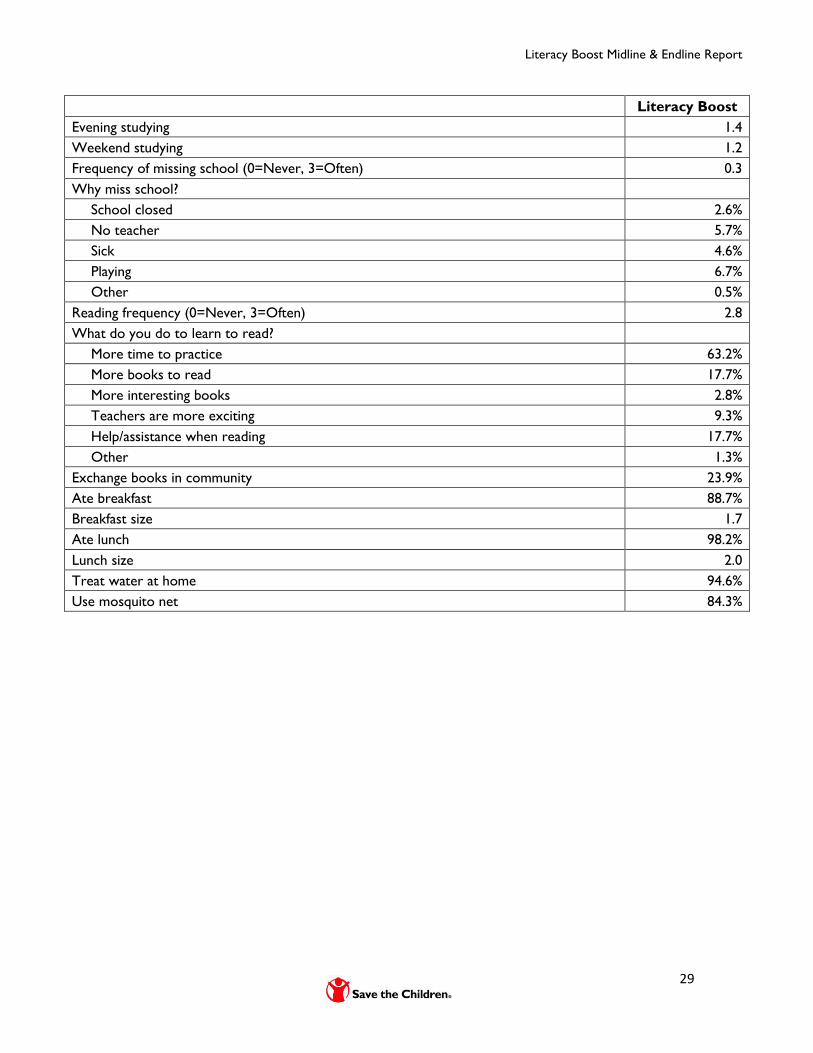
Literacy Boost
Evening studying 1.4
Weekend studying 1.2
Frequency of missing school (0=Never, 3=Often) 0.3
Why miss school?
School closed 2.6%
No teacher 5.7%
Sick 4.6%
Playing 6.7%
Other 0.5%
Reading frequency (0=Never, 3=Often) 2.8
What do you do to learn to read?
More time to practice 63.2%
More books to read 17.7%
More interesting books 2.8%
Teachers are more exciting 9.3%
Help/assistance when reading 17.7%
Other 1.3%
Exchange books in community 23.9%
Ate breakfast 88.7%
Breakfast size 1.7
Ate lunch 98.2%
Lunch size 2.0
Treat water at home 94.6%
Use mosquito net 84.3%

Literacy Boost Midline & Endline Report
30
Appendix B. Regression Results
Table B1. Equity regression analysis for Literacy Boost students: BELAJAR 2014
1 2 3 4 5 6 7
VARIABLES CAP Letter ID
Common
words Accuracy Fluency
Reading
Comprehension Reader
Age 0.0103 0.00412 0.00427 -0.00193 0.968 0.00994 0.06
(0.00798) (0.00395) (0.00900) (0.0165) (0.802) (0.0125) (0.097)
Sex 0.00479 -0.00119 -0.0212 0.0128 -0.536 0.0455 0.55*
(0.0175) (0.0189) (0.0339) (0.0409) (2.358) (0.0330) (0.26)
Attended ECD 0.0266 0.00865 0.0185 -0.0374 -0.450 -0.00936 -0.09
(0.0219) (0.0159) (0.0267) (0.0415) (2.794) (0.0392) (0.34)
Speak Indonesian at home 0.0362 0.00715 0.0324 0.0482 2.319 0.0595 0.34
(0.0224) (0.0197) (0.0299) (0.0387) (2.735) (0.0396) (0.30)
SES total score 0.00827 -0.00455 0.00159 0.00106 0.465 0.0292~ 0.04
(0.00800) (0.00769) (0.0163) (0.0178) (0.973) (0.0153) (0.11)
# types of reading material at home 0.000790 0.0135 0.0235 0.0368~ 2.090 0.0282 0.28
(0.00921) (0.0100) (0.0167) (0.0208) (1.335) (0.0260) (0.17)
HLE activity quintiles -0.00121 0.000701 -0.00455 -0.0238~ -1.776* 0.0107 -0.13
(0.00712) (0.00611) (0.00942) (0.0124) (0.783) (0.0161) (0.10)
Total chore time 0.00686 0.00933 0.0182~ 0.0325~ 0.573 0.00290 0.10
(0.00416) (0.00561) (0.0104) (0.0164) (0.785) (0.0165) (0.09)
Total participation in LB activities 0.0231* 0.00736 0.0160 0.0436* 1.668* 0.0375* 0.23*
(0.00837) (0.00457) (0.0111) (0.0154) (0.771) (0.0146) (0.09)
Constant 0.615*** 0.777*** 0.576*** 0.513* 9.238 0.0234 -1.19
(0.0826) (0.0673) (0.119) (0.183) (7.138) (0.167) (1.07)
Observations 287 287 287 287 287 287 287
R-squared 0.091 0.043 0.042 0.067 0.043 0.096
*p<.05, **p<.01, ***p<.001
Literacy Boost Midline & Endline Report
31
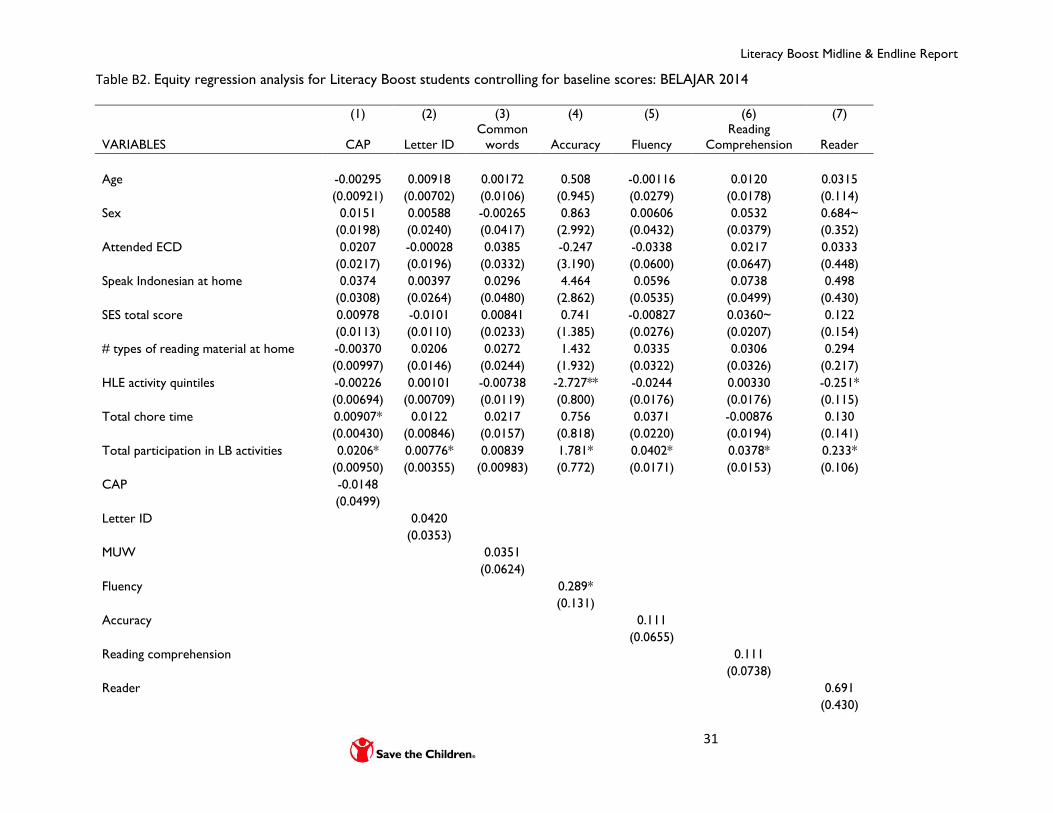
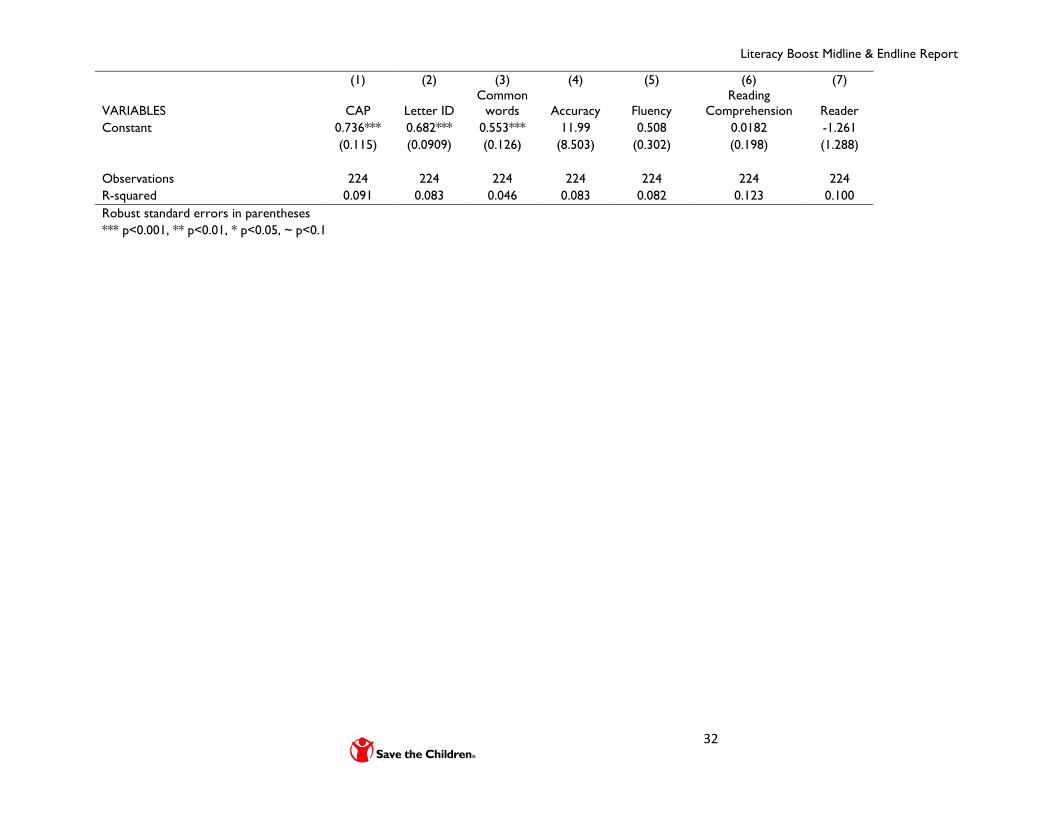
Table B2. Equity regression analysis for Literacy Boost students controlling for baseline scores: BELAJAR 2014
(1) (2) (3) (4) (5) (6) (7)
VARIABLES CAP Letter ID
Common
words Accuracy Fluency
Reading
Comprehension Reader
Age -0.00295 0.00918 0.00172 0.508 -0.00116 0.0120 0.0315
(0.00921) (0.00702) (0.0106) (0.945) (0.0279) (0.0178) (0.114)
Sex 0.0151 0.00588 -0.00265 0.863 0.00606 0.0532 0.684~
(0.0198) (0.0240) (0.0417) (2.992) (0.0432) (0.0379) (0.352)
Attended ECD 0.0207 -0.00028 0.0385 -0.247 -0.0338 0.0217 0.0333
(0.0217) (0.0196) (0.0332) (3.190) (0.0600) (0.0647) (0.448)
Speak Indonesian at home 0.0374 0.00397 0.0296 4.464 0.0596 0.0738 0.498
(0.0308) (0.0264) (0.0480) (2.862) (0.0535) (0.0499) (0.430)
SES total score 0.00978 -0.0101 0.00841 0.741 -0.00827 0.0360~ 0.122
(0.0113) (0.0110) (0.0233) (1.385) (0.0276) (0.0207) (0.154)
# types of reading material at home -0.00370 0.0206 0.0272 1.432 0.0335 0.0306 0.294
(0.00997) (0.0146) (0.0244) (1.932) (0.0322) (0.0326) (0.217)
HLE activity quintiles -0.00226 0.00101 -0.00738 -2.727** -0.0244 0.00330 -0.251*
(0.00694) (0.00709) (0.0119) (0.800) (0.0176) (0.0176) (0.115)
Total chore time 0.00907* 0.0122 0.0217 0.756 0.0371 -0.00876 0.130
(0.00430) (0.00846) (0.0157) (0.818) (0.0220) (0.0194) (0.141)
Total participation in LB activities 0.0206* 0.00776* 0.00839 1.781* 0.0402* 0.0378* 0.233*
(0.00950) (0.00355) (0.00983) (0.772) (0.0171) (0.0153) (0.106)
CAP -0.0148
(0.0499)
Letter ID
0.0420
(0.0353)
MUW
0.0351
(0.0624)
Fluency
0.289*
(0.131)
Accuracy
0.111
(0.0655)
Reading comprehension
0.111
(0.0738)
Reader
0.691
(0.430)
Literacy Boost Midline & Endline Report
32
(1) (2) (3) (4) (5) (6) (7)
VARIABLES CAP Letter ID
Common
words Accuracy Fluency
Reading
Comprehension Reader
Constant 0.736*** 0.682*** 0.553*** 11.99 0.508 0.0182 -1.261
(0.115) (0.0909) (0.126) (8.503) (0.302) (0.198) (1.288)
Observations 224 224 224 224 224 224 224
R-squared 0.091 0.083 0.046 0.083 0.082 0.123 0.100
Robust standard errors in parentheses
*** p<0.001, ** p<0.01, * p<0.05, ~ p<0.1
Literacy Boost Midline & Endline Report
33
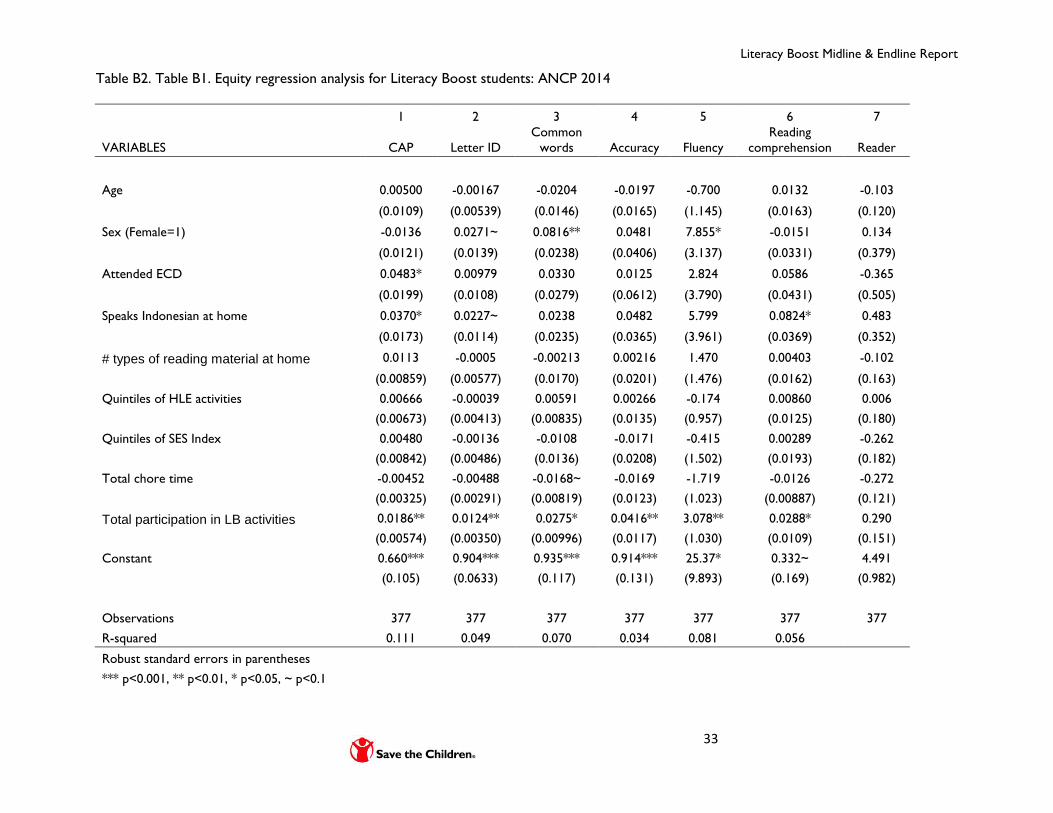
Table B2. Table B1. Equity regression analysis for Literacy Boost students: ANCP 2014
1 2 3 4 5 6 7
VARIABLES CAP Letter ID
Common
words Accuracy Fluency
Reading
comprehension Reader
Age 0.00500 -0.00167 -0.0204 -0.0197 -0.700 0.0132 -0.103
(0.0109) (0.00539) (0.0146) (0.0165) (1.145) (0.0163) (0.120)
Sex (Female=1) -0.0136 0.0271~ 0.0816** 0.0481 7.855* -0.0151 0.134
(0.0121) (0.0139) (0.0238) (0.0406) (3.137) (0.0331) (0.379)
Attended ECD 0.0483* 0.00979 0.0330 0.0125 2.824 0.0586 -0.365
(0.0199) (0.0108) (0.0279) (0.0612) (3.790) (0.0431) (0.505)
Speaks Indonesian at home 0.0370* 0.0227~ 0.0238 0.0482 5.799 0.0824* 0.483
(0.0173) (0.0114) (0.0235) (0.0365) (3.961) (0.0369) (0.352)
# types of reading material at home 0.0113 -0.0005 -0.00213 0.00216 1.470 0.00403 -0.102
(0.00859) (0.00577) (0.0170) (0.0201) (1.476) (0.0162) (0.163)
Quintiles of HLE activities 0.00666 -0.00039 0.00591 0.00266 -0.174 0.00860 0.006
(0.00673) (0.00413) (0.00835) (0.0135) (0.957) (0.0125) (0.180)
Quintiles of SES Index 0.00480 -0.00136 -0.0108 -0.0171 -0.415 0.00289 -0.262
(0.00842) (0.00486) (0.0136) (0.0208) (1.502) (0.0193) (0.182)
Total chore time -0.00452 -0.00488 -0.0168~ -0.0169 -1.719 -0.0126 -0.272
(0.00325) (0.00291) (0.00819) (0.0123) (1.023) (0.00887) (0.121)
Total participation in LB activities 0.0186** 0.0124** 0.0275* 0.0416** 3.078** 0.0288* 0.290
(0.00574) (0.00350) (0.00996) (0.0117) (1.030) (0.0109) (0.151)
Constant 0.660*** 0.904*** 0.935*** 0.914*** 25.37* 0.332~ 4.491
(0.105) (0.0633) (0.117) (0.131) (9.893) (0.169) (0.982)
Observations 377 377 377 377 377 377 377
R-squared 0.111 0.049 0.070 0.034 0.081 0.056
Robust standard errors in parentheses
*** p<0.001, ** p<0.01, * p<0.05, ~ p<0.1
Literacy Boost Midline & Endline Report
34
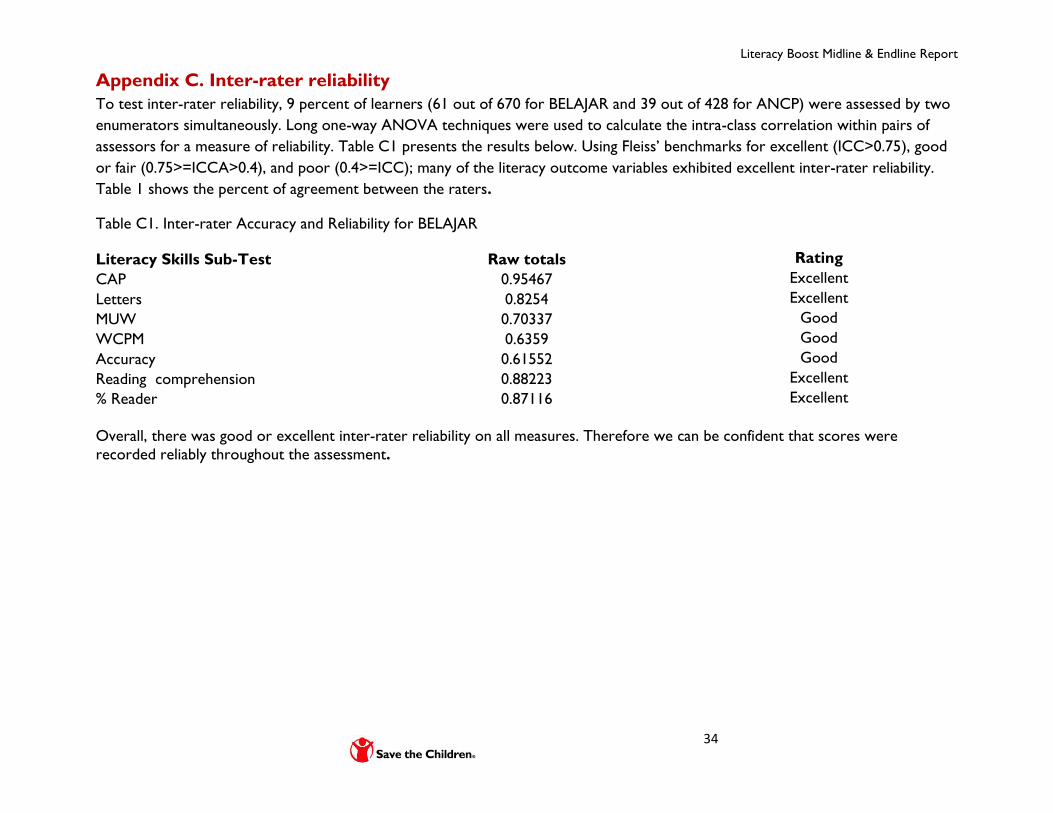
Appendix C. Inter-rater reliability
To test inter-rater reliability, 9 percent of learners (61 out of 670 for BELAJAR and 39 out of 428 for ANCP) were assessed by two
enumerators simultaneously. Long one-way ANOVA techniques were used to calculate the intra-class correlation within pairs of
assessors for a measure of reliability. Table C1 presents the results below. Using Fleiss’ benchmarks for excellent (ICC>0.75), good
or fair (0.75>=ICCA>0.4), and poor (0.4>=ICC); many of the literacy outcome variables exhibited excellent inter-rater reliability.
Table 1 shows the percent of agreement between the raters.
Table C1. Inter-rater Accuracy and Reliability for BELAJAR
Literacy Skills Sub-Test Raw totals Rating
CAP 0.95467 Excellent
Letters 0.8254 Excellent
MUW 0.70337 Good
WCPM 0.6359 Good
Accuracy 0.61552 Good
Reading comprehension 0.88223 Excellent
% Reader 0.87116 Excellent
Overall, there was good or excellent inter-rater reliability on all measures. Therefore we can be confident that scores were
recorded reliably throughout the assessment.
Literacy Boost Midline & Endline Report
35
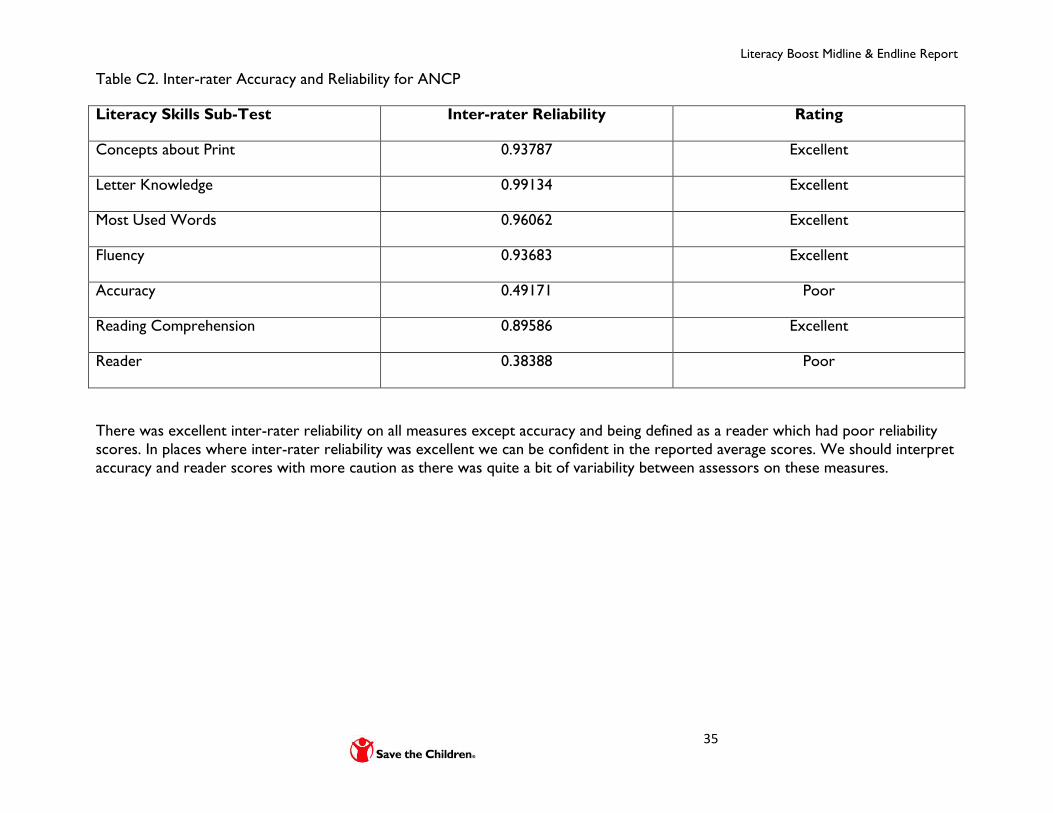
Table C2. Inter-rater Accuracy and Reliability for ANCP
Literacy Skills Sub-Test Inter-rater Reliability Rating
Concepts about Print 0.93787 Excellent
Letter Knowledge 0.99134 Excellent
Most Used Words 0.96062 Excellent
Fluency 0.93683 Excellent
Accuracy 0.49171 Poor
Reading Comprehension 0.89586 Excellent
Reader 0.38388 Poor
There was excellent inter-rater reliability on all measures except accuracy and being defined as a reader which had poor reliability
scores. In places where inter-rater reliability was excellent we can be confident in the reported average scores. We should interpret
accuracy and reader scores with more caution as there was quite a bit of variability between assessors on these measures.