liquidity in an emerging bond market: the case of … in an emerging bond market: a case study of...
TRANSCRIPT
Liquidity in an emerging bond market: a case study of corporate bonds in Malaysia
Eric Chan, Mohd Fairuz Hj Ahmad and Philip Wooldridge
First draft: 12 December 2006 This draft: 3 August 2007
Preliminary and incomplete
Please do not cite without the authors’ permission
________________________________________________________
Eric Chan and Philip Wooldridge are with the Bank for International Settlements. Mohd Fairuz Hj Ahmad is with the Bank Negara Malaysia. Corresponding author: Philip Wooldridge, Representative Office for Asia and the Pacific, Bank for International Settlements, 78th Floor, Two IFC, 8 Finance Street, Central, Hong Kong SAR, tel +852 2878 7155, fax +852 2878 7123, email [email protected]. This paper was written for the conference on “Bond market developments in a comparative perspective: Asia, Europe, Latin America” organised by the HKIMR, BIS and CEPR. The authors are grateful to Jacob Gyntelberg, Pat McGuire, Eli Remolona and Giorgio Valente for helpful discussions and to participants in seminars at the BIS and Bank Negara Malaysia for comments. All errors and omissions remain our own. The views expressed in this article are those of the authors and do not necessarily reflect those of the Bank for International Settlements or the Bank Negara Malaysia.
Abstract: Most of what is known about the functioning of corporate bond markets is based on
studies of large developed markets. Using a previously unexploited dataset, we
examine the evolution of trading activity and costs in a small emerging bond market,
that of Malaysia. Our results indicate that the drivers of liquidity in the Malaysian
market are similar to those in larger markets. Bid-ask spreads and turnover ratios
confirm that liquidity improved between 1998 and 2004 but show little change
thereafter, suggesting that the importance of fragmentation as an impediment to
liquidity increases as the market develops.
JEL classification: G10, G18, O16
1. Introduction
The development of post-trade reporting systems, electronic trading
platforms and credit default swap markets and have shed much light on the
functioning of what was historically one of the most opaque segments of financial
markets: corporate bond markets. However, the light has mainly been directed at the
largest corporate bond markets, in particular the US market. Much less is known
about the functioning of small, emerging bond markets. This study helps to fill that
gap by examining patterns of liquidity in the Malaysian corporate bond market. We
use a previously unexploited dataset capturing all secondary market transactions in
ringgit corporate bonds to compare trading costs and activity over the 1998-2006
period.
The Malaysian market is interesting for several reasons. First, it is a small but
diverse market. The capitalisation of the ringgit corporate bond market was only
$60 billion at end-2006, in contrast to the US dollar and euro markets of several
trillion. Nevertheless, in terms of the heterogeneity of instruments and the
sophistication of the infrastructure, the ringgit market compares more favourably with
the largest markets than do most other emerging bond markets. This makes it a good
test case for examining whether our understanding of the determinants of liquidity in
the largest markets can help to guide the development of small emerging bond
markets.
Second, two corporate bond markets co-exist in Malaysia: one for Islamic
instruments and another for conventional instruments. Liquidity tends to concentrate
in certain instruments and therefore such market fragmentation can have a
detrimental impact on liquidity. At the same time, the growth of the Islamic bond
market has the potential to increase the diversity of the investor base and thereby
boost trading activity. A priori, it is unclear which development will dominate.
Third, the microstructure of the Malaysian corporate bond market has
changed significantly over the past decade. For example, post-trade disclosure was
introduced in 1997, guidelines for repurchase and securities lending agreements
were clarified in 2001, and non-residents were exempted from withholding taxes on
interest income in 2004. Theory and empirical evidence from other markets suggest
that these changes should enhance market liquidity, but there remains uncertainty
about the relative importance of different changes.
1
There is a growing literature examining trading costs in corporate bond
markets. However, almost all prior studies focus on the US market; ours appears to
be the first bond-level study of trading costs in a small emerging market. Based on a
large sample of corporate bond transactions by US insurance companies, Schultz
(2001) finds that trading costs decline with trade size and a customer’s trading
activity. Using similar data, Chakravarty and Sarkar (2003) conclude that bid-ask
spreads are positively correlated with maturity and credit risk and negatively
correlated with trading volume.
More recent studies examine transactions reported through the Trade
Reporting and Compliance Engine (TRACE). TRACE was established in 2002 to
improve the transparency of the US corporate bond market. Edwards, Harris and
Piwowar (2004) report that trading costs are lower for large trades, large issue sizes,
new issues, highly rated bonds, floating rate structures, complex securities and firms
with listed equity. Moreover, they find that execution costs are lower for bonds whose
trades are disseminated through TRACE. Bessembinder et al (2006) obtain similar
results.
The size and liquidity of a market are closely correlated (McCauley and
Remolona (2000)). Therefore, it is not obvious that conclusions about trading costs in
the US market will also hold for small emerging bond markets. Institutional
differences explain part of the variation in liquidity across markets. Using cross-
country data, Asian Development Bank (2006) finds that the rule of law, the absence
of capital controls, the availability of derivatives and low exchange rate volatility
contribute positively to bond market liquidity.1 But even after controlling for these
differences, the size of the market also matters. Large markets enjoy economies of
scale in trade processing, clearing and settlement; they are less vulnerable than
small markets to anti-competitive behaviour by dealers and investors; and they are
likely to trade a fuller range of instruments, especially derivatives (Bossone et al
(2001)). In short, size can influence the functioning of a bond market.
Notwithstanding inherent differences between small and large markets, our
results indicate that the drivers of liquidity in a small emerging bond market are
1 Burger and Warnock (2006) and Eichengreen and Luengnaruemitchal (2006) obtain similar results, but their
dependent variable is market capitalisation rather than liquidity.
2
similar to those in much larger markets: the riskiness of a security is a key
determinant of bid-ask spreads, and trade size is more important than issue size.
Changes in the microstructure of the Malaysian corporate bond market, in particular
greater transparency, led to a significant improvement in liquidity. In the late 1990s
and early 2000s, both conventional and Islamic instruments benefited from this
improvement. However, in 2006 the improvement in liquidity was concentrated in
Islamic instruments, indicating that the importance of fragmentation as an
impediment to liquidity increases as the market develops.
The rest of the paper is organised as follows. Section 2 outlines the structure
of the corporate bond market in Malaysia, and section 3 describes our dataset.
Section 4 reviews different measures of liquidity. Section 5 offers an empirical
analysis of the determinants of liquidity. Section 6 concludes.
2. The corporate bond market in Malaysia
The corporate bond market in Malaysia is one of the most advanced in Asia.2
The so-called private debt securities (PDS) market, which encompasses ringgit-
denominated issues from quasi-government entities, financial institutions and non-
financial companies, is a large, diverse market supported by sophisticated reporting
and settlement systems.
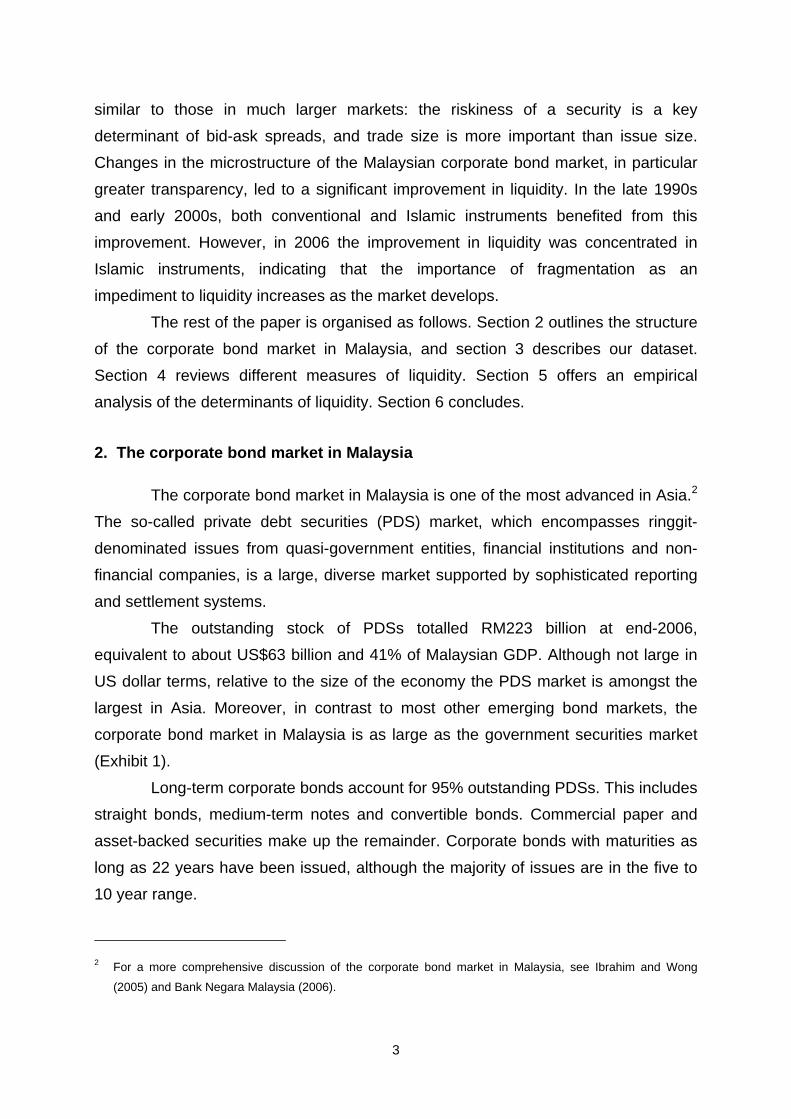
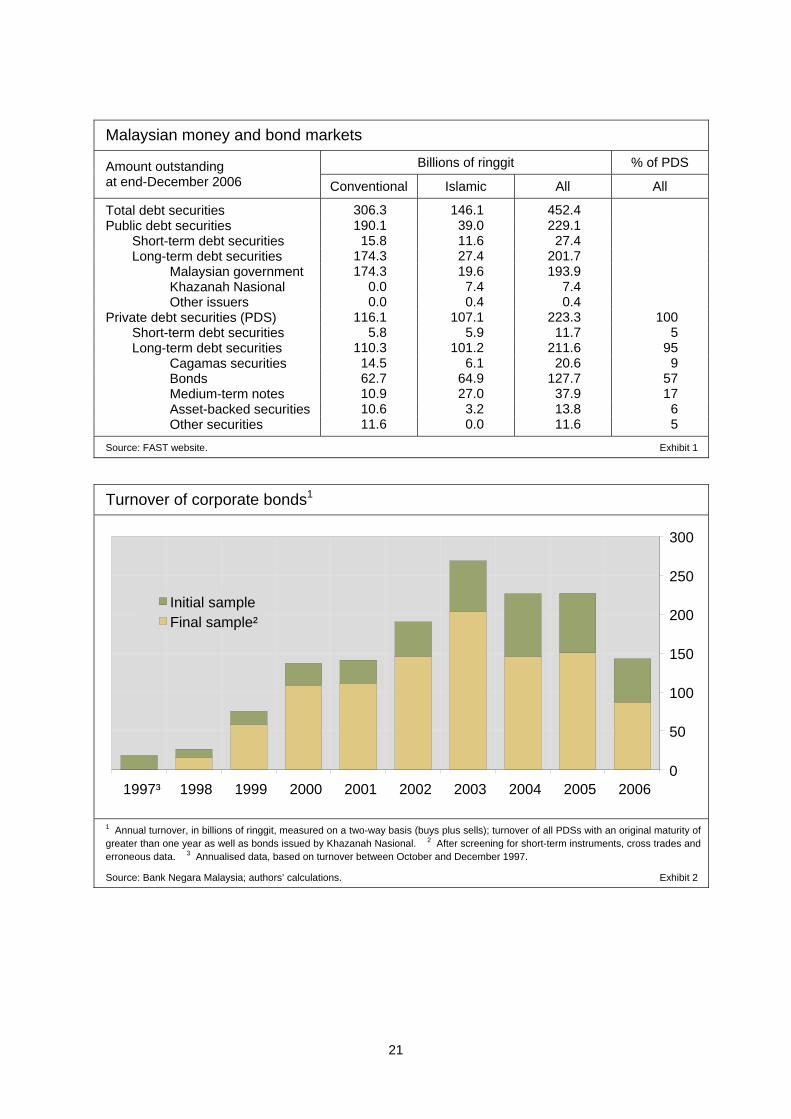
The outstanding stock of PDSs totalled RM223 billion at end-2006,
equivalent to about US$63 billion and 41% of Malaysian GDP. Although not large in
US dollar terms, relative to the size of the economy the PDS market is amongst the
largest in Asia. Moreover, in contrast to most other emerging bond markets, the
corporate bond market in Malaysia is as large as the government securities market
(Exhibit 1).
Long-term corporate bonds account for 95% outstanding PDSs. This includes
straight bonds, medium-term notes and convertible bonds. Commercial paper and
asset-backed securities make up the remainder. Corporate bonds with maturities as
long as 22 years have been issued, although the majority of issues are in the five to
10 year range.
2 For a more comprehensive discussion of the corporate bond market in Malaysia, see Ibrahim and Wong
(2005) and Bank Negara Malaysia (2006).
3
A unique feature of the Malaysian corporate bond market is the large amount
of Islamic issuance. Islamic securities are structured to comply with Shariah
principles, in particular the prohibition on the charging of interest. The most common
structure is a sale and buyback transaction, wherein instead of interest investors
receive dividends generated by the underlying assets. The Islamic segment of the
PDS market has grown rapidly in recent years, and at end-2006 Islamic securities
accounted for almost half of outstanding PDSs.
Financial institutions are the most active private sector issuers, followed by
utilities and construction firms. The single largest issuer is Cagamas Berhad, the
national mortgage corporation. It alone accounted for almost 10% of outstanding
PDSs at end-2006. Another important issuer is Khazanah Nasional Berhad, a
government-owned investment holding company. Regulations were eased in 2004 to
permit selected foreign issuers to raise funds in the ringgit market, but they
accounted for only 2% of bonds outstanding at end-2006.
The vast majority of issues are of high credit quality. Prior to 2000, issuance
was restricted to those securities which secured a rating of BBB or higher from one of
the two local credit rating agencies.3 This minimum rating requirement has since
been eliminated, although all issues must still be rated. Nevertheless, at end-2006
only 6% of the corporate bonds rated by Malaysia Rating Corporation (MARC) were
rated below A; 59% were rated A and 35% were AA or AAA (MARC (2007)).
Most corporate bonds end up in the portfolios of investors who follow a buy-
and-hold strategy. This includes insurance companies, asset management
companies and government-controlled pension and savings funds. High net worth
individuals and non-residents are also important investors. While comprehensive
ownership data are not readily available for corporate bonds, they are published for
Malaysian government securities (MGSs). At end-2006, pension funds held 58% of
3 The rating categories used by Rating Agency Malaysia (RAM) and Malaysian Rating Corporation (MARC) are
similar to those used by international rating agencies, although rating methodologies are not necessarily
comparable across agencies. Securities rated AAA are considered by RAM and MARC to be of the highest
credit quality, followed by securities rated AA, A, BBB, BB, B, C and finally D for securities in default.
Securities issued or guaranteed by the Malaysian government are not rated by either RAM or MARC. At end-
2006, the Malaysian government’s long-term foreign currency debt was rated A- by Standard & Poor’s and
Fitch and A3 by Moody’s.
4
outstanding MGSs, banks 15%, insurance companies 10%, public sector entities 8%
and non-residents 8%.
Issuance in the primary market, as well as the settlement and reporting of
transactions, are centralised and fully electronic. The systems underpinning the PDS
market are the same as those used in the MGS market. Commercial paper and other
short-term PDSs are typically tendered for sale through the Fully Automated System
for Issuing/Tendering (FAST). Some corporate bonds are also tendered through
FAST but most are issued as private placements. All transactions are settled through
the Real Time Electronic Transfer of Funds and Securities System (RENTAS),
usually two days after the trade. Information about secondary market transactions is
disseminated through the Bond Information and Dissemination System (BIDS).
The impressive development of the PDS market over the past two decades
was in part the result of initiatives by the central bank and other regulatory agencies.
Following the Asian financial crisis of 1997-98, the Malaysian authorities stepped up
their efforts to promote the bond market as an alternative source of debt finance for
private sector borrowers (Ibrahim and Wong (2005)). Bank Negara Malaysia
spearheaded the development of FAST, RENTAS, BIDS and other parts of the
market’s infrastructure. Regulations restricting market access and trading were
progressively eased to provide issuers and investors with more opportunities for
diversification.
3. BIDS and data description
To examine liquidity in the ringgit market, Bank Negara Malaysia (BNM)
provided us with a complete record of corporate bond transactions reported to BIDS
between 1 October 1997 and 31 December 2006. This is one of the most
comprehensive corporate bond trading datasets ever assembled and has not been
analysed in any previous study.
BIDS was launched in October 1997 to facilitate the pricing and trading of
ringgit debt securities. Prior to its launch, very little information about quotes or
transactions was available to market participants. Then as now, most trading took
place in the over-the-counter market and quotes were typically obtained directly from
5
dealers over the telephone.4 BIDS greatly enhanced the post-trade transparency of
the ringgit market by providing information in almost real time about the price and
volume of the latest transaction in any given bond. Financial institutions in Malaysia
are required to report to BIDS all transactions in all ringgit-denominated debt
securities (MGSs as well as PDSs). Trades must be reported within 10 minutes of
execution. Dealers can also disseminate indicative bids and offers through BIDS but
these are usually only posted for government securities; pre-trade transparency in
the Malaysian corporate bond market is limited.5
Post-trade transparency in the ringgit market is more complete even than
disclosure in the US corporate bond market. A large number of transactions in the
US market are either exempt from TRACE reporting or, if reported, not
disseminated.6 Furthermore, unlike in BIDS, TRACE does not disclose the exact
amount transacted for deals exceeding $5 million (or $1 million in the case of bonds
rated below BBB). Finally, the time lag allowed for dealers to report trades to TRACE
is 15 minutes, five minutes longer than in Malaysia.
The dataset we assemble from BIDS captures over 77,000 transactions in
1,609 different securities. Numerous details about each transaction are recorded,
including the trade date and time, face value of the trade, clean price, counterparty,
issuer code and credit rating, issue and maturity dates, and amount outstanding.
Each financial institution participating in the transaction is identified by an anonymous
code, but no distinction is made between those financial institutions which are market
makers and those which are financial customers. The dataset indicates which side of
the trade each financial institution was on (buyer or seller), but BIDS does not record
who initiated the trade, ie whether the trade was a buy or a sell.
4 A small number of corporate bonds are listed on Bursa Malaysia.
5 Other potential sources of quote data are still in their infancy in the ringgit bond market. Two electronic trading
platforms were registered in 2006 but they focus mainly on foreign exchange products, money market
instruments and government securities. A bond pricing agency, specialising in the estimation of the fair value
of bonds, was established in 2006. Credit default swaps, which provide a reference for pricing credit risk, were
authorised to be traded by licensed financial institutions in 2006.
6 Transactions in government agency securities, mortgage- or asset-backed securities, collateralised mortgage
obligations and money market instruments are not reported to TRACE, and transactions in securities sold to
institutional investors under Rule 144A of US securities regulations are not disseminated.
6
The dataset excludes transactions in securities issued by the Malaysian
government and BNM. It also excludes money market instruments (ie debt securities
with an original maturity of less than 364 days) and medium-term notes. Given the
incomplete coverage of money markets in our dataset, we eliminate all instruments
with a remaining maturity of less than one year, ie all trades that take place within
364 days of the maturity date. In addition, we eliminate observations where the price
differs from the preceding and following prices by at least 10% as well as those
where the characteristics of the bond, such as the issue size and maturity date, are
inconsistent across transactions. The quality of the data in the first few weeks after
the launch of BIDS is especially poor, and so we exclude all transactions in 1997.
Furthermore, we screen for cross trades. Securities regulations in Malaysia
require that asset managers seeking to transfer securities between clients’ accounts
execute the transaction through a dealer at arm’s length; sales and purchases cannot
be conducted internally.7 Such cross trades are typically executed at a minimal bid-
ask spread, or even no spread. To control for cross trades, we eliminate all
transactions where dealer A sells a bond to dealer B, who then turns around and
sells the same bond in the same amount back to dealer A within a few minutes. In
addition, we eliminate any back-to-back transactions that are settled at exactly the
same price, ie where the bid-ask spread is zero.8
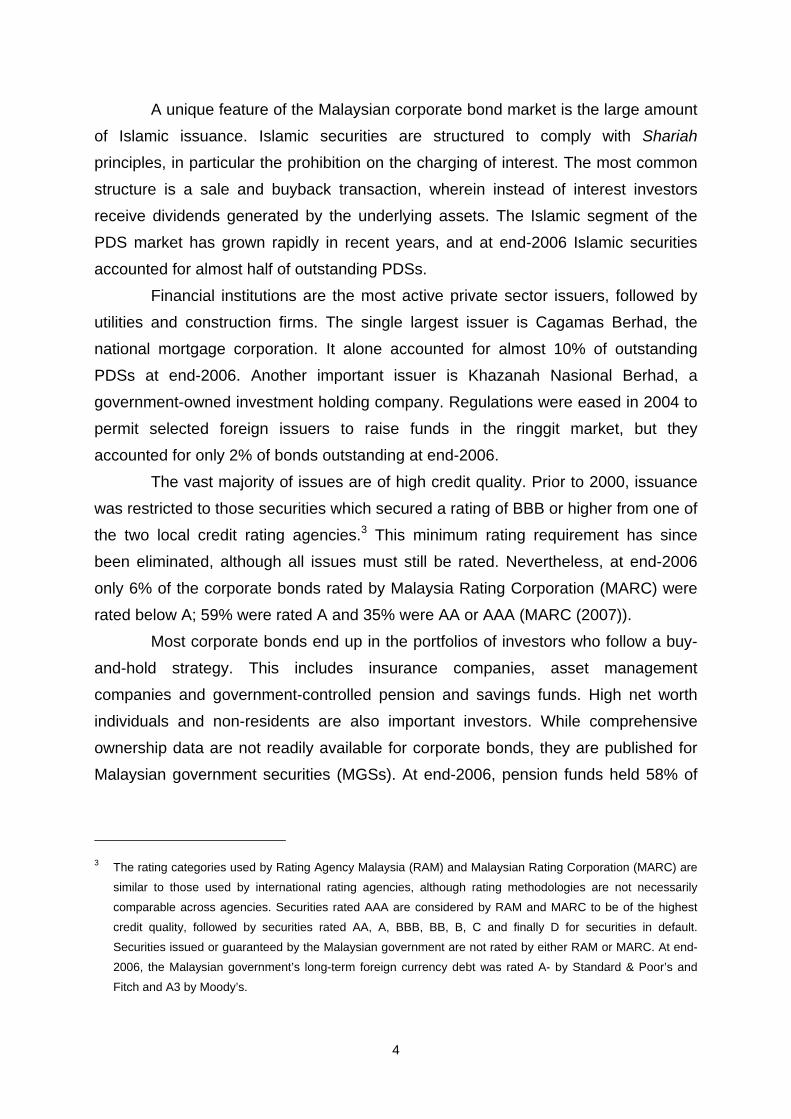
The final sample comprises 61,361 transactions in 1,526 different bonds. It
captures 71% of total turnover over the 1997-2006 period. In 2000 and 2001 the final
sample captured close to 80% of total turnover, but in 2006 it captured only 61%
(Exhibit 2). The main reason for the large difference between the raw and final
samples is the elimination of cross trades. Cross trades, as defined above, account
for 17% of total turnover over the 1997-2006 period, and trades that take place within
364 days of the maturity date for another 5%.
7 See clause 4.03 of the Guidelines for Compliance Function for Fund Managers, issued by the Malaysian
Securities Commission.
8 Trading activity in Malaysia is also potentially inflated by dealers’ efforts to meet their obligations under BNM’s
Principal Dealer system. Principal Dealers are required to maintain a minimum 5% share of secondary market
activity in MGSs and PDSs combined. This creates an incentive to inflate trading volumes. Some of this
activity is likely to be captured by our screen for cross trades, and so we do not control explicitly for inflated
trades.
7

In the final sample, trading amongst financial institutions accounts for 52% of
market turnover, and transactions between financial institutions and non-financial
entities for the remainder.
4. Measures of liquidity
Liquidity has at least three dimensions: tightness, depth and resiliency
(Committee on the Global Financial System (2000)). Tightness refers to trading
costs, specifically how far transaction prices diverge from the mid-market price.
Depth refers to the volume of trades possible without impacting market prices.
Resiliency refers to the speed with which a market adjusts to imbalances in order
flow. A variety of measures have been proposed in the literature to capture these
dimensions. We focus on two: turnover and bid-ask spreads.
Turnover
Turnover, or trading volume, is closely related to the depth of the market.
Volume averaged over some period indicates the order flow a market can
accommodate without exacerbating price movements. For each bond in the sample,
we calculate an annual turnover ratio, or ratio of total trading volume in a given year
to the amount outstanding at the end of that year. To control for outliers we discard
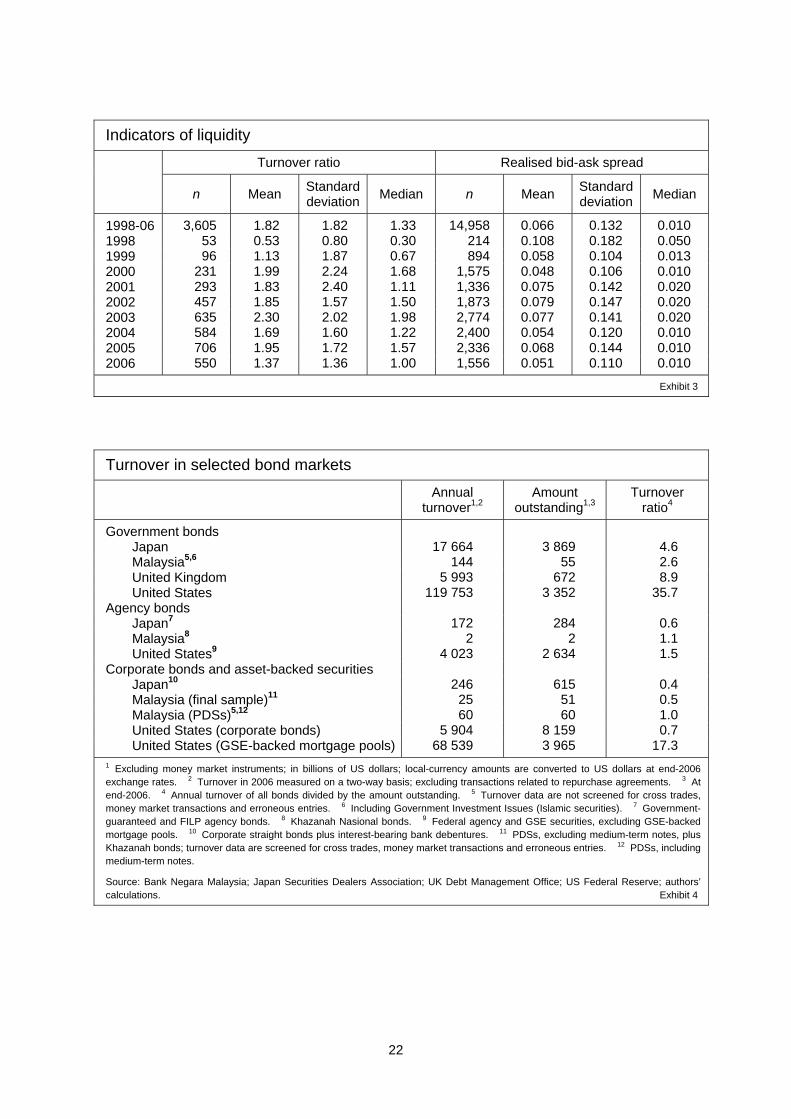
the top and bottom 1% of observations. This leaves us with a sample of 3,605
observations (Exhibit 3).
For the sample of traded bonds, the mean turnover ratio was 1.37 in 2006
and the median ratio 1.00. The distribution of trading activity is highly skewed: many
bonds do not trade while a few bonds trade actively. The sample excludes bonds
which do not trade, and therefore the turnover ratio for the population of corporate
bonds is much lower than our estimate. The turnover ratio for the population can be
approximated by dividing the annual turnover of all corporate bonds by the stock of
bonds outstanding at the end of the year. For the turnover and types of instruments
in our final sample, the market turnover ratio was about 0.5 in 2006 (Exhibit 4).
Consistent with the pattern in other countries, corporate bonds in Malaysia
are less actively traded than government securities. The turnover ratio for the MGS
market, including cross trades, was 2.6 in 2006, compared to 1.0 for the PDS market
if calculated on a comparable basis (Exhibit 4).
8
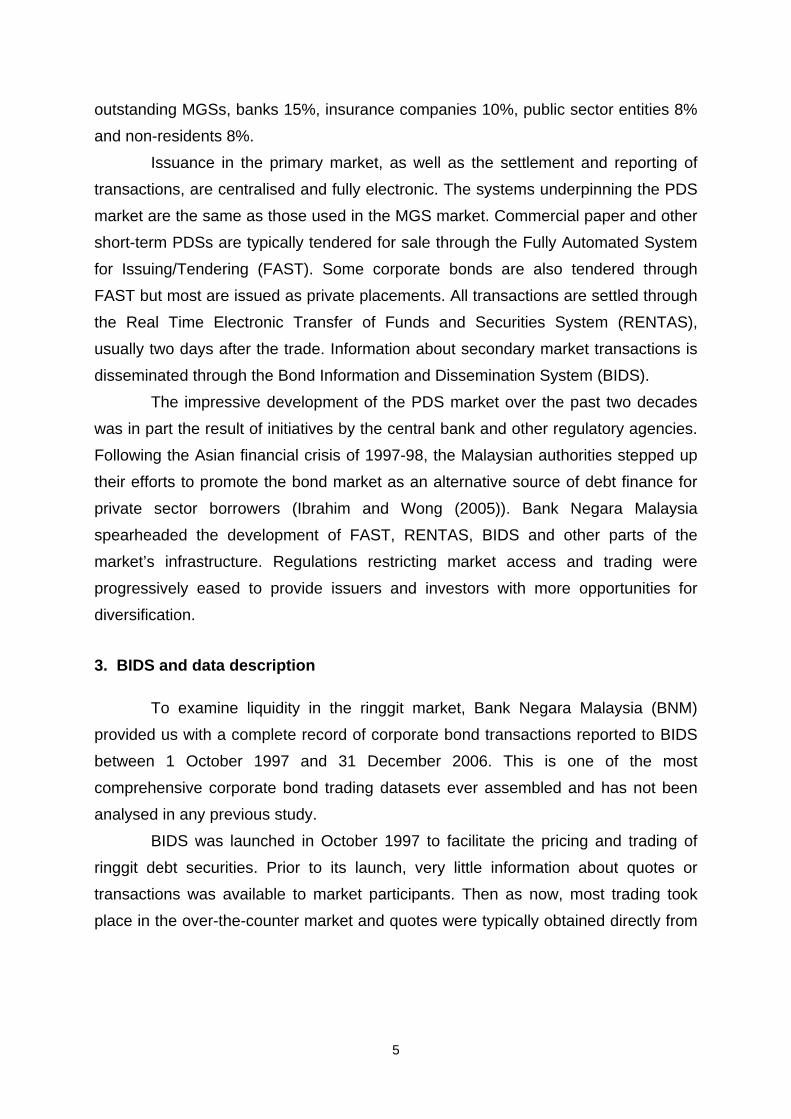
Exhibit 4 adjusts for known differences in the compilation of turnover data
across countries.9 Trading activity in the MGS market is substantially lower than in
many larger markets. In the Japanese government bond market, the turnover ratio
was almost twice as high, and in the US Treasury market it was 14 times higher. In
contrast to the MGS market, trading volumes in the Malaysian corporate bond market
compare favourably with those in other corporate bond markets. The turnover ratio
for our sample of bonds is slightly higher than for Japanese corporate bonds and not
far below that of US corporate bonds. From this admittedly narrow perspective, the
PDS market appears to be a relatively well developed market.
Looking at the evolution of turnover in the Malaysian corporate bond market,
there was a definite improvement in the early years of the sample period. For our
sample of bonds, the turnover ratio rose from 0.53 in 1998 to a peak of 2.30 in 2003
(Exhibit 3). It subsequently declined, although between 2004 and 2006 it remained
significantly above its 1998-99 level.
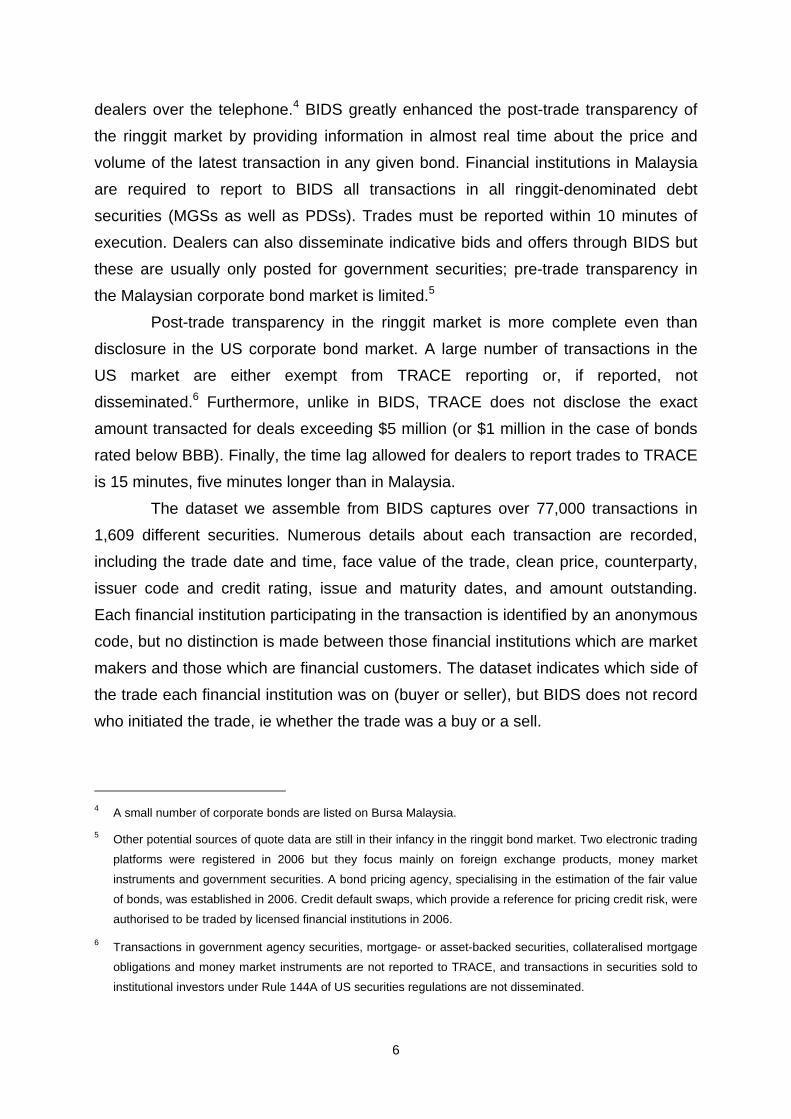
Even though the turnover of traded bonds did not increase after 2003, the
number of traded bonds rose markedly. Especially noteworthy was the increase in
the number of issuers with traded bonds; bonds from more and more firms began to
trade. The number of issuers with bonds that traded at least once during the year
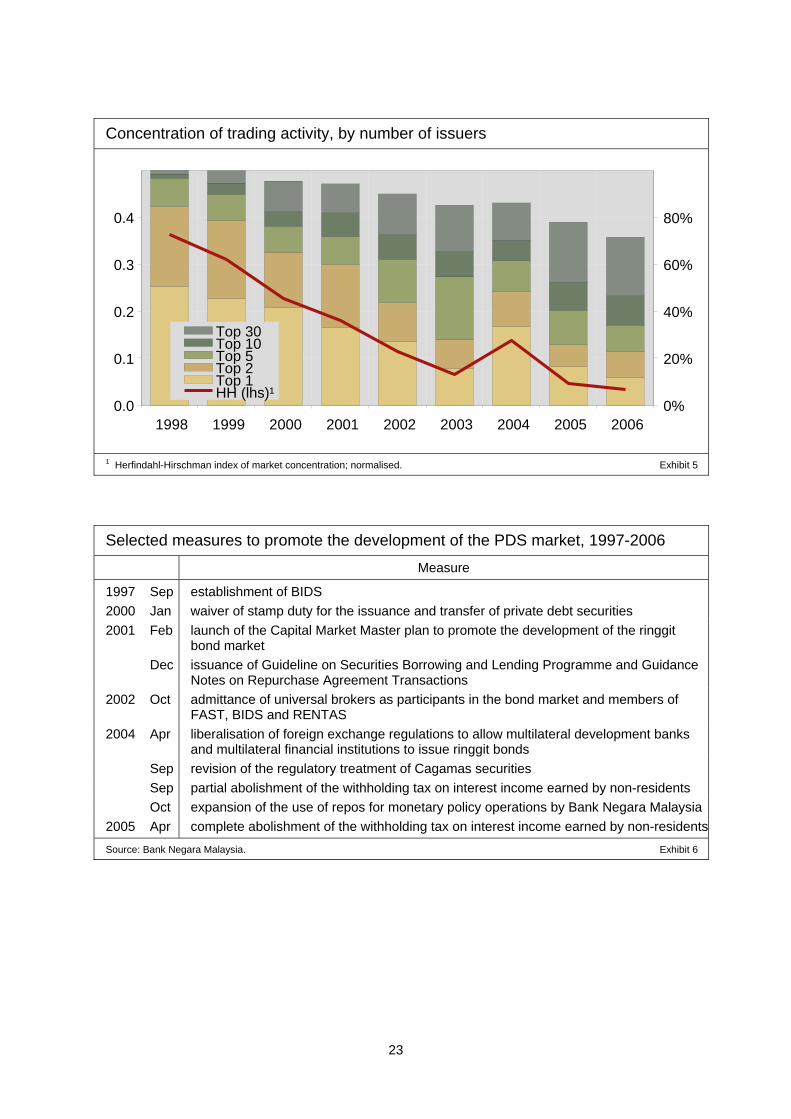
increased from 48 in 1998 to 178 in 2005 before levelling out. As a result, the
concentration of secondary market activity diminished almost continuously during the
sample period. Whereas in 1998 the two most actively traded issuers accounted for
85% of total turnover in the corporate bond market, by 2006 their share had dropped
to 23% (Exhibit 5). The Herfindahl index of concentration declined markedly, from
0.36 in 1998 to 0.18 in 2001 and 0.03 in 2006.
The growth of the ringgit market over the sample period potentially masks
underlying trends in turnover. In particular, the number of new bonds issued in a
given year can have an impact on total turnover in the market. In the ringgit market,
like in most bond markets, trading activity during the first few weeks after the issue
9 Important differences across bond markets include: whether trades are counted on a one-way or a two-way
basis (wherein each transaction is counted twice, as a sale plus a purchase); whether trades related to
repurchase agreements are reported together with other trades; whether securities with a short remaining
term maturity are distinguished from longer-term instruments; and which types of instruments are classified as
corporate, financial or government bonds.
9
date is much higher than in later weeks. For corporate bonds issued between 1998
and 2006, the turnover ratio averaged 8.6 in the first month. It then dropped to 1.9 in
the second month and around 1.0 in the third and subsequent months. This pattern
mainly reflects the process of distributing new issues to end-investors.
To control for primary market activity, we eliminate all new issues. This
leaves us with a sample of 2,692 bonds. As expected, the turnover ratio is lower for
seasoned issues: 1.66 versus 1.82 for the full sample over the 1998-2006 period.
Yet, changes in the turnover ratio and in the concentration of trading activity over
time are similar. This indicates that the increase in market depth evident over the
1998-2006 period was not driven (solely) by the growth of the market.
Bid-ask spreads
To complement measures of depth, we estimate trading costs. The most
comprehensive measure of trading costs is the effective spread, defined as the
transaction price less the mid-point of quoted bid and ask prices. This measure
incorporates price movements triggered by the trade itself. It is the measure used by
Goldstein et al (2005) and Biais et al (2006). However, it is problematic to construct
effective spreads for the Malaysian market because quotation data for many
corporate bonds are not readily available.
Some other studies develop econometric models of trading costs. Edwards et
al (2004) and Bessembinder et al (2006) estimate an indicator variable regression,
incorporating information about whether the dealer participated in a transaction as a
buyer or a seller. Again, it is difficult to estimate such a model for the Malaysian
market because BIDS contains no information about the initiator of the trade.
Instead we compute the realised spread. This is the average price of dealers’
sales less the average price of dealers’ purchases, where each price is weighted by
the par value of the transaction. More precisely, the realised bid-ask spread is
calculated as follows:
∑∑
∑∑ =
=
=
=
−=M
bM
b
kbi
kbik
bi
N
aN
a
kai
kaik
aikti
Trade
TradeBid
Trade
TradeAskSpread
1
1,
,,
1
1,
,,,
where = the price dealer k received from the sale of bond i in
transaction ; = the price dealer paid for the purchase of bond in
transaction ; ( ) = the par value of transaction (b ); and (
kaiAsk ,
a kbiBid , k i
b kaiTrade ,
kbiTrade , a N M ) =
10

the number of transactions occurring over a given period t at dealer ’s ask (bid)
price for bond i .
k
If the identity of dealer is known, then is equivalent to the dealer
round-trip spread estimated by Goldstein et al (2005). If the identity of dealer is not
known, then is equivalent to the measure used by Hong and Warga (2000)
and Chakravarty and Sarkar (2003).
k ktiSpread ,
k
tiSpread ,
ktiSpread , takes advantage of one of the unique features of our dataset: the
identity of each counterparty to a trade. Furthermore, the realised spread has the
advantage of simplicity. In particular, it does not depend on any assumptions about
the appropriate model of transaction costs. Finally, if computed over a short time
interval (eg daily), then the realised spread is unlikely to be distorted by news-driven
movements in the price level. However, it requires that those sale and buy
transactions which cannot be matched be disregarded. This results in the loss of
about 30% of all transactions in the BIDS database. Many of the eliminated
transactions relate to bonds that are not frequently traded. As a result, the sample is
likely to be biased towards those bonds that trade more frequently.
We estimate over a one-day interval, ie t comprises all transactions
between 9:00 and 18:00. This leaves us with a sample of 14,958 spreads (Exhibit 3).
ktiSpread ,
Our estimate of the realised bid-ask spread is 0.066 for MYR 100 par value
over the 1998-2006 period. In other words, for a bond valued at MYR 100, the bid
price would be MYR 99.967 and the ask price 100.033. In yield terms, this is
equivalent to 1-2 basis points (for bonds with a duration of 3-6 years).
declined significantly in the early years of the sample, from a mean of 0.108 in 1998
to 0.048 in 2000, and fluctuated between 0.05 and 0.07 thereafter.
ktiSpread ,
Our estimate of is suspiciously low. Indicative bid-ask spreads for
ringgit corporate bonds are as high as 19 basis points (ADB (2006)). Even the most
actively traded non-government bonds, those of Khazanah and Cagamas, are quoted
at spreads no tighter than 5 to 7 basis points (Deutsche Bank (2007)). While
indicative spreads are typically higher than realised spreads, ratios greater than 2:1
are exceptional.
ktiSpread ,
Moreover, our estimate of realised spreads in the ringgit market is lower than
similar estimates for US and European markets. For US corporate bonds,
Chakravarty and Sarkar (2003) calculate that the realised spread was 0.21 per $100
par value in the mid-1990s, and Goldstein et al (2005) estimate that the one-day
round-trip spread ranged between 0.50 and 2.35 in 2002-04. For European corporate
11
bonds, Financial Services Authority (2006) finds that the one-day round trip spread
averaged 0.058 in 2005, and Biais et al (2006) estimate that the effective spread
ranged between 0.10 and 0.20.
It is unlikely that competition among market makers explains our low estimate
of realised spreads. In a model of search and bargaining costs in over-the-counter
markets, Duffie et al (2005) show that bid-ask spreads are lower if investors have
easier access to multiple market makers. Biais et al (2006) cite the high level of
competition among dealers as the main explanation for their finding that spreads in
the European corporate bond market are lower than in the US market. It seems
implausible that competition in the Malaysian market is more intense than in the
much larger European or US markets. On the contrary, market making in Malaysia
appears to be relatively concentrated. About 50% of bonds are traded by only one
dealer, and another 20% by no more than two dealers. The three most active
financial institutions account for 29% of total turnover over the sample period, and the
ten most active 56%.
An alternative explanation for the low estimate is that dealers may take
negligible risks. In other words, they may act more like brokers than dealers.
Whereas dealers buy and sell for their own accounts, and so are exposed to the risks
associated with maintaining an inventory of bonds, brokers match buyers and sellers
and do not hold any securities. In the next section, we explore this question further by
analysing whether the riskiness of a security affects bid-ask spreads.
5. Determinants of liquidity
The market microstructure literature has identified a number of variables that
might influence trading costs. One set of variables relates to the specific
characteristics of the bond, another to the characteristics of the transaction, and a
third set to the structure of the market.
Liquidity is commonly perceived to be positively correlated with the size of a
bond. The rationale usually given is that the supply potentially available for trading is
greater for larger issues. We define as the face value of the amount
outstanding for bond i on day , measured in billions of ringgit. Another typical
finding is that newly issued, on-the-run bonds are more actively traded than older
issues. is a dummy variable equal to one if bond was issued within
three months of day t and zero otherwise.
tisizeIssue ,
t
tiissueNew , i
12
Models of dealers’ inventory costs suggest that there is a negative
relationship between liquidity and the riskiness of a bond (Stoll (1978); Ho and Stoll
(1981)). Interest rate risk can be proxied using maturity, and the credit quality of a
bond can be captured using agencies’ credit ratings. is defined as the
difference between the maturity date and day t , measured in years.tiMaturity ,
10 To allow for a
non-linear relationship, we also include the square of the time to maturity,
. tisquaredMaturity ,
tidummiesratingCredit , are based on ratings from the two local Malaysian
agencies. We define five dummy variables for categories AA , A , BBB , ,
and Unrated . The omitted category is bonds rated
Guaranteed
Foreign AAA . Bonds guaranteed
by the Malaysian government are not rated by the local agencies and so are included
as a separate category. In our sample, the only issuer of guaranteed bonds is
Khazanah. Similarly, bonds issued by multilateral development banks or foreign
companies and rated by an international agency are exempt from the requirement to
obtain a local rating. Following the easing of restrictions on ringgit-denominated
borrowing by non-residents in 2004, several foreign issuers tapped the ringgit
market, including the Asian Development Bank, World Bank, International Finance
Company and the German development bank KfW. The category equals
one for bonds from these entities. In principle, and should
capture all bonds not rated by the Malaysian agencies. However, they do not and so
the remaining bonds are categorised as Unrated . There are no bonds rated below
BBB in our sample. Also, all bonds have only one rating.
Foreign
Guaranteed Foreign
Turing to transaction-specific variables that might influence liquidity, one
important variable is trade size. In bond markets, institutional investors trading in
large amounts typically enjoy lower transaction costs than retail investors trading in
small amounts. We include six , for trades ≤1 million, >1 and <5
million, >5 and <10 million, =10 million, >10 and <20 million, and ≥ 20 million. The
omitted category is trades equal to RM5 million. This is the standard lot in the ringgit
market, as specified by the rules governing BIDS. The trade size is calculated as the
average size of all transactions by dealer in bond i on day .
ktidummiessizeTrade ,
k t
10 Although this variable will overestimate the effective time to maturity of callable bonds, to our knowledge none
of the bonds in our sample include a call option.
13
Access to information and trading technology often varies across
counterparties, and this can impact the liquidity available to different counterparties.
We distinguish three types of counterparties: dealers, financial institutions (FI) and
non-financial customers (Others). Dealers are not separately identified in the dataset
and so we classify the seven most active financial institutions as dealers.11 To
capture trades among different counterparties, we define five :
Dealer-Dealer, Dealer-FI, Dealer-Other, FI-Other and Dealer-FI-Other. The omitted
category is transactions between two financial institutions (FI-FI).
ktidummiestyCounterpar ,
Dealers’ trading costs are potentially affected by the level of their inventory.
For example, dealers holding a large inventory of a bond might seek to reduce their
holdings by tightening their spreads. The change in inventory is captured with two
: one for round-trip transactions that result in an increase in
inventory on day t (a dealer’s purchases exceed his sales) and a second for round-
trips that reduce inventory (sales exceed purchases). Trades that have no impact on
inventory equal zero.
ktidummiesInventory ,
Market conditions on day can have an important impact on spreads.
Increased uncertainty about macroeconomic or financial conditions might lead
market makers to reduce their risk exposure, resulting in a deterioration in market
liquidity (Committee on the Global Financial System (1999); Borio (2000)). As a proxy
for market conditions, we use squared daily returns on the Kuala Lumpur equity
index, . A government bond index would better reflect
conditions in bond markets, but daily indices for ringgit bonds start in 2001, about half
way through our sample.
t
tsquaredreturnMarket
A final set of factors that might influence liquidity is features specific to the
Malaysian market. The authorities have implemented many measures to promote the
development of the ringgit market over the past decade, including the introduction of
post-trade transparency and the exemption of non-residents from withholding taxes
(Exhibit 6). These might have impacted liquidity and so we include eight
11 BNM introduced a principal dealer system in 1989. It appoints, on an annual basis, 10 principal dealers. We
classified as dealers those financial institutions that were ranked amongst the top 10 traders for at least five of
the 10 years in our sample. There were only seven financial institutions that met these criteria, and the same
institutions ranked as the top seven traders over the full sample.
14
tdummiesYear , for 1998, 1999, 2001, 2002, 2003, 2004, 2005 and 2006. The omitted
year is 2000.
As mentioned earlier, one of the unique features of the ringgit market is the
co-existence of two segments: one for Islamic instruments and another for
conventional instruments. There are several reasons why the liquidity of Islamic
instruments might differ from the liquidity of conventional instruments. On the one
hand, the potential investor base for Islamic instruments is larger, given that non-
Islamic investors can invest in both conventional and Islamic instruments but Islamic
investors can invest only in the latter. On the other hand, Islamic instruments are
more complex products, similar to asset-backed securities, and this might detract
from liquidity. To the extent that there is any difference in the liquidity of the two
instruments, this difference might have changed over time owing to the rapid growth
of the Islamic segment. Therefore, a dummy variable , which equals one for
Islamic bonds and zero for conventional issues, is interacted with the dummies. tiIslamic ,
tYear
To explain differences in liquidity across bonds in our sample, we regress
on all explanatory variables: ktiSpread ,
=ktiSpread ,
ktitit
tkti
kti
kti
titi
tititi
dummiesIslamicYeardummiesYear
squaredreturnMarketdummiesInventory
dummiestyCounterpardummiessizeTrade
dummiesratingCreditdummyissueNew
squaredMaturityMaturitysizeIssue
,,1110
9,8
,7,6
,5,4
,3,2,10
* εαα
αα
αα
αα
αααα
++
++
++
++
++++
(1)
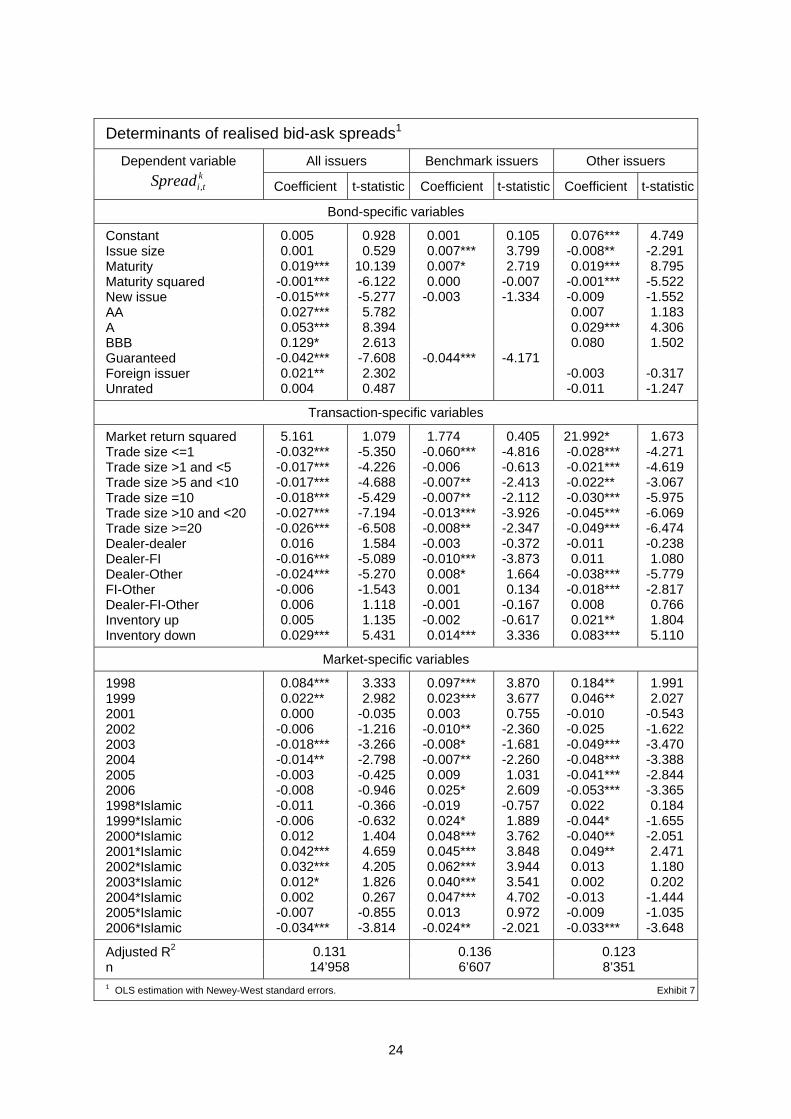
OLS estimation results for equation (1) indicate serial correlation and
heteroscedasticity in the error terms. Consequently, equation (1) is re-estimated with
Newey-West standard errors. The final estimation results are reported in Exhibit 7.
To test the robustness of our results, we split the sample into two sub-
groups: “benchmark” issuers and other issuers. Benchmark issuers are companies
whose debt potentially serves as a reference for pricing other securities. Such
companies typically copy the issuance strategy of many governments: issue in large
size and at regular intervals. As a result of this strategy, benchmark issuers’ bonds
are often more liquid than similar bonds from other issuers. We classify as
benchmark issuers those borrowers which issued a ringgit bond in at least three of
the nine years in our sample, with an average issue size of at least RM500 million.
15
There are only four issuers which meet both the regularity and size criteria:
Cagamas; Khazanah; Prasarana, a state-owned public transportation company; and
PLUS, a privately-owned highway concessionaire.
The results confirm that bid-ask spreads are positively correlated with the
riskiness of a security. Considering first credit risk, spreads on A-rated bonds are
significantly higher, and spreads on guaranteed bonds significantly lower, than those
on AAA-rated issues (the omitted category). As for interest rate risk, spreads are a
concave function of a bond’s remaining maturity. Spreads increase at a decelerating
rate for each year up to a maturity of about fifteen years, after which they decrease at
an accelerating rate. Maturity has a smaller impact on the spreads of benchmark
bonds than on those of other issuers.
However, spreads do not appear to fluctuate with market conditions. Bid-ask
spreads for other issuers are positively correlated with squared equity returns, but not
overwhelmingly so. For bonds from benchmark issuers, there is no significant
relationship between spreads and equity returns. The results similar if equity returns
are replaced with bond returns, using HSBC’s Asian Local Bond Index for Malaysia
from 2001 to 2006.
The relationship between issue size and bid-ask spreads is mixed. For
benchmark bonds, larger issue sizes are associated with tighter spreads. However,
for other bonds, the opposite is true. One way to interpret this result is that while
liquid bonds are usually large issues, large issues are not necessarily liquid. This
interpretation is consistent with previous studies, most of which also find a weak
relationship between size and liquidity (McGinty (2001)).
As expected, spreads on newly issued bonds are tighter than on seasoned
bonds. However, the significance of the dummy disappears when the
sample is divided into benchmark and other issuers. tiissueNew ,
Turning to the transaction-specific variables, the results are somewhat
puzzling. As expected, spreads for big trades are lower than those for trades of the
standard lot size of RM5 million (the omitted category). The difference is particularly
large for trades greater than RM10 million. Surprisingly, spreads for small trades are
also lower, especially for trades less than or equal to RM1 million. One possible
explanation for this latter result is that our screens did not capture all cross-trades.
There is no consistent pattern of differences in bid-ask spreads across
counterparties. For all issuers and other issuers, spreads tend to be lowest for trades
between dealers and non-FI (other) counterparties. Yet, for benchmark issuers, such
16

trades result in higher spreads. In larger markets, bid-ask spreads are typically lowest
for inter-dealer trades. This is not the case in the Malaysian market, implying that the
interdealer market is not well developed.
Dealers react asymmetrically to changes in their inventory. If sales on a given
day exceed purchases, then they widen their spreads. But if purchases exceed sales,
they leave their spreads unchanged.
The indicate a definite improvement in liquidity during the early
years of the sample. In 1998-99 bid-ask spreads for bonds from all types of issuers
were significantly higher than in 2000. In 2003-04 there was a further decline in
spreads for all issuers. In 2005-06 spreads for other issuers remained around 2003-
04 levels, but spreads for benchmark issuers returned to 2000 levels. The
introduction of BIDS (in 1997) and growth of the bond market (in 1997-2000) were
likely responsible for the decline of bid-ask spreads in 1998-99. The opening up of
the bond market to universal brokers (in 2002) was likely responsible for the decline
in 2003-04.
tdummiesYear
The absence of any further improvement in liquidity in 2005-06 appears to be
at least partly related to the growth of the Islamic bond market. Islamic bonds traded
at wider bid-ask spreads than conventional instruments until about 2004. In 2005
they traded at about the same bid-ask spread as conventional instruments and in
2006 at somewhat tighter spreads. So the liquidity of Islamic instruments improved in
2005-06 even though the liquidity of the overall market did not. This implies that
liquidity shifted from conventional instruments to Islamic instruments. Nevertheless,
the emergence of the Islamic bond market as an important source of corporate
funding might have benefited issuers and investors in other ways, for example by
improving the pricing of credit risk. The focus of this study is too narrow to assess the
full impact of the growth of the Islamic segment.
To summarise our empirical results, the riskiness of a security is a key
determinant of bid-ask spreads in the ringitt-denominated corporate bond market.
Whether the security is structured as an Islamic instrument or a conventional
instrument also appears to matter, even after controlling for other characteristics of
the bond and the transaction. Trade size is more important than issue size; trading
costs are not necessarily lower for large issues but are lower for large trades.
17
6. Conclusions
In the introduction, we identified three issues that a study of the Malaysian
corporate bond market might help to shed light on. First, are the determinants of
liquidity in a small emerging bond market the same as those in larger markets?
Second, how detrimental an impact does market fragmentation have on liquidity?
Third, which structural changes have done the most to promote liquidity?
The answer to the first question seems clear: the determinants are broadly
the same. In the ringgit market as in the US dollar market, spreads increase with
credit risk (lower credit ratings) and with interest rate risk (longer time to maturity) and
decrease with trade size. Nevertheless, there are some puzzling characteristics of
the Malaysian market. One is why there seems to be no systematic difference
between bid-ask spreads on newly issued bonds and those on seasoned issues.
Trading volumes are higher for newly issued bonds, which is consistent with patterns
of liquidity in other markets, but spreads are not lower. Another puzzle is why bid-ask
spreads on trades between dealers are not systematically lower than those on trades
with other counterparties. A lack of competition between dealers is a possible
explanation for these puzzles, but further research is needed to reach a definitive
answer.
Regarding market fragmentation, the co-existence of two corporate bond
markets, one for Islamic instruments and another for conventional instruments,
appeared not to have a detrimental impact on liquidity during the early phases of the
Islamic market’s development. Between 1998-1999 and 2003-04, bid-ask spreads for
all instruments declined and the turnover ratio increased significantly. After 2004,
however, there was no systematic improvement in market liquidity. Instead, liquidity
appeared to shift from conventional instruments to Islamic instruments. This indicates
that the relative importance of fragmentation as an impediment to liquidity increases
as the market develops.
The improvement in liquidity over the 1998-2004 period indicates that some
of the structural changes in the ringgit market during those years had a significant
impact. The introduction of post-trade transparency in 1997 is arguably the most
important change, considering that the improvement in liquidity was most
pronounced in 1998-99. However, owing to the absence of pre-1997 data, it is
difficult to confirm this hypothesis. In particular, more research is needed to
disentangle the contribution to the improvement in liquidity made by structural
18
reforms from the contribution made by the increase in the absolute size of the ringgit
market during these years.
References
Asian Development Bank (2006): “Bond market liquidity – empirical analysis, market
survey, and policy options”, Asia Bond Monitor, November, pp 24-57.
Bank Negara Malaysia (2006): “A guide to Malaysian Government Securities: 2006”,
mimeograph, June.
Bessembinder, H, W Maxwell and K Venkataraman (2006): “Market transparency,
liquidity externalities, and institutional trading costs in corporate bonds”,
Journal of Financial Economics, 82 (November), pp 251-288.
Biais, B, F Declerck, J Dow, R Portes and E von Thadden (2006): “European
corporate bond markets: transparency, liquidity, efficiency”, mimeograph, City
of London, May.
Borio, C E V (2000): “Market liquidity and stress: selected issues and policy
implications”, BIS Quarterly Review, November, pp 38-51.
Bossone, B, P Honohan, M and Long (2001): “Policy for small financial systems”,
Financial Sector Discussion Paper #6, World Bank.
Burger, J and F Warnock (2006): “Local currency bond markets”, IMF Staff Papers,
53, pp 133-46.
Chakravarty, S and A Sarkar (2003): “Trading costs in three US bond markets”, The
Journal of Fixed Income, June, pp 39-48.
Committee on the Global Financial System (1999): A review of financial market
events in Autumn 1998, Bank for International Settlements.
––––– (2000): Market liquidity: research findings and selected policy implications,
BIS, March.
Deutsche Bank (2007): “A guide to Malaysia’s local markets”, mimeograph, March.
Duffie, D, N Garleanu, and L H Pedersen (2005): “Over-the-counter markets”,
Econometrica, 73 (November), pp 1815-1847.
Edwards, A, L Harris and M Piwowar (2004): “Corporate bond market transparency
and transaction costs”, SEC Working Paper.
Eichengreen, B and P Luengnaruemitchai (2006): “Why doesn’t Asia have bigger
bond markets?”, BIS Papers, 30 (November), pp 40-77.
19
Financial Services Authority (2006): “Trading transparency in the UK secondary bond
market: feedback on DP05/5”, Feedback Statements, 06/4, July.
Goldstein, M, E Hotchkiss and E Sirri (2005): “Transparency and liquidity: a
controlled experiment on corporate bonds”, Babson College Working Paper.
Ho, T and H Stoll (1981): “Optimal dealer pricing under transactions and return
uncertainty”, Journal of Financial Economics, 9, pp 47-73.
Hong, G and A Warga (2000): “An empirical study of bond market transactions”,
Financial Analysts Journal, March/April, pp 32-46.
Ibrahim, M and A Wong (2005): “The corporate bond market in Malaysia”, BIS
Papers, 26 (February), pp 114-128.
Malaysia Rating Corporation (2007): “MARC quarterly rating actions, reviews and
outlooks – Q4 2006”, Credit Research, February.
McCauley, R and E Remolona (2000): “Size and liquidity of government bond
markets”, BIS Quarterly Review, November, pp 52-60.
McGinty, L (2001): “Issue size versus liquidity in credit”, mimeograph, JP Morgan
Securities, 7 November.
Schultz, P (2001): “Corporate bond trading costs: a peek behind the curtain”, Journal
of Finance, 56, pp 677-698.
Stoll, H (1978): “The supply of dealer services in securities markets,” Journal of
Finance, 33, pp 1133-1151.
20
Malaysian money and bond markets
Billions of ringgit % of PDS Amount outstanding at end-December 2006 Conventional Islamic All All
Total debt securities 306.3 146.1 452.4 Public debt securities 190.1 39.0 229.1 Short-term debt securities 15.8 11.6 27.4 Long-term debt securities 174.3 27.4 201.7 Malaysian government 174.3 19.6 193.9 Khazanah Nasional 0.0 7.4 7.4 Other issuers 0.0 0.4 0.4 Private debt securities (PDS) 116.1 107.1 223.3 100 Short-term debt securities 5.8 5.9 11.7 5 Long-term debt securities 110.3 101.2 211.6 95 Cagamas securities 14.5 6.1 20.6 9 Bonds 62.7 64.9 127.7 57 Medium-term notes 10.9 27.0 37.9 17 Asset-backed securities 10.6 3.2 13.8 6 Other securities 11.6 0.0 11.6 5
Source: FAST website. Exhibit 1
Turnover of corporate bonds1
300
250
Initial sample200Final sample²
150
100
50
01997³ 1998 1999 2000 2001 2002 2003 2004 2005 2006
1 Annual turnover, in billions of ringgit, measured on a two-way basis (buys plus sells); turnover of all PDSs with an original maturity of greater than one year as well as bonds issued by Khazanah Nasional. 2 After screening for short-term instruments, cross trades and erroneous data. 3 Annualised data, based on turnover between October and December 1997.
Source: Bank Negara Malaysia; authors’ calculations. Exhibit 2
21
Indicators of liquidity
Turnover ratio Realised bid-ask spread
n Mean Standard deviation Median n Mean Standard
deviation Median
1998-06 3,605 1.82 1.82 1.33 14,958 0.066 0.132 0.010 1998 53 0.53 0.80 0.30 214 0.108 0.182 0.050 1999 96 1.13 1.87 0.67 894 0.058 0.104 0.013 2000 231 1.99 2.24 1.68 1,575 0.048 0.106 0.010 2001 293 1.83 2.40 1.11 1,336 0.075 0.142 0.020 2002 457 1.85 1.57 1.50 1,873 0.079 0.147 0.020 2003 635 2.30 2.02 1.98 2,774 0.077 0.141 0.020 2004 584 1.69 1.60 1.22 2,400 0.054 0.120 0.010 2005 706 1.95 1.72 1.57 2,336 0.068 0.144 0.010 2006 550 1.37 1.36 1.00 1,556 0.051 0.110 0.010
Exhibit 3
Turnover in selected bond markets
Annual turnover1,2
Amount outstanding1,3
Turnover ratio4
Government bonds Japan 17 664 3 869 4.6 Malaysia5,6 144 55 2.6 United Kingdom 5 993 672 8.9 United States 119 753 3 352 35.7 Agency bonds Japan7 172 284 0.6 Malaysia8 2 2 1.1 United States9 4 023 2 634 1.5 Corporate bonds and asset-backed securities Japan10 246 615 0.4 Malaysia (final sample)11 25 51 0.5 Malaysia (PDSs)5,12 60 60 1.0 United States (corporate bonds) 5 904 8 159 0.7 United States (GSE-backed mortgage pools) 68 539 3 965 17.3 1 Excluding money market instruments; in billions of US dollars; local-currency amounts are converted to US dollars at end-2006 exchange rates. 2 Turnover in 2006 measured on a two-way basis; excluding transactions related to repurchase agreements. 3 At end-2006. 4 Annual turnover of all bonds divided by the amount outstanding. 5 Turnover data are not screened for cross trades, money market transactions and erroneous entries. 6 Including Government Investment Issues (Islamic securities). 7 Government-guaranteed and FILP agency bonds. 8 Khazanah Nasional bonds. 9 Federal agency and GSE securities, excluding GSE-backed mortgage pools. 10 Corporate straight bonds plus interest-bearing bank debentures. 11 PDSs, excluding medium-term notes, plus Khazanah bonds; turnover data are screened for cross trades, money market transactions and erroneous entries. 12 PDSs, including medium-term notes.
Source: Bank Negara Malaysia; Japan Securities Dealers Association; UK Debt Management Office; US Federal Reserve; authors’ calculations. Exhibit 4
22
Concentration of trading activity, by number of issuers
0.4 80%
0.3 60%
0.2 40%Top 30Top 10Top 50.1 20%Top 2Top 1HH (lhs)¹
0.0 0%1998 1999 2000 2001 2002 2003 2004 2005 2006
1 Herfindahl-Hirschman index of market concentration; normalised. Exhibit 5
Selected measures to promote the development of the PDS market, 1997-2006
Measure
1997 Sep establishment of BIDS 2000 Jan waiver of stamp duty for the issuance and transfer of private debt securities 2001 Feb launch of the Capital Market Master plan to promote the development of the ringgit
bond market Dec issuance of Guideline on Securities Borrowing and Lending Programme and Guidance
Notes on Repurchase Agreement Transactions 2002 Oct admittance of universal brokers as participants in the bond market and members of
FAST, BIDS and RENTAS 2004 Apr liberalisation of foreign exchange regulations to allow multilateral development banks
and multilateral financial institutions to issue ringgit bonds Sep revision of the regulatory treatment of Cagamas securities Sep partial abolishment of the withholding tax on interest income earned by non-residents Oct expansion of the use of repos for monetary policy operations by Bank Negara Malaysia2005 Apr complete abolishment of the withholding tax on interest income earned by non-residentsSource: Bank Negara Malaysia. Exhibit 6
23
Determinants of realised bid-ask spreads1
All issuers Benchmark issuers Other issuers Dependent variable k
tiSpread , Coefficient t-statistic Coefficient t-statistic Coefficient t-statistic
Bond-specific variables
Constant 0.005 0.928 0.001 0.105 0.076*** 4.749 Issue size 0.001 0.529 0.007*** 3.799 -0.008** -2.291 Maturity 0.019*** 10.139 0.007* 2.719 0.019*** 8.795 Maturity squared -0.001*** -6.122 0.000 -0.007 -0.001*** -5.522 New issue -0.015*** -5.277 -0.003 -1.334 -0.009 -1.552 AA 0.027*** 5.782 0.007 1.183 A 0.053*** 8.394 0.029*** 4.306 BBB 0.129* 2.613 0.080 1.502 Guaranteed -0.042*** -7.608 -0.044*** -4.171 Foreign issuer 0.021** 2.302 -0.003 -0.317 Unrated 0.004 0.487 -0.011 -1.247
Transaction-specific variables
Market return squared 5.161 1.079 1.774 0.405 21.992* 1.673 Trade size <=1 -0.032*** -5.350 -0.060*** -4.816 -0.028*** -4.271 Trade size >1 and <5 -0.017*** -4.226 -0.006 -0.613 -0.021*** -4.619 Trade size >5 and <10 -0.017*** -4.688 -0.007** -2.413 -0.022** -3.067 Trade size =10 -0.018*** -5.429 -0.007** -2.112 -0.030*** -5.975 Trade size >10 and <20 -0.027*** -7.194 -0.013*** -3.926 -0.045*** -6.069 Trade size >=20 -0.026*** -6.508 -0.008** -2.347 -0.049*** -6.474 Dealer-dealer 0.016 1.584 -0.003 -0.372 -0.011 -0.238 Dealer-FI -0.016*** -5.089 -0.010*** -3.873 0.011 1.080 Dealer-Other -0.024*** -5.270 0.008* 1.664 -0.038*** -5.779 FI-Other -0.006 -1.543 0.001 0.134 -0.018*** -2.817 Dealer-FI-Other 0.006 1.118 -0.001 -0.167 0.008 0.766 Inventory up 0.005 1.135 -0.002 -0.617 0.021** 1.804 Inventory down 0.029*** 5.431 0.014*** 3.336 0.083*** 5.110
Market-specific variables
1998 0.084*** 3.333 0.097*** 3.870 0.184** 1.991 1999 0.022** 2.982 0.023*** 3.677 0.046** 2.027 2001 0.000 -0.035 0.003 0.755 -0.010 -0.543 2002 -0.006 -1.216 -0.010** -2.360 -0.025 -1.622 2003 -0.018*** -3.266 -0.008* -1.681 -0.049*** -3.470 2004 -0.014** -2.798 -0.007** -2.260 -0.048*** -3.388 2005 -0.003 -0.425 0.009 1.031 -0.041*** -2.844 2006 -0.008 -0.946 0.025* 2.609 -0.053*** -3.365 1998*Islamic -0.011 -0.366 -0.019 -0.757 0.022 0.184 1999*Islamic -0.006 -0.632 0.024* 1.889 -0.044* -1.655 2000*Islamic 0.012 1.404 0.048*** 3.762 -0.040** -2.051 2001*Islamic 0.042*** 4.659 0.045*** 3.848 0.049** 2.471 2002*Islamic 0.032*** 4.205 0.062*** 3.944 0.013 1.180 2003*Islamic 0.012* 1.826 0.040*** 3.541 0.002 0.202 2004*Islamic 0.002 0.267 0.047*** 4.702 -0.013 -1.444 2005*Islamic -0.007 -0.855 0.013 0.972 -0.009 -1.035 2006*Islamic -0.034*** -3.814 -0.024** -2.021 -0.033*** -3.648
Adjusted R2 0.131 0.136 0.123 n 14’958 6’607 8’351 1 OLS estimation with Newey-West standard errors. Exhibit 7
24