liquid chromatography - mass spectrometry - ubdiposit.ub.edu/dspace/bitstream/2445/32140/1/cht07 -...
TRANSCRIPT
ChT.7
Liquid Chromatography - Mass Spectrometry
Olga Jáuregui1, Isidre Casals1, and Irene Fernández2
1 Unitat de Tècniques Separatives d’Anàlisi, CCiTUB, Universitat de Barcelona. Parc Científic de Barcelona. Baldiri Reixac, 10. 08028 Barcelona, Spain.
2 Unitat d’Espectrometria de Masses (Química), CCiTUB, Universitat de Barcelona. Fac. Química. Martí i Franquès s/n. 08028 Barcelona, Spain.
email: [email protected], [email protected], [email protected]
Abstract. In this article, selected examples of applications of liquid chromatography coupled to mass spectrometry are given. The examples include the analysis of i) impurities in manufactured, pharmaceutical or synthesis products, ii) polyphenols in natural products, and iii) phytohormones in plant extracts. Finally, examples of applications of molecular characterization via flow injection analysis by electron spray ionization mass spectrometry (ESI-MS) are
also given.
Handbook of instrumental techniques from CCiTUB
Liquid Chromatography - Mass Spectrometry
1
ChT.7
1.1.1.1. Introduction Introduction Introduction Introduction
Liquid Chromatography – Mass Spectrometry (LC-MS) is a hyphenated analytical tool that has become popular from the middle nineties of the twenty century. It is a relatively young technique that has evolved quickly reaching a wide range of applications, from inorganics to biological macromolecules. The advantage of LC-MS is that non-volatile molecules of interest can be studied without the need of derivatization reactions, making easiest the sample preparation.
Some of the applications performed in our units are the following: analyses of molecules involved in animal/vegetal metabolism (natural or xenobiotics), analyses of impurities in products from synthesis (fine chemicals/biochemicals), analyses of degradation products and biotransformations, analyses of natural products (antioxidants, new drugs, industrial products), analysis for bromatolgy (additives, organoleptic modifiers), toxicological and forensic analyses (natural toxins, toxical additives, preservatives), molecular weight determinations, structural studies of unknown molecules, among many other applications.
2. 2. 2. 2. Methodology Methodology Methodology Methodology
The available instruments in our Units allow us to use chromatographs and spectrometers from different brands, with diverse capabilities. Mass spectrometers fitted with different ionization sources such as electron spray ionization (ESI), atmospheric pressure chemical ionization (APCI), atmospheric pressure photoionization (APPI) and different kind of mass analyzers such as single quadrupole (Q), triple quadrupole (QQQ), ion trap (IT), orbitrap (OT), and time of flight (TOF) are available. This combination of techniques makes it possible to work using a wide variety of experiments, namely LC-MS, LC-MS/MS, LC-MSn, LC-HRMS, etc. being LC any of the following modes of work: gel permeation chromatography (GPC), high-performance liquid chromatography (HPLC), ultra-high-performance liquid chromatography (UHPLC) and flow-injection analysis (FIA). As a result, a wide variety of analytical problems can be addressed using our facility. The basis of the above mentioned mass spectrometry techniques has been described elsewhere in this Handbook.
In the following, examples of applications of different LC-MS techniques are given.
3. 3. 3. 3. HPLCHPLCHPLCHPLC----HRMS for identification of impurities in chemical productsHRMS for identification of impurities in chemical productsHRMS for identification of impurities in chemical productsHRMS for identification of impurities in chemical products
Several strategies for drug impurity profiling have been reported in the literature, all of them stressing the importance of qualitative data from hyphenated chromatography-mass spectrometry like HPLC-MS. Among the different analyzers, those providing high-resolution such as TOFs and Fourier transform mass spectrometers would be the instruments of choice. Hybrid instruments (such as Q-q-TOF or IT-FTMS) can produce high quality MS/MS spectra including high-resolution data for the determination of molecular formulae. Both single MS and MS/MS experiments can be performed at good accuracy and high resolution.
Typically, our approach involves the installation of a suitable HPLC method or modification of an existing method for use with volatile buffers that are compatible with a mass spectrometer. The goal is to assure adequate separation of the active ingredient and the impurity or degradation product(s). Normally, the analyses are done in QTOF or LTQ-Orbitrap mass spectrometers that allow the obtention of some formulae for the impurities of interest. Once separation is achieved, we obtain the full scan and MS/MS spectra of the product(s) of interest. This approach helps us to develop a relational understanding of molecular structure to mass spectrometric fragmentation patterns, which then are used to identify putative structures. The customer report will include the ultra-violet (UV) chromatograms, the trace mass chromatograms, the mass spectra obtained at resolution between 10.000 and 30.000 (if desired, up to 100.000) and if possible, the MS/MS spectra. In addition, if the customer gives us possible elements, we can also include possible empirical formulae with the associated error (always below 2 mDa) that could help in the interpretation of results.
Liquid Chromatography - Mass Spectrometry
2
ChT.7
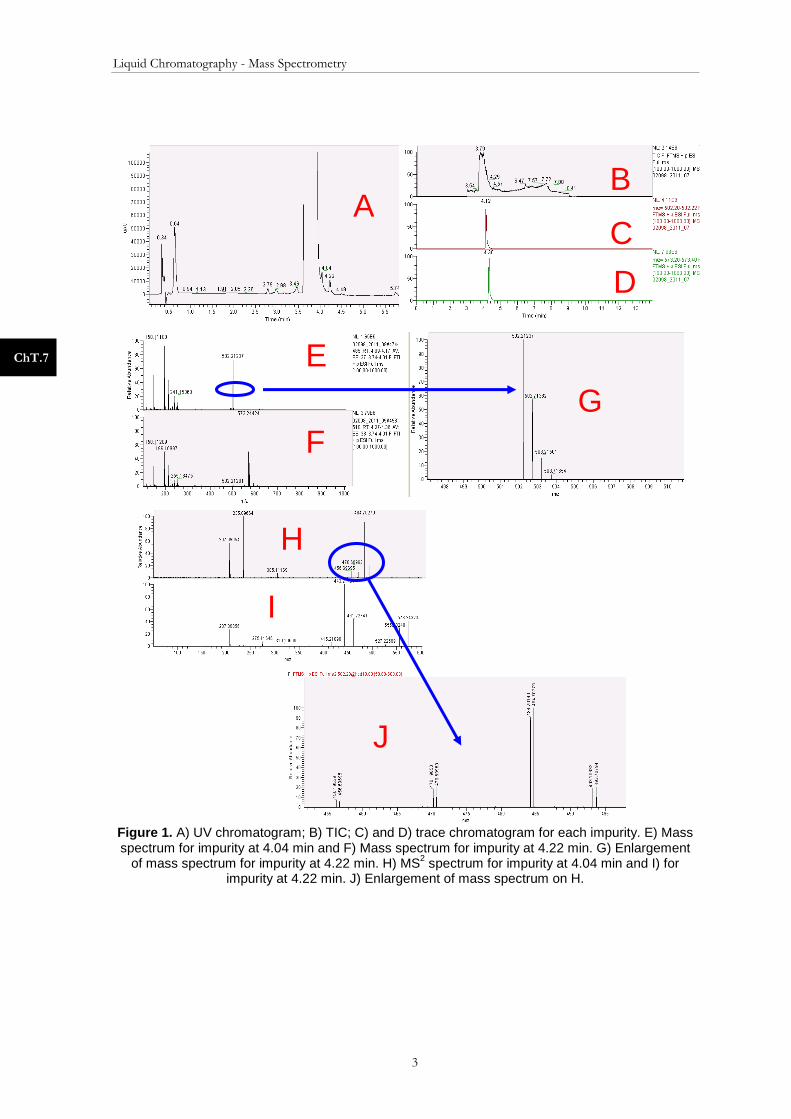
In the example of Fig. 1 we can see the UV chromatogram (Fig 1A), the total ion current (TIC) (Fig 1B) and the trace mass chromatogram (Fig 1C and 1D) for the two impurities scope of the work (those at 4.04 and 4.22 min in the UV chromatogram). The high-resolution mass spectrum allows the clear identification of double-charged species in impurity at 4.22 min as it can be seen in Fig. 1G where 0.5 Da spaced ions are observed. The hybrid instrument IT-FTMS allows the MS2 and MSn spectra to be acquired (Fig. 1H and 1I). A list of some empirical formulae is obtained for all the fragments with errors between 0.5 and 2.0 mDa.
4. 4. 4. 4. Characterization of polyphenols in natural products by HPLCCharacterization of polyphenols in natural products by HPLCCharacterization of polyphenols in natural products by HPLCCharacterization of polyphenols in natural products by HPLC----MS/MS MS/MS MS/MS MS/MS in a triple in a triple in a triple in a triple quadrupole instrument and by HPLCquadrupole instrument and by HPLCquadrupole instrument and by HPLCquadrupole instrument and by HPLC----HRMS in an ITHRMS in an ITHRMS in an ITHRMS in an IT----FTMS FTMS FTMS FTMS instrumentinstrumentinstrumentinstrument
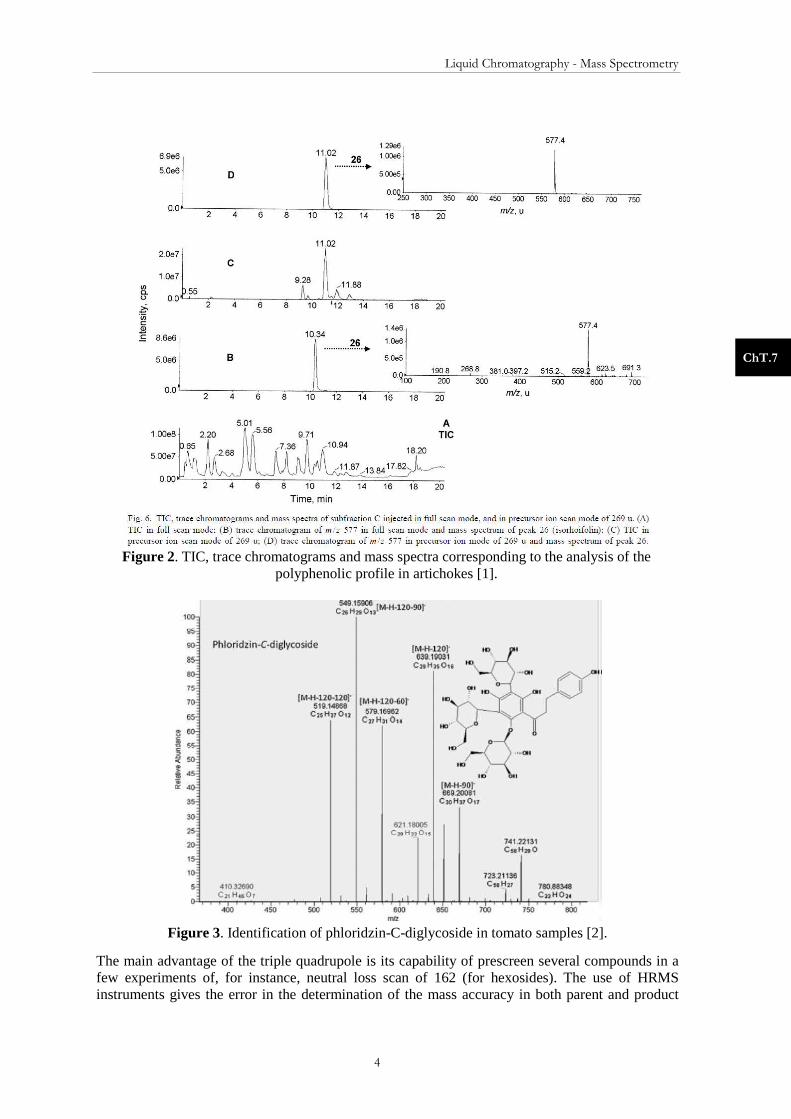
In the HPLC-MS laboratory of the CCiTUB, we have a large experience in the characterization of polyphenols and related substances in natural products such as apples, artichokes, plants, beer, cocoa, wine, et Identification of phenolic compounds in food matrices is a complex task, compared to the identification of enriched supplements or drugs, due to the wide variety of structures present in nature and the lack of standard polyphenols commercially available. During several years the characterization of phenolic compounds was done using triple quadrupole instruments through MS/MS experiments such as Product Ion Scan, Precursor Ion Scan and Neutral Loss Scan. The full scan in quadrupole instruments shows a poor signal-to-noise ratio but the MS/MS experiments such as precursor or neutral loss allow the screening of families of polyphenols. Figure 2 shows an example of the use of a triple quadrupole for characterization of the polyphenolic profile in artichokes [1]. Here, we can see the ability of the precursor ion experiment to clarify the chromatogram and facilitate the screening of compounds family (Fig 2A versus Fig 2C).
The arrival of HRMS instruments has improved the full scan experiments and, moreover, it has facilitated the identification and confirmation tasks through the generation of empirical formulae with a very good mass accuracy. In this example, the characterization of polyphenols in tomato samples is presented using both triple quadrupole and IT-FTMS instruments [2].
Liquid Chromatography - Mass Spectrometry
3
ChT.7
Figure 1. A) UV chromatogram; B) TIC; C) and D) trace chromatogram for each impurity. E) Mass spectrum for impurity at 4.04 min and F) Mass spectrum for impurity at 4.22 min. G) Enlargement
of mass spectrum for impurity at 4.22 min. H) MS2 spectrum for impurity at 4.04 min and I) for impurity at 4.22 min. J) Enlargement of mass spectrum on H.
A B
C
D
E
F
C
G
H
I
J
Liquid Chromatography - Mass Spectrometry
4
ChT.7
Figure 2. TIC, trace chromatograms and mass spectra corresponding to the analysis of the polyphenolic profile in artichokes [1].
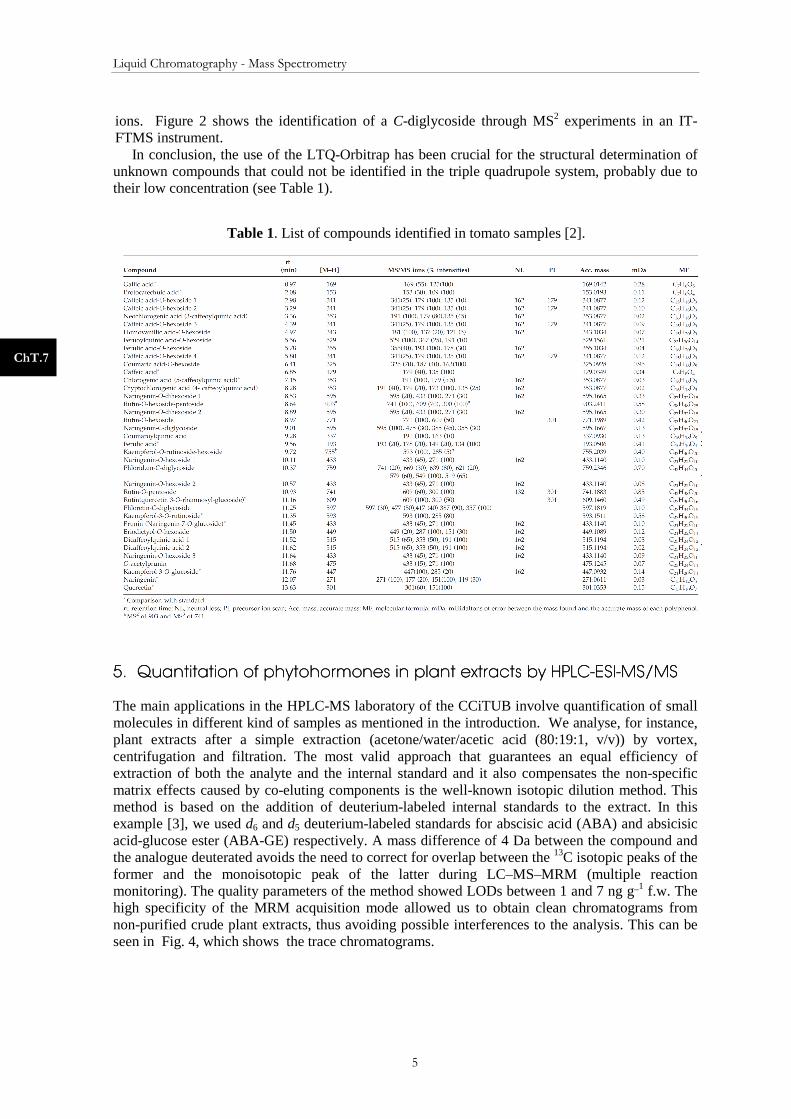
Figure 3. Identification of phloridzin-C-diglycoside in tomato samples [2].
The main advantage of the triple quadrupole is its capability of prescreen several compounds in a few experiments of, for instance, neutral loss scan of 162 (for hexosides). The use of HRMS instruments gives the error in the determination of the mass accuracy in both parent and product
Liquid Chromatography - Mass Spectrometry
5
ChT.7
ions. Figure 2 shows the identification of a C-diglycoside through MS2 experiments in an IT-FTMS instrument.
In conclusion, the use of the LTQ-Orbitrap has been crucial for the structural determination of unknown compounds that could not be identified in the triple quadrupole system, probably due to their low concentration (see Table 1).
Table 1. List of compounds identified in tomato samples [2].
5. 5. 5. 5. Quantitation of phytohormonesQuantitation of phytohormonesQuantitation of phytohormonesQuantitation of phytohormones in plant extracts by HPLCin plant extracts by HPLCin plant extracts by HPLCin plant extracts by HPLC----ESIESIESIESI----MS/MSMS/MSMS/MSMS/MS
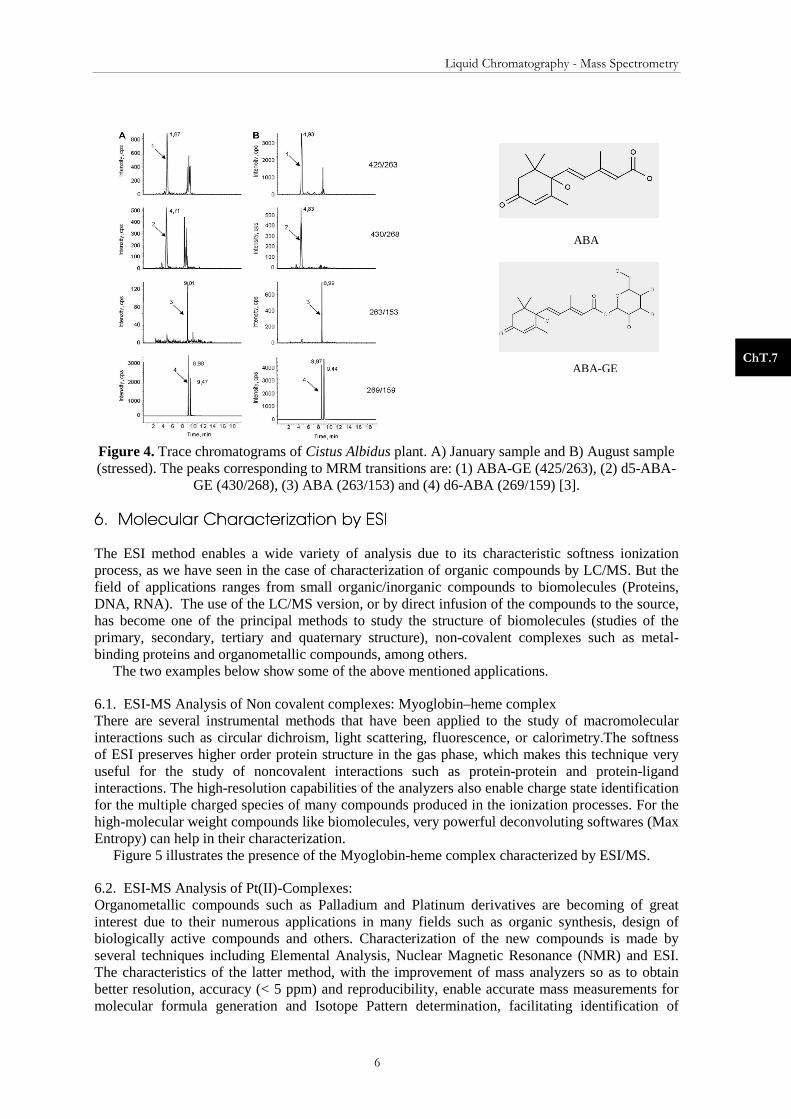
The main applications in the HPLC-MS laboratory of the CCiTUB involve quantification of small molecules in different kind of samples as mentioned in the introduction. We analyse, for instance, plant extracts after a simple extraction (acetone/water/acetic acid (80:19:1, v/v)) by vortex, centrifugation and filtration. The most valid approach that guarantees an equal efficiency of extraction of both the analyte and the internal standard and it also compensates the non-specific matrix effects caused by co-eluting components is the well-known isotopic dilution method. This method is based on the addition of deuterium-labeled internal standards to the extract. In this example [3], we used d6 and d5 deuterium-labeled standards for abscisic acid (ABA) and absicisic acid-glucose ester (ABA-GE) respectively. A mass difference of 4 Da between the compound and the analogue deuterated avoids the need to correct for overlap between the 13C isotopic peaks of the former and the monoisotopic peak of the latter during LC–MS–MRM (multiple reaction monitoring). The quality parameters of the method showed LODs between 1 and 7 ng g_1 f.w. The high specificity of the MRM acquisition mode allowed us to obtain clean chromatograms from non-purified crude plant extracts, thus avoiding possible interferences to the analysis. This can be seen in Fig. 4, which shows the trace chromatograms.
Liquid Chromatography - Mass Spectrometry
6
ChT.7
Figure 4. Trace chromatograms of Cistus Albidus plant. A) January sample and B) August sample (stressed). The peaks corresponding to MRM transitions are: (1) ABA-GE (425/263), (2) d5-ABA-
GE (430/268), (3) ABA (263/153) and (4) d6-ABA (269/159) [3].
6. 6. 6. 6. Molecular Characterization by ESIMolecular Characterization by ESIMolecular Characterization by ESIMolecular Characterization by ESI
The ESI method enables a wide variety of analysis due to its characteristic softness ionization process, as we have seen in the case of characterization of organic compounds by LC/MS. But the field of applications ranges from small organic/inorganic compounds to biomolecules (Proteins, DNA, RNA). The use of the LC/MS version, or by direct infusion of the compounds to the source, has become one of the principal methods to study the structure of biomolecules (studies of the primary, secondary, tertiary and quaternary structure), non-covalent complexes such as metal-binding proteins and organometallic compounds, among others.
The two examples below show some of the above mentioned applications.
6.1. ESI-MS Analysis of Non covalent complexes: Myoglobin–heme complex There are several instrumental methods that have been applied to the study of macromolecular interactions such as circular dichroism, light scattering, fluorescence, or calorimetry.The softness of ESI preserves higher order protein structure in the gas phase, which makes this technique very useful for the study of noncovalent interactions such as protein-protein and protein-ligand interactions. The high-resolution capabilities of the analyzers also enable charge state identification for the multiple charged species of many compounds produced in the ionization processes. For the high-molecular weight compounds like biomolecules, very powerful deconvoluting softwares (Max Entropy) can help in their characterization.
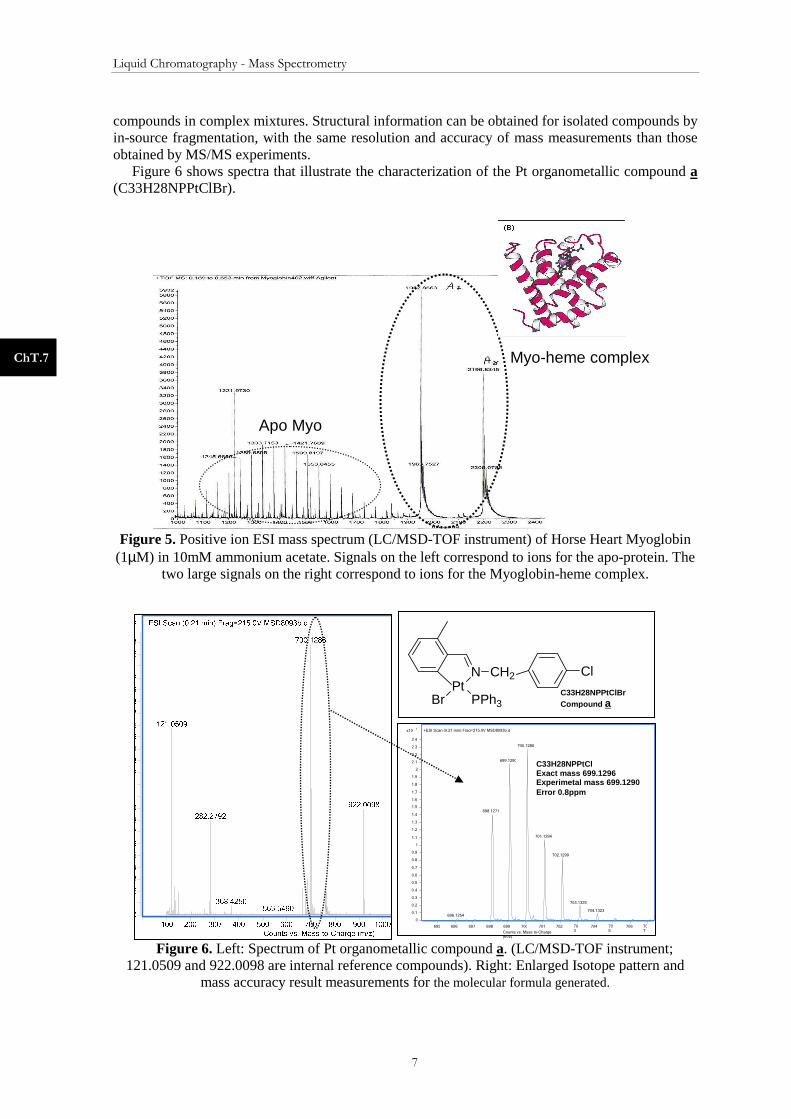
Figure 5 illustrates the presence of the Myoglobin-heme complex characterized by ESI/MS.
6.2. ESI-MS Analysis of Pt(II)-Complexes: Organometallic compounds such as Palladium and Platinum derivatives are becoming of great interest due to their numerous applications in many fields such as organic synthesis, design of biologically active compounds and others. Characterization of the new compounds is made by several techniques including Elemental Analysis, Nuclear Magnetic Resonance (NMR) and ESI. The characteristics of the latter method, with the improvement of mass analyzers so as to obtain better resolution, accuracy (< 5 ppm) and reproducibility, enable accurate mass measurements for molecular formula generation and Isotope Pattern determination, facilitating identification of
ABA
ABA-GE
Liquid Chromatography - Mass Spectrometry
7
ChT.7
compounds in complex mixtures. Structural information can be obtained for isolated compounds by in-source fragmentation, with the same resolution and accuracy of mass measurements than those obtained by MS/MS experiments.
Figure 6 shows spectra that illustrate the characterization of the Pt organometallic compound a (C33H28NPPtClBr).
Figure 5. Positive ion ESI mass spectrum (LC/MSD-TOF instrument) of Horse Heart Myoglobin (1µM) in 10mM ammonium acetate. Signals on the left correspond to ions for the apo-protein. The
two large signals on the right correspond to ions for the Myoglobin-heme complex.
Figure 6. Left: Spectrum of Pt organometallic compound a. (LC/MSD-TOF instrument; 121.0509 and 922.0098 are internal reference compounds). Right: Enlarged Isotope pattern and
mass accuracy result measurements for the molecular formula generated.
Myo-heme complex
Apo Myo
NPt
Br PPh3
CH2 Cl
5x10
0
0.1
0.2
0.3
0.4
0.5
0.6
0.7
0.8
0.9
1
1.1
1.2
1.3
1.4
1.5
1.6
1.7
1.8
1.9
2
2.1
2.2
2.3
2.4
+ESI Scan (0.21 min) Frag=215.0V MSD8093b.d
700.1286 699.1290
698.1271
701.1294
702.1299
703.1325
704.1323
696.1254
Counts vs. Mass-to-Charge (m/z)
695 696 697 698 699 700 701 702 703 704 70
5 706 707
C33H28NPPtCl Exact mass 699.1296 Experimetal mass 699.1290 Error 0.8ppm
C33H28NPPtClBr Compound a
Liquid Chromatography - Mass Spectrometry
8
ChT.7
ReferencesReferencesReferencesReferences
[1] F. Sánchez-Rabaneda et al. Journal of Chromatography A 1008 (2003) 57–72 [2] A. Vallverdú-Queralt et al. Rapid Commun. Mass Spectrom. 2010; 24: 2986–2992 [3] M. López-Carbonell et al. Plant Physiology and Biochemistry 47 (2009) 256–261

Liquid Chromatography - Mass Spectrometry
9
ChT.7