linux crash dump capture and analysis
TRANSCRIPT

RED HAT CONFIDENTIAL | [email protected]#rhconvergence
1
Red Hat Enterprise Linux
Kernel Crash Capture and AnalysisPaul [email protected] Technical Account Manager19 March 2014
Linux Kernel Crash Capture and Analysis
Topics
● What is a crash and why does it happen?
● Data collection: vmcore capture with kdump
● Data extraction: inspecting a vmcore

Linux Kernel Crash Capture and Analysis
What is a Crash?
The system has come to halt and no progress is observed. The system seems unresponsive or has already rebooted.
● Panic - A voluntary halt to all system activity when an abnormal situation is detected by the kernel.
● Oops - Similar to panics, but the kernel deems that the situation is not hopeless, so it kills the offending process and continues.
● BUG_ON() - Similar to a panic, but is called by intentional code meant to check abnormal conditions.
● Hang - The system does not seem to be making any progress. System does not respond to normal user interaction.
Linux Kernel Crash Capture and Analysis
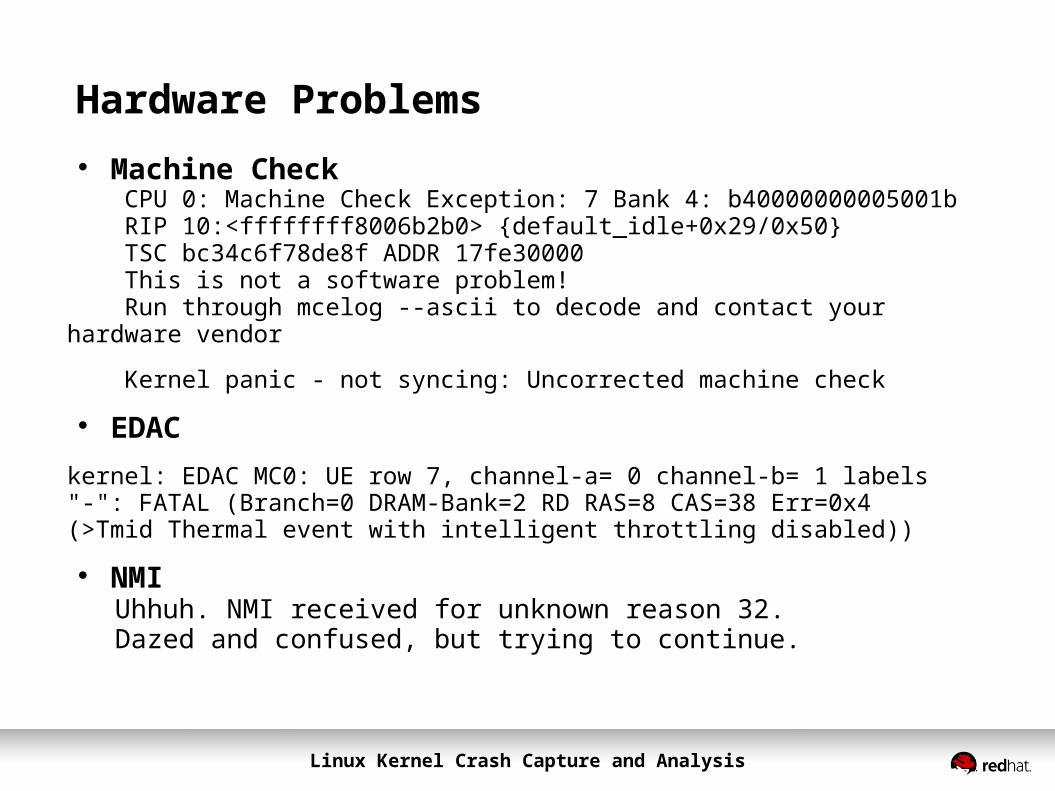
Hardware Problems Machine Check CPU 0: Machine Check Exception: 7 Bank 4: b40000000005001b RIP 10:<ffffffff8006b2b0> {default_idle+0x29/0x50} TSC bc34c6f78de8f ADDR 17fe30000 This is not a software problem! Run through mcelog --ascii to decode and contact your hardware vendor
Kernel panic - not syncing: Uncorrected machine check
EDACkernel: EDAC MC0: UE row 7, channel-a= 0 channel-b= 1 labels "-": FATAL (Branch=0 DRAM-Bank=2 RD RAS=8 CAS=38 Err=0x4 (>Tmid Thermal event with intelligent throttling disabled))
NMI Uhhuh. NMI received for unknown reason 32. Dazed and confused, but trying to continue.
Linux Kernel Crash Capture and Analysis
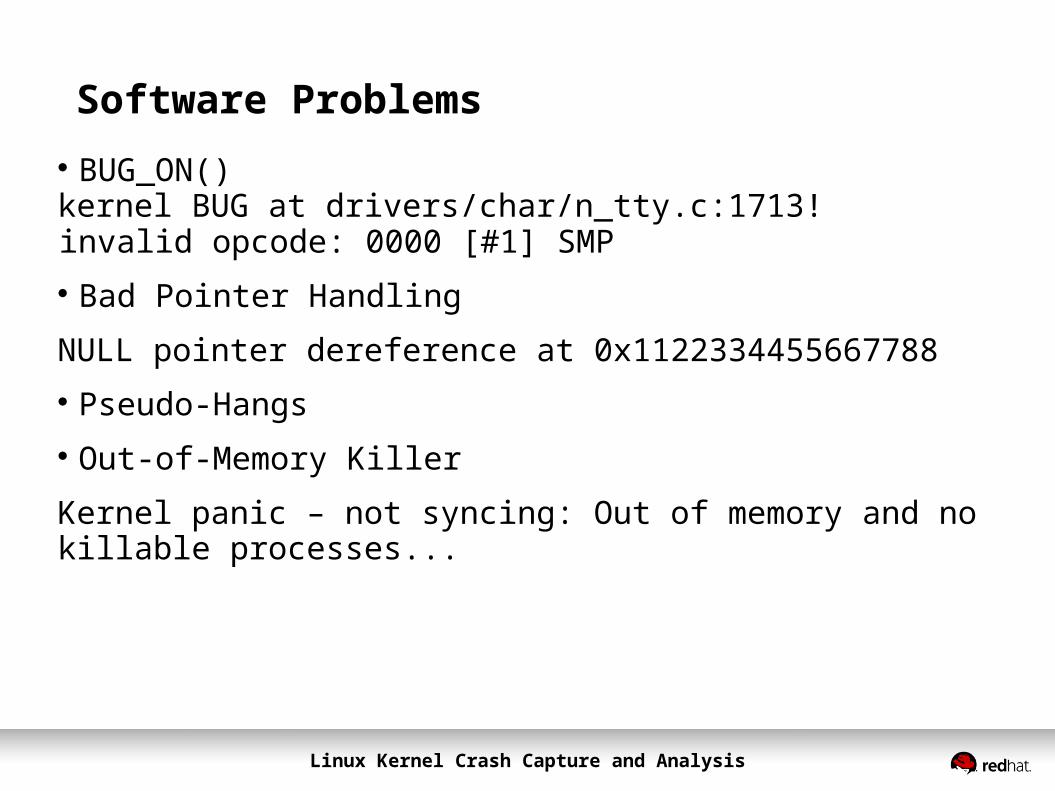
Software Problems BUG_ON()kernel BUG at drivers/char/n_tty.c:1713!invalid opcode: 0000 [#1] SMP Bad Pointer Handling
NULL pointer dereference at 0x1122334455667788 Pseudo-Hangs Out-of-Memory Killer
Kernel panic – not syncing: Out of memory and no killable processes...
Linux Kernel Crash Capture and Analysis
Software: Configurable Panics
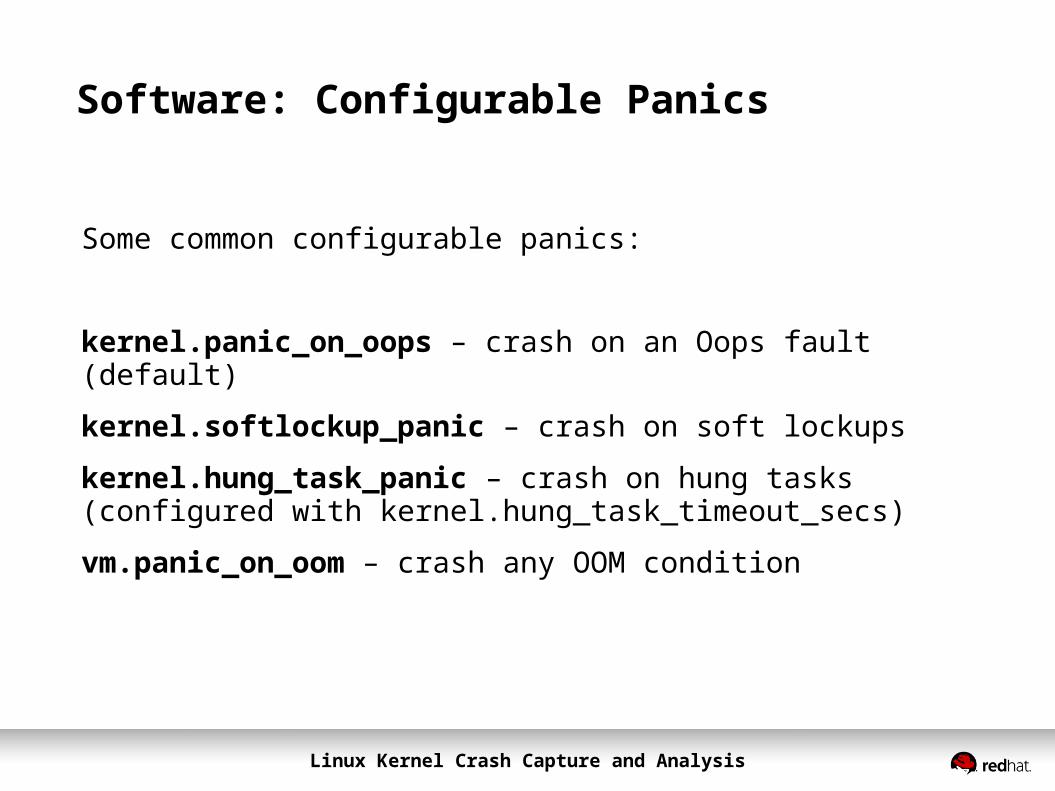
Some common configurable panics:
kernel.panic_on_oops – crash on an Oops fault (default)
kernel.softlockup_panic – crash on soft lockups
kernel.hung_task_panic – crash on hung tasks (configured with kernel.hung_task_timeout_secs)
vm.panic_on_oom – crash any OOM condition


Linux Kernel Crash Capture and Analysis
What is kdump?
Introduced in Red Hat Enterprise Linux 5
Kexec is used to start another complete copy of the Linux kernel in a reserved area of memory.
In the event of a crash, the secondary kernel takes over and copies the memory pages to the crash dump location.
Linux Kernel Crash Capture and Analysis
Quickstart
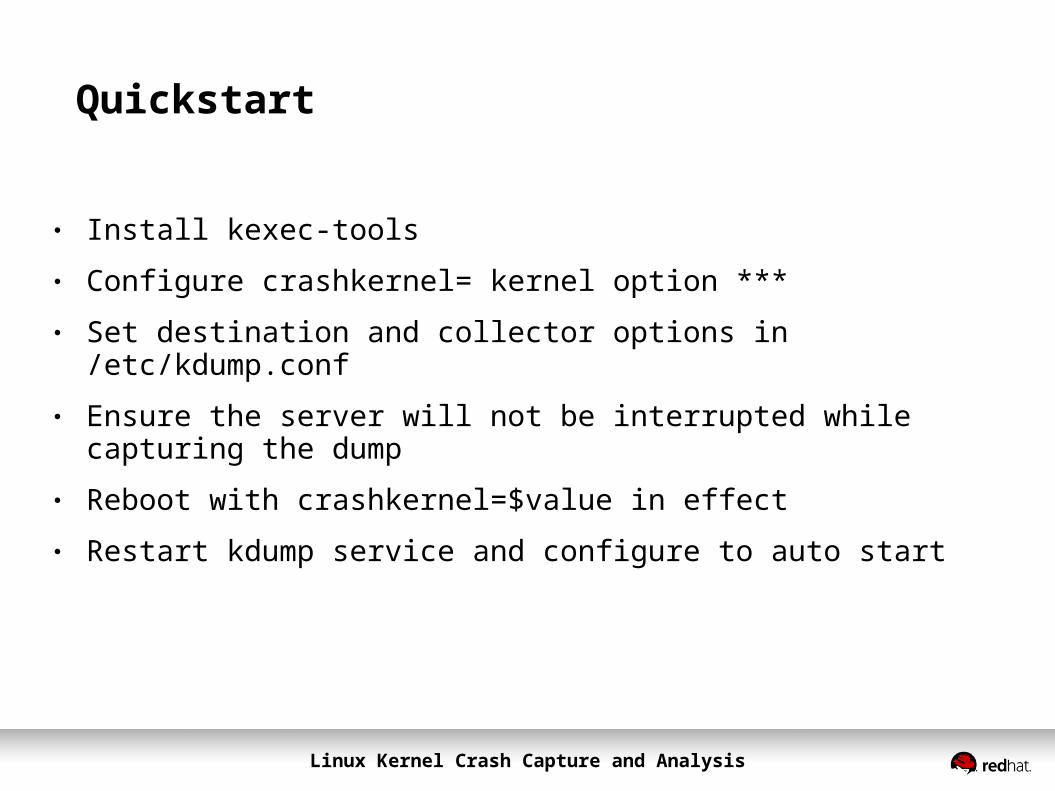
● Install kexec-tools● Configure crashkernel= kernel option ***● Set destination and collector options in /etc/kdump.conf● Ensure the server will not be interrupted while capturing the dump● Reboot with crashkernel=$value in effect● Restart kdump service and configure to auto start
Linux Kernel Crash Capture and Analysis
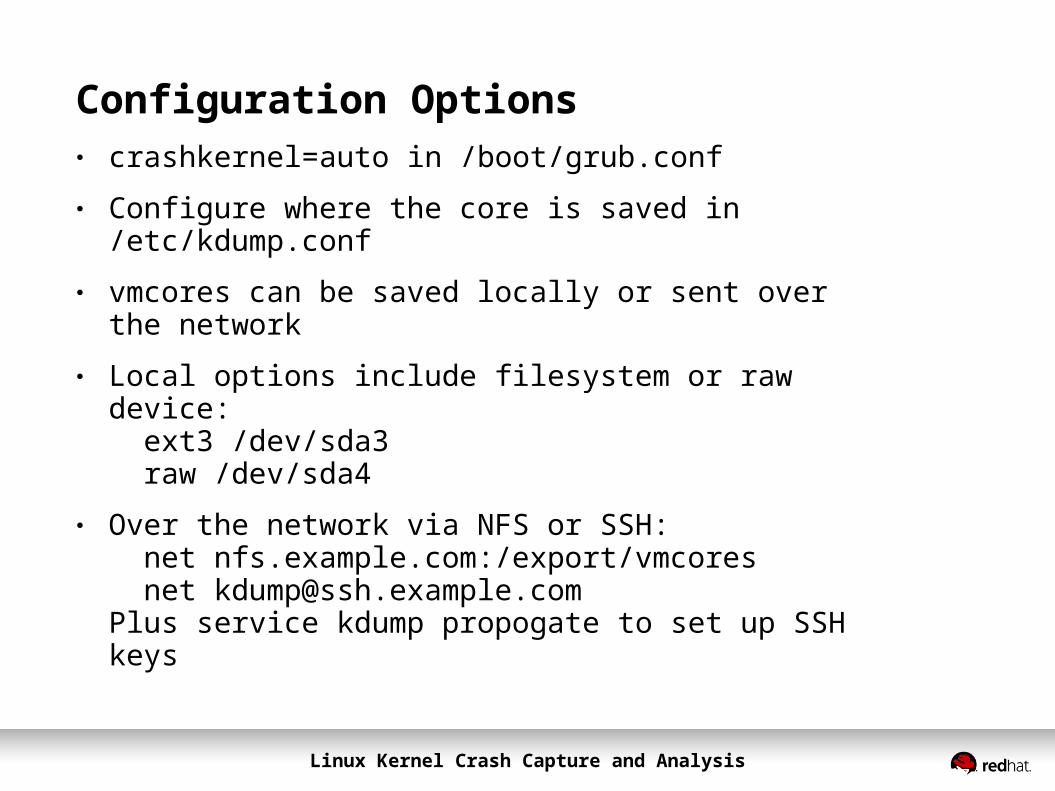
Configuration Options● crashkernel=auto in /boot/grub.conf● Configure where the core is saved in /etc/kdump.conf● vmcores can be saved locally or sent over the network● Local options include filesystem or raw device: ext3 /dev/sda3 raw /dev/sda4
● Over the network via NFS or SSH: net nfs.example.com:/export/vmcores net [email protected] service kdump propogate to set up SSH keys

Linux Kernel Crash Capture and Analysis
Configuring the Core Collector
Dump | zero cache cache user free Level | page page private data page -------+--------------------------------------- 0 | 1 | X 2 | X 4 | X X 8 | X 16 | X 31 | X X X X X
The entire contents of memory is rarely needed to analyze a kernel crash. The core collector can be configured to discard unneeded pages and
compress the saved pages. Zero, free, cache, and user pages are often not needed. To discard all optional pages and compress: core_collector makedumpfile -d 31 -c
Linux Kernel Crash Capture and Analysis
Prevent interruption of core collection
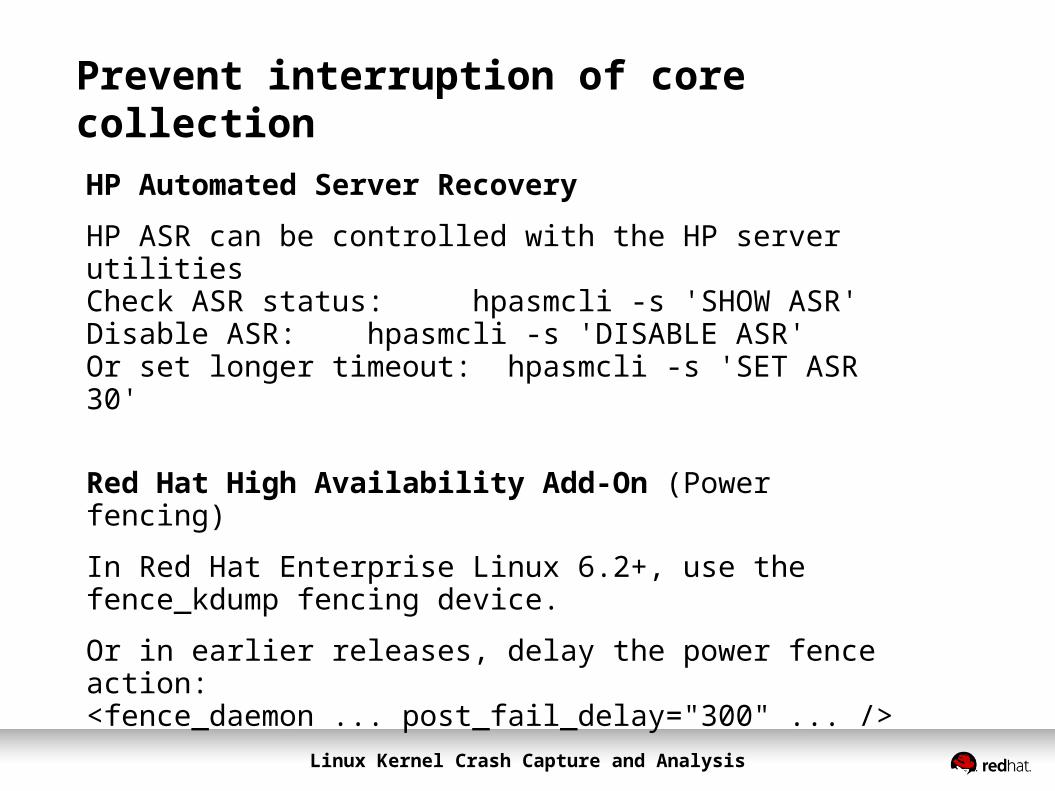
HP Automated Server RecoveryHP ASR can be controlled with the HP server utilitiesCheck ASR status: hpasmcli -s 'SHOW ASR'Disable ASR: hpasmcli -s 'DISABLE ASR'Or set longer timeout: hpasmcli -s 'SET ASR 30'
Red Hat High Availability Add-On (Power fencing)
In Red Hat Enterprise Linux 6.2+, use the fence_kdump fencing device.
Or in earlier releases, delay the power fence action:<fence_daemon ... post_fail_delay="300" ... />
Linux Kernel Crash Capture and Analysis
Collecting a vmcore
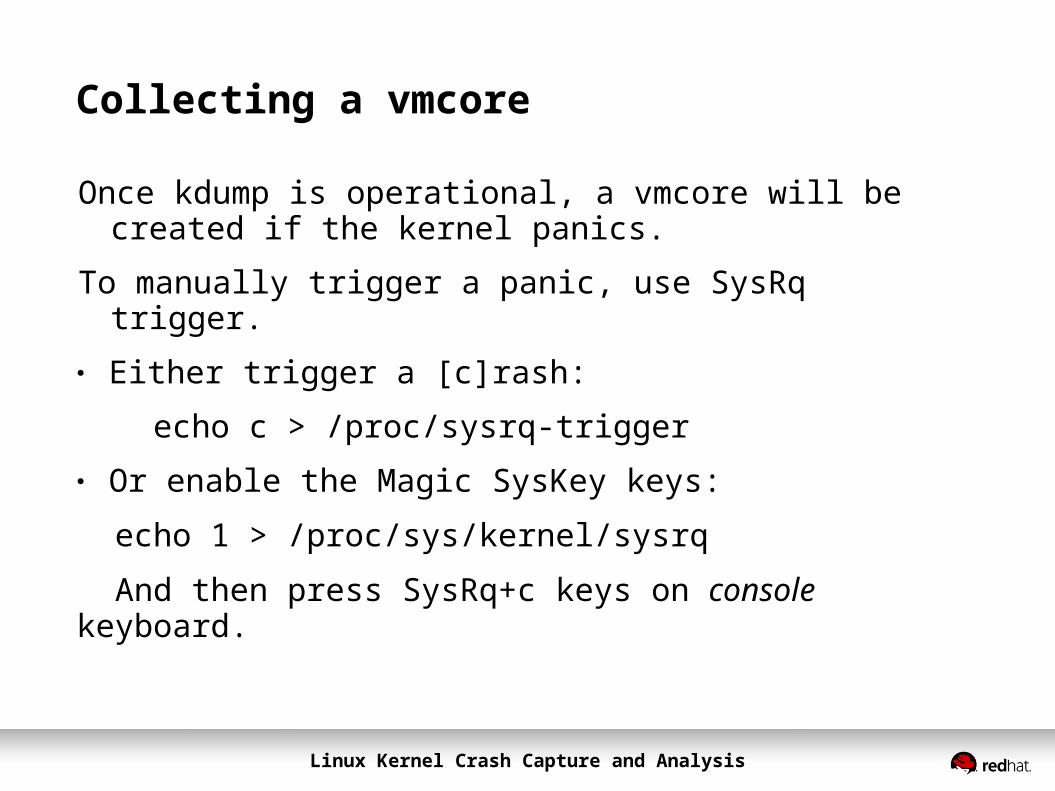
Once kdump is operational, a vmcore will be created if the kernel panics.
To manually trigger a panic, use SysRq trigger. ● Either trigger a [c]rash:
echo c > /proc/sysrq-trigger● Or enable the Magic SysKey keys:
echo 1 > /proc/sys/kernel/sysrq
And then press SysRq+c keys on console keyboard.
Linux Kernel Crash Capture and Analysis
Collecting a vmcore
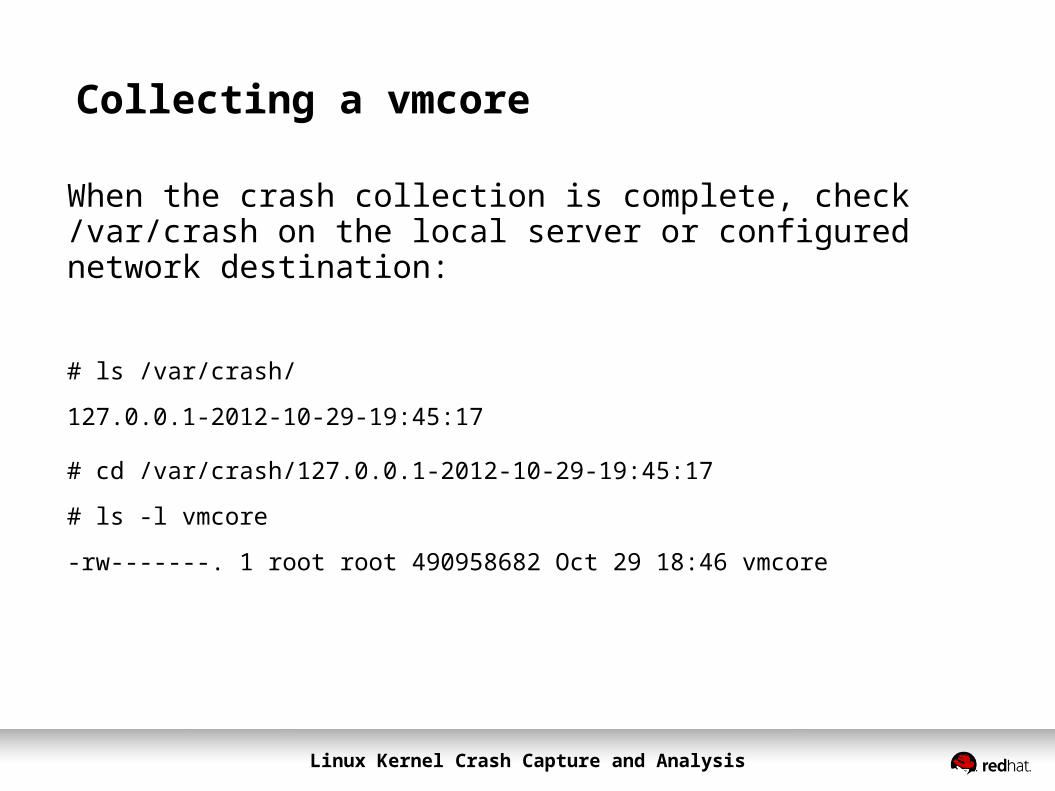
When the crash collection is complete, check /var/crash on the local server or configured network destination:
# ls /var/crash/
127.0.0.1-2012-10-29-19:45:17
# cd /var/crash/127.0.0.1-2012-10-29-19:45:17
# ls -l vmcore
-rw-------. 1 root root 490958682 Oct 29 18:46 vmcore

Linux Kernel Crash Capture and Analysis
Inspecting the vmcore
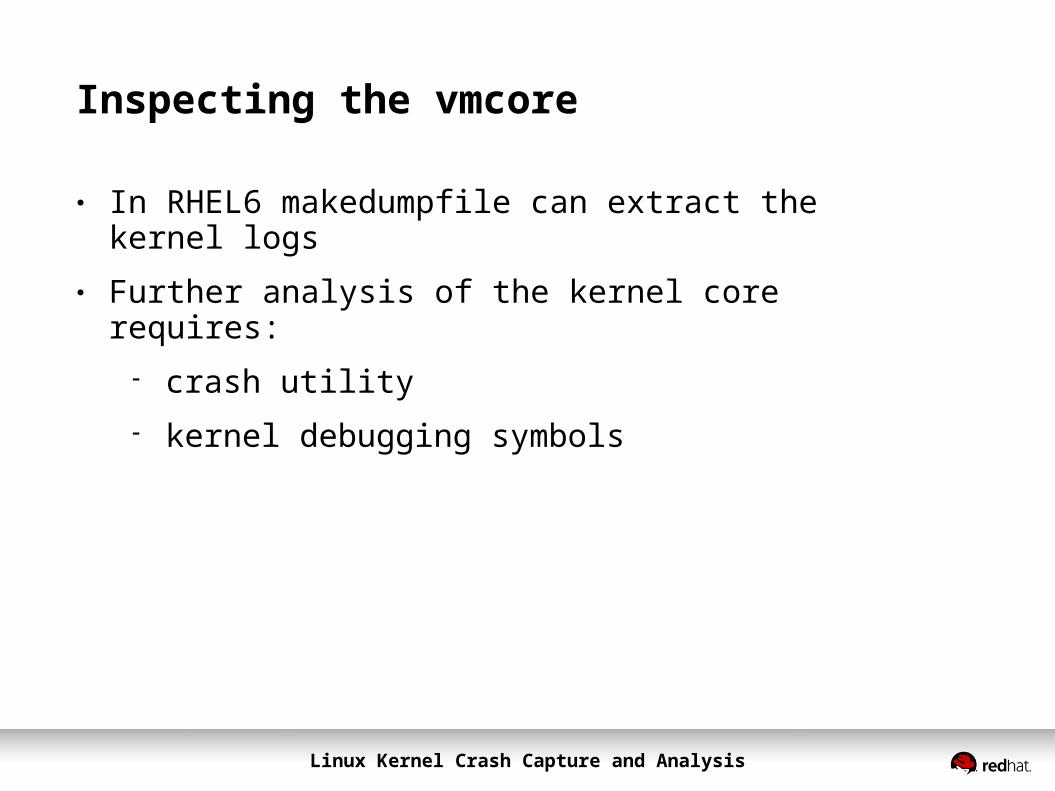
● In RHEL6 makedumpfile can extract the kernel logs● Further analysis of the kernel core requires:
crash utility kernel debugging symbols
Linux Kernel Crash Capture and Analysis
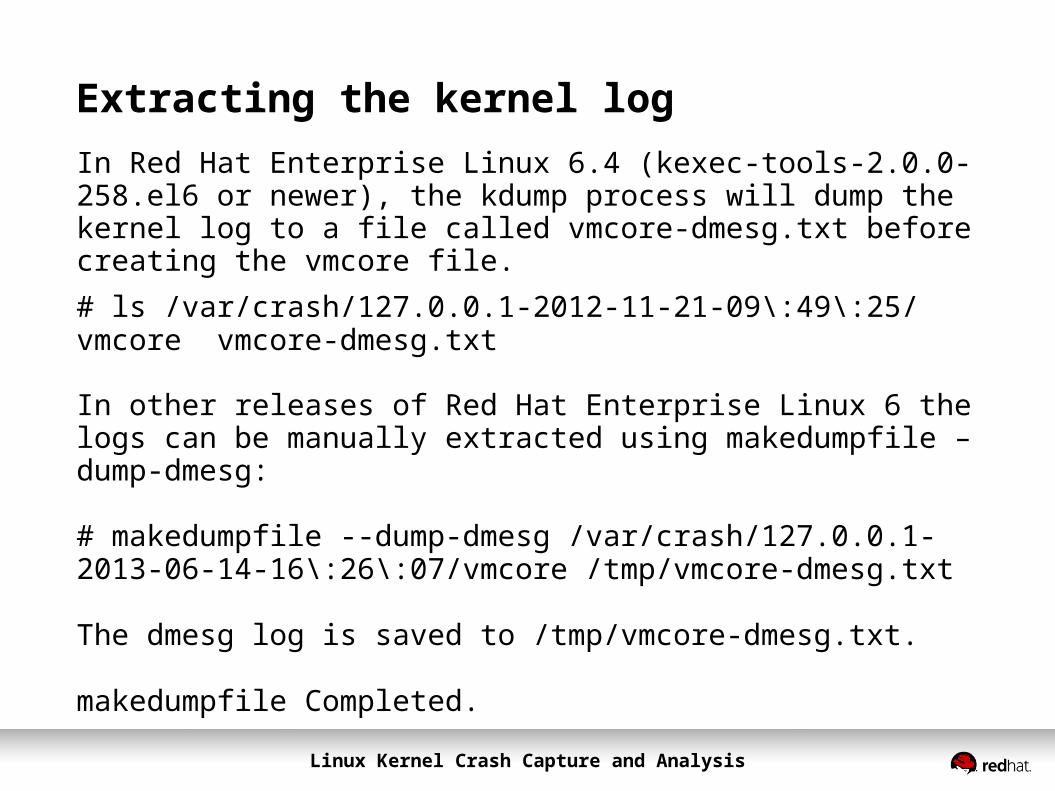
Extracting the kernel logIn Red Hat Enterprise Linux 6.4 (kexec-tools-2.0.0-258.el6 or newer), the kdump process will dump the kernel log to a file called vmcore-dmesg.txt before creating the vmcore file. # ls /var/crash/127.0.0.1-2012-11-21-09\:49\:25/vmcore vmcore-dmesg.txt
In other releases of Red Hat Enterprise Linux 6 the logs can be manually extracted using makedumpfile –dump-dmesg:
# makedumpfile --dump-dmesg /var/crash/127.0.0.1-2013-06-14-16\:26\:07/vmcore /tmp/vmcore-dmesg.txt
The dmesg log is saved to /tmp/vmcore-dmesg.txt.
makedumpfile Completed.
Linux Kernel Crash Capture and Analysis
Installing the crash utility
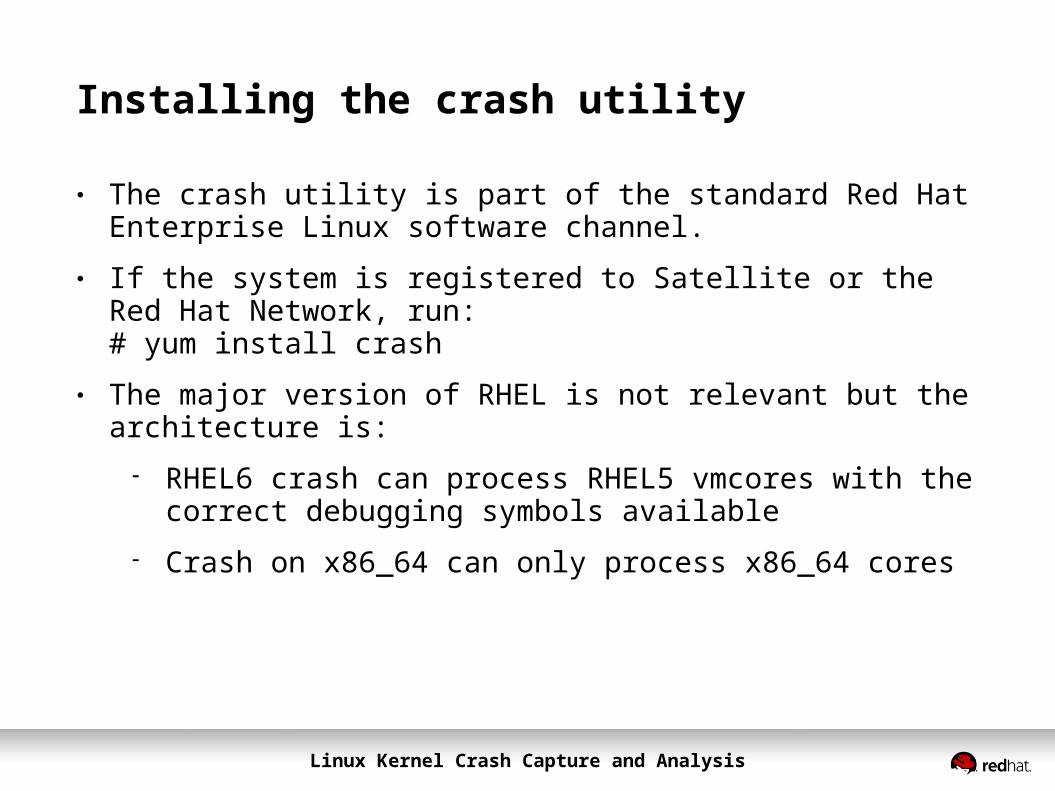
● The crash utility is part of the standard Red Hat Enterprise Linux software channel.
● If the system is registered to Satellite or the Red Hat Network, run:# yum install crash
● The major version of RHEL is not relevant but the architecture is: RHEL6 crash can process RHEL5 vmcores with the correct
debugging symbols available Crash on x86_64 can only process x86_64 cores
Linux Kernel Crash Capture and Analysis
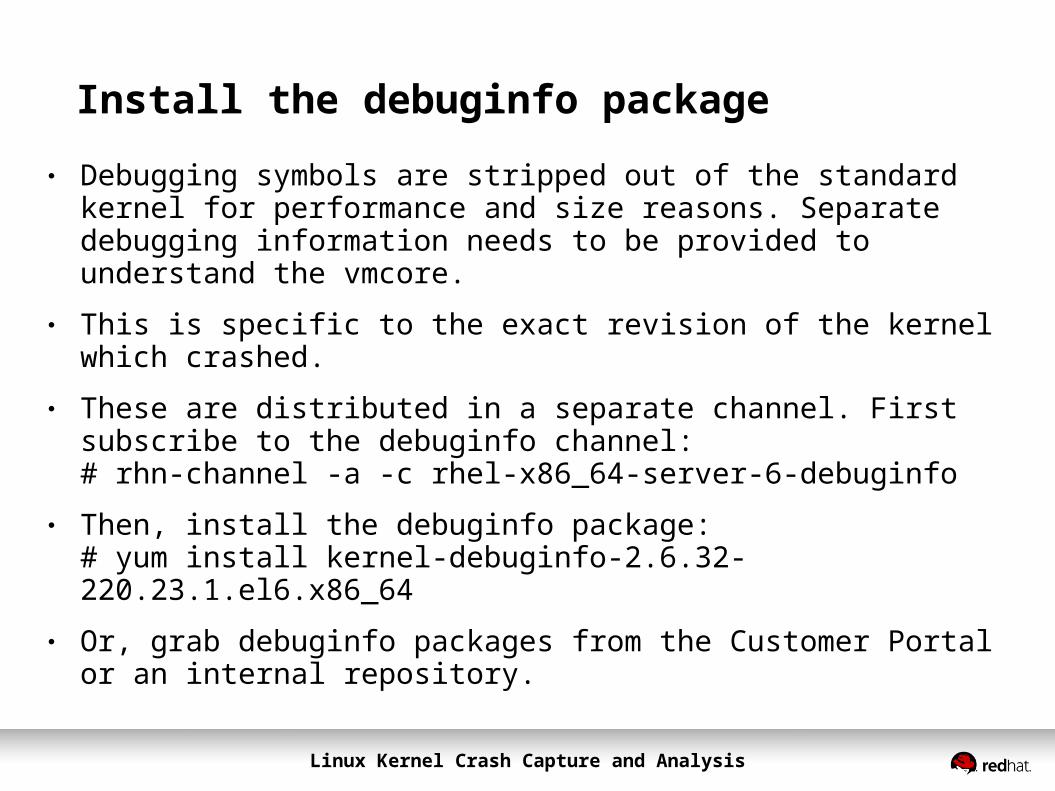
Install the debuginfo package● Debugging symbols are stripped out of the standard kernel for
performance and size reasons. Separate debugging information needs to be provided to understand the vmcore.
● This is specific to the exact revision of the kernel which crashed. ● These are distributed in a separate channel. First subscribe to the
debuginfo channel:# rhn-channel -a -c rhel-x86_64-server-6-debuginfo
● Then, install the debuginfo package:# yum install kernel-debuginfo-2.6.32-220.23.1.el6.x86_64
● Or, grab debuginfo packages from the Customer Portal or an internal repository.
Linux Kernel Crash Capture and Analysis
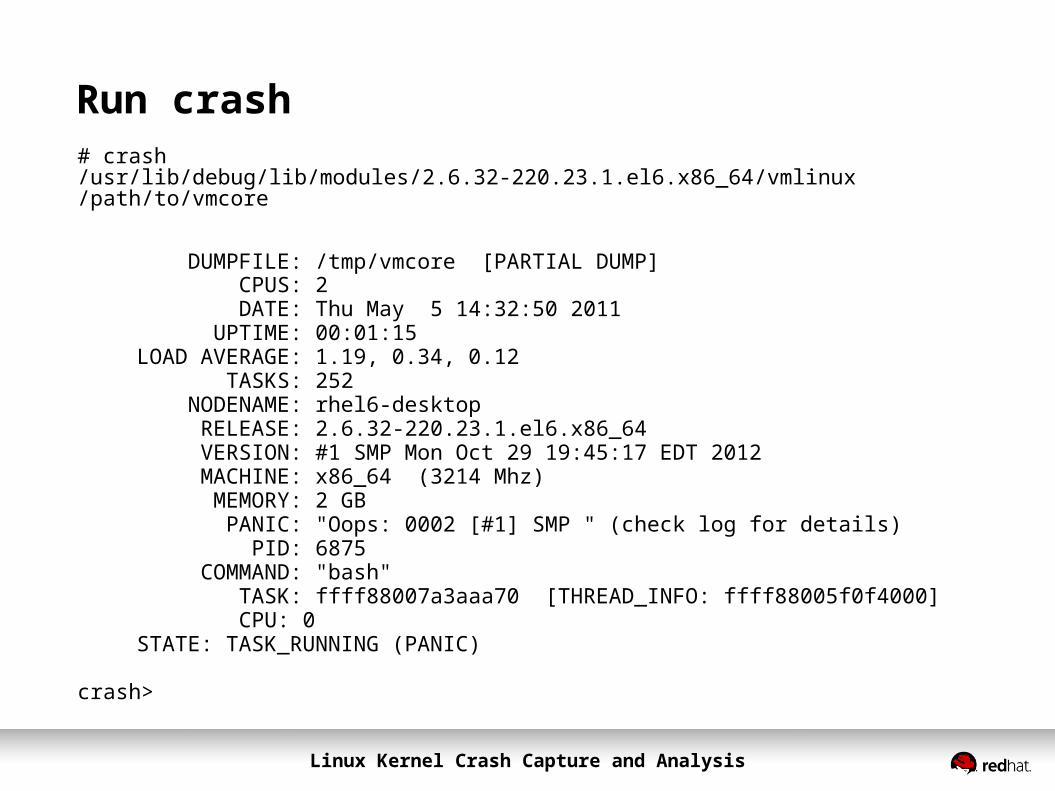
Run crash# crash /usr/lib/debug/lib/modules/2.6.32-220.23.1.el6.x86_64/vmlinux /path/to/vmcore
DUMPFILE: /tmp/vmcore [PARTIAL DUMP] CPUS: 2 DATE: Thu May 5 14:32:50 2011 UPTIME: 00:01:15LOAD AVERAGE: 1.19, 0.34, 0.12 TASKS: 252 NODENAME: rhel6-desktop RELEASE: 2.6.32-220.23.1.el6.x86_64 VERSION: #1 SMP Mon Oct 29 19:45:17 EDT 2012 MACHINE: x86_64 (3214 Mhz) MEMORY: 2 GB PANIC: "Oops: 0002 [#1] SMP " (check log for details) PID: 6875 COMMAND: "bash" TASK: ffff88007a3aaa70 [THREAD_INFO: ffff88005f0f4000] CPU: 0STATE: TASK_RUNNING (PANIC)
crash>
Linux Kernel Crash Capture and Analysis
Crash commands
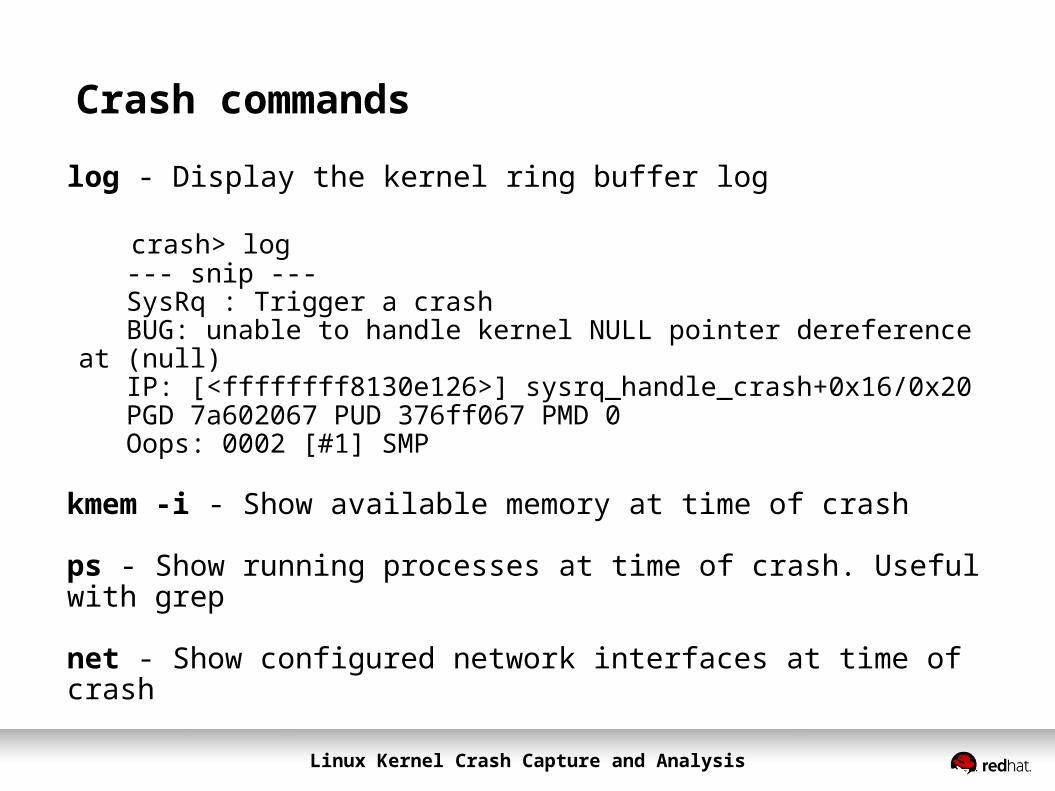
log - Display the kernel ring buffer log
crash> log --- snip --- SysRq : Trigger a crash BUG: unable to handle kernel NULL pointer dereference at (null) IP: [<ffffffff8130e126>] sysrq_handle_crash+0x16/0x20 PGD 7a602067 PUD 376ff067 PMD 0 Oops: 0002 [#1] SMP
kmem -i - Show available memory at time of crash
ps - Show running processes at time of crash. Useful with grep
net - Show configured network interfaces at time of crash
Linux Kernel Crash Capture and Analysis
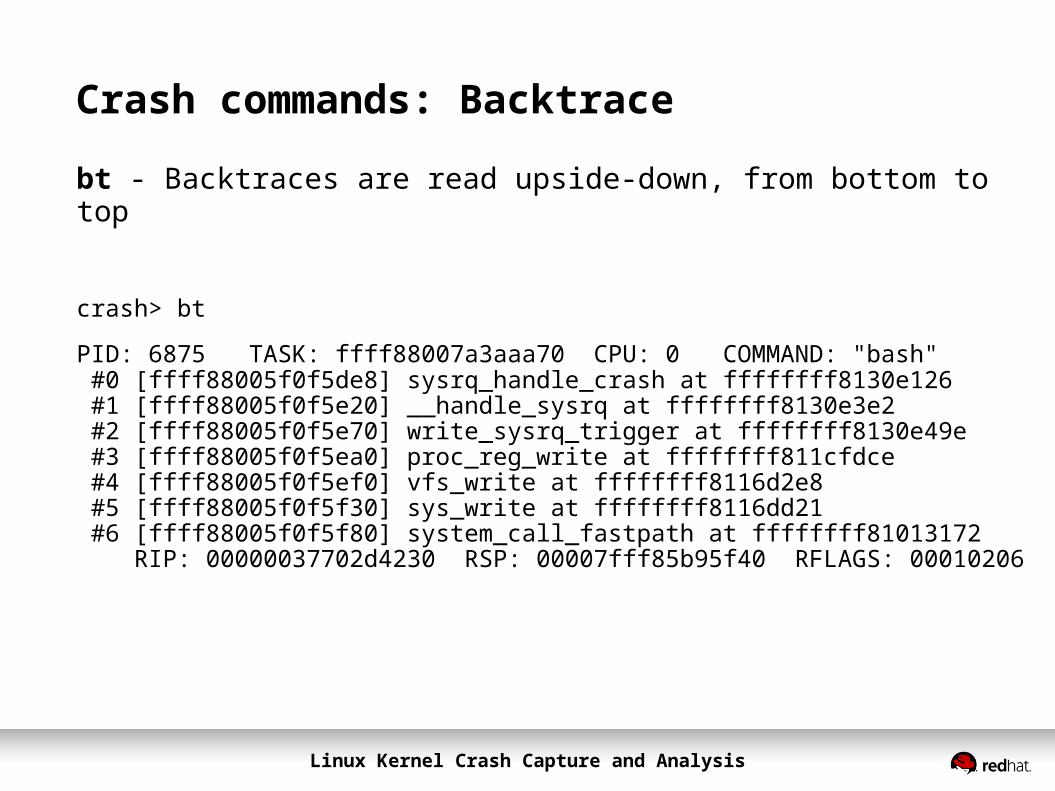
Crash commands: Backtrace
bt - Backtraces are read upside-down, from bottom to top
crash> bt
PID: 6875 TASK: ffff88007a3aaa70 CPU: 0 COMMAND: "bash" #0 [ffff88005f0f5de8] sysrq_handle_crash at ffffffff8130e126 #1 [ffff88005f0f5e20] __handle_sysrq at ffffffff8130e3e2 #2 [ffff88005f0f5e70] write_sysrq_trigger at ffffffff8130e49e #3 [ffff88005f0f5ea0] proc_reg_write at ffffffff811cfdce #4 [ffff88005f0f5ef0] vfs_write at ffffffff8116d2e8 #5 [ffff88005f0f5f30] sys_write at ffffffff8116dd21 #6 [ffff88005f0f5f80] system_call_fastpath at ffffffff81013172 RIP: 00000037702d4230 RSP: 00007fff85b95f40 RFLAGS: 00010206
Linux Kernel Crash Capture and Analysis
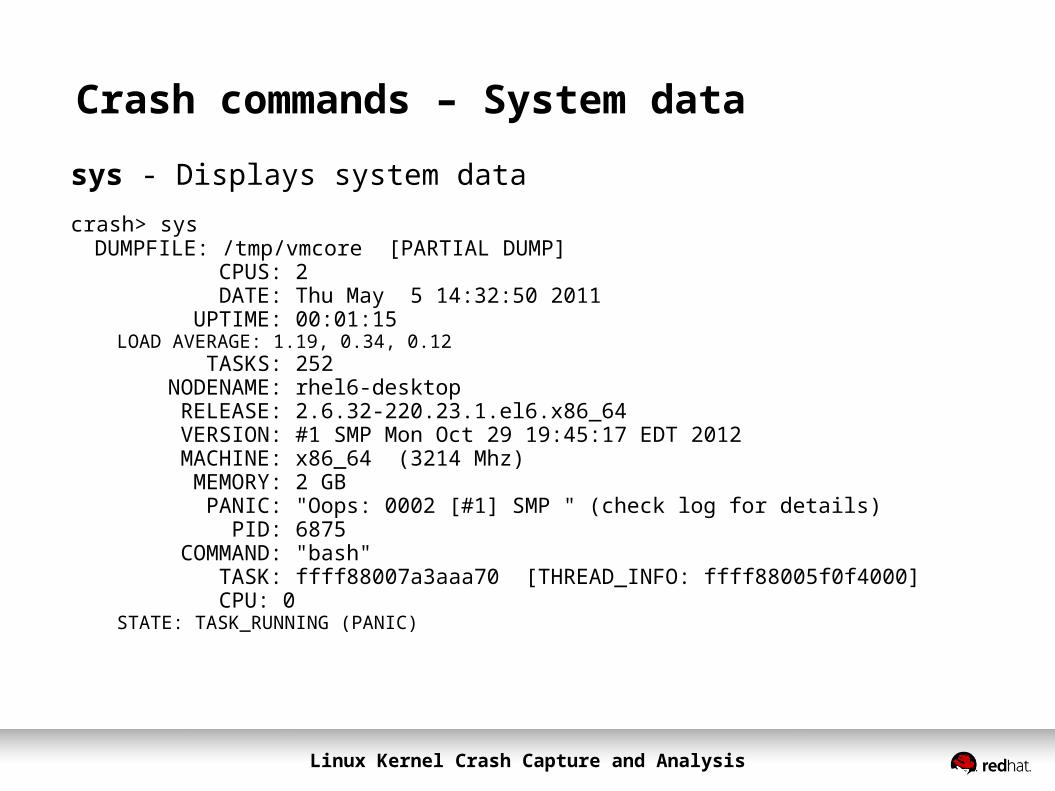
Crash commands – System data
sys - Displays system datacrash> sys DUMPFILE: /tmp/vmcore [PARTIAL DUMP]
CPUS: 2 DATE: Thu May 5 14:32:50 2011 UPTIME: 00:01:15LOAD AVERAGE: 1.19, 0.34, 0.12 TASKS: 252 NODENAME: rhel6-desktop RELEASE: 2.6.32-220.23.1.el6.x86_64 VERSION: #1 SMP Mon Oct 29 19:45:17 EDT 2012 MACHINE: x86_64 (3214 Mhz) MEMORY: 2 GB PANIC: "Oops: 0002 [#1] SMP " (check log for details) PID: 6875 COMMAND: "bash" TASK: ffff88007a3aaa70 [THREAD_INFO: ffff88005f0f4000] CPU: 0STATE: TASK_RUNNING (PANIC)
Linux Kernel Crash Capture and Analysis
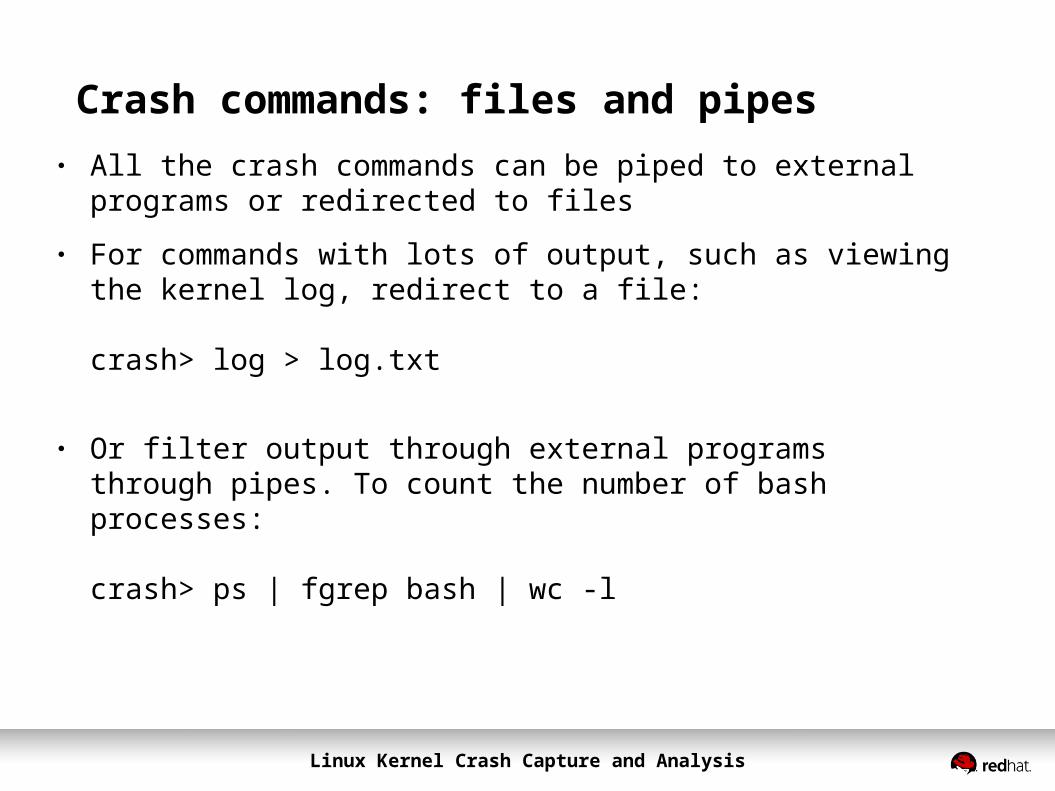
Crash commands: files and pipes● All the crash commands can be piped to external programs or
redirected to files● For commands with lots of output, such as viewing the kernel log,
redirect to a file:
crash> log > log.txt
● Or filter output through external programs through pipes. To count the number of bash processes:
crash> ps | fgrep bash | wc -l
Linux Kernel Crash Capture and Analysis
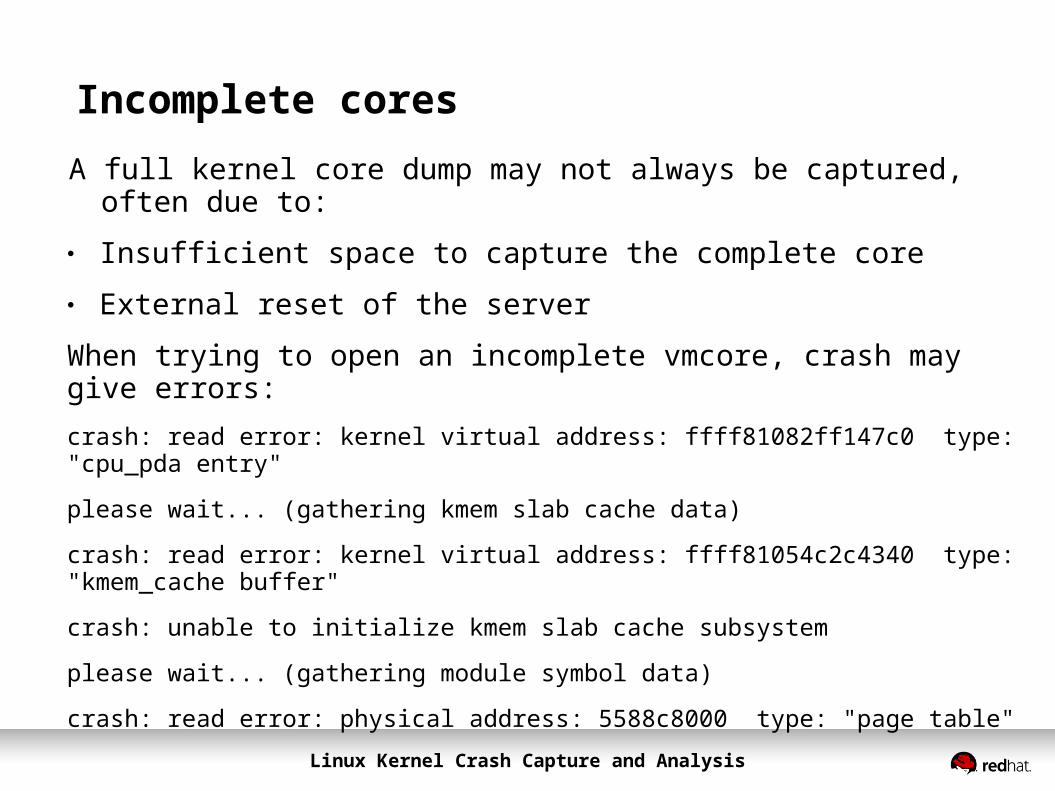
Incomplete coresA full kernel core dump may not always be captured, often due to:● Insufficient space to capture the complete core● External reset of the server
When trying to open an incomplete vmcore, crash may give errors:crash: read error: kernel virtual address: ffff81082ff147c0 type: "cpu_pda entry"
please wait... (gathering kmem slab cache data)
crash: read error: kernel virtual address: ffff81054c2c4340 type: "kmem_cache buffer"
crash: unable to initialize kmem slab cache subsystem
please wait... (gathering module symbol data)
crash: read error: physical address: 5588c8000 type: "page table"
Linux Kernel Crash Capture and Analysis
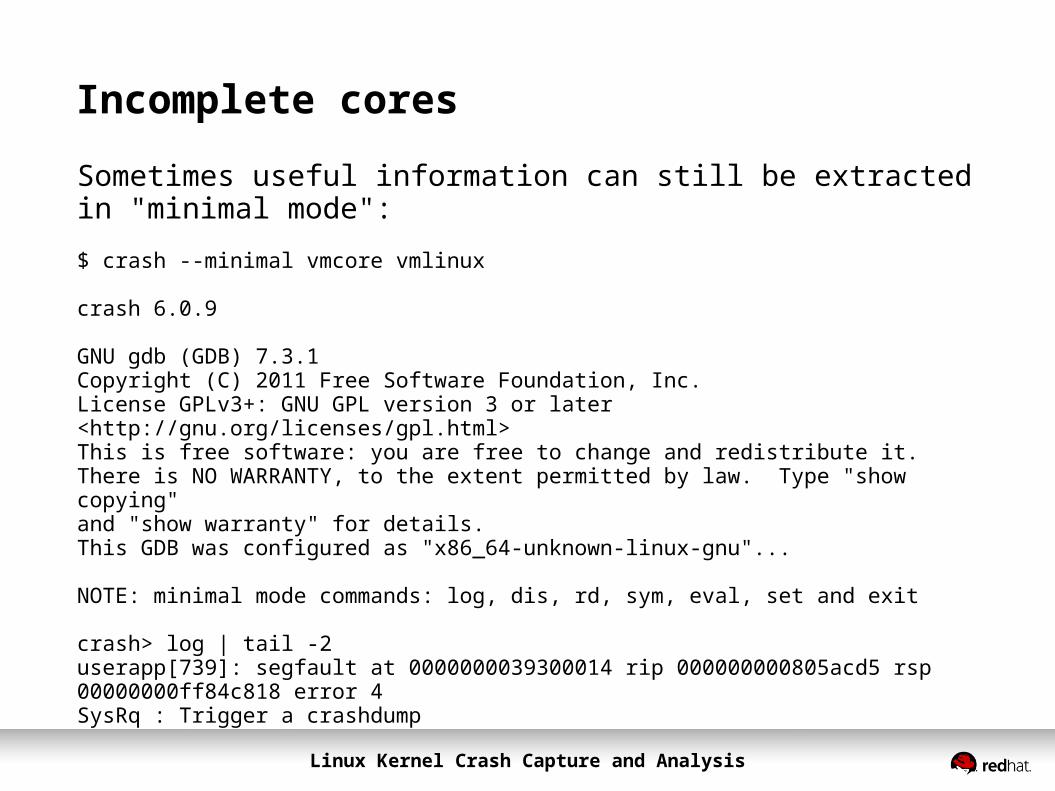
Incomplete cores
Sometimes useful information can still be extracted in "minimal mode":
$ crash --minimal vmcore vmlinux
crash 6.0.9
GNU gdb (GDB) 7.3.1 Copyright (C) 2011 Free Software Foundation, Inc.License GPLv3+: GNU GPL version 3 or later <http://gnu.org/licenses/gpl.html>This is free software: you are free to change and redistribute it.There is NO WARRANTY, to the extent permitted by law. Type "show copying"and "show warranty" for details.This GDB was configured as "x86_64-unknown-linux-gnu"...
NOTE: minimal mode commands: log, dis, rd, sym, eval, set and exit
crash> log | tail -2userapp[739]: segfault at 0000000039300014 rip 000000000805acd5 rsp 00000000ff84c818 error 4SysRq : Trigger a crashdump

Linux Kernel Crash Capture and Analysis
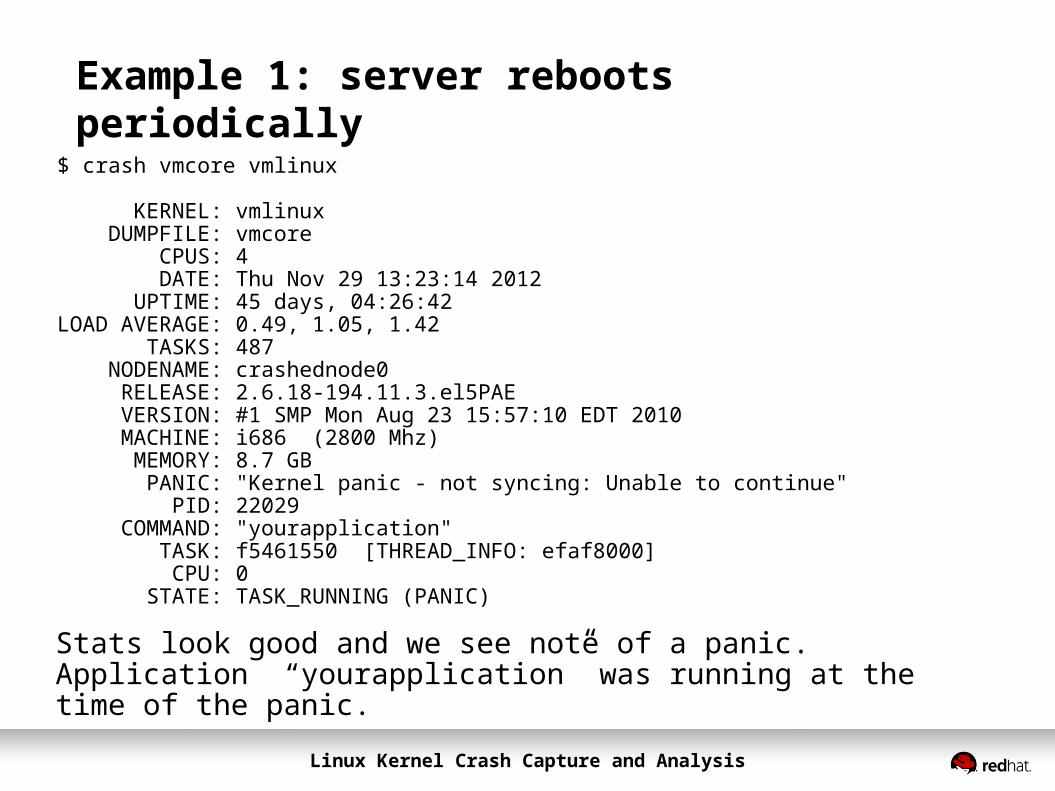
Example 1: server reboots periodically$ crash vmcore vmlinux
KERNEL: vmlinux DUMPFILE: vmcore CPUS: 4 DATE: Thu Nov 29 13:23:14 2012 UPTIME: 45 days, 04:26:42LOAD AVERAGE: 0.49, 1.05, 1.42 TASKS: 487 NODENAME: crashednode0 RELEASE: 2.6.18-194.11.3.el5PAE VERSION: #1 SMP Mon Aug 23 15:57:10 EDT 2010 MACHINE: i686 (2800 Mhz) MEMORY: 8.7 GB PANIC: "Kernel panic - not syncing: Unable to continue" PID: 22029 COMMAND: "yourapplication" TASK: f5461550 [THREAD_INFO: efaf8000] CPU: 0 STATE: TASK_RUNNING (PANIC)
Stats look good and we see note of a panic. Application “yourapplication” was running at the time of the panic.
Linux Kernel Crash Capture and Analysis
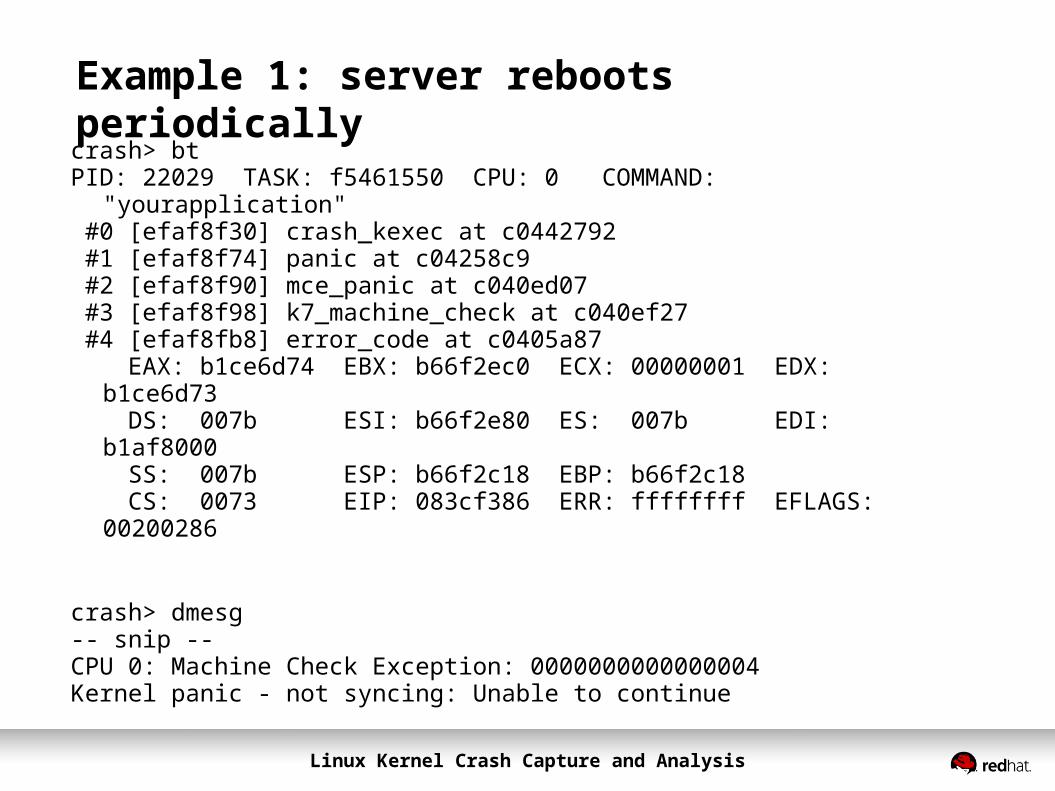
Example 1: server reboots periodicallycrash> btPID: 22029 TASK: f5461550 CPU: 0 COMMAND:
"yourapplication" #0 [efaf8f30] crash_kexec at c0442792 #1 [efaf8f74] panic at c04258c9 #2 [efaf8f90] mce_panic at c040ed07 #3 [efaf8f98] k7_machine_check at c040ef27 #4 [efaf8fb8] error_code at c0405a87 EAX: b1ce6d74 EBX: b66f2ec0 ECX: 00000001 EDX:
b1ce6d73 DS: 007b ESI: b66f2e80 ES: 007b EDI:
b1af8000 SS: 007b ESP: b66f2c18 EBP: b66f2c18 CS: 0073 EIP: 083cf386 ERR: ffffffff EFLAGS:
00200286
crash> dmesg-- snip --CPU 0: Machine Check Exception: 0000000000000004Kernel panic - not syncing: Unable to continue
Linux Kernel Crash Capture and Analysis
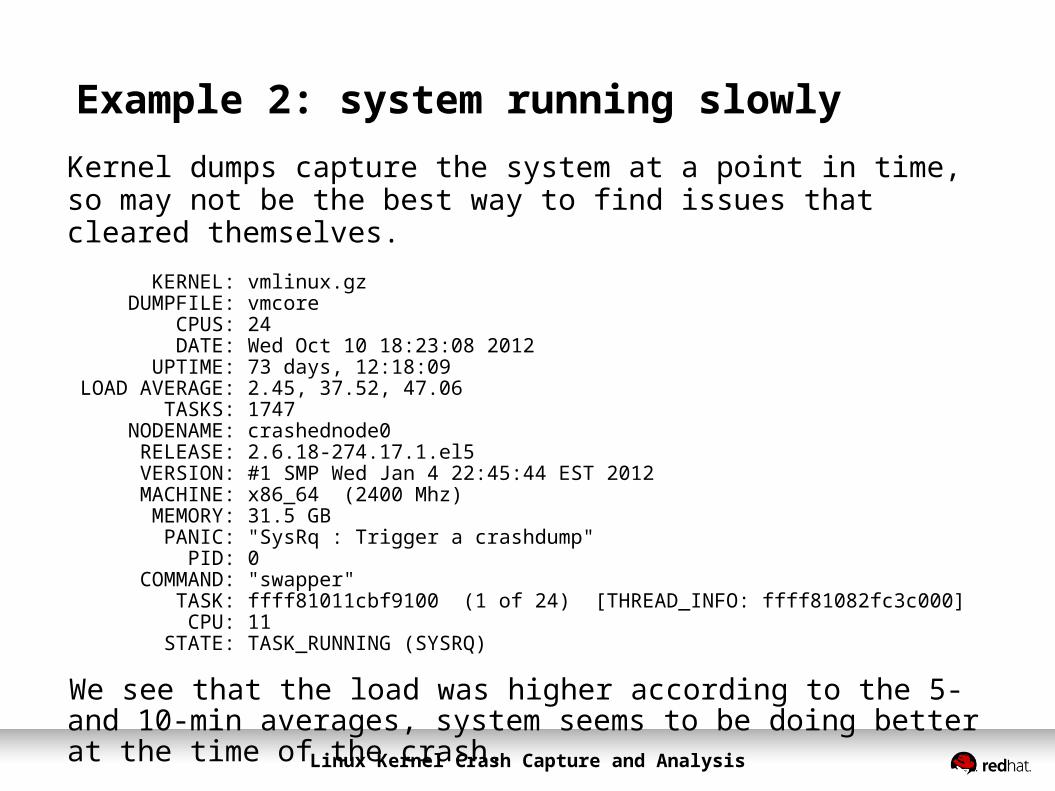
Example 2: system running slowlyKernel dumps capture the system at a point in time, so may not be the best way to find issues that cleared themselves. KERNEL: vmlinux.gz DUMPFILE: vmcore CPUS: 24 DATE: Wed Oct 10 18:23:08 2012 UPTIME: 73 days, 12:18:09LOAD AVERAGE: 2.45, 37.52, 47.06 TASKS: 1747 NODENAME: crashednode0 RELEASE: 2.6.18-274.17.1.el5 VERSION: #1 SMP Wed Jan 4 22:45:44 EST 2012 MACHINE: x86_64 (2400 Mhz) MEMORY: 31.5 GB PANIC: "SysRq : Trigger a crashdump" PID: 0 COMMAND: "swapper" TASK: ffff81011cbf9100 (1 of 24) [THREAD_INFO: ffff81082fc3c000] CPU: 11 STATE: TASK_RUNNING (SYSRQ)
We see that the load was higher according to the 5- and 10-min averages, system seems to be doing better at the time of the crash.
Linux Kernel Crash Capture and Analysis
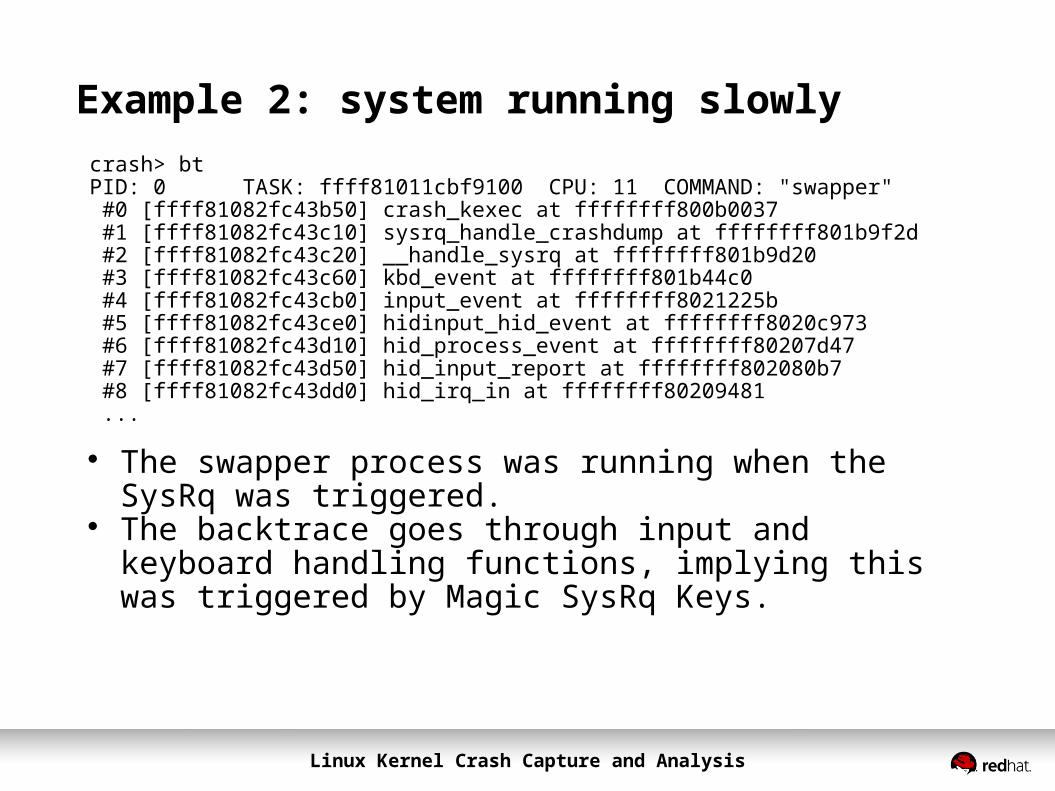
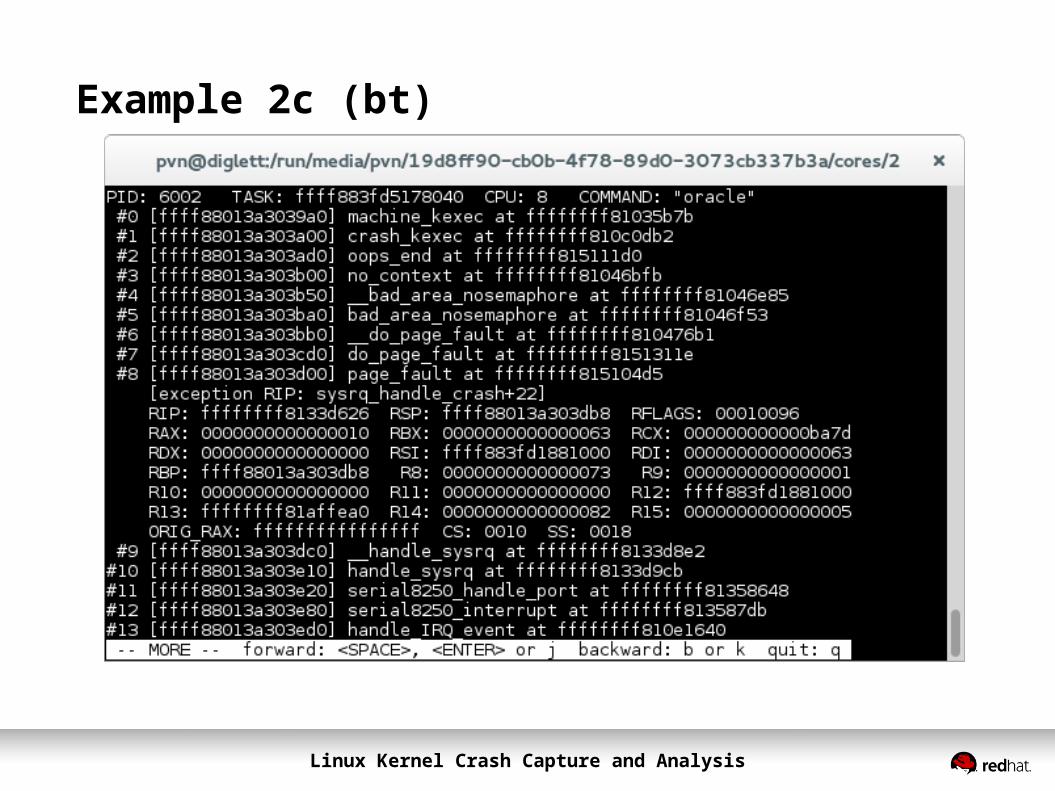
Example 2: system running slowlycrash> btPID: 0 TASK: ffff81011cbf9100 CPU: 11 COMMAND: "swapper" #0 [ffff81082fc43b50] crash_kexec at ffffffff800b0037 #1 [ffff81082fc43c10] sysrq_handle_crashdump at ffffffff801b9f2d #2 [ffff81082fc43c20] __handle_sysrq at ffffffff801b9d20 #3 [ffff81082fc43c60] kbd_event at ffffffff801b44c0 #4 [ffff81082fc43cb0] input_event at ffffffff8021225b #5 [ffff81082fc43ce0] hidinput_hid_event at ffffffff8020c973 #6 [ffff81082fc43d10] hid_process_event at ffffffff80207d47 #7 [ffff81082fc43d50] hid_input_report at ffffffff802080b7 #8 [ffff81082fc43dd0] hid_irq_in at ffffffff80209481 ...
The swapper process was running when the SysRq was triggered.
The backtrace goes through input and keyboard handling functions, implying this was triggered by Magic SysRq Keys.
Linux Kernel Crash Capture and Analysis
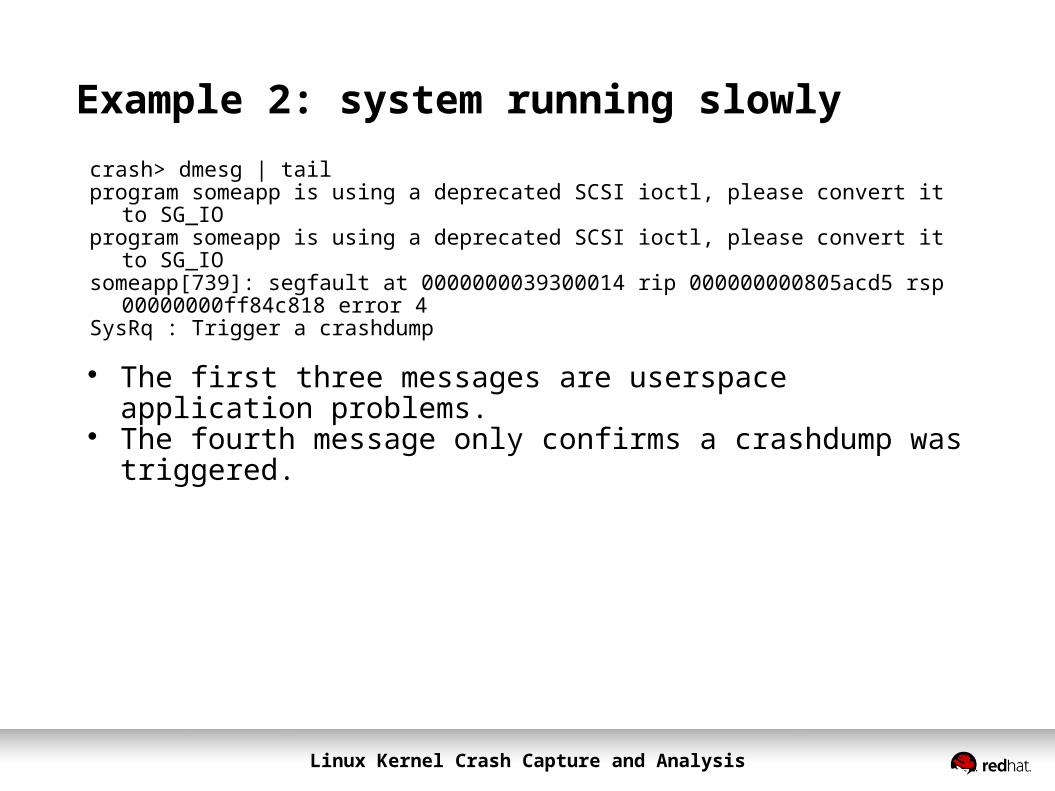
Example 2: system running slowlycrash> dmesg | tailprogram someapp is using a deprecated SCSI ioctl, please convert it
to SG_IOprogram someapp is using a deprecated SCSI ioctl, please convert it
to SG_IOsomeapp[739]: segfault at 0000000039300014 rip 000000000805acd5 rsp
00000000ff84c818 error 4SysRq : Trigger a crashdump
The first three messages are userspace application problems. The fourth message only confirms a crashdump was triggered.
Linux Kernel Crash Capture and Analysis
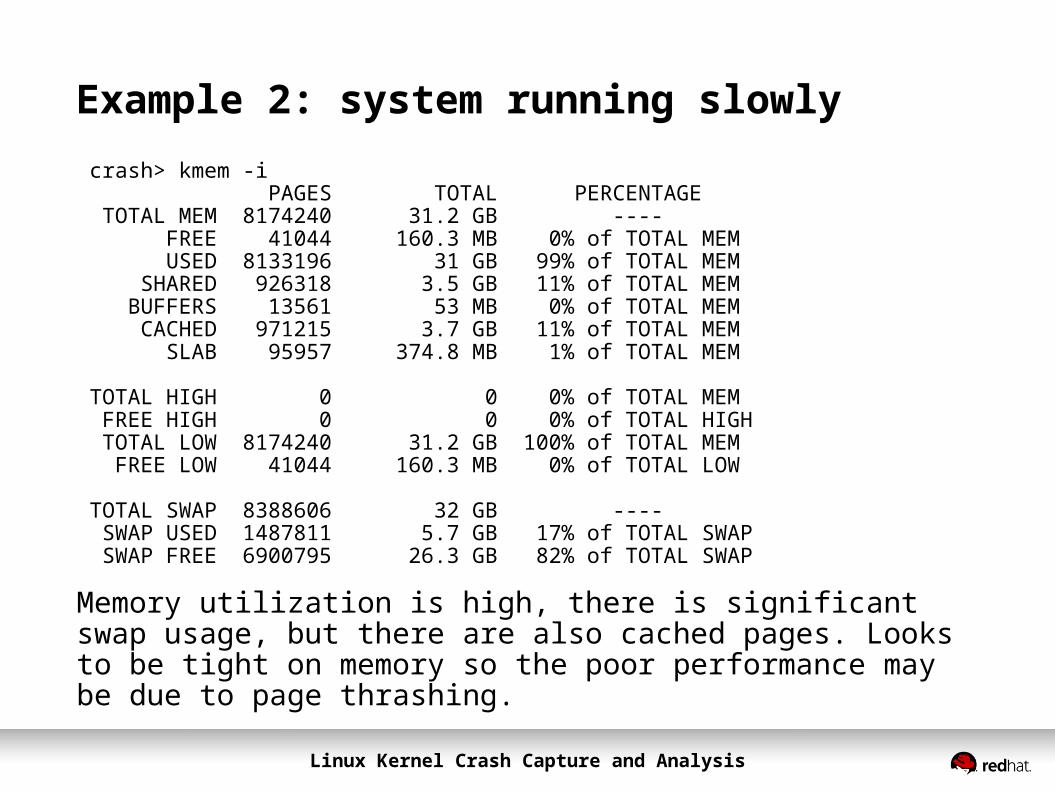
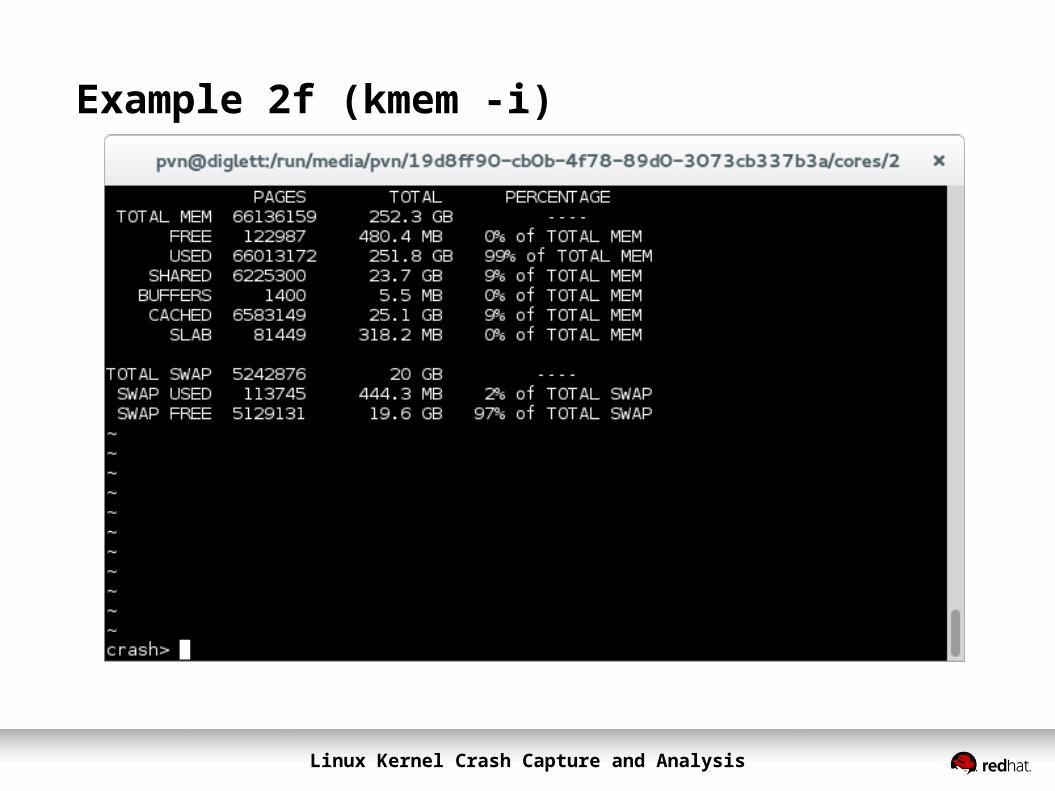
Example 2: system running slowlycrash> kmem -i PAGES TOTAL PERCENTAGE TOTAL MEM 8174240 31.2 GB ---- FREE 41044 160.3 MB 0% of TOTAL MEM USED 8133196 31 GB 99% of TOTAL MEM SHARED 926318 3.5 GB 11% of TOTAL MEM BUFFERS 13561 53 MB 0% of TOTAL MEM CACHED 971215 3.7 GB 11% of TOTAL MEM SLAB 95957 374.8 MB 1% of TOTAL MEM
TOTAL HIGH 0 0 0% of TOTAL MEM FREE HIGH 0 0 0% of TOTAL HIGH TOTAL LOW 8174240 31.2 GB 100% of TOTAL MEM FREE LOW 41044 160.3 MB 0% of TOTAL LOW
TOTAL SWAP 8388606 32 GB ---- SWAP USED 1487811 5.7 GB 17% of TOTAL SWAP SWAP FREE 6900795 26.3 GB 82% of TOTAL SWAP
Memory utilization is high, there is significant swap usage, but there are also cached pages. Looks to be tight on memory so the poor performance may be due to page thrashing.
Linux Kernel Crash Capture and Analysis
Example 2: system running slowly
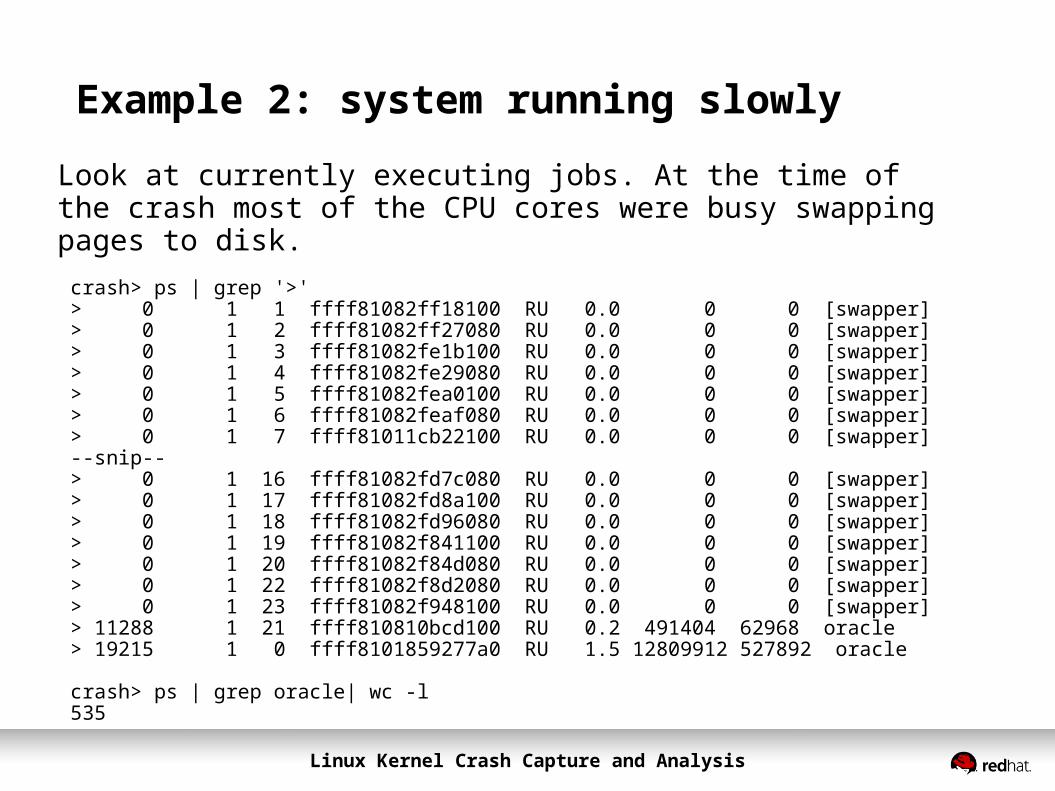
Look at currently executing jobs. At the time of the crash most of the CPU cores were busy swapping pages to disk.crash> ps | grep '>'> 0 1 1 ffff81082ff18100 RU 0.0 0 0 [swapper]> 0 1 2 ffff81082ff27080 RU 0.0 0 0 [swapper]> 0 1 3 ffff81082fe1b100 RU 0.0 0 0 [swapper]> 0 1 4 ffff81082fe29080 RU 0.0 0 0 [swapper]> 0 1 5 ffff81082fea0100 RU 0.0 0 0 [swapper]> 0 1 6 ffff81082feaf080 RU 0.0 0 0 [swapper]> 0 1 7 ffff81011cb22100 RU 0.0 0 0 [swapper]--snip--> 0 1 16 ffff81082fd7c080 RU 0.0 0 0 [swapper]> 0 1 17 ffff81082fd8a100 RU 0.0 0 0 [swapper]> 0 1 18 ffff81082fd96080 RU 0.0 0 0 [swapper]> 0 1 19 ffff81082f841100 RU 0.0 0 0 [swapper]> 0 1 20 ffff81082f84d080 RU 0.0 0 0 [swapper]> 0 1 22 ffff81082f8d2080 RU 0.0 0 0 [swapper]> 0 1 23 ffff81082f948100 RU 0.0 0 0 [swapper]> 11288 1 21 ffff810810bcd100 RU 0.2 491404 62968 oracle> 19215 1 0 ffff8101859277a0 RU 1.5 12809912 527892 oracle
crash> ps | grep oracle| wc -l535
Linux Kernel Crash Capture and Analysis
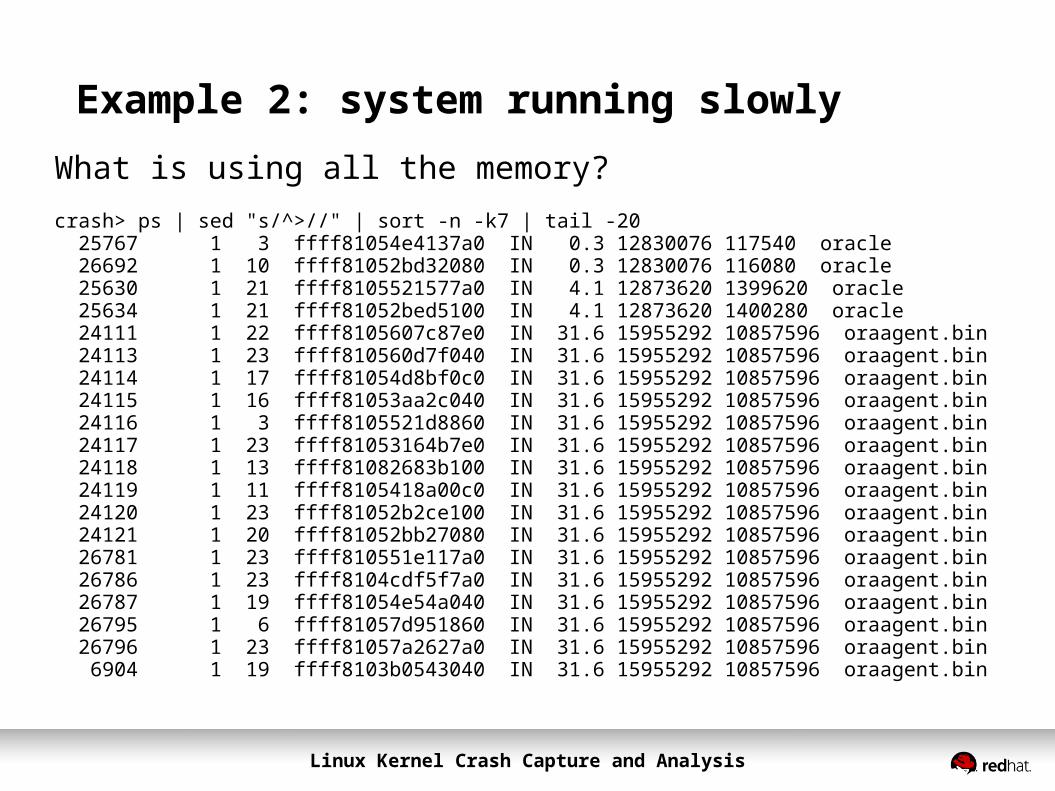
Example 2: system running slowlyWhat is using all the memory?crash> ps | sed "s/^>//" | sort -n -k7 | tail -20 25767 1 3 ffff81054e4137a0 IN 0.3 12830076 117540 oracle 26692 1 10 ffff81052bd32080 IN 0.3 12830076 116080 oracle 25630 1 21 ffff8105521577a0 IN 4.1 12873620 1399620 oracle 25634 1 21 ffff81052bed5100 IN 4.1 12873620 1400280 oracle 24111 1 22 ffff8105607c87e0 IN 31.6 15955292 10857596 oraagent.bin 24113 1 23 ffff810560d7f040 IN 31.6 15955292 10857596 oraagent.bin 24114 1 17 ffff81054d8bf0c0 IN 31.6 15955292 10857596 oraagent.bin 24115 1 16 ffff81053aa2c040 IN 31.6 15955292 10857596 oraagent.bin 24116 1 3 ffff8105521d8860 IN 31.6 15955292 10857596 oraagent.bin 24117 1 23 ffff81053164b7e0 IN 31.6 15955292 10857596 oraagent.bin 24118 1 13 ffff81082683b100 IN 31.6 15955292 10857596 oraagent.bin 24119 1 11 ffff8105418a00c0 IN 31.6 15955292 10857596 oraagent.bin 24120 1 23 ffff81052b2ce100 IN 31.6 15955292 10857596 oraagent.bin 24121 1 20 ffff81052bb27080 IN 31.6 15955292 10857596 oraagent.bin 26781 1 23 ffff810551e117a0 IN 31.6 15955292 10857596 oraagent.bin 26786 1 23 ffff8104cdf5f7a0 IN 31.6 15955292 10857596 oraagent.bin 26787 1 19 ffff81054e54a040 IN 31.6 15955292 10857596 oraagent.bin 26795 1 6 ffff81057d951860 IN 31.6 15955292 10857596 oraagent.bin 26796 1 23 ffff81057a2627a0 IN 31.6 15955292 10857596 oraagent.bin 6904 1 19 ffff8103b0543040 IN 31.6 15955292 10857596 oraagent.bin
Linux Kernel Crash Capture and Analysis
Example 2: system running slowly
Since this was a manually triggered crash, we weren't looking for a bug or hardware fault.
The data available in the vmcore gives us a picture of what was happening on the system.

Linux Kernel Crash Capture and Analysis
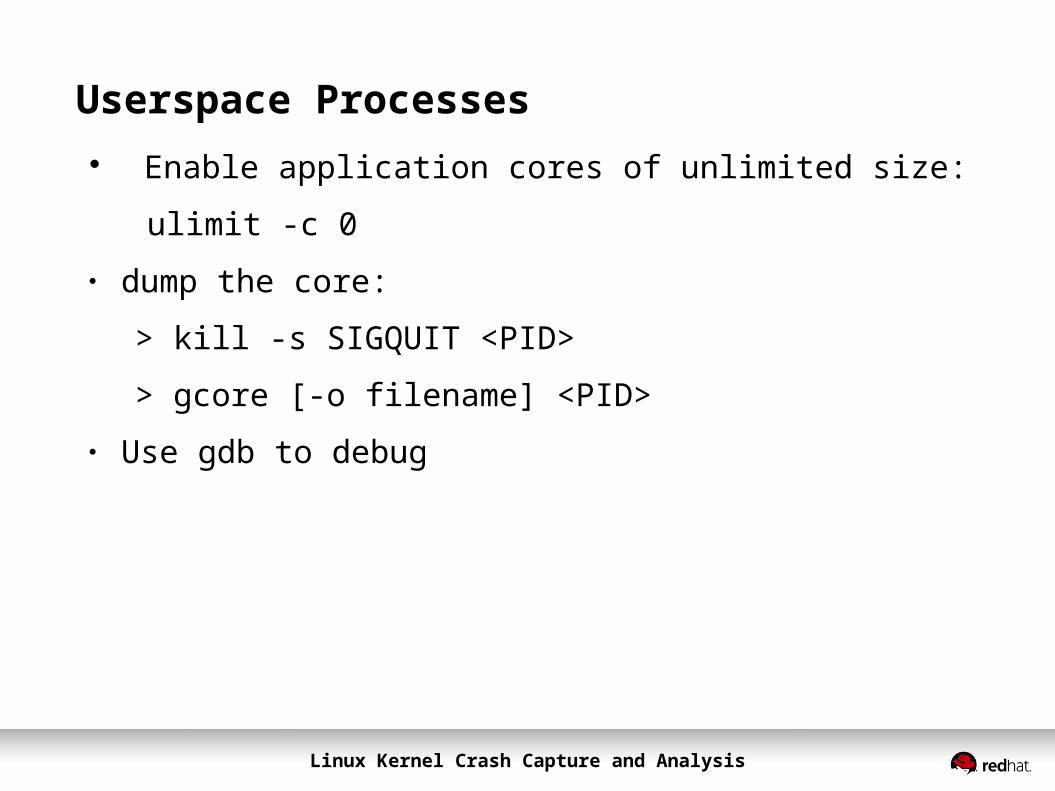
Userspace Processes Enable application cores of unlimited size:
ulimit -c 0● dump the core:
> kill -s SIGQUIT <PID>
> gcore [-o filename] <PID>● Use gdb to debug
Linux Kernel Crash Capture and Analysis
The crashkernel option
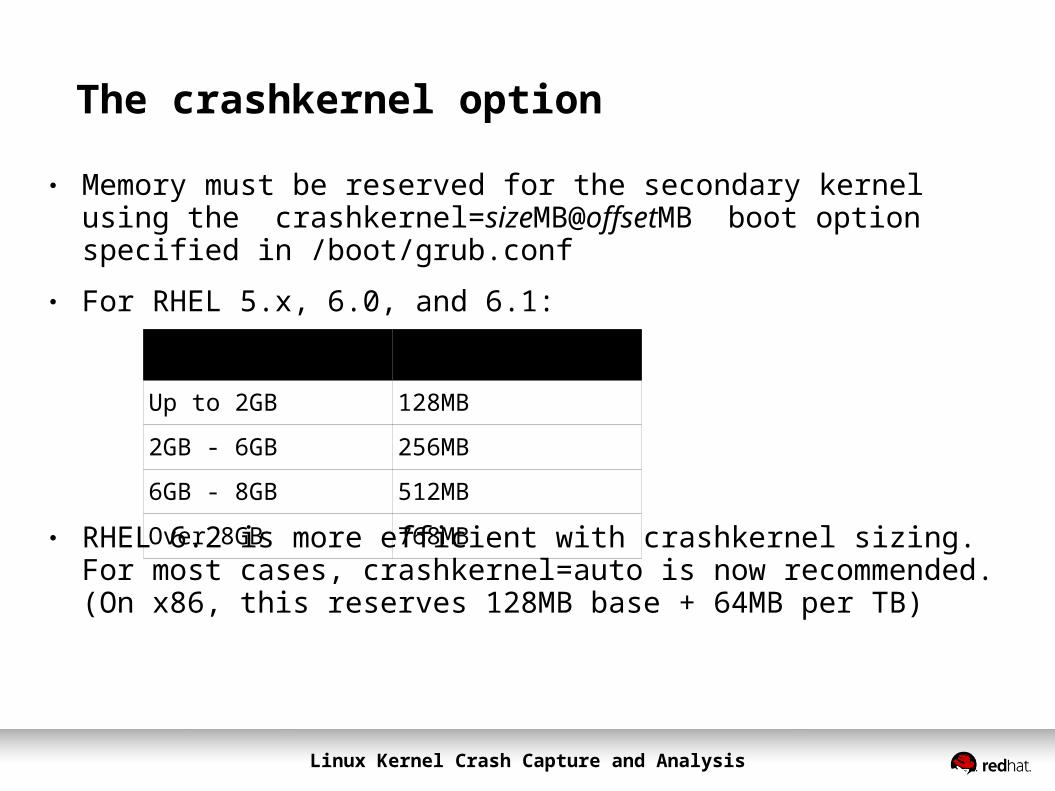
ram size crashkernel parameter
Up to 2GB 128MB2GB - 6GB 256MB6GB - 8GB 512MBOver 8GB 768MB
● Memory must be reserved for the secondary kernel using the crashkernel=sizeMB@offsetMB boot option specified in /boot/grub.conf
● For RHEL 5.x, 6.0, and 6.1:
● RHEL 6.2 is more efficient with crashkernel sizing. For most cases, crashkernel=auto is now recommended. (On x86, this reserves 128MB base + 64MB per TB)
Linux Kernel Crash Capture and Analysis
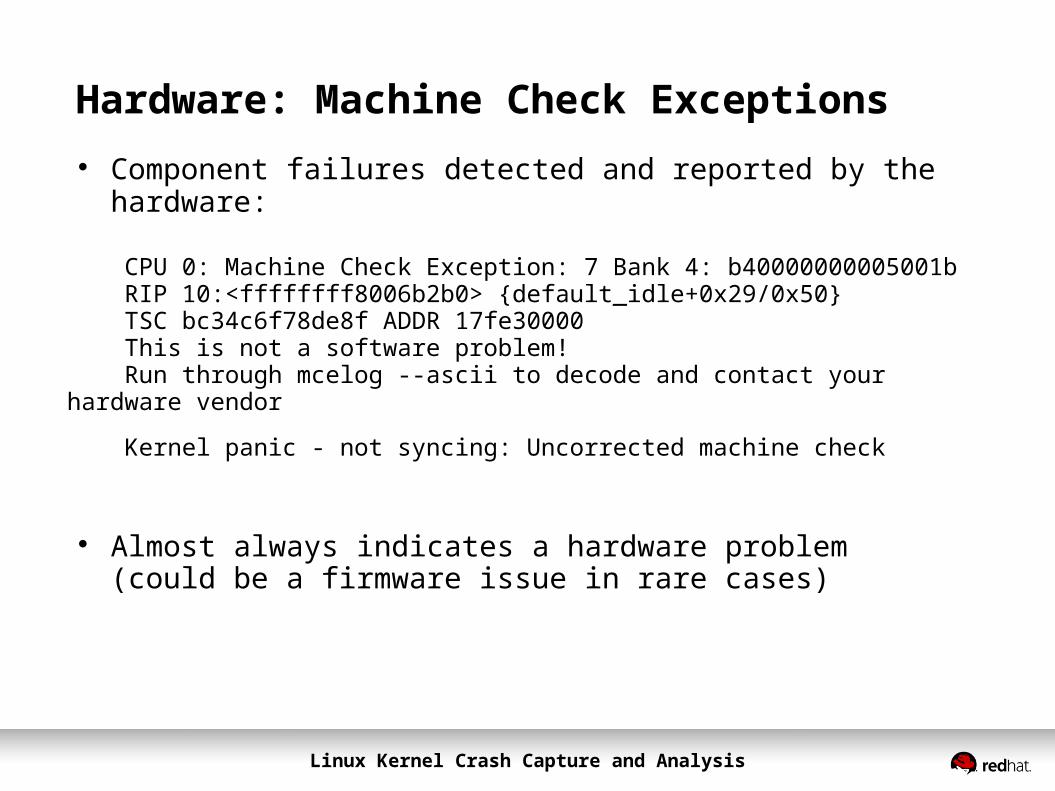
Hardware: Machine Check Exceptions Component failures detected and reported by the hardware:
CPU 0: Machine Check Exception: 7 Bank 4: b40000000005001b RIP 10:<ffffffff8006b2b0> {default_idle+0x29/0x50} TSC bc34c6f78de8f ADDR 17fe30000 This is not a software problem! Run through mcelog --ascii to decode and contact your hardware vendor
Kernel panic - not syncing: Uncorrected machine check
Almost always indicates a hardware problem(could be a firmware issue in rare cases)
Linux Kernel Crash Capture and Analysis
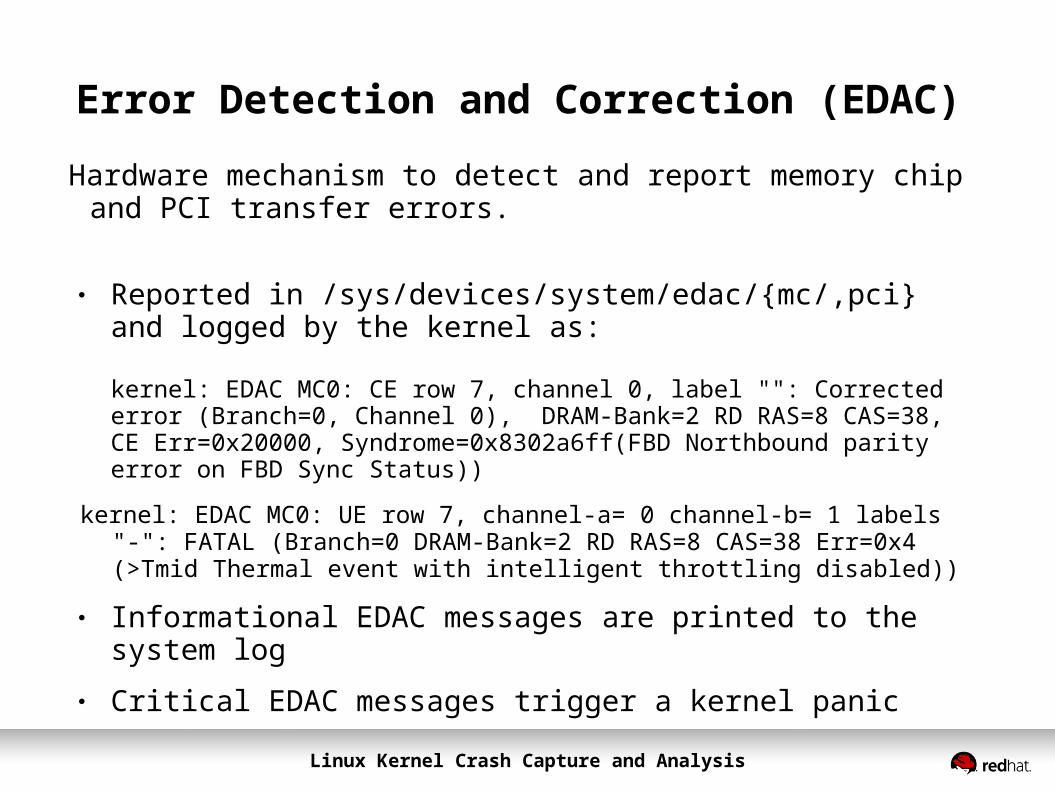
Error Detection and Correction (EDAC)
Hardware mechanism to detect and report memory chip and PCI transfer errors.
● Reported in /sys/devices/system/edac/{mc/,pci} and logged by the kernel as:
kernel: EDAC MC0: CE row 7, channel 0, label "": Corrected error (Branch=0, Channel 0), DRAM-Bank=2 RD RAS=8 CAS=38, CE Err=0x20000, Syndrome=0x8302a6ff(FBD Northbound parity error on FBD Sync Status))
kernel: EDAC MC0: UE row 7, channel-a= 0 channel-b= 1 labels "-": FATAL (Branch=0 DRAM-Bank=2 RD RAS=8 CAS=38 Err=0x4 (>Tmid Thermal event with intelligent throttling disabled))
● Informational EDAC messages are printed to the system log● Critical EDAC messages trigger a kernel panic
Linux Kernel Crash Capture and Analysis
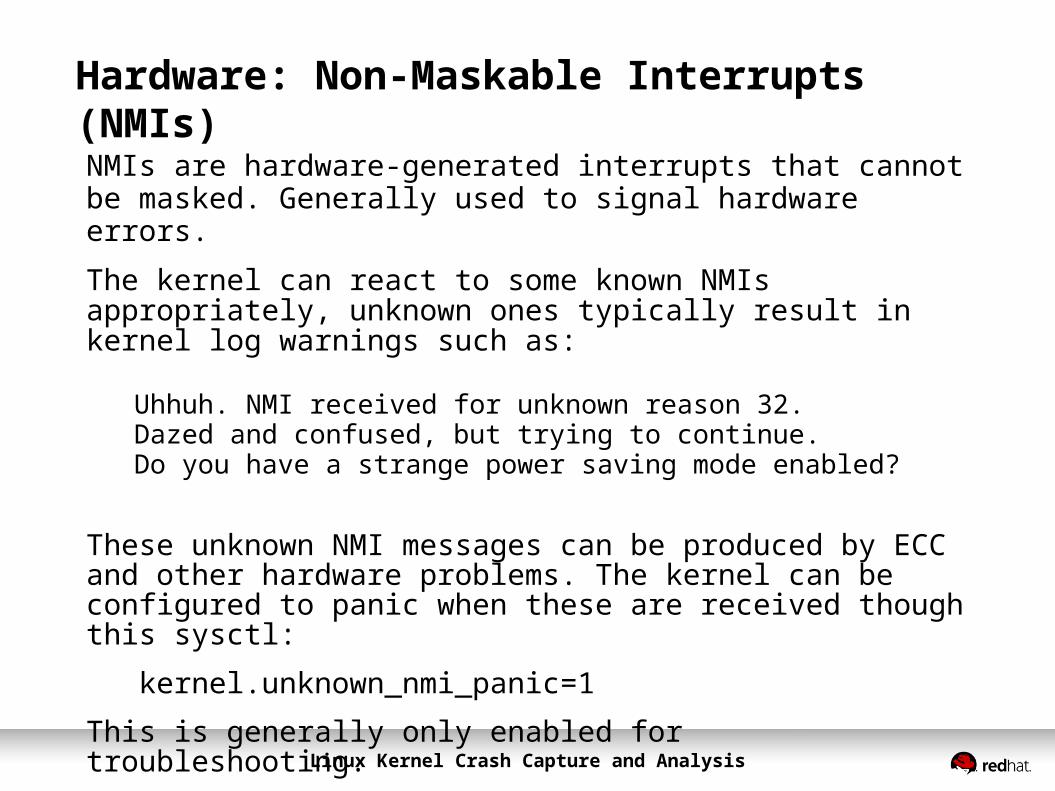
Hardware: Non-Maskable Interrupts (NMIs)NMIs are hardware-generated interrupts that cannot be masked. Generally used to signal hardware errors.
The kernel can react to some known NMIs appropriately, unknown ones typically result in kernel log warnings such as: Uhhuh. NMI received for unknown reason 32. Dazed and confused, but trying to continue. Do you have a strange power saving mode enabled?
These unknown NMI messages can be produced by ECC and other hardware problems. The kernel can be configured to panic when these are received though this sysctl:
kernel.unknown_nmi_panic=1
This is generally only enabled for troubleshooting.
Linux Kernel Crash Capture and Analysis
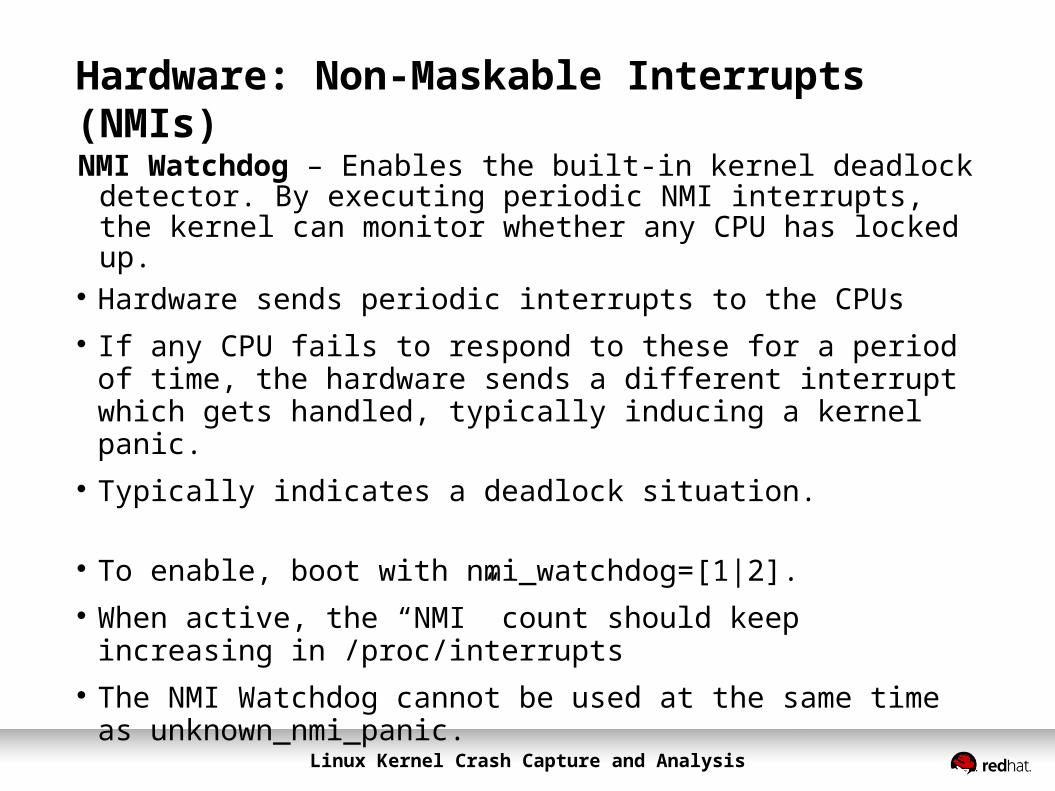
Hardware: Non-Maskable Interrupts (NMIs)NMI Watchdog – Enables the built-in kernel deadlock detector. By
executing periodic NMI interrupts, the kernel can monitor whether any CPU has locked up.
Hardware sends periodic interrupts to the CPUs If any CPU fails to respond to these for a period of time, the
hardware sends a different interrupt which gets handled, typically inducing a kernel panic.
Typically indicates a deadlock situation.
To enable, boot with nmi_watchdog=[1|2]. When active, the “NMI” count should keep increasing in /proc/interrupts
The NMI Watchdog cannot be used at the same time as unknown_nmi_panic.
Linux Kernel Crash Capture and Analysis
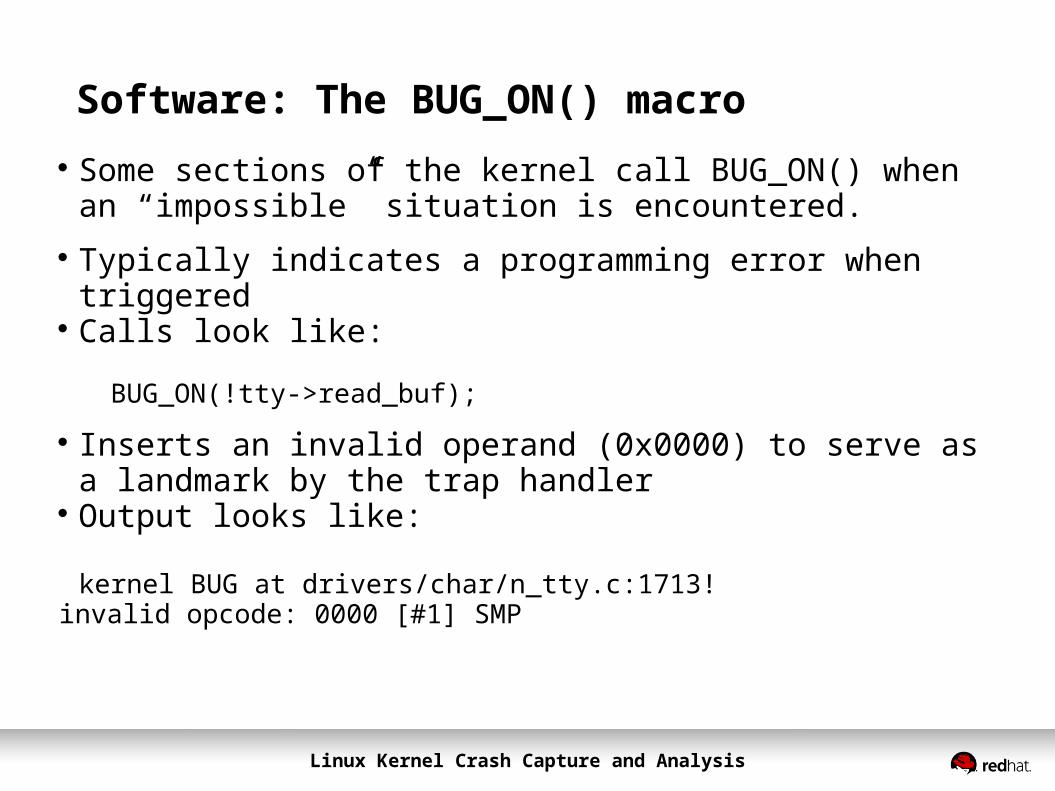
Software: The BUG_ON() macro Some sections of the kernel call BUG_ON() when an
“impossible” situation is encountered. Typically indicates a programming error when triggered Calls look like:
BUG_ON(!tty->read_buf);
Inserts an invalid operand (0x0000) to serve as a landmark by the trap handler
Output looks like:
kernel BUG at drivers/char/n_tty.c:1713!invalid opcode: 0000 [#1] SMP
Linux Kernel Crash Capture and Analysis
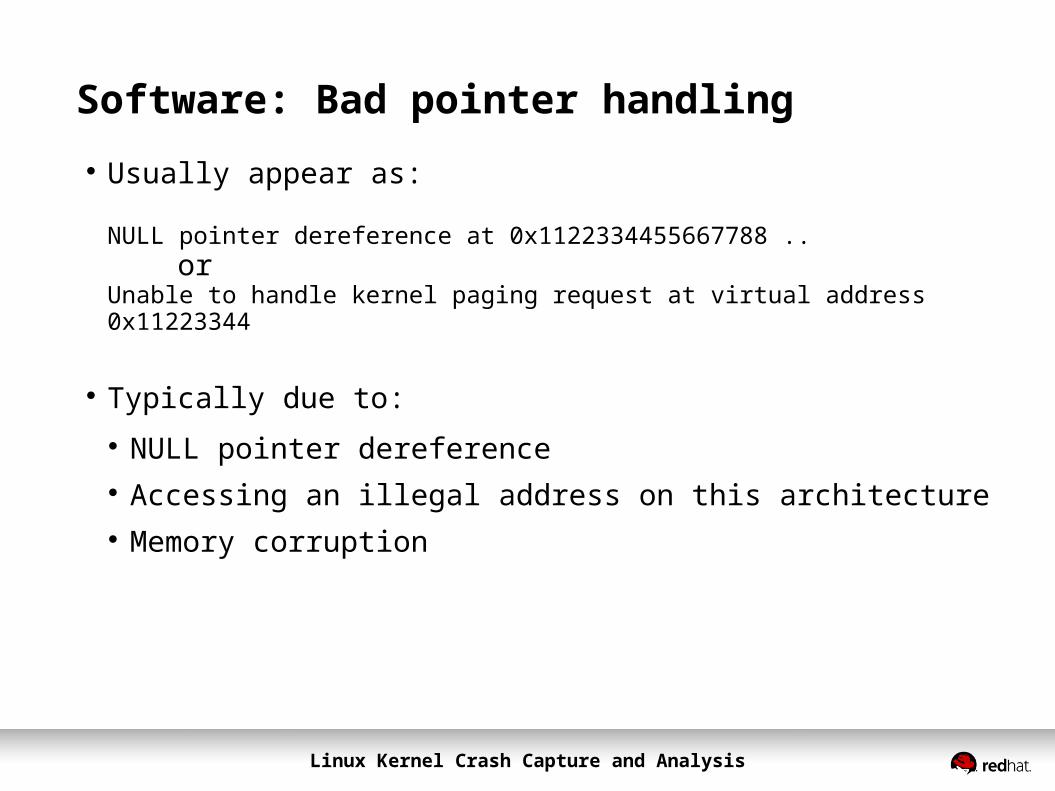
Software: Bad pointer handling Usually appear as:
NULL pointer dereference at 0x1122334455667788 .. or Unable to handle kernel paging request at virtual address 0x11223344
Typically due to: NULL pointer dereference Accessing an illegal address on this architecture Memory corruption
Linux Kernel Crash Capture and Analysis
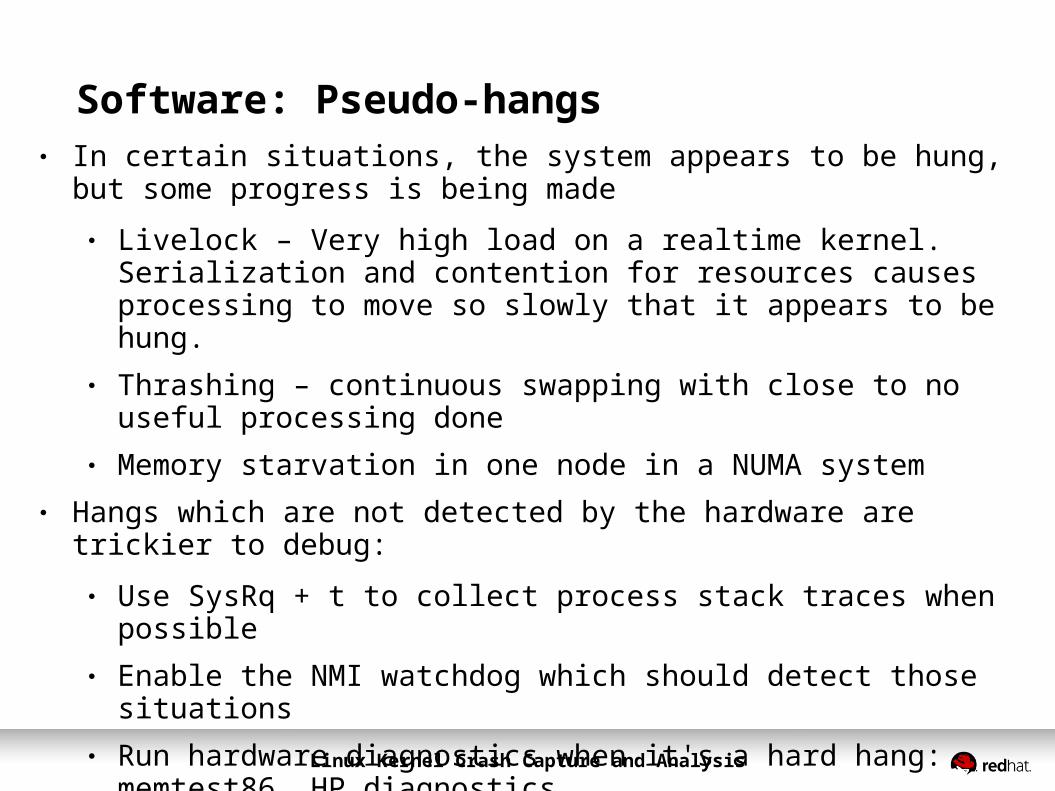
Software: Pseudo-hangs● In certain situations, the system appears to be hung, but some progress
is being made● Livelock – Very high load on a realtime kernel. Serialization and
contention for resources causes processing to move so slowly that it appears to be hung.
● Thrashing – continuous swapping with close to no useful processing done
● Memory starvation in one node in a NUMA system● Hangs which are not detected by the hardware are trickier to debug:
● Use SysRq + t to collect process stack traces when possible● Enable the NMI watchdog which should detect those situations● Run hardware diagnostics when it's a hard hang: memtest86, HP
diagnostics
Linux Kernel Crash Capture and Analysis
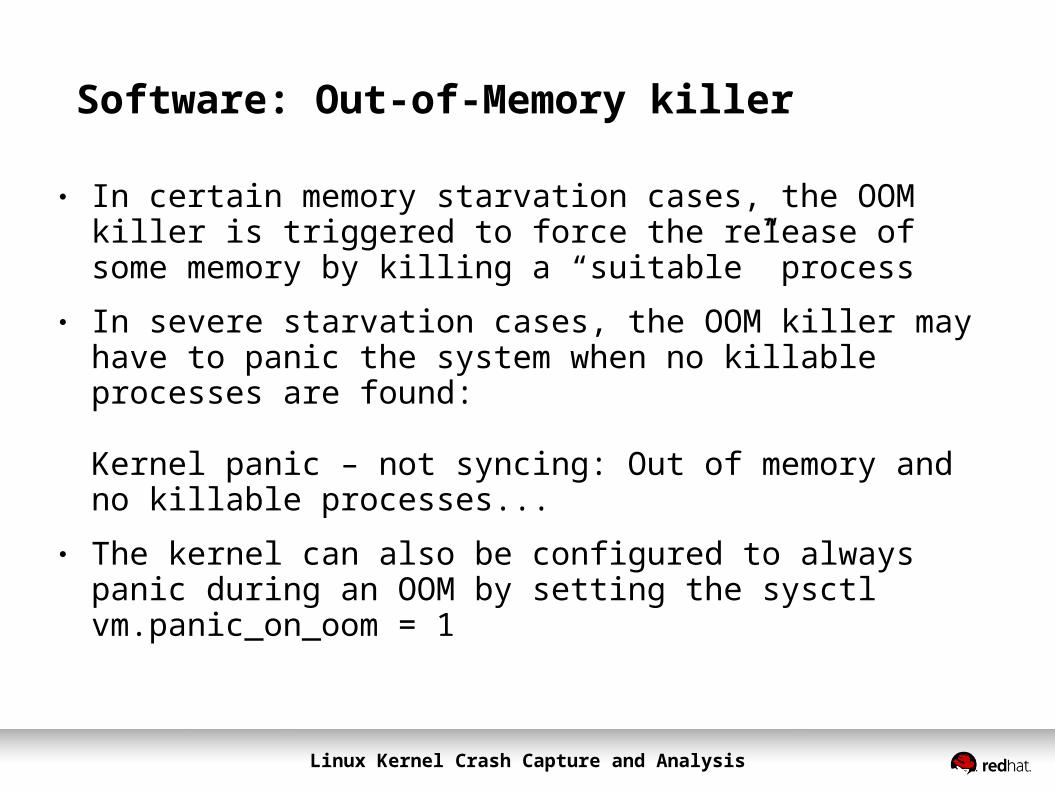
Software: Out-of-Memory killer
● In certain memory starvation cases, the OOM killer is triggered to force the release of some memory by killing a “suitable” process
● In severe starvation cases, the OOM killer may have to panic the system when no killable processes are found:
Kernel panic – not syncing: Out of memory and no killable processes...
● The kernel can also be configured to always panic during an OOM by setting the sysctl vm.panic_on_oom = 1
Linux Kernel Crash Capture and Analysis
Other Troubleshooting Tools
•sysstat – capture system activity over time
•Ksar – visualize sysstat output
•gdb – application core dumps
•strace – kernel/user space debugging
•SystemTap – instrument a running kernel
Linux Kernel Crash Capture and Analysis
Best Practices for getting help
•Is system tainted? Try to reproduce in an untainted configuration, if possible.(https://access.redhat.com/knowledge/solutions/40594)
• After a crash, capture a sosreport, and supply both the sosreport and the vmcore to GSS.(https://access.redhat.com/knowledge/solutions/3592)
• Don’t attach vmcores to cases, upload them to Red Hat’s FTP dropbox instead.(https://access.redhat.com/knowledge/solutions/2112)

Linux Kernel Crash Capture and Analysis
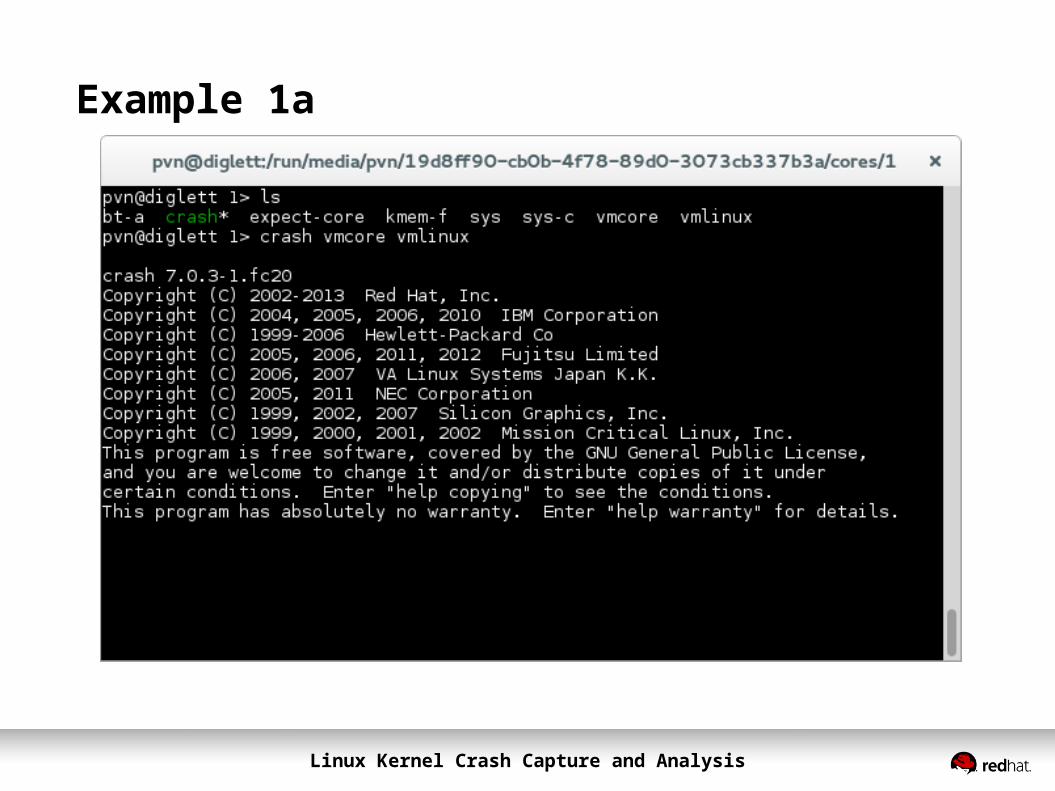
Example 1a
Linux Kernel Crash Capture and Analysis
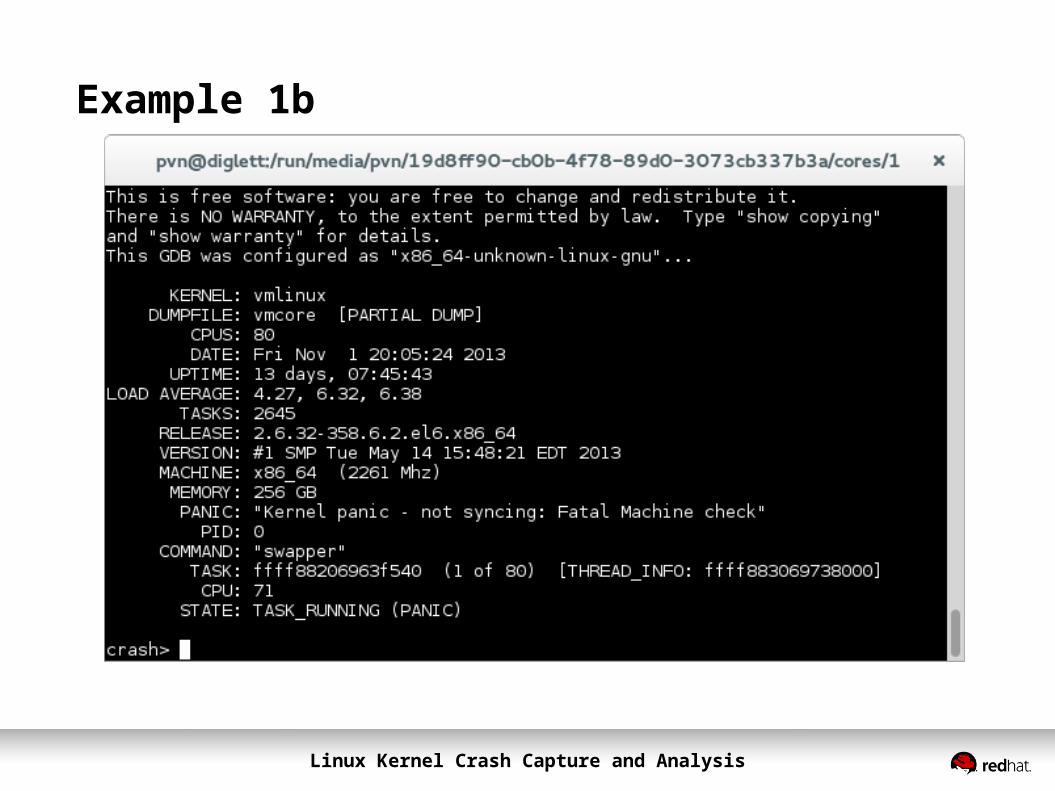
Example 1b
Linux Kernel Crash Capture and Analysis
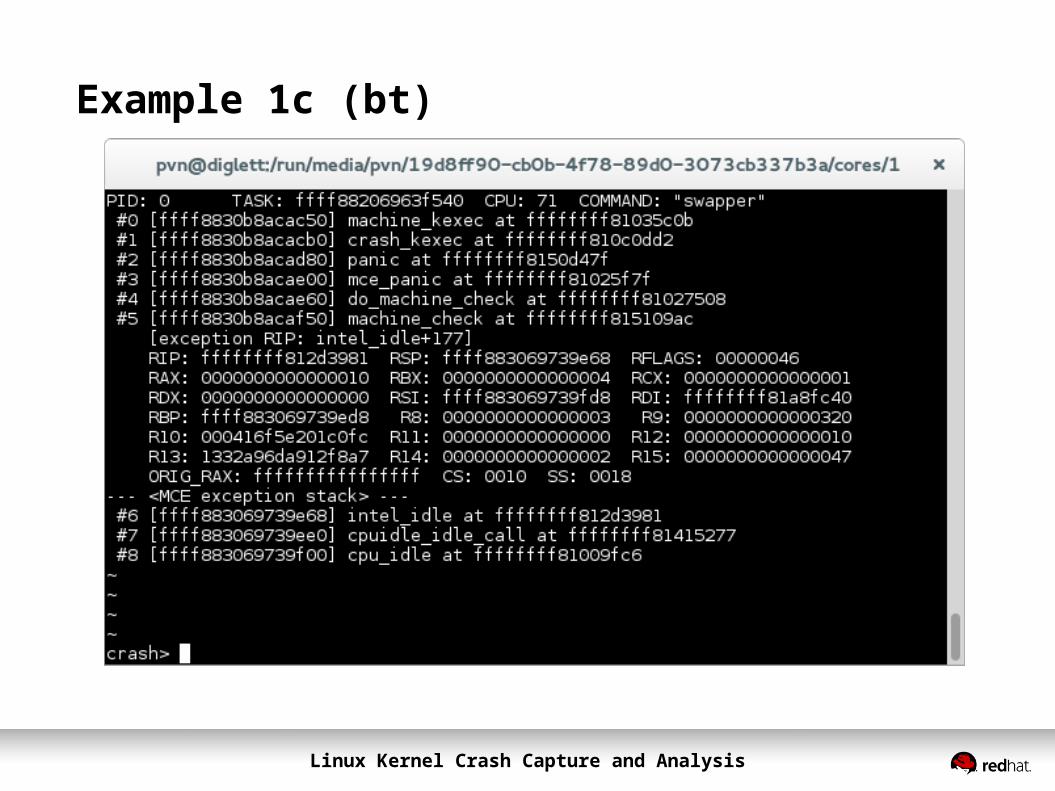
Example 1c (bt)
Linux Kernel Crash Capture and Analysis
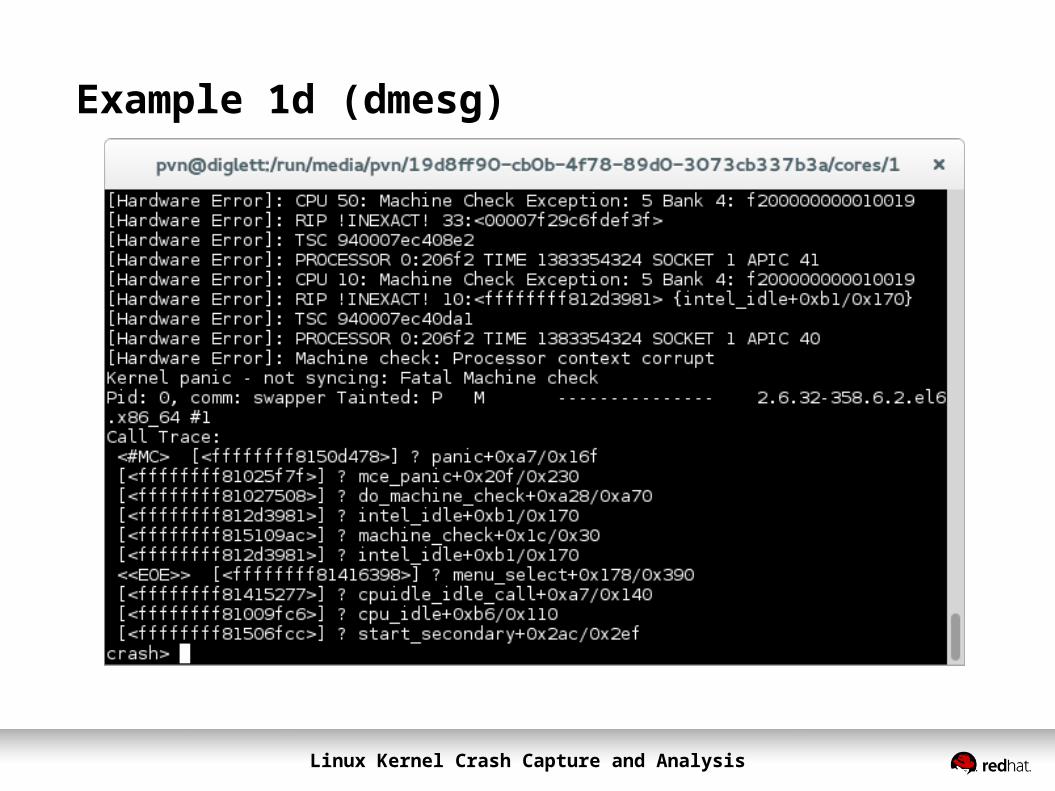
Example 1d (dmesg)
Linux Kernel Crash Capture and Analysis
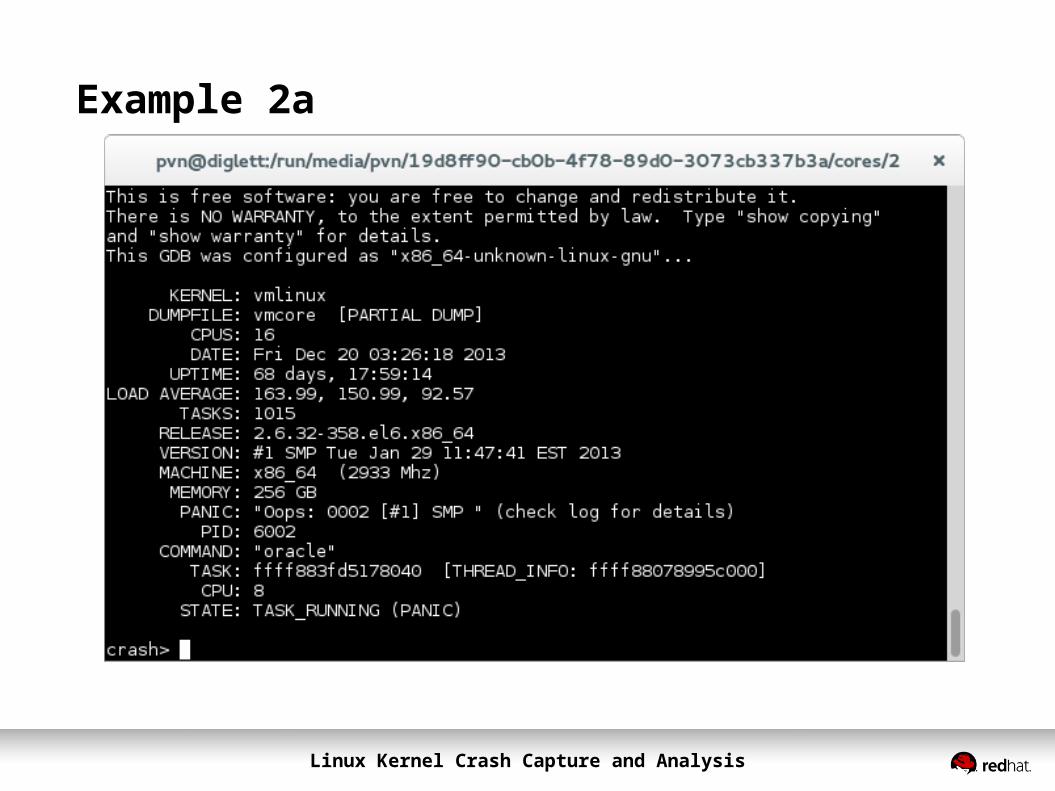
Example 2a
Linux Kernel Crash Capture and Analysis
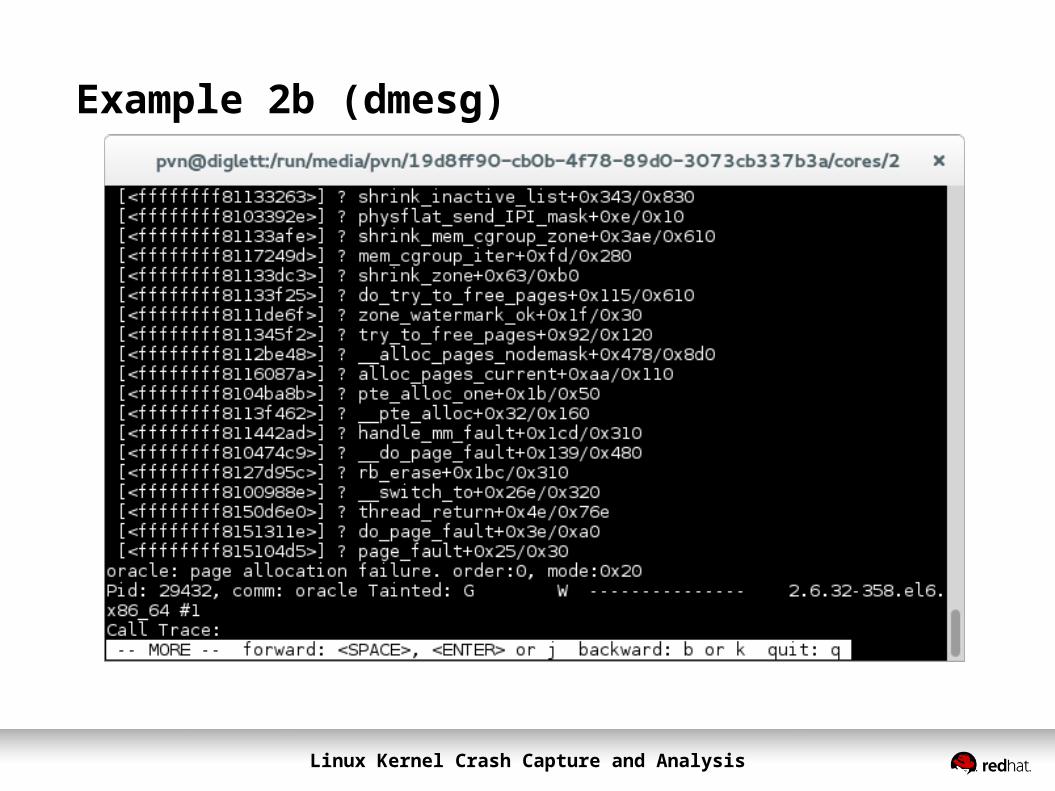
Example 2b (dmesg)
Linux Kernel Crash Capture and Analysis
Example 2c (bt)
Linux Kernel Crash Capture and Analysis
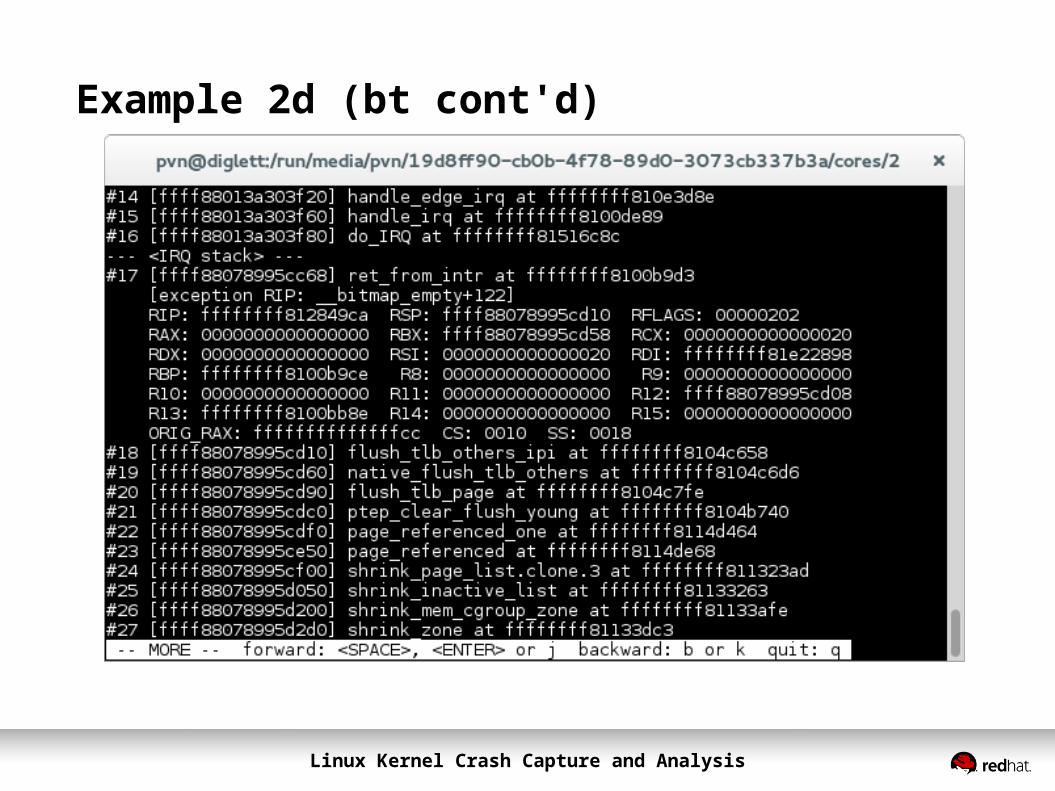
Example 2d (bt cont'd)
Linux Kernel Crash Capture and Analysis
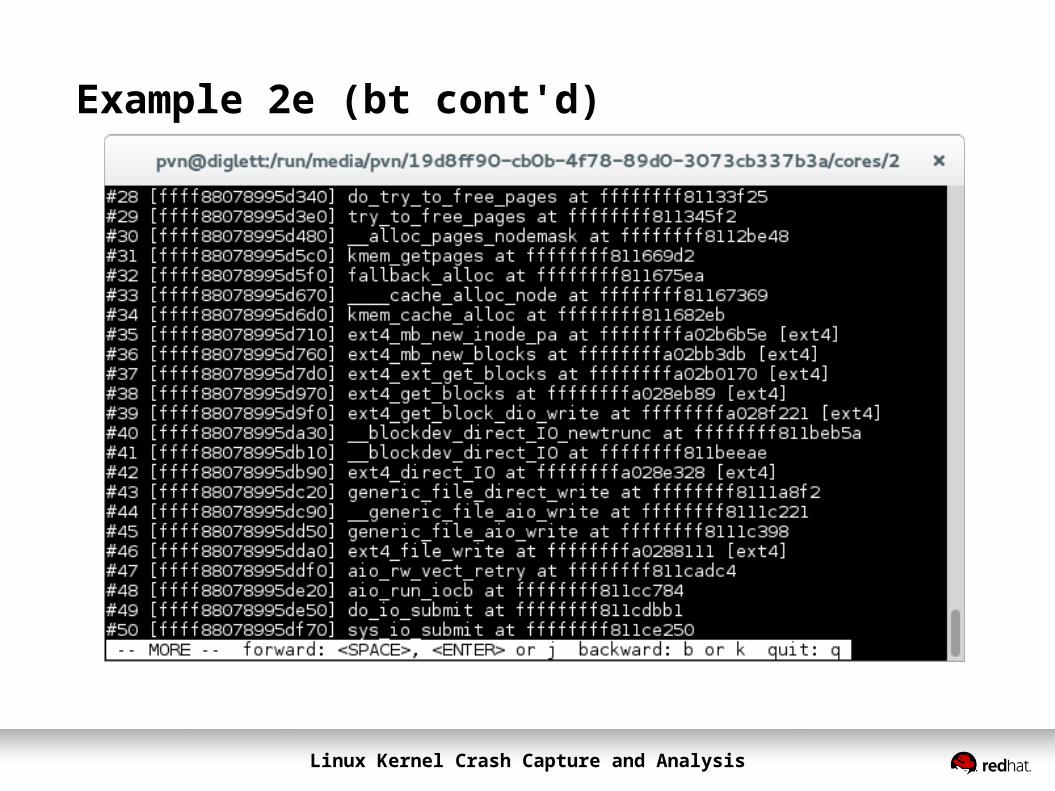
Example 2e (bt cont'd)
Linux Kernel Crash Capture and Analysis
Example 2f (kmem -i)
Linux Kernel Crash Capture and Analysis
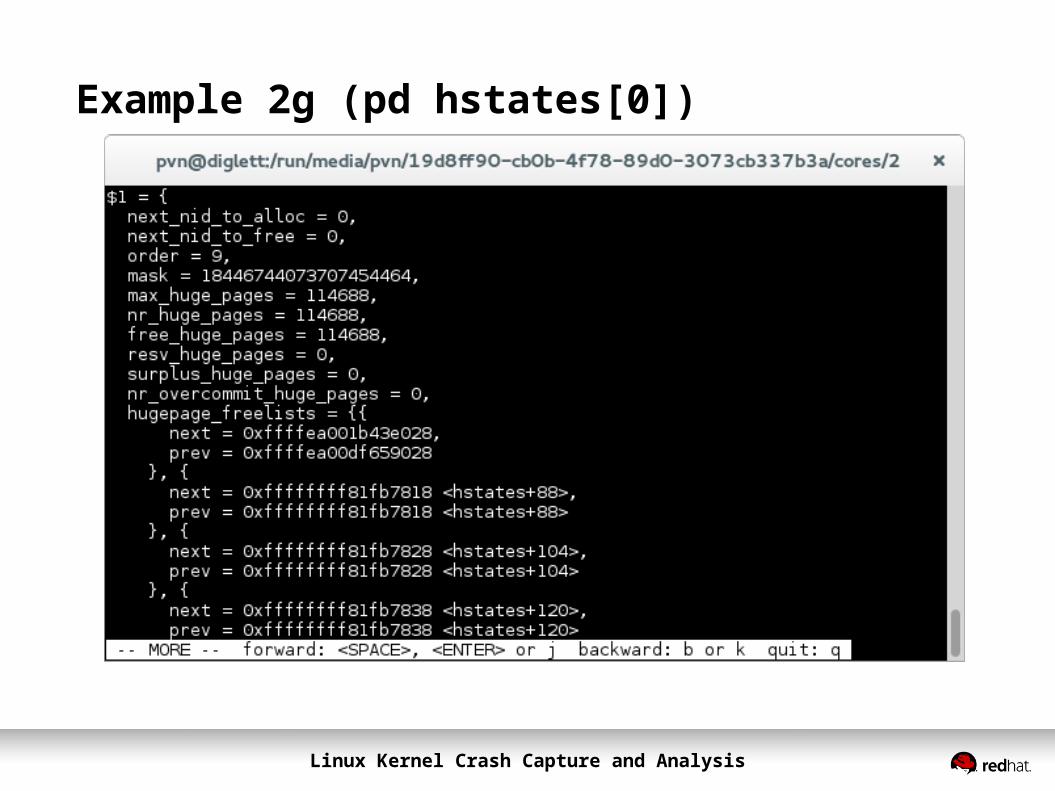
Example 2g (pd hstates[0])
Linux Kernel Crash Capture and Analysis
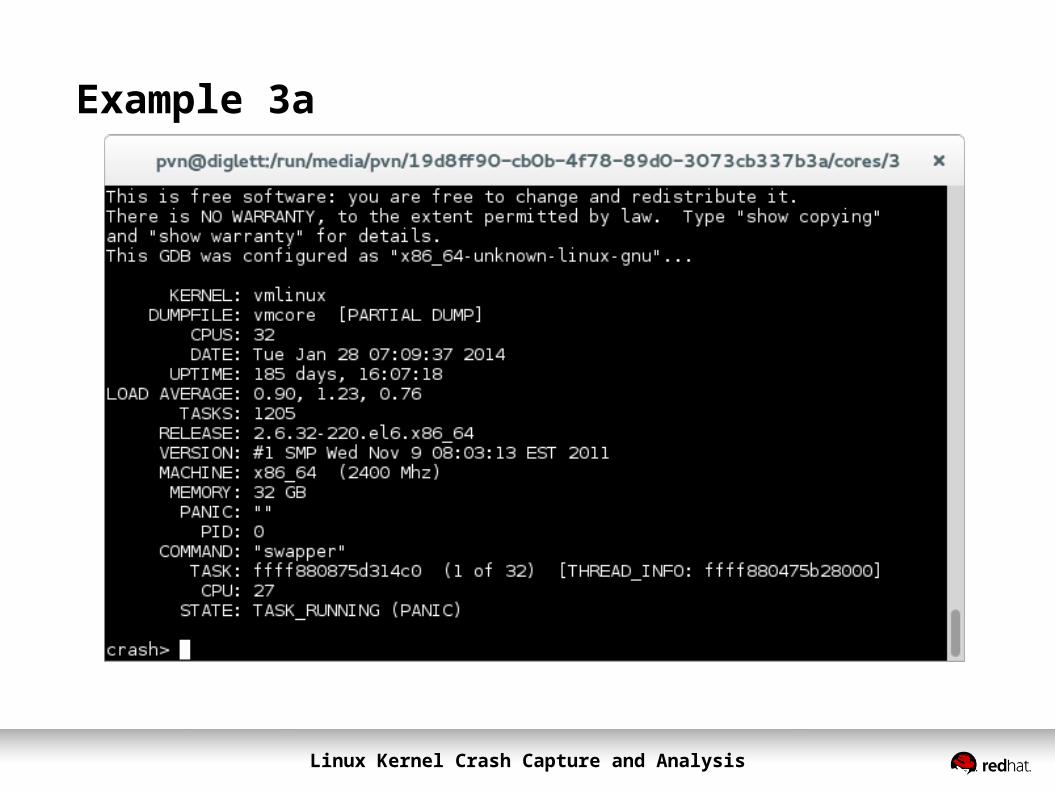
Example 3a
Linux Kernel Crash Capture and Analysis
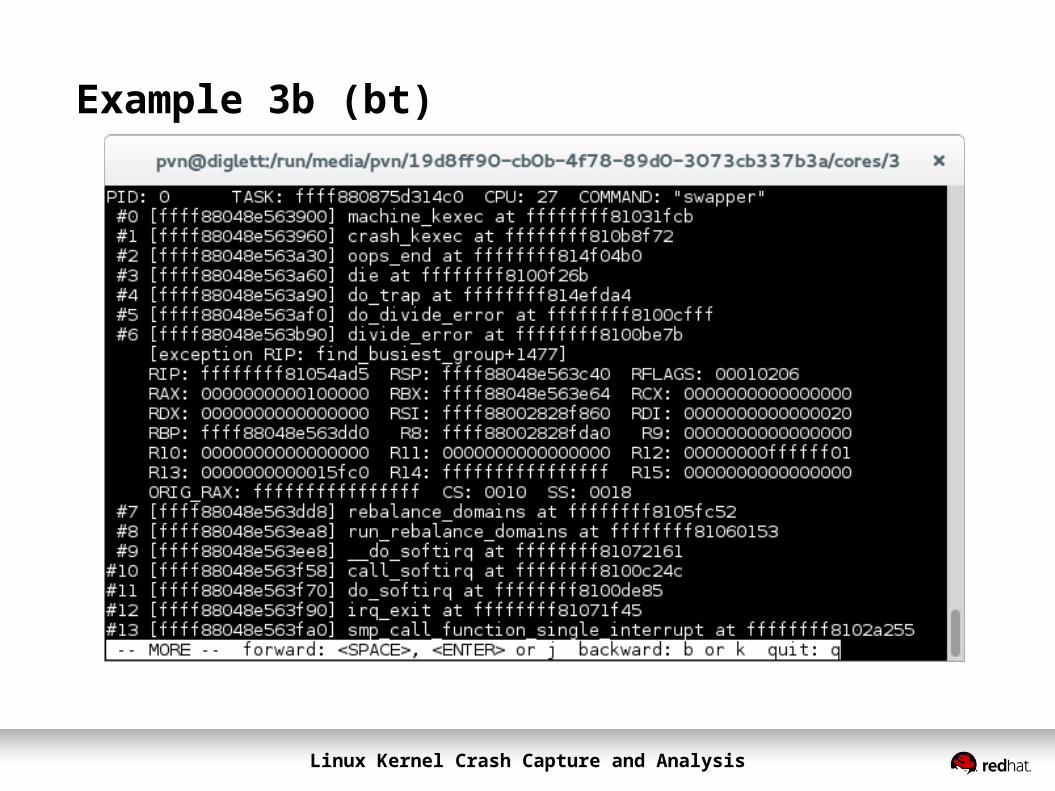
Example 3b (bt)
Linux Kernel Crash Capture and Analysis
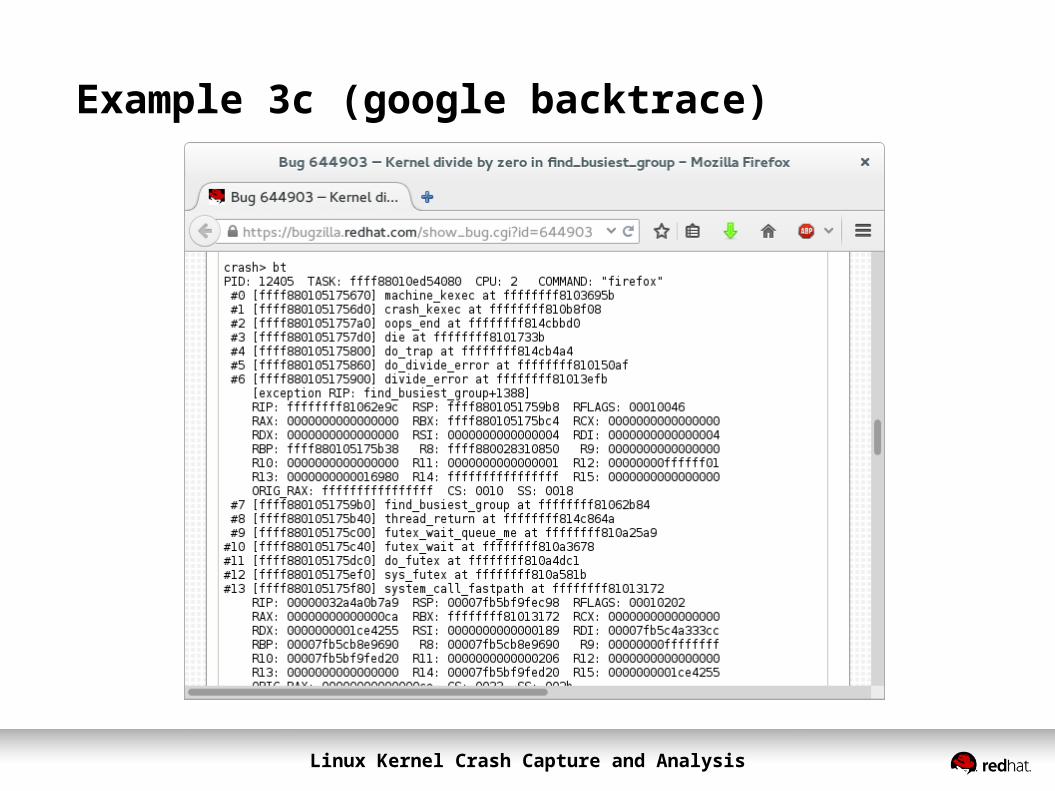
Example 3c (google backtrace)
Linux Kernel Crash Capture and Analysis
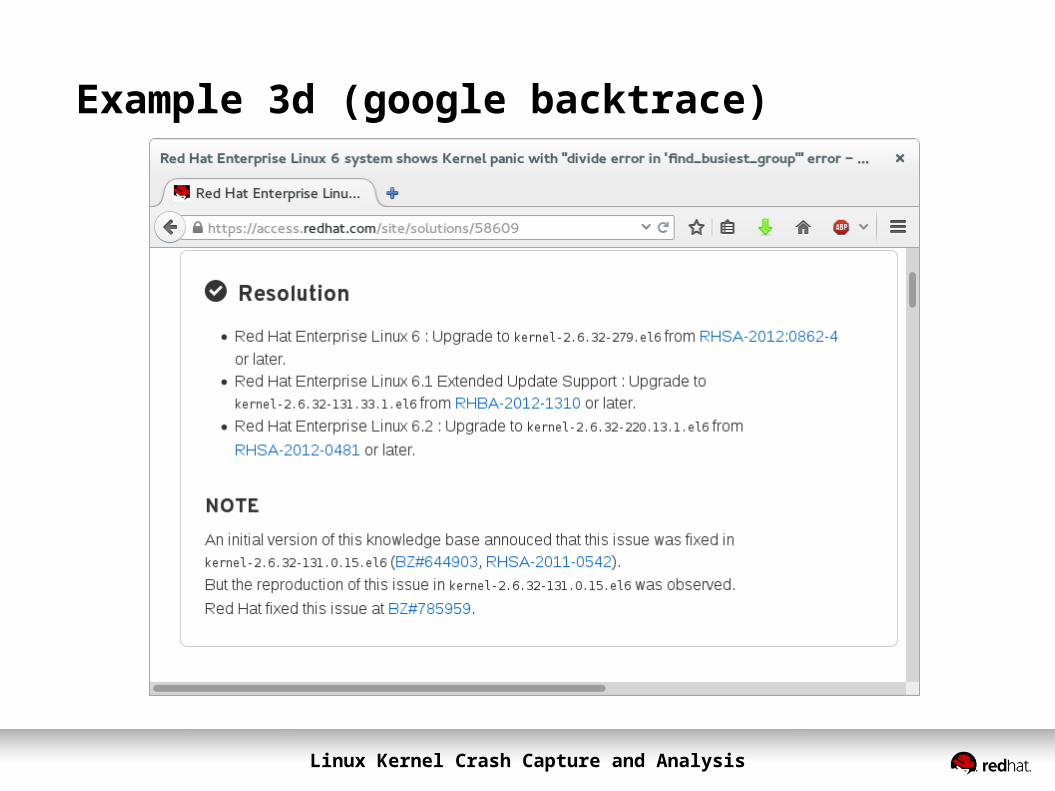
Example 3d (google backtrace)