linton glo al initiative ommitment portfolio analysis · as of september 2014 linton glo al...
TRANSCRIPT
As of September 2014
CLINTON GLOBAL INITIATIVE
COMMITMENT PORTFOLIO ANALYSIS
2005 – 2013
2
OVERVIEW OF CGI’S PORTFOLIO ANALYSIS
As we come together at the Annual Meeting for the tenth time and reimagine our impact going forward, it’s
imperative that we evaluate what’s worked, what hasn’t, and what remains to be done. By examining the
progress made to date, we all can be more efficient and effective in the years to come.
We started by taking stock of all the work that’s been done by members of the CGI community since our first
meeting in 2005. There are remarkable success stories, data and trends that we can learn from in the 2,872
Commitments to Action that were made through 2013.
1. Out of all commitments made from 2005 through 2013, 1,202, or 41.8%, have been completed.
1,145, or 39.9%, are still working toward meeting their initial goals, only 46, or 1.6%, of commitments
are stalled, and 139, or 4.8%, of all commitments made have been unsuccessful. True to our model,
CGI asks each commitment-maker to report progress on their work annually. When a commitment
has not reported back to us in two years, CGI removes its impact metrics and value from its portfolio.
Those commitments can be “reactivated” at any time but we want to be honest about where people
are doing work now. Currently 11.8% of commitments since 2005 are in this category.
2. India, Kenya, and the United States are the three countries with the highest number of
commitments. While CGI perceives itself as an organization that facilitates commitments all over the
globe, the reality is not only that there are a significant number of commitments implemented in the
United States, but also that a high number of commitments are concentrated among a handful of
countries.
3. Over time, commitments became more focused on more direct interventions such as skills
development, access to capital, STEM, and access to education. Early on, commitment-makers were
focused on indirect activities such as awareness-raising, policy and advocacy, peace building, and
donations.
4. Purely donation-based commitments have and continue to become less common than those
directly implementing a program. These commitments represent about 3% of the entire portfolio.
5. Members of the CGI community mobilize in the aftermath of a disaster or crisis through new
Commitments to Action. While many commitment-makers focus on crises and disasters, once
engaged, their work continues after the immediate crisis has been resolved. While the highest
occurrences of Haiti commitments are in 2008 and 2010, following devastating natural disasters in
the country, over half of all the commitments implemented in Haiti are ongoing, demonstrating the
commitment of CGI members to lasting and sustainable solutions, instead of short-term relief efforts.
6. CGI, through calls to action and programmatic focus, has helped to drive the shift in topical focus.
In response to member requests, over time CGI began to focus on specific topics to help drive more
coordinated action. For example, of commitments made in 2009 and 2010, girls and women was the
most common focus area, influenced by its emphasis at the 2009 Annual Meeting.
3
7. CGI commitment-makers recognize the power of diversity and successful commitments increasingly
rely on multi-sector partnerships. Initially, in 2005, only 65% of new commitments had one or more
partners. By 2008 and through 2013, 91% of commitments have partners. As part of that trend, cross-
sector partnerships between at least one corporation and an NGO more than doubled.
8. Commitments with partnerships have also seen a higher success in reaching goals. The impact-to-
target ratio for these commitments is 1.04 - meaning that, on average, commitments made through
partnerships exceeded their goals. This is in stark contrast to the impact to target ratio for
commitments without a partner: 0.84.
9. Over two-thirds (67%) of completed commitments, that reported impact on their original target
metrics, reached or exceeded their target number of lives affected. Another 8.8% of commitments
reached between 75% and 100% of their target. By examining how impactful commitments have
been as compared to their initial goals, it is possible to draw data-based conclusions on CGI's most
impactful commitments and content areas.
10. Information technology has become an increasingly important component of commitments.
Commitments tagged with the keywords “Mobile/Wireless” and “Digital Access/Adoption” have
become more prevalent since 2011.
4
COMMITMENT TO ACTION OVERVIEW
WHAT IS A COMMITMENT TO ACTION?
The Clinton Global Initiative (CGI) convenes leaders to drive action through its unique model. Rather than directly implementing projects, CGI facilitates action by helping members connect, collaborate, and make effective and measurable Commitments to Action. CGI supports the development of commitments by facilitating dialogue, providing opportunities to identify partners, showcasing the actions taken by commitment-makers, and communicating results. A Commitment to Action—the defining feature of CGI—is a plan for addressing a significant global challenge. Members must make a Commitment to Action to be a part of CGI. Commitments can be small or large and financial or nonmonetary in nature. Many commitments are the result of cross-sector partnerships, with CGI members combining efforts to expand their impact. Every CGI Commitment must meet three basic criteria:
NEW: A CGI commitment must present a new idea or approach to a major challenge. While ongoing work is not eligible, an expansion of a successful program does qualify as a valid Commitment to Action. Additionally, participants can become partners on other CGI commitments by, for example, providing in-kind support or technical expertise.
SPECIFIC: A CGI commitment must outline a specific approach to a problem, have clear and feasible objectives to be accomplished within a defined period of time, and articulate the desired outcome of the effort.
MEASURABLE: A CGI commitment must have specific quantitative or qualitative goals that can be monitored by the commitment-maker to evaluate progress over time. As each commitment is implemented, annual progress is reported to CGI to show the extent of its impact.
HOW DOES CGI COLLECT DATA FROM ITS MEMBERS?
As each commitment is implemented, CGI asks its commitment-makers to provide a progress update every year on their commitment. Commitment-makers report cumulative impact on the specific target metrics set when the commitment was developed, in addition to providing a variety of other qualitative data related to the commitment (summary of progress, lessons learned, best practices, etc.). The CGI Commitments staff reviews all progress reports and makes that progress publically available on the CGI website and relays this collected information in year-round meetings in order to create a shared learning community and help other members explore what works and what doesn’t in addressing global challenges.
HOW DOES CGI DEAL WITH COMMITMENTS THAT DO NOT REPORT PROGRESS?
With a portfolio nearing 3,100 commitments and a decade of participants, CGI attempts to contact all past commitment-makers regarding the status of commitments, particularly those who haven’t reported progress in more than 2 years. Any commitment that has not reported its status to CGI in two years is classified as “unresponsive.” Those commitments can be reactivated at any time; however, those commitments’ impact metrics and value are removed from CGI’s commitment portfolio in an effort to be honest about where members are implementing work now.
HOW DOES CGI AGGREGATE METRICS ACROSS COMMITMENTS? HOW DOES CGI
ACCURATELY CALCULATE INDIVIDUAL LIVES AFFECTED AND ACCOUNT FOR
COMMITMENTS OPERATING IN MULTIPLE COUNTRIES?
5
CGI uses a conservative approach when aggregating all metrics associated with commitments - both target and impact - to reduce the possibility of double counting individuals who may be reached by multiple commitments. To summarize the process, for each metric CGI counts the largest number, with attention to the specific countries included in the geographic scope of that commitment (e.g India, Mexico, China). Because CGI is unable to disaggregate reported values between countries on a multi-country commitment, if any of these countries also appear in the geographic scope of a second commitment, those values from the second commitment must be discounted, regardless of whether new countries are also present. Therefore, the only values that are counted, in addition to the largest value, are those reported by commitments that are operating only in unique countries not represented by any of the larger previously counted values. Finally, once all of the appropriated values have been identified, those values are summed. This process is repeated for each individual metric. Because the value is by nature an estimate and CGI’s aggregation method is so conservative, the final aggregated values are likely underestimated. [For example: If Commitment A reaches 100 people in India, China and Mexico, and Commitment B reaches 80 people in China and Mexico, and Commitment C reaches 45 people in South Africa, CGI counts 100 people from Commitment A, discounts the 80 people reached in Commitments B because it is unknown what the degree of overlap is between their reach, and counts the 45 unique people reached through Commitment C. Therefore, through these commitments, CGI would conservatively report that 145 people were reached (rather than 225).]
DOES CGI VERIFY THE DATA RECEIVED FROM COMMITMENT-MAKERS?
All data is self-reported by CGI commitment-makers. CGI serves as a platform for companies, individuals, governments and NGOs to learn from one another’s efforts, in an effort to maximize the success of all CGI members - not as a watchdog organization to evaluate the effectiveness of a specific organization’s work on global challenges. During the commitment development process, CGI staff work diligently with each commitment-maker to establish target metrics that are realistic and maintain the same conservative perspective CGI takes in the reporting progress. Additionally, CGI works with the organization to ensure it has the capacity to accurately measure, evaluate and report on their impact. The commitment-maker is ultimately responsible for identifying the metrics they wish to use to measure their commitments’ impact.
DO IMPACT NUMBERS INCLUDE FORWARD-LOOKING COMMITMENTS AND THE
PROJECTED IMPACT OF COMMITMENTS STILL IN PROGRESS?
No. CGI is careful to only calculate impact as reported by commitment-makers through annual progress updates, regardless of status (ongoing, completed, stalled, etc.), and only represent the actual work accomplished by commitments to date. The initial target metrics, established by commitment-makers at the outset of their commitment, are always kept separate from the impact metrics.
WHAT IS MEANT BY A LIFE BEING "IMPROVED"?
CGI commitments each employ different approaches and strategies, address different challenges, and work in different geographies. Due to the broad spectrum of work being done, the way in which each commitment-maker measures impact is specific to that commitment. In evaluating whether a life has been “improved,” CGI relies on commitment-makers to report only when a person’s life has been positively affected socially, economically, and/or environmentally as a result of that commitment CGI asks commitment-makers to be conservative when establishing initial goals, accounting for the organizations’ ability to accurately measure and report impact.
6
WHAT METHODOLOGY DID CGI USE IN REVIEWING ITS PORTFOLIO OF COMMITMENTS
FOR THIS REPORT?
CGI’s analysis includes all commitments made for the CGI America, CGI International, and CGI Annual Meetings from 2005 through 2013. In that time, members of the CGI community made a total of 2,872 commitments. The final data set used for this analysis includes all 2014 progress updates received as of March 3, 2014. This analysis was executed using the Palantir platform in July 2014. It is important to note that all of this information is gathered from data that has been self-reported by CGI commitment-makers. CGI offers a number of metrics for members to measure commitment progress. CGI members are asked to set targets and report annual updates on their commitments' cumulative impact. The most cross-cutting of these metrics is the ‘Number of Lives Affected,’ a measure of the total number of individuals directly benefitting from a commitment. Out of the 2,872 commitments made by members of the CGI community as of March 3, 2014, 2,532 have been reported as completed or, if ongoing, have reported progress in the last two years to CGI through progress reports. From these commitments, a subset of 524 completed commitments was selected for impact to target analysis specifically. This group was reached by removing any commitment that did not contain all of the following member-reported indicators: impact number of lives affected, target number of lives affected, estimated total value, and country scope. Additionally, these are all completed commitments. While making up only 20% of the overall portfolio, the subset is still a strong representation of the distribution of commitments over time. Overall, these 524 commitments represent a diverse cross-section of geographies, approaches, organizations and focus areas. Additionally, the cumulative impact of these commitments reaches more than 180 million lives in more than 160 countries, and valued at more than $15 billion, when fully funded and implemented. To measure progress toward a commitment's original goals, CGI uses an impact/target (I/T) ratio of the number of lives affected metric. An I/T ratio of 1 means a commitment impacted the exact number of lives it targeted to reach. An I/T ratio greater than 1 means a commitment's impact has exceeded its original target. An I/T ratio less than 1 means a commitment impacted less than the number of lives it targeted. Using the I/T ratio for the number of lives affected as one indicator for success, it is possible to draw data-based conclusions on CGI's most impactful commitments and content areas. It is important to note that commitments are non-exclusive to countries; commitments may take place in more than one country at once, and their metrics apply to each country they are operating in. For example, the commitment “Lighting a Billion Lives” was completed in 2013 in multiple countries including: Afghanistan, Bangladesh, Ethiopia, India, Indonesia, Kenya, Pakistan, and Uganda. Since the I/T Ratio for this commitment was 1.15 (the commitment impacted 15% more people than it set out to do) each of the aforementioned country averages benefit from this single commitment’s positive ratio. Conversely, if the commitment had a lower I/T Ratio of say, 0.75 (the commitment impacted only 75% of the target number of lives), each of the country averages would be affected by this individual commitment’s lower ratio.
HOW DOES CGI DESCRIBE AND TRACK THE COMMITMENT THROUGH DATA?
CGI uses keywords to more accurately aggregate commitments based on their specific area of focus (e.g. Climate Change, Girls/Women, or Small/Medium Sized Enterprises). Each commitment is tagged by CGI with no more than 10 keywords, chosen from a master list of 143 keywords, which provide context on the main issue being addressed, specific populations that will be targeted or engaged, and unique approaches the commitment-makers may be utilizing in the commitment’s implementation. Of these 10 keywords, the one that most aligns with the crux of the commitment is selected as the Primary Subtopic.
7
2005 - 2013
NUMBER OF COMMITMENTS TO ACTION
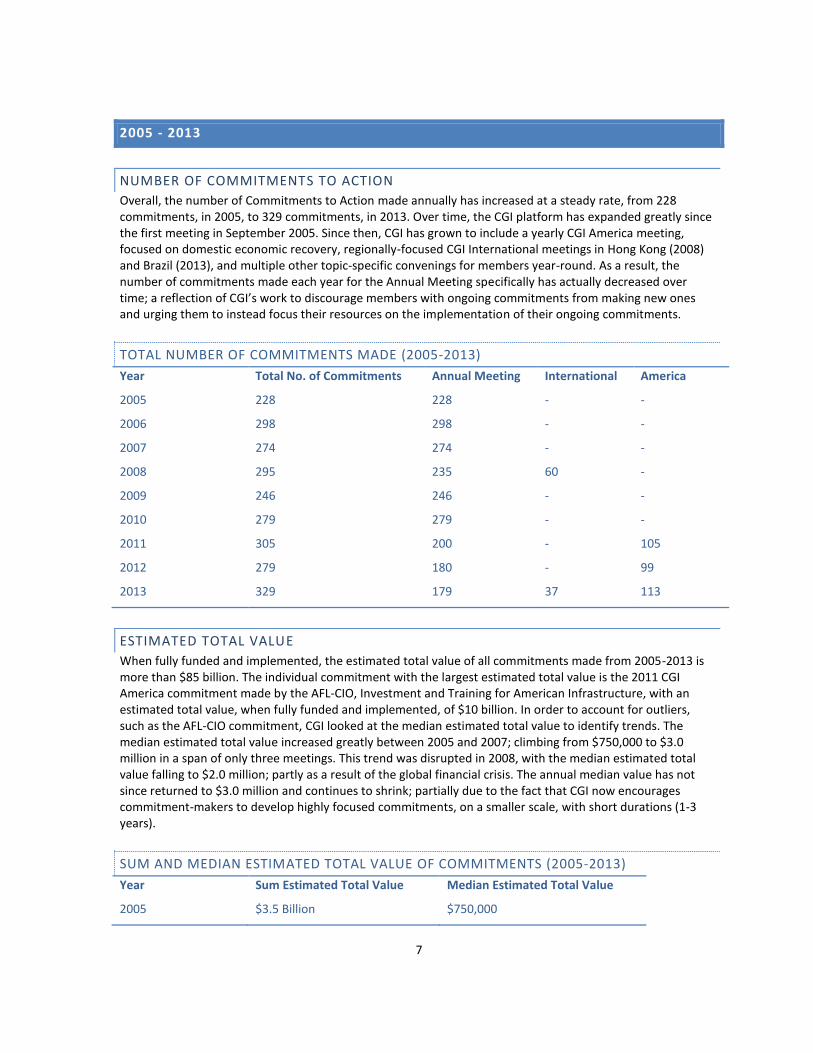
Overall, the number of Commitments to Action made annually has increased at a steady rate, from 228 commitments, in 2005, to 329 commitments, in 2013. Over time, the CGI platform has expanded greatly since the first meeting in September 2005. Since then, CGI has grown to include a yearly CGI America meeting, focused on domestic economic recovery, regionally-focused CGI International meetings in Hong Kong (2008) and Brazil (2013), and multiple other topic-specific convenings for members year-round. As a result, the number of commitments made each year for the Annual Meeting specifically has actually decreased over time; a reflection of CGI’s work to discourage members with ongoing commitments from making new ones and urging them to instead focus their resources on the implementation of their ongoing commitments.
TOTAL NUMBER OF COMMITMENTS MADE (2005-2013)
Year Total No. of Commitments Annual Meeting International America
2005 228 228 - -
2006 298 298 - -
2007 274 274 - -
2008 295 235 60 -
2009 246 246 - -
2010 279 279 - -
2011 305 200 - 105
2012 279 180 - 99
2013 329 179 37 113
ESTIMATED TOTAL VALUE
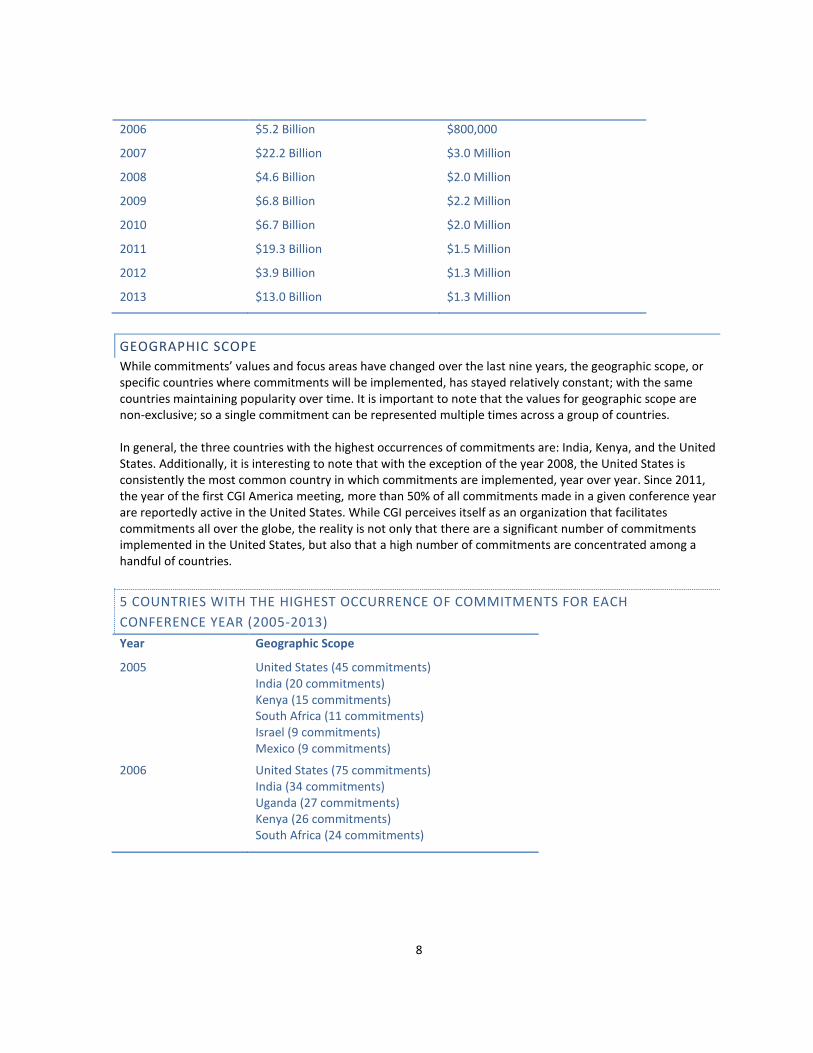
When fully funded and implemented, the estimated total value of all commitments made from 2005-2013 is more than $85 billion. The individual commitment with the largest estimated total value is the 2011 CGI America commitment made by the AFL-CIO, Investment and Training for American Infrastructure, with an estimated total value, when fully funded and implemented, of $10 billion. In order to account for outliers, such as the AFL-CIO commitment, CGI looked at the median estimated total value to identify trends. The median estimated total value increased greatly between 2005 and 2007; climbing from $750,000 to $3.0 million in a span of only three meetings. This trend was disrupted in 2008, with the median estimated total value falling to $2.0 million; partly as a result of the global financial crisis. The annual median value has not since returned to $3.0 million and continues to shrink; partially due to the fact that CGI now encourages commitment-makers to develop highly focused commitments, on a smaller scale, with short durations (1-3 years).
SUM AND MEDIAN ESTIMATED TOTAL VALUE OF COMMITMENTS (2005-2013)
Year Sum Estimated Total Value Median Estimated Total Value
2005 $3.5 Billion $750,000
8
2006 $5.2 Billion $800,000
2007 $22.2 Billion $3.0 Million
2008 $4.6 Billion $2.0 Million
2009 $6.8 Billion $2.2 Million
2010 $6.7 Billion $2.0 Million
2011 $19.3 Billion $1.5 Million
2012 $3.9 Billion $1.3 Million
2013 $13.0 Billion $1.3 Million
GEOGRAPHIC SCOPE
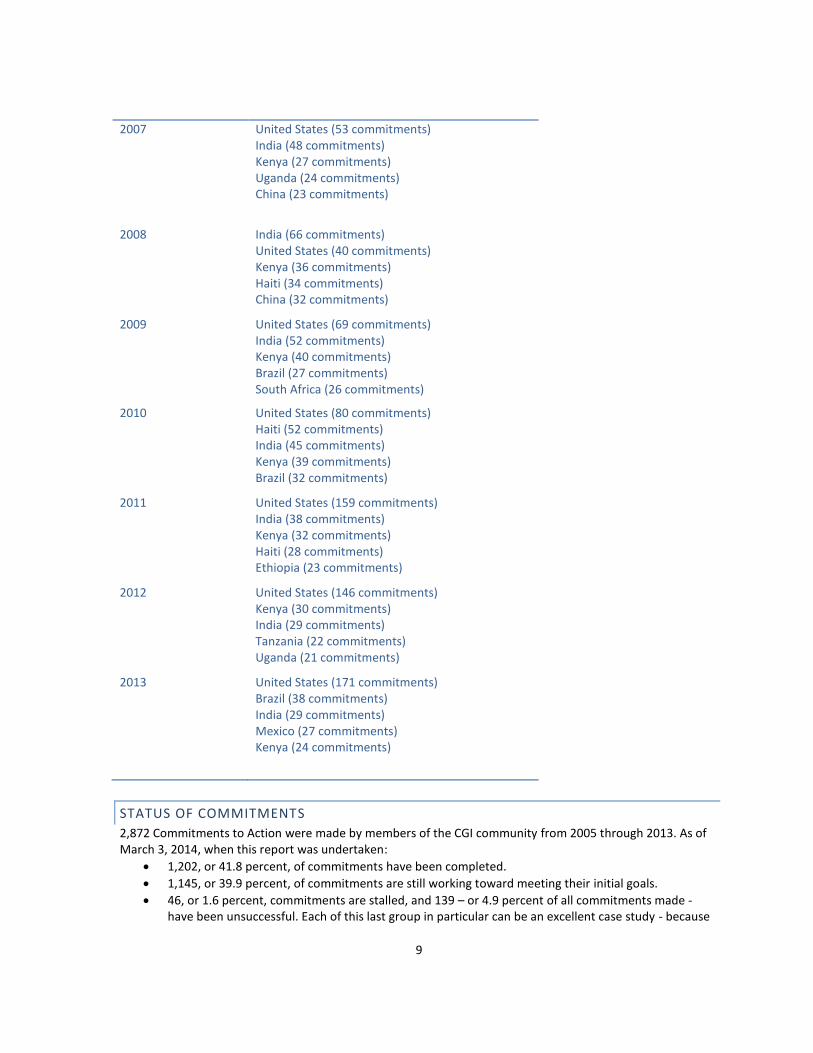
While commitments’ values and focus areas have changed over the last nine years, the geographic scope, or specific countries where commitments will be implemented, has stayed relatively constant; with the same countries maintaining popularity over time. It is important to note that the values for geographic scope are non-exclusive; so a single commitment can be represented multiple times across a group of countries. In general, the three countries with the highest occurrences of commitments are: India, Kenya, and the United States. Additionally, it is interesting to note that with the exception of the year 2008, the United States is consistently the most common country in which commitments are implemented, year over year. Since 2011, the year of the first CGI America meeting, more than 50% of all commitments made in a given conference year are reportedly active in the United States. While CGI perceives itself as an organization that facilitates commitments all over the globe, the reality is not only that there are a significant number of commitments implemented in the United States, but also that a high number of commitments are concentrated among a handful of countries.
5 COUNTRIES WITH THE HIGHEST OCCURRENCE OF COMMITMENTS FOR EACH
CONFERENCE YEAR (2005-2013)
Year Geographic Scope
2005 United States (45 commitments) India (20 commitments) Kenya (15 commitments) South Africa (11 commitments) Israel (9 commitments) Mexico (9 commitments)
2006 United States (75 commitments) India (34 commitments) Uganda (27 commitments) Kenya (26 commitments) South Africa (24 commitments)
9
2007 United States (53 commitments) India (48 commitments) Kenya (27 commitments) Uganda (24 commitments) China (23 commitments)
2008 India (66 commitments) United States (40 commitments) Kenya (36 commitments) Haiti (34 commitments) China (32 commitments)
2009 United States (69 commitments) India (52 commitments) Kenya (40 commitments) Brazil (27 commitments) South Africa (26 commitments)
2010 United States (80 commitments) Haiti (52 commitments) India (45 commitments) Kenya (39 commitments) Brazil (32 commitments)
2011 United States (159 commitments) India (38 commitments) Kenya (32 commitments) Haiti (28 commitments) Ethiopia (23 commitments)
2012 United States (146 commitments) Kenya (30 commitments) India (29 commitments) Tanzania (22 commitments) Uganda (21 commitments)
2013 United States (171 commitments) Brazil (38 commitments) India (29 commitments) Mexico (27 commitments) Kenya (24 commitments)
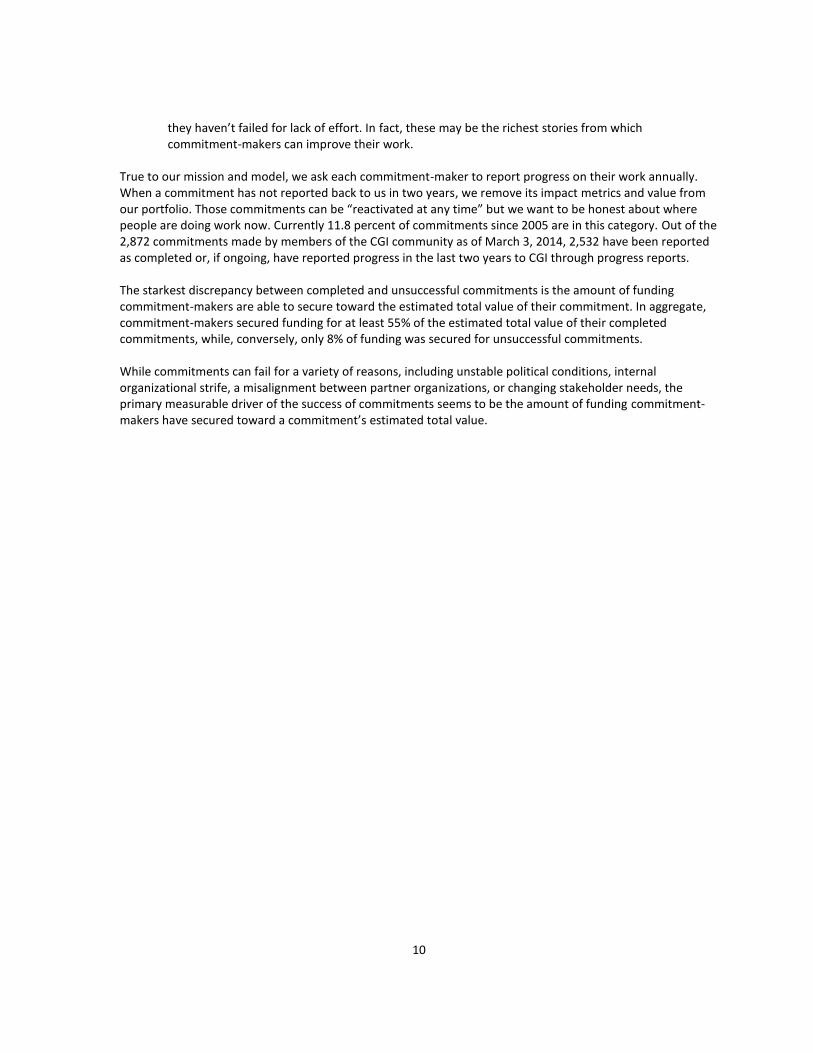
STATUS OF COMMITMENTS
2,872 Commitments to Action were made by members of the CGI community from 2005 through 2013. As of March 3, 2014, when this report was undertaken:
1,202, or 41.8 percent, of commitments have been completed.
1,145, or 39.9 percent, of commitments are still working toward meeting their initial goals.
46, or 1.6 percent, commitments are stalled, and 139 – or 4.9 percent of all commitments made - have been unsuccessful. Each of this last group in particular can be an excellent case study - because
10
they haven’t failed for lack of effort. In fact, these may be the richest stories from which commitment-makers can improve their work.
True to our mission and model, we ask each commitment-maker to report progress on their work annually. When a commitment has not reported back to us in two years, we remove its impact metrics and value from our portfolio. Those commitments can be “reactivated at any time” but we want to be honest about where people are doing work now. Currently 11.8 percent of commitments since 2005 are in this category. Out of the 2,872 commitments made by members of the CGI community as of March 3, 2014, 2,532 have been reported as completed or, if ongoing, have reported progress in the last two years to CGI through progress reports. The starkest discrepancy between completed and unsuccessful commitments is the amount of funding commitment-makers are able to secure toward the estimated total value of their commitment. In aggregate, commitment-makers secured funding for at least 55% of the estimated total value of their completed commitments, while, conversely, only 8% of funding was secured for unsuccessful commitments. While commitments can fail for a variety of reasons, including unstable political conditions, internal organizational strife, a misalignment between partner organizations, or changing stakeholder needs, the primary measurable driver of the success of commitments seems to be the amount of funding commitment-makers have secured toward a commitment’s estimated total value.
11
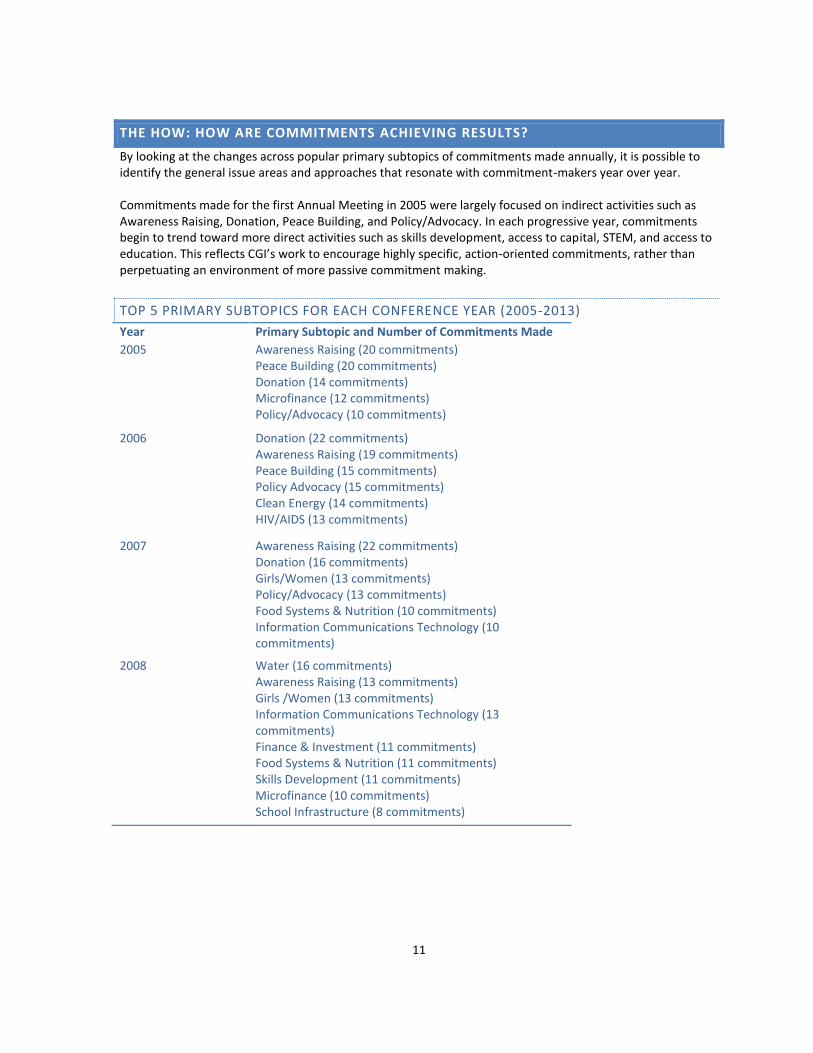
THE HOW: HOW ARE COMMITMENTS ACHIEVING RESULTS?
By looking at the changes across popular primary subtopics of commitments made annually, it is possible to identify the general issue areas and approaches that resonate with commitment-makers year over year. Commitments made for the first Annual Meeting in 2005 were largely focused on indirect activities such as Awareness Raising, Donation, Peace Building, and Policy/Advocacy. In each progressive year, commitments begin to trend toward more direct activities such as skills development, access to capital, STEM, and access to education. This reflects CGI’s work to encourage highly specific, action-oriented commitments, rather than perpetuating an environment of more passive commitment making.
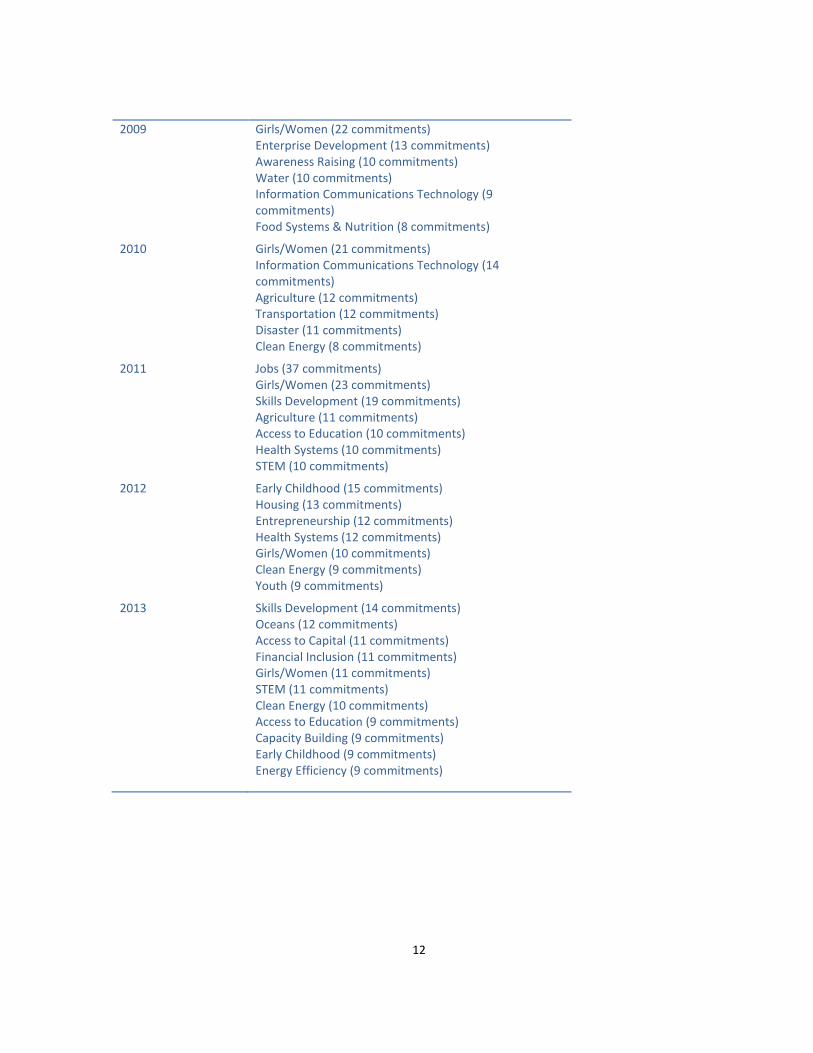
TOP 5 PRIMARY SUBTOPICS FOR EACH CONFERENCE YEAR (2005-2013)
Year Primary Subtopic and Number of Commitments Made
2005 Awareness Raising (20 commitments) Peace Building (20 commitments) Donation (14 commitments) Microfinance (12 commitments) Policy/Advocacy (10 commitments)
2006 Donation (22 commitments) Awareness Raising (19 commitments) Peace Building (15 commitments) Policy Advocacy (15 commitments) Clean Energy (14 commitments) HIV/AIDS (13 commitments)
2007 Awareness Raising (22 commitments) Donation (16 commitments) Girls/Women (13 commitments) Policy/Advocacy (13 commitments) Food Systems & Nutrition (10 commitments) Information Communications Technology (10 commitments)
2008 Water (16 commitments) Awareness Raising (13 commitments) Girls /Women (13 commitments) Information Communications Technology (13 commitments) Finance & Investment (11 commitments) Food Systems & Nutrition (11 commitments) Skills Development (11 commitments) Microfinance (10 commitments) School Infrastructure (8 commitments)
12
2009 Girls/Women (22 commitments) Enterprise Development (13 commitments) Awareness Raising (10 commitments) Water (10 commitments) Information Communications Technology (9 commitments) Food Systems & Nutrition (8 commitments)
2010 Girls/Women (21 commitments) Information Communications Technology (14 commitments) Agriculture (12 commitments) Transportation (12 commitments) Disaster (11 commitments) Clean Energy (8 commitments)
2011 Jobs (37 commitments) Girls/Women (23 commitments) Skills Development (19 commitments) Agriculture (11 commitments) Access to Education (10 commitments) Health Systems (10 commitments) STEM (10 commitments)
2012 Early Childhood (15 commitments) Housing (13 commitments) Entrepreneurship (12 commitments) Health Systems (12 commitments) Girls/Women (10 commitments) Clean Energy (9 commitments) Youth (9 commitments)
2013 Skills Development (14 commitments) Oceans (12 commitments) Access to Capital (11 commitments) Financial Inclusion (11 commitments) Girls/Women (11 commitments) STEM (11 commitments) Clean Energy (10 commitments) Access to Education (9 commitments) Capacity Building (9 commitments) Early Childhood (9 commitments) Energy Efficiency (9 commitments)
13
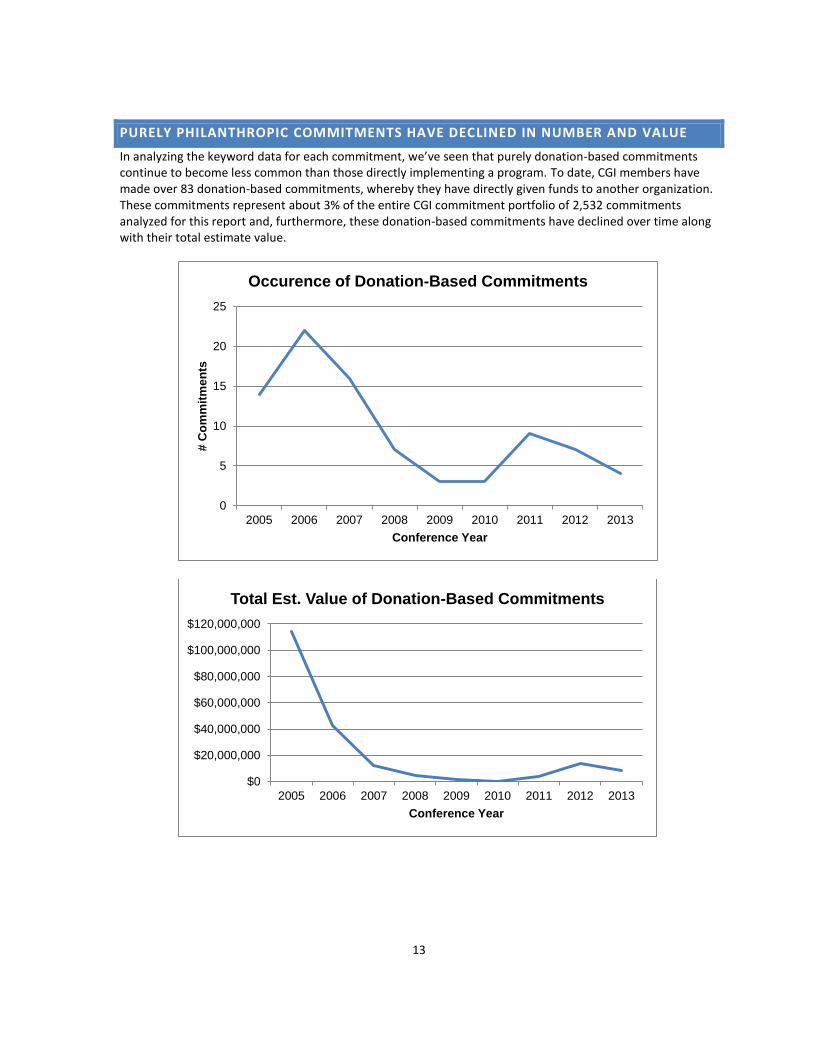
PURELY PHILANTHROPIC COMMITMENTS HAVE DECLINED IN NUMBER AND VALUE
In analyzing the keyword data for each commitment, we’ve seen that purely donation-based commitments continue to become less common than those directly implementing a program. To date, CGI members have made over 83 donation-based commitments, whereby they have directly given funds to another organization. These commitments represent about 3% of the entire CGI commitment portfolio of 2,532 commitments analyzed for this report and, furthermore, these donation-based commitments have declined over time along with their total estimate value.
0
5
10
15
20
25
2005 2006 2007 2008 2009 2010 2011 2012 2013
# C
om
mit
me
nts
Conference Year
Occurence of Donation-Based Commitments
$0
$20,000,000
$40,000,000
$60,000,000
$80,000,000
$100,000,000
$120,000,000
2005 2006 2007 2008 2009 2010 2011 2012 2013
Conference Year
Total Est. Value of Donation-Based Commitments
14
MEMBERS OF THE CGI COMMUNITY MOBILIZE IN THE AFTERMATH OF A DISASTER OR
CRISIS THROUGH NEW COMMITMENTS TO ACTION. WHILE MANY COMMITMENT-
MAKERS FOCUS ON CRISES AND DISASTERS, ONCE ENGAGED, THEIR WORK
CONTINUES AFTER THE IMMEDIATE CRISIS.
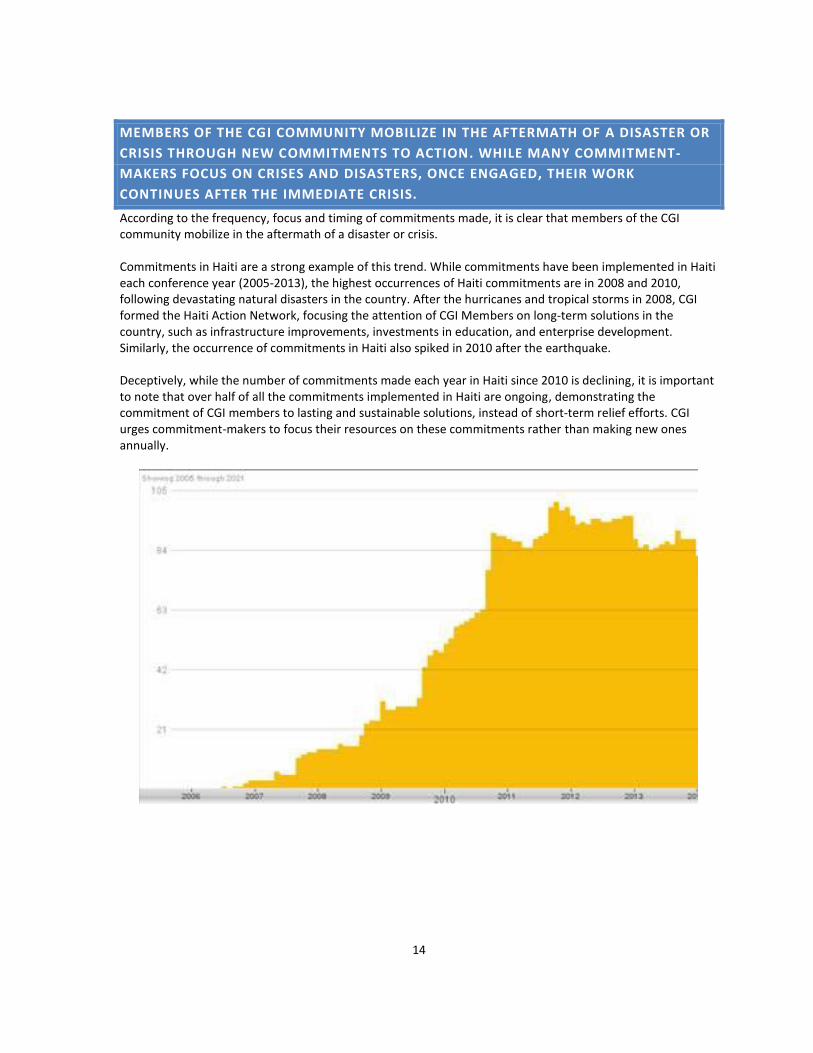
According to the frequency, focus and timing of commitments made, it is clear that members of the CGI community mobilize in the aftermath of a disaster or crisis. Commitments in Haiti are a strong example of this trend. While commitments have been implemented in Haiti each conference year (2005-2013), the highest occurrences of Haiti commitments are in 2008 and 2010, following devastating natural disasters in the country. After the hurricanes and tropical storms in 2008, CGI formed the Haiti Action Network, focusing the attention of CGI Members on long-term solutions in the country, such as infrastructure improvements, investments in education, and enterprise development. Similarly, the occurrence of commitments in Haiti also spiked in 2010 after the earthquake. Deceptively, while the number of commitments made each year in Haiti since 2010 is declining, it is important to note that over half of all the commitments implemented in Haiti are ongoing, demonstrating the commitment of CGI members to lasting and sustainable solutions, instead of short-term relief efforts. CGI urges commitment-makers to focus their resources on these commitments rather than making new ones annually.
15
CGI, THROUGH CALLS TO ACTION AND PROGRAMMATIC FOCUS, HAS HELPED TO
DRIVE THE SHIFT IN TOPICAL FOCUS.
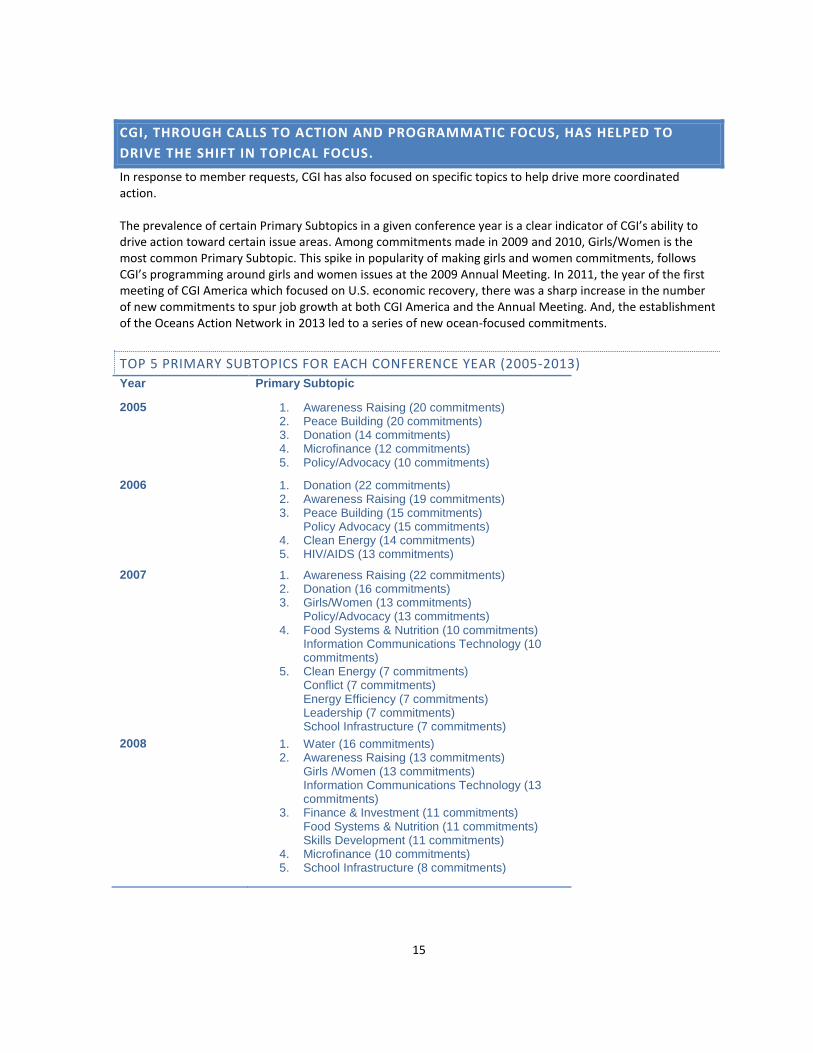
In response to member requests, CGI has also focused on specific topics to help drive more coordinated action. The prevalence of certain Primary Subtopics in a given conference year is a clear indicator of CGI’s ability to drive action toward certain issue areas. Among commitments made in 2009 and 2010, Girls/Women is the most common Primary Subtopic. This spike in popularity of making girls and women commitments, follows CGI’s programming around girls and women issues at the 2009 Annual Meeting. In 2011, the year of the first meeting of CGI America which focused on U.S. economic recovery, there was a sharp increase in the number of new commitments to spur job growth at both CGI America and the Annual Meeting. And, the establishment of the Oceans Action Network in 2013 led to a series of new ocean-focused commitments.
TOP 5 PRIMARY SUBTOPICS FOR EACH CONFERENCE YEAR (2005-2013)
Year Primary Subtopic
2005 1. Awareness Raising (20 commitments) 2. Peace Building (20 commitments) 3. Donation (14 commitments) 4. Microfinance (12 commitments) 5. Policy/Advocacy (10 commitments)
2006 1. Donation (22 commitments) 2. Awareness Raising (19 commitments) 3. Peace Building (15 commitments)
Policy Advocacy (15 commitments) 4. Clean Energy (14 commitments) 5. HIV/AIDS (13 commitments)
2007 1. Awareness Raising (22 commitments) 2. Donation (16 commitments) 3. Girls/Women (13 commitments)
Policy/Advocacy (13 commitments) 4. Food Systems & Nutrition (10 commitments)
Information Communications Technology (10 commitments)
5. Clean Energy (7 commitments) Conflict (7 commitments) Energy Efficiency (7 commitments) Leadership (7 commitments) School Infrastructure (7 commitments)
2008 1. Water (16 commitments) 2. Awareness Raising (13 commitments)
Girls /Women (13 commitments) Information Communications Technology (13 commitments)
3. Finance & Investment (11 commitments) Food Systems & Nutrition (11 commitments) Skills Development (11 commitments)
4. Microfinance (10 commitments) 5. School Infrastructure (8 commitments)
16
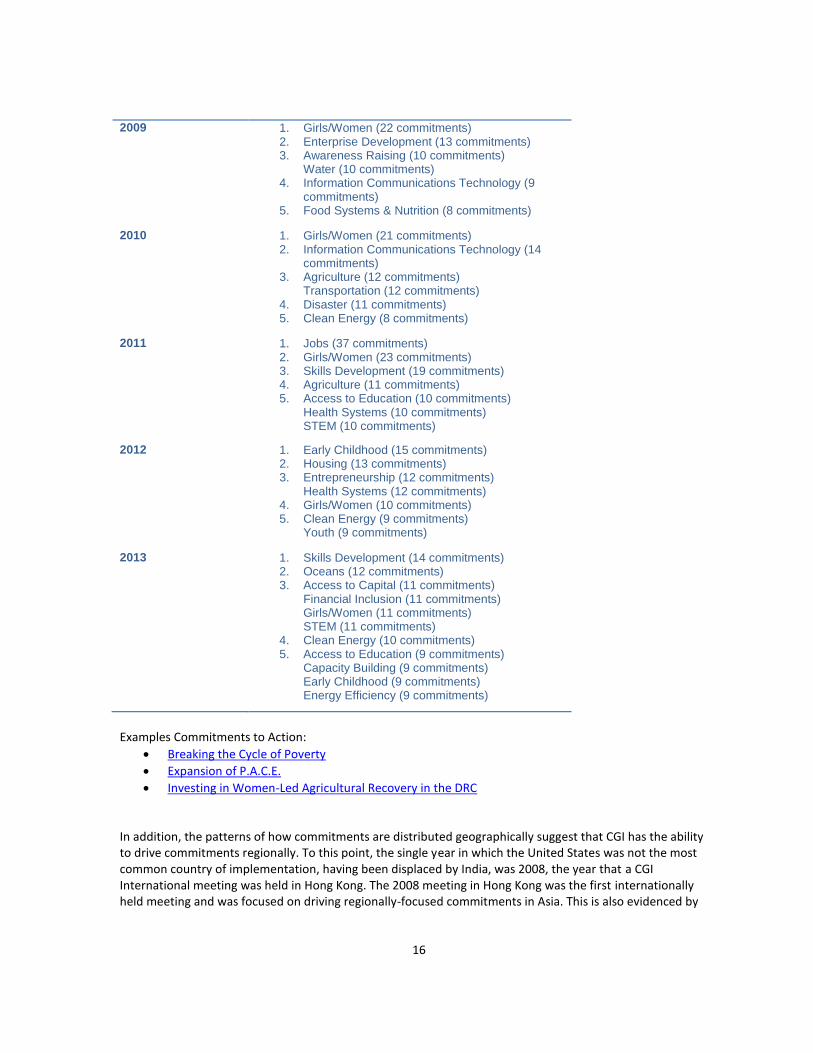
2009 1. Girls/Women (22 commitments) 2. Enterprise Development (13 commitments) 3. Awareness Raising (10 commitments)
Water (10 commitments) 4. Information Communications Technology (9
commitments) 5. Food Systems & Nutrition (8 commitments)
2010 1. Girls/Women (21 commitments) 2. Information Communications Technology (14
commitments) 3. Agriculture (12 commitments)
Transportation (12 commitments) 4. Disaster (11 commitments) 5. Clean Energy (8 commitments)
2011 1. Jobs (37 commitments) 2. Girls/Women (23 commitments) 3. Skills Development (19 commitments) 4. Agriculture (11 commitments) 5. Access to Education (10 commitments)
Health Systems (10 commitments) STEM (10 commitments)
2012 1. Early Childhood (15 commitments) 2. Housing (13 commitments) 3. Entrepreneurship (12 commitments)
Health Systems (12 commitments) 4. Girls/Women (10 commitments) 5. Clean Energy (9 commitments)
Youth (9 commitments)
2013 1. Skills Development (14 commitments) 2. Oceans (12 commitments) 3. Access to Capital (11 commitments)
Financial Inclusion (11 commitments) Girls/Women (11 commitments) STEM (11 commitments)
4. Clean Energy (10 commitments) 5. Access to Education (9 commitments)
Capacity Building (9 commitments) Early Childhood (9 commitments) Energy Efficiency (9 commitments)
Examples Commitments to Action:
Breaking the Cycle of Poverty
Expansion of P.A.C.E.
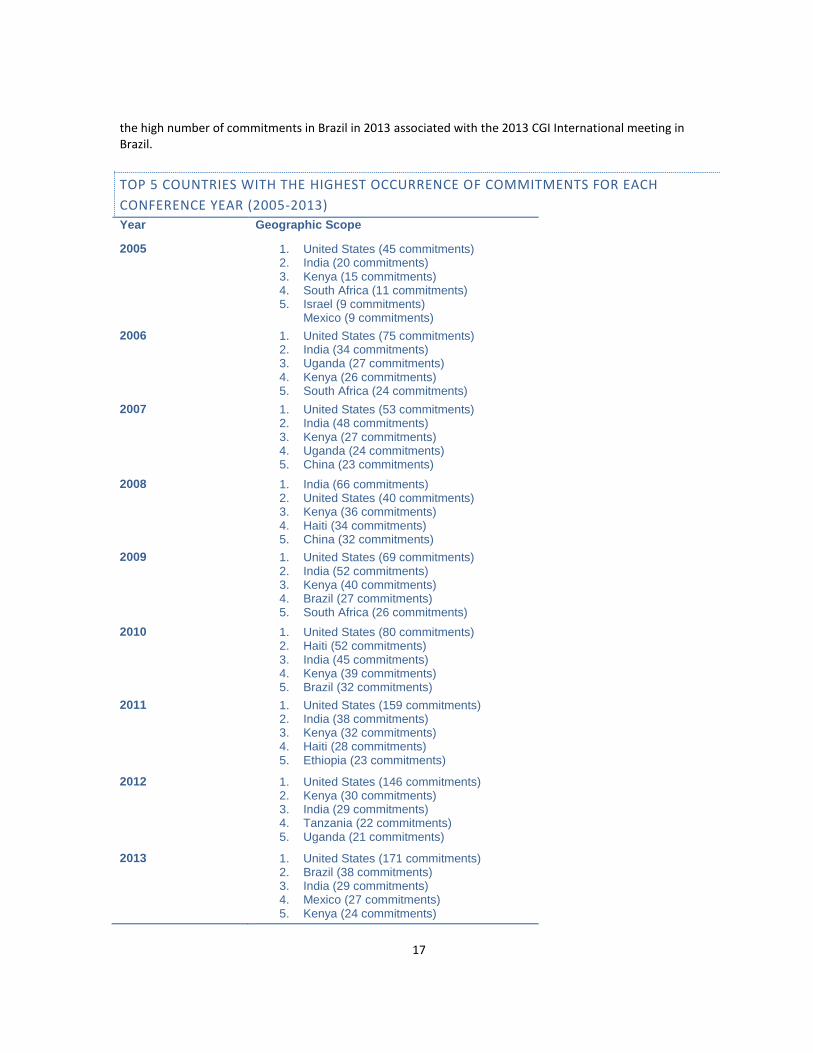
Investing in Women-Led Agricultural Recovery in the DRC In addition, the patterns of how commitments are distributed geographically suggest that CGI has the ability to drive commitments regionally. To this point, the single year in which the United States was not the most common country of implementation, having been displaced by India, was 2008, the year that a CGI International meeting was held in Hong Kong. The 2008 meeting in Hong Kong was the first internationally held meeting and was focused on driving regionally-focused commitments in Asia. This is also evidenced by
17
the high number of commitments in Brazil in 2013 associated with the 2013 CGI International meeting in Brazil.
TOP 5 COUNTRIES WITH THE HIGHEST OCCURRENCE OF COMMITMENTS FOR EACH
CONFERENCE YEAR (2005-2013)
Year Geographic Scope
2005 1. United States (45 commitments) 2. India (20 commitments) 3. Kenya (15 commitments) 4. South Africa (11 commitments) 5. Israel (9 commitments)
Mexico (9 commitments)
2006 1. United States (75 commitments) 2. India (34 commitments) 3. Uganda (27 commitments) 4. Kenya (26 commitments) 5. South Africa (24 commitments)
2007 1. United States (53 commitments) 2. India (48 commitments) 3. Kenya (27 commitments) 4. Uganda (24 commitments) 5. China (23 commitments)
2008 1. India (66 commitments) 2. United States (40 commitments) 3. Kenya (36 commitments) 4. Haiti (34 commitments) 5. China (32 commitments)
2009 1. United States (69 commitments) 2. India (52 commitments) 3. Kenya (40 commitments) 4. Brazil (27 commitments) 5. South Africa (26 commitments)
2010 1. United States (80 commitments) 2. Haiti (52 commitments) 3. India (45 commitments) 4. Kenya (39 commitments) 5. Brazil (32 commitments)
2011 1. United States (159 commitments) 2. India (38 commitments) 3. Kenya (32 commitments) 4. Haiti (28 commitments) 5. Ethiopia (23 commitments)
2012 1. United States (146 commitments) 2. Kenya (30 commitments) 3. India (29 commitments) 4. Tanzania (22 commitments) 5. Uganda (21 commitments)
2013 1. United States (171 commitments) 2. Brazil (38 commitments) 3. India (29 commitments) 4. Mexico (27 commitments) 5. Kenya (24 commitments)

18
Example Commitments to Action:
The Ubiquity Fund - Building Better Communities
The Rock Your Life SAGE Village
More Rice Less Water: System of Rice Intensification
19
POWER OF DIVERSITY: SUCCESSFUL INTERVENTIONS/COMMITMENTS INCREASINGLY
RELY ON MULTI-SECTOR PARTNERSHIPS
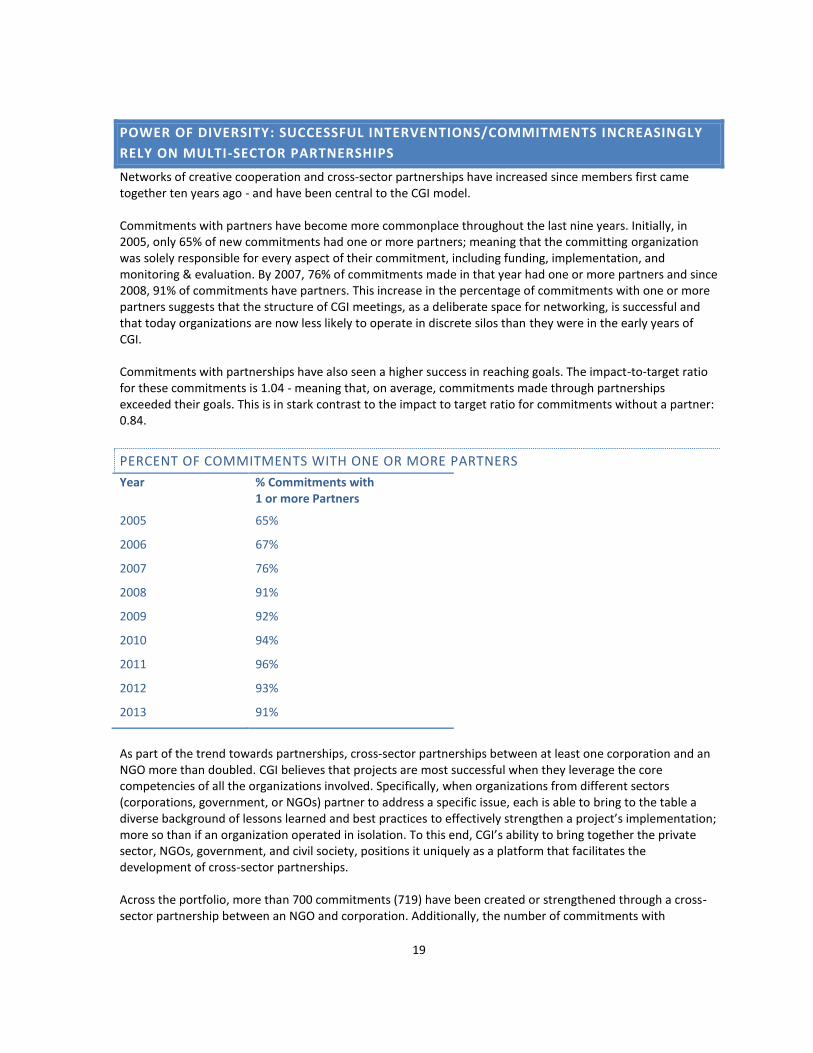
Networks of creative cooperation and cross-sector partnerships have increased since members first came together ten years ago - and have been central to the CGI model. Commitments with partners have become more commonplace throughout the last nine years. Initially, in 2005, only 65% of new commitments had one or more partners; meaning that the committing organization was solely responsible for every aspect of their commitment, including funding, implementation, and monitoring & evaluation. By 2007, 76% of commitments made in that year had one or more partners and since 2008, 91% of commitments have partners. This increase in the percentage of commitments with one or more partners suggests that the structure of CGI meetings, as a deliberate space for networking, is successful and that today organizations are now less likely to operate in discrete silos than they were in the early years of CGI. Commitments with partnerships have also seen a higher success in reaching goals. The impact-to-target ratio for these commitments is 1.04 - meaning that, on average, commitments made through partnerships exceeded their goals. This is in stark contrast to the impact to target ratio for commitments without a partner: 0.84.
PERCENT OF COMMITMENTS WITH ONE OR MORE PARTNERS
Year % Commitments with 1 or more Partners
2005 65%
2006 67%
2007 76%
2008 91%
2009 92%
2010 94%
2011 96%
2012 93%
2013 91%
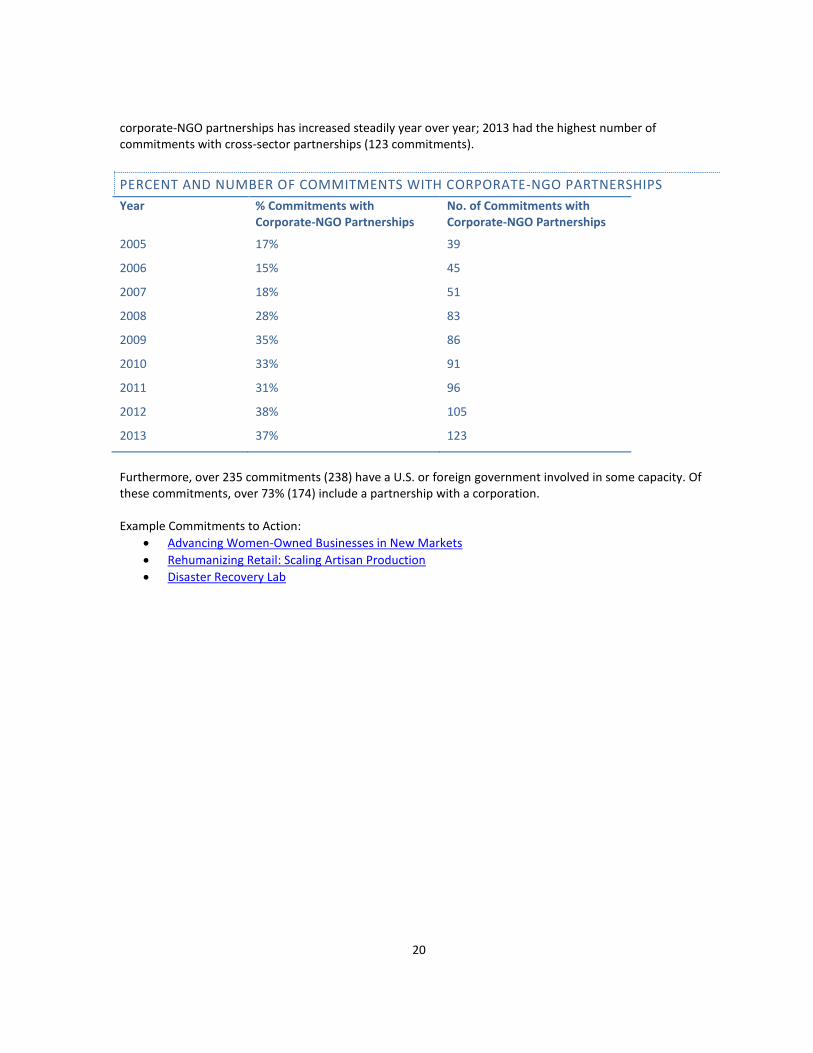
As part of the trend towards partnerships, cross-sector partnerships between at least one corporation and an NGO more than doubled. CGI believes that projects are most successful when they leverage the core competencies of all the organizations involved. Specifically, when organizations from different sectors (corporations, government, or NGOs) partner to address a specific issue, each is able to bring to the table a diverse background of lessons learned and best practices to effectively strengthen a project’s implementation; more so than if an organization operated in isolation. To this end, CGI’s ability to bring together the private sector, NGOs, government, and civil society, positions it uniquely as a platform that facilitates the development of cross-sector partnerships. Across the portfolio, more than 700 commitments (719) have been created or strengthened through a cross-sector partnership between an NGO and corporation. Additionally, the number of commitments with
20
corporate-NGO partnerships has increased steadily year over year; 2013 had the highest number of commitments with cross-sector partnerships (123 commitments).
PERCENT AND NUMBER OF COMMITMENTS WITH CORPORATE-NGO PARTNERSHIPS
Year % Commitments with Corporate-NGO Partnerships
No. of Commitments with Corporate-NGO Partnerships
2005 17% 39
2006 15% 45
2007 18% 51
2008 28% 83
2009 35% 86
2010 33% 91
2011 31% 96
2012 38% 105
2013 37% 123
Furthermore, over 235 commitments (238) have a U.S. or foreign government involved in some capacity. Of these commitments, over 73% (174) include a partnership with a corporation. Example Commitments to Action:
Advancing Women-Owned Businesses in New Markets
Rehumanizing Retail: Scaling Artisan Production
Disaster Recovery Lab
21
IMPACT/TARGET: WHERE HAVE COMPLETED COMMITMENTS BEEN MOST EFFECTIVE?
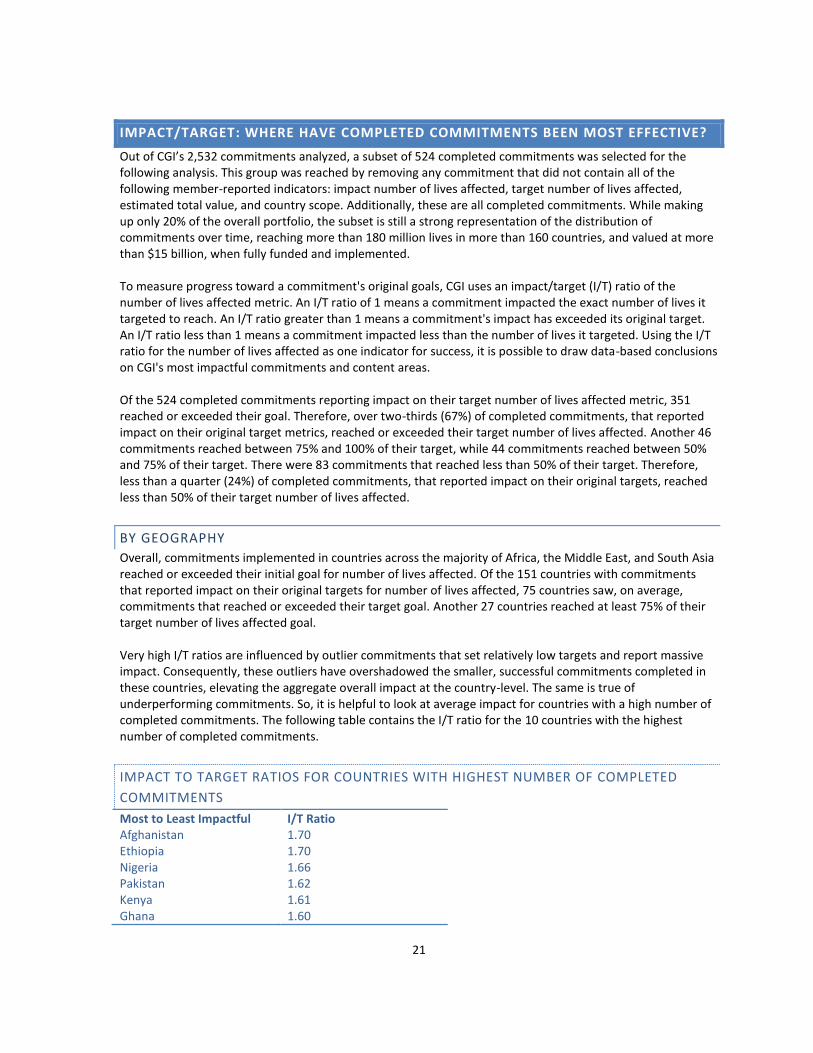
Out of CGI’s 2,532 commitments analyzed, a subset of 524 completed commitments was selected for the following analysis. This group was reached by removing any commitment that did not contain all of the following member-reported indicators: impact number of lives affected, target number of lives affected, estimated total value, and country scope. Additionally, these are all completed commitments. While making up only 20% of the overall portfolio, the subset is still a strong representation of the distribution of commitments over time, reaching more than 180 million lives in more than 160 countries, and valued at more than $15 billion, when fully funded and implemented. To measure progress toward a commitment's original goals, CGI uses an impact/target (I/T) ratio of the number of lives affected metric. An I/T ratio of 1 means a commitment impacted the exact number of lives it targeted to reach. An I/T ratio greater than 1 means a commitment's impact has exceeded its original target. An I/T ratio less than 1 means a commitment impacted less than the number of lives it targeted. Using the I/T ratio for the number of lives affected as one indicator for success, it is possible to draw data-based conclusions on CGI's most impactful commitments and content areas. Of the 524 completed commitments reporting impact on their target number of lives affected metric, 351 reached or exceeded their goal. Therefore, over two-thirds (67%) of completed commitments, that reported impact on their original target metrics, reached or exceeded their target number of lives affected. Another 46 commitments reached between 75% and 100% of their target, while 44 commitments reached between 50% and 75% of their target. There were 83 commitments that reached less than 50% of their target. Therefore, less than a quarter (24%) of completed commitments, that reported impact on their original targets, reached less than 50% of their target number of lives affected.
BY GEOGRAPHY
Overall, commitments implemented in countries across the majority of Africa, the Middle East, and South Asia reached or exceeded their initial goal for number of lives affected. Of the 151 countries with commitments that reported impact on their original targets for number of lives affected, 75 countries saw, on average, commitments that reached or exceeded their target goal. Another 27 countries reached at least 75% of their target number of lives affected goal. Very high I/T ratios are influenced by outlier commitments that set relatively low targets and report massive impact. Consequently, these outliers have overshadowed the smaller, successful commitments completed in these countries, elevating the aggregate overall impact at the country-level. The same is true of underperforming commitments. So, it is helpful to look at average impact for countries with a high number of completed commitments. The following table contains the I/T ratio for the 10 countries with the highest number of completed commitments.
IMPACT TO TARGET RATIOS FOR COUNTRIES WITH HIGHEST NUMBER OF COMPLETED
COMMITMENTS
Most to Least Impactful I/T Ratio Afghanistan 1.70 Ethiopia 1.70 Nigeria 1.66 Pakistan 1.62 Kenya 1.61 Ghana 1.60
22
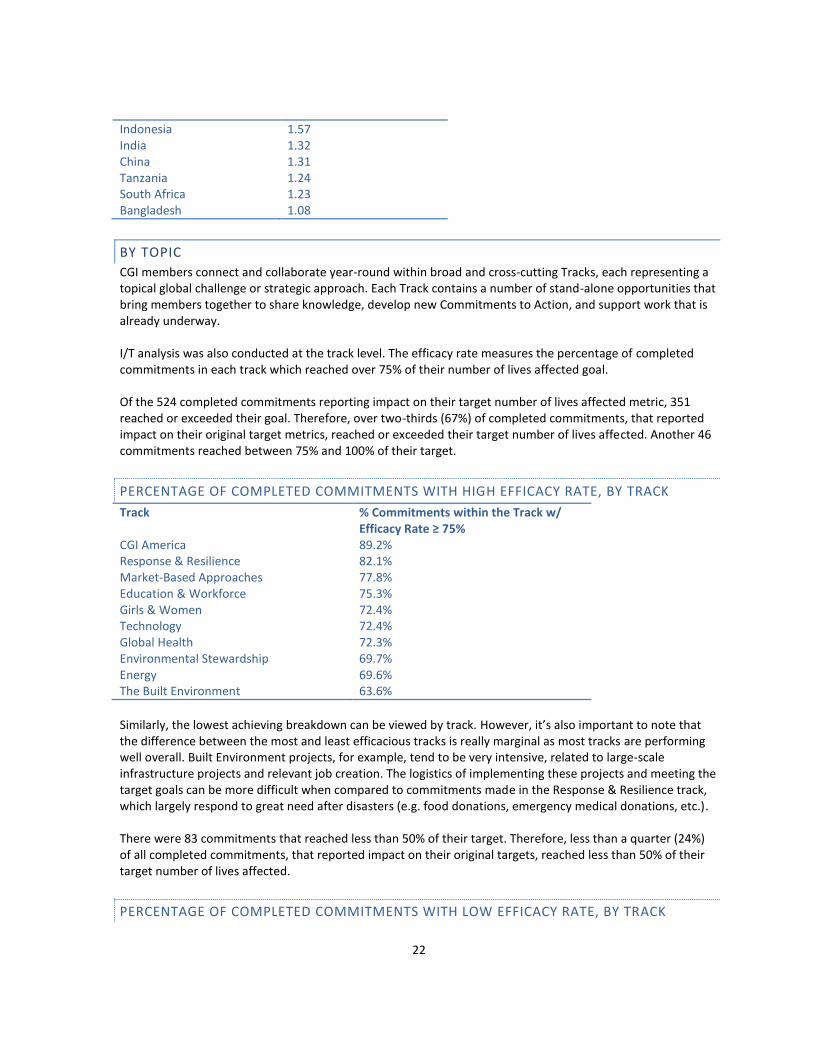
Indonesia 1.57 India 1.32 China 1.31 Tanzania 1.24 South Africa 1.23 Bangladesh 1.08
BY TOPIC
CGI members connect and collaborate year-round within broad and cross-cutting Tracks, each representing a topical global challenge or strategic approach. Each Track contains a number of stand-alone opportunities that bring members together to share knowledge, develop new Commitments to Action, and support work that is already underway. I/T analysis was also conducted at the track level. The efficacy rate measures the percentage of completed commitments in each track which reached over 75% of their number of lives affected goal. Of the 524 completed commitments reporting impact on their target number of lives affected metric, 351 reached or exceeded their goal. Therefore, over two-thirds (67%) of completed commitments, that reported impact on their original target metrics, reached or exceeded their target number of lives affected. Another 46 commitments reached between 75% and 100% of their target.
PERCENTAGE OF COMPLETED COMMITMENTS WITH HIGH EFFICACY RATE, BY TRACK
Track % Commitments within the Track w/ Efficacy Rate ≥ 75%
CGI America 89.2% Response & Resilience 82.1% Market-Based Approaches 77.8% Education & Workforce 75.3% Girls & Women 72.4% Technology 72.4% Global Health 72.3% Environmental Stewardship 69.7% Energy 69.6% The Built Environment 63.6%
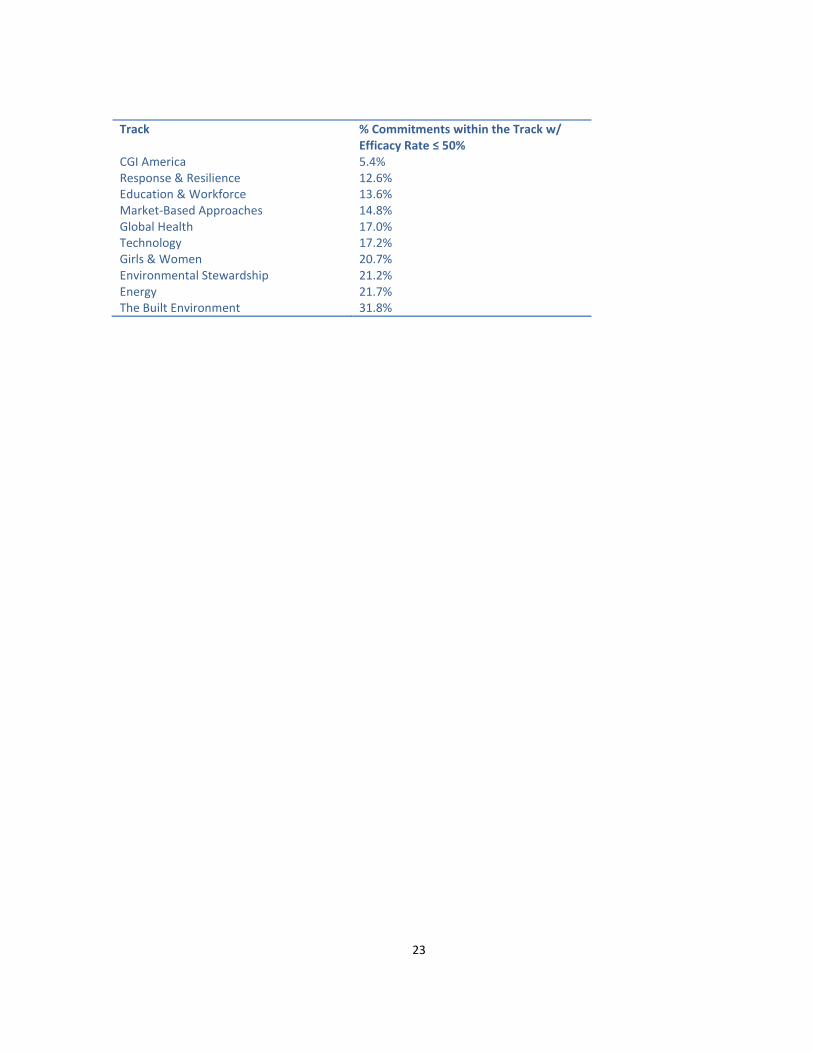
Similarly, the lowest achieving breakdown can be viewed by track. However, it’s also important to note that the difference between the most and least efficacious tracks is really marginal as most tracks are performing well overall. Built Environment projects, for example, tend to be very intensive, related to large-scale infrastructure projects and relevant job creation. The logistics of implementing these projects and meeting the target goals can be more difficult when compared to commitments made in the Response & Resilience track, which largely respond to great need after disasters (e.g. food donations, emergency medical donations, etc.). There were 83 commitments that reached less than 50% of their target. Therefore, less than a quarter (24%) of all completed commitments, that reported impact on their original targets, reached less than 50% of their target number of lives affected.
PERCENTAGE OF COMPLETED COMMITMENTS WITH LOW EFFICACY RATE, BY TRACK
23
Track % Commitments within the Track w/ Efficacy Rate ≤ 50%
CGI America 5.4% Response & Resilience 12.6% Education & Workforce 13.6% Market-Based Approaches 14.8% Global Health 17.0% Technology 17.2% Girls & Women 20.7% Environmental Stewardship 21.2% Energy 21.7% The Built Environment 31.8%
24
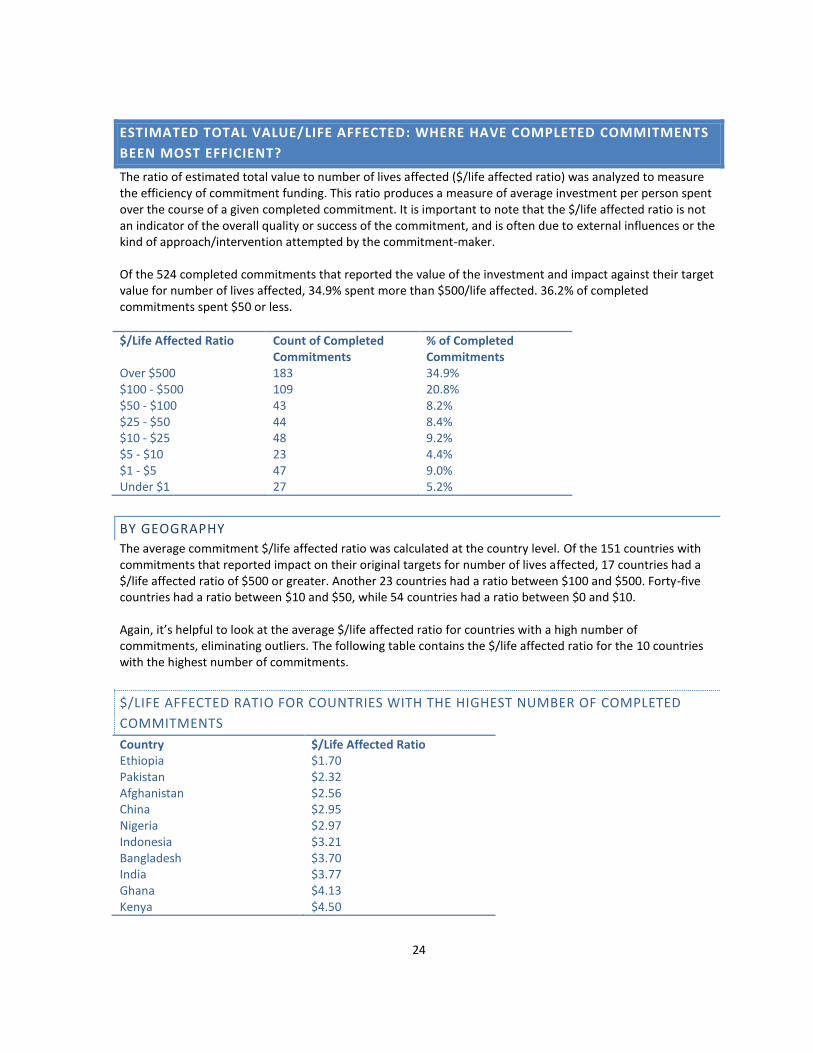
ESTIMATED TOTAL VALUE/LIFE AFFECTED: WHERE HAVE COMPLETED COMMITMENTS
BEEN MOST EFFICIENT?
The ratio of estimated total value to number of lives affected ($/life affected ratio) was analyzed to measure the efficiency of commitment funding. This ratio produces a measure of average investment per person spent over the course of a given completed commitment. It is important to note that the $/life affected ratio is not an indicator of the overall quality or success of the commitment, and is often due to external influences or the kind of approach/intervention attempted by the commitment-maker. Of the 524 completed commitments that reported the value of the investment and impact against their target value for number of lives affected, 34.9% spent more than $500/life affected. 36.2% of completed commitments spent $50 or less.
$/Life Affected Ratio Count of Completed Commitments
% of Completed Commitments
Over $500 183 34.9% $100 - $500 109 20.8% $50 - $100 43 8.2% $25 - $50 44 8.4% $10 - $25 48 9.2% $5 - $10 23 4.4% $1 - $5 47 9.0% Under $1 27 5.2%
BY GEOGRAPHY
The average commitment $/life affected ratio was calculated at the country level. Of the 151 countries with commitments that reported impact on their original targets for number of lives affected, 17 countries had a $/life affected ratio of $500 or greater. Another 23 countries had a ratio between $100 and $500. Forty-five countries had a ratio between $10 and $50, while 54 countries had a ratio between $0 and $10. Again, it’s helpful to look at the average $/life affected ratio for countries with a high number of commitments, eliminating outliers. The following table contains the $/life affected ratio for the 10 countries with the highest number of commitments.
$/LIFE AFFECTED RATIO FOR COUNTRIES WITH THE HIGHEST NUMBER OF COMPLETED
COMMITMENTS
Country $/Life Affected Ratio Ethiopia $1.70 Pakistan $2.32 Afghanistan $2.56 China $2.95 Nigeria $2.97 Indonesia $3.21 Bangladesh $3.70 India $3.77 Ghana $4.13 Kenya $4.50

25
BY TOPIC
This analysis was also done at the track level. An analysis at the track level is helpful in viewing the tracks with the most and least expensive $/life affected ratios. Global Health contained the largest number of commitments being implemented at or below $25/life, while nearly the entire portfolio of Girls & Women commitments spent more than $25/life.
TRACKS WITH LOWEST $/LIFE AFFECTED RATIOS
Track % of Completed Commitments in each Track with ≤ $25/life
Global Health 48.9% Technology 37.9% Energy 34.8% Market-Based Approaches 32.1% Environmental Stewardship 27.3% The Built Environment 22.7% Response & Resilience 21.1% CGI America 16.2% Education & Workforce 16.0% Girls & Women 3.4%
Conversely, the track breakdown can be viewed by the tracks with high $/life affected ratios. Girls & Women had the highest number of commitments spending more than $500/life, with more than half of all completed Girls & Women commitments spending more than $500/life.
TRACKS WITH HIGHEST $/LIFE AFFECTED RATIOS
Track % of Completed Commitments in each Track with ≥ $500/life
Global Health 14.9% Market-Based Approaches 24.7% Technology 31.0% The Built Environment 31.8% Response & Resilience 35.8% Education & Workforce Development 44.4% Environmental Stewardship 45.5% Energy 47.8% CGI America 54.1% Girls & Women 58.6%
Again, based on the varied approach of commitments and/or the challenge each commitment attempts to address, some tend to be very cost-intensive (for example, when related to large-scale infrastructure projects, job creation, or addressing a population rather than a content-area).
26
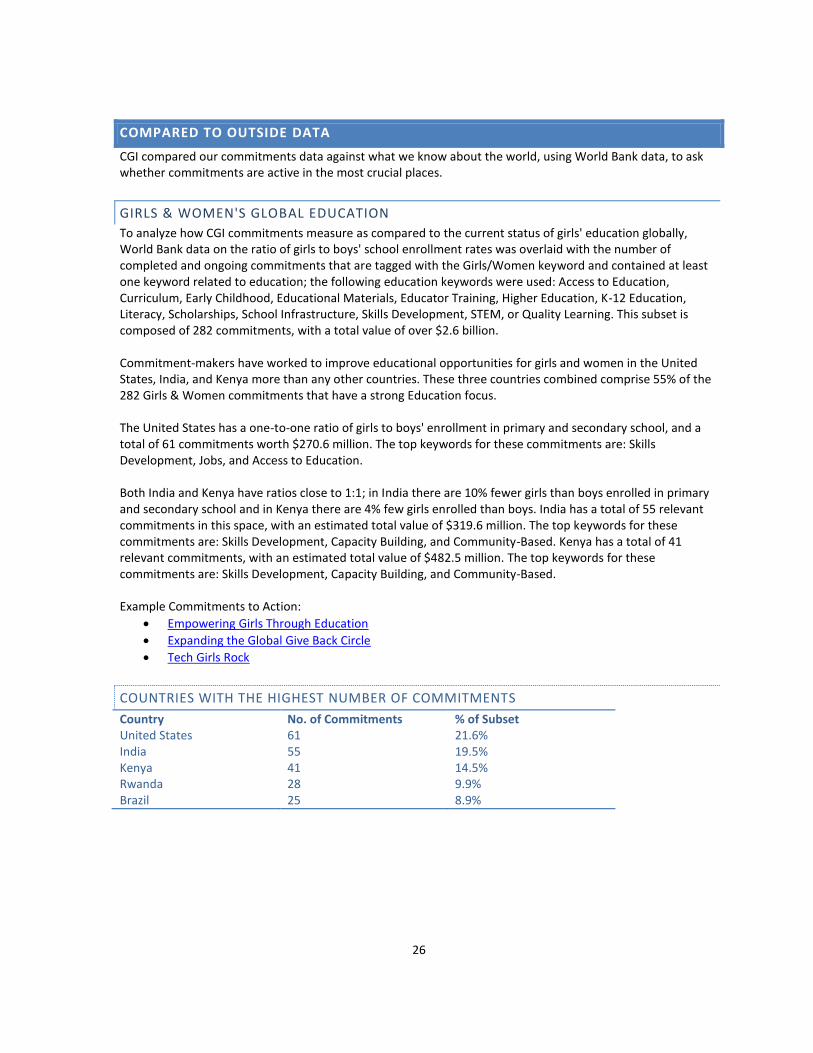
COMPARED TO OUTSIDE DATA
CGI compared our commitments data against what we know about the world, using World Bank data, to ask whether commitments are active in the most crucial places.
GIRLS & WOMEN'S GLOBAL EDUCATION
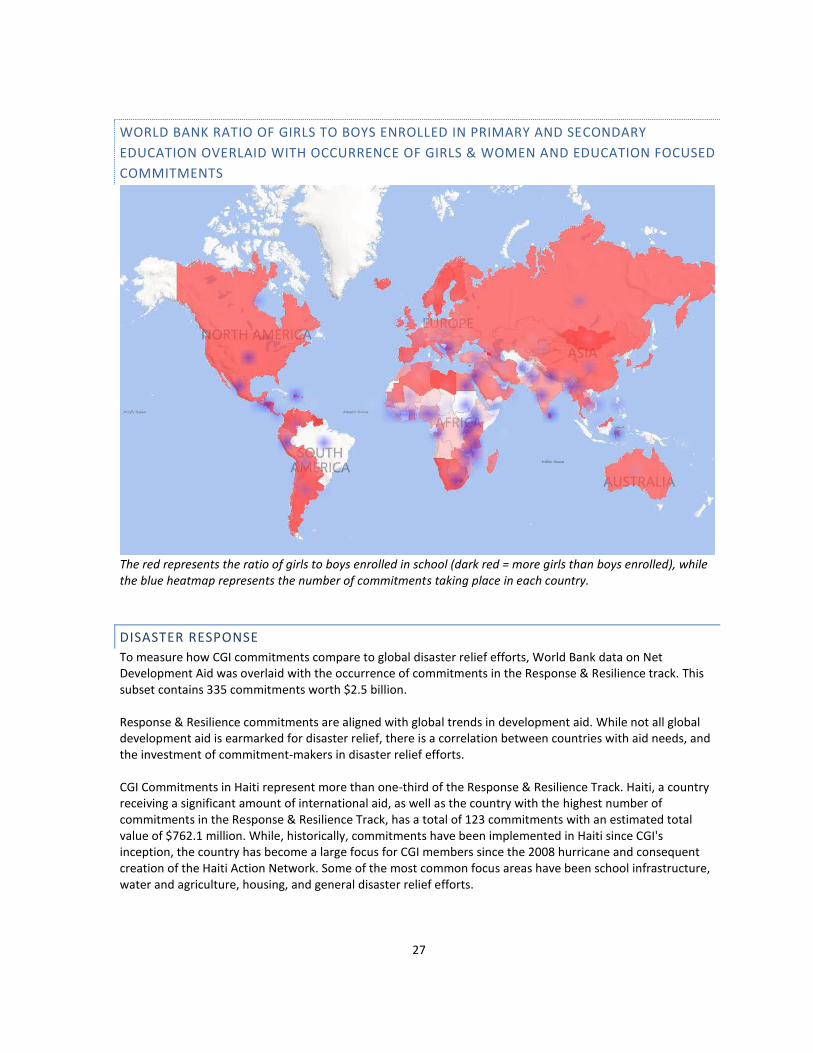
To analyze how CGI commitments measure as compared to the current status of girls' education globally, World Bank data on the ratio of girls to boys' school enrollment rates was overlaid with the number of completed and ongoing commitments that are tagged with the Girls/Women keyword and contained at least one keyword related to education; the following education keywords were used: Access to Education, Curriculum, Early Childhood, Educational Materials, Educator Training, Higher Education, K-12 Education, Literacy, Scholarships, School Infrastructure, Skills Development, STEM, or Quality Learning. This subset is composed of 282 commitments, with a total value of over $2.6 billion. Commitment-makers have worked to improve educational opportunities for girls and women in the United States, India, and Kenya more than any other countries. These three countries combined comprise 55% of the 282 Girls & Women commitments that have a strong Education focus. The United States has a one-to-one ratio of girls to boys' enrollment in primary and secondary school, and a total of 61 commitments worth $270.6 million. The top keywords for these commitments are: Skills Development, Jobs, and Access to Education. Both India and Kenya have ratios close to 1:1; in India there are 10% fewer girls than boys enrolled in primary and secondary school and in Kenya there are 4% few girls enrolled than boys. India has a total of 55 relevant commitments in this space, with an estimated total value of $319.6 million. The top keywords for these commitments are: Skills Development, Capacity Building, and Community-Based. Kenya has a total of 41 relevant commitments, with an estimated total value of $482.5 million. The top keywords for these commitments are: Skills Development, Capacity Building, and Community-Based. Example Commitments to Action:
Empowering Girls Through Education
Expanding the Global Give Back Circle
Tech Girls Rock
COUNTRIES WITH THE HIGHEST NUMBER OF COMMITMENTS
Country No. of Commitments % of Subset United States 61 21.6% India 55 19.5% Kenya 41 14.5% Rwanda 28 9.9% Brazil 25 8.9%
27
WORLD BANK RATIO OF GIRLS TO BOYS ENROLLED IN PRIMARY AND SECONDARY
EDUCATION OVERLAID WITH OCCURRENCE OF GIRLS & WOMEN AND EDUCATION FOCUSED
COMMITMENTS
The red represents the ratio of girls to boys enrolled in school (dark red = more girls than boys enrolled), while the blue heatmap represents the number of commitments taking place in each country.
DISASTER RESPONSE
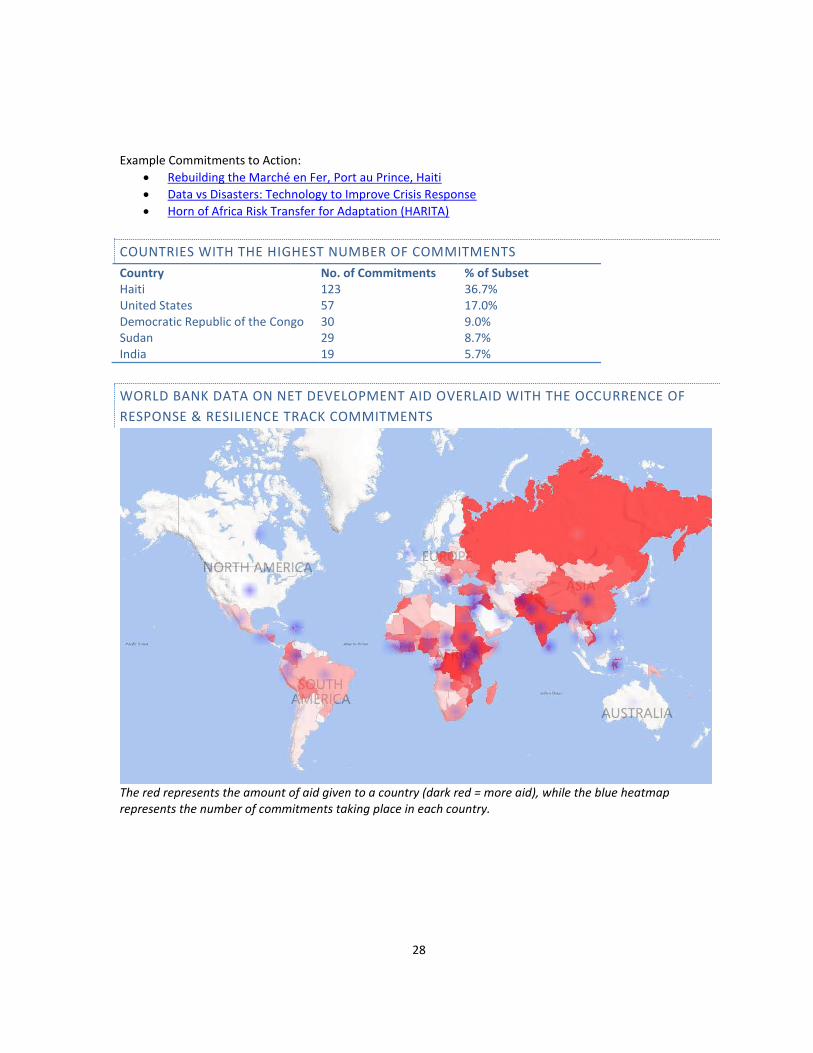
To measure how CGI commitments compare to global disaster relief efforts, World Bank data on Net Development Aid was overlaid with the occurrence of commitments in the Response & Resilience track. This subset contains 335 commitments worth $2.5 billion. Response & Resilience commitments are aligned with global trends in development aid. While not all global development aid is earmarked for disaster relief, there is a correlation between countries with aid needs, and the investment of commitment-makers in disaster relief efforts. CGI Commitments in Haiti represent more than one-third of the Response & Resilience Track. Haiti, a country receiving a significant amount of international aid, as well as the country with the highest number of commitments in the Response & Resilience Track, has a total of 123 commitments with an estimated total value of $762.1 million. While, historically, commitments have been implemented in Haiti since CGI's inception, the country has become a large focus for CGI members since the 2008 hurricane and consequent creation of the Haiti Action Network. Some of the most common focus areas have been school infrastructure, water and agriculture, housing, and general disaster relief efforts.
28
Example Commitments to Action:
Rebuilding the Marché en Fer, Port au Prince, Haiti
Data vs Disasters: Technology to Improve Crisis Response
Horn of Africa Risk Transfer for Adaptation (HARITA)
COUNTRIES WITH THE HIGHEST NUMBER OF COMMITMENTS
Country No. of Commitments % of Subset Haiti 123 36.7% United States 57 17.0% Democratic Republic of the Congo 30 9.0% Sudan 29 8.7% India 19 5.7%
WORLD BANK DATA ON NET DEVELOPMENT AID OVERLAID WITH THE OCCURRENCE OF
RESPONSE & RESILIENCE TRACK COMMITMENTS
The red represents the amount of aid given to a country (dark red = more aid), while the blue heatmap represents the number of commitments taking place in each country.
29
ENTREPRENEURSHIP
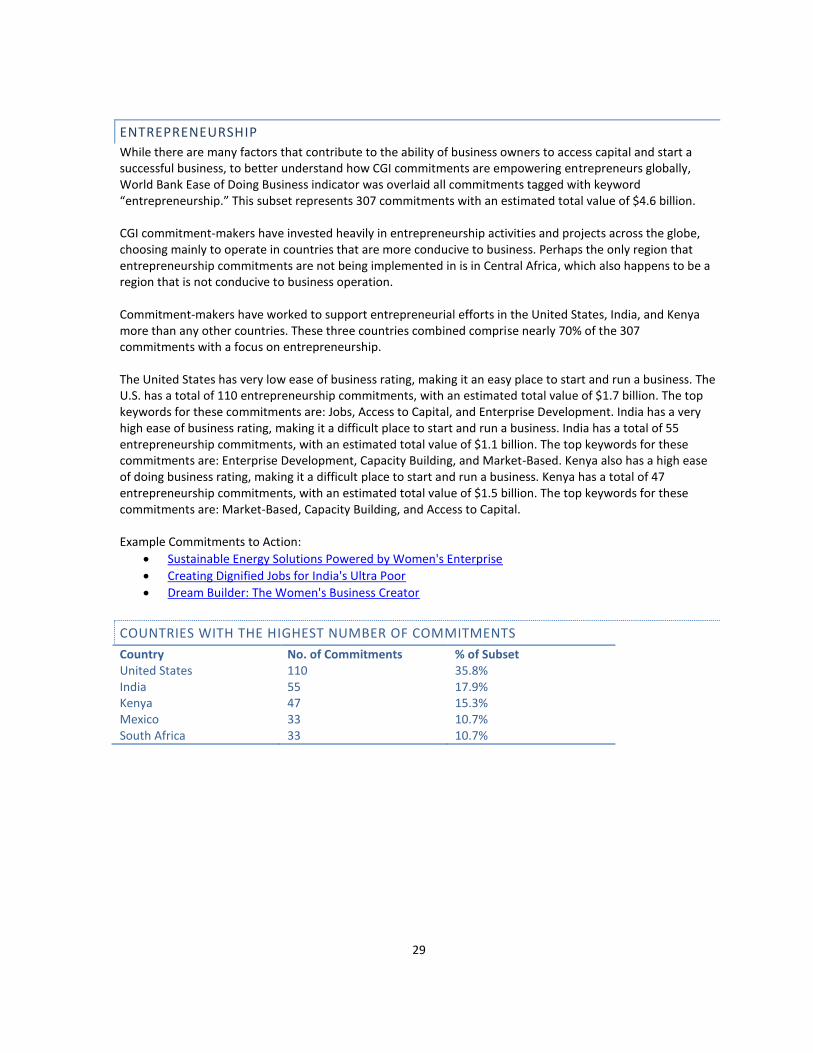
While there are many factors that contribute to the ability of business owners to access capital and start a successful business, to better understand how CGI commitments are empowering entrepreneurs globally, World Bank Ease of Doing Business indicator was overlaid all commitments tagged with keyword “entrepreneurship.” This subset represents 307 commitments with an estimated total value of $4.6 billion. CGI commitment-makers have invested heavily in entrepreneurship activities and projects across the globe, choosing mainly to operate in countries that are more conducive to business. Perhaps the only region that entrepreneurship commitments are not being implemented in is in Central Africa, which also happens to be a region that is not conducive to business operation. Commitment-makers have worked to support entrepreneurial efforts in the United States, India, and Kenya more than any other countries. These three countries combined comprise nearly 70% of the 307 commitments with a focus on entrepreneurship. The United States has very low ease of business rating, making it an easy place to start and run a business. The U.S. has a total of 110 entrepreneurship commitments, with an estimated total value of $1.7 billion. The top keywords for these commitments are: Jobs, Access to Capital, and Enterprise Development. India has a very high ease of business rating, making it a difficult place to start and run a business. India has a total of 55 entrepreneurship commitments, with an estimated total value of $1.1 billion. The top keywords for these commitments are: Enterprise Development, Capacity Building, and Market-Based. Kenya also has a high ease of doing business rating, making it a difficult place to start and run a business. Kenya has a total of 47 entrepreneurship commitments, with an estimated total value of $1.5 billion. The top keywords for these commitments are: Market-Based, Capacity Building, and Access to Capital. Example Commitments to Action:
Sustainable Energy Solutions Powered by Women's Enterprise
Creating Dignified Jobs for India's Ultra Poor
Dream Builder: The Women's Business Creator
COUNTRIES WITH THE HIGHEST NUMBER OF COMMITMENTS
Country No. of Commitments % of Subset United States 110 35.8% India 55 17.9% Kenya 47 15.3% Mexico 33 10.7% South Africa 33 10.7%
30
WORLD BANK DATA ON THE EASE OF DOING BUSINESS OVERLAID WITH THE OCCURRENCE
OF ENTREPRENEURSHIP COMMITMENTS
The red represents the level of ease (lighter = easier to do business), while the blue heatmap represents the number of entrepreneurship commitments taking place in each country.
HIV PREVALENCE
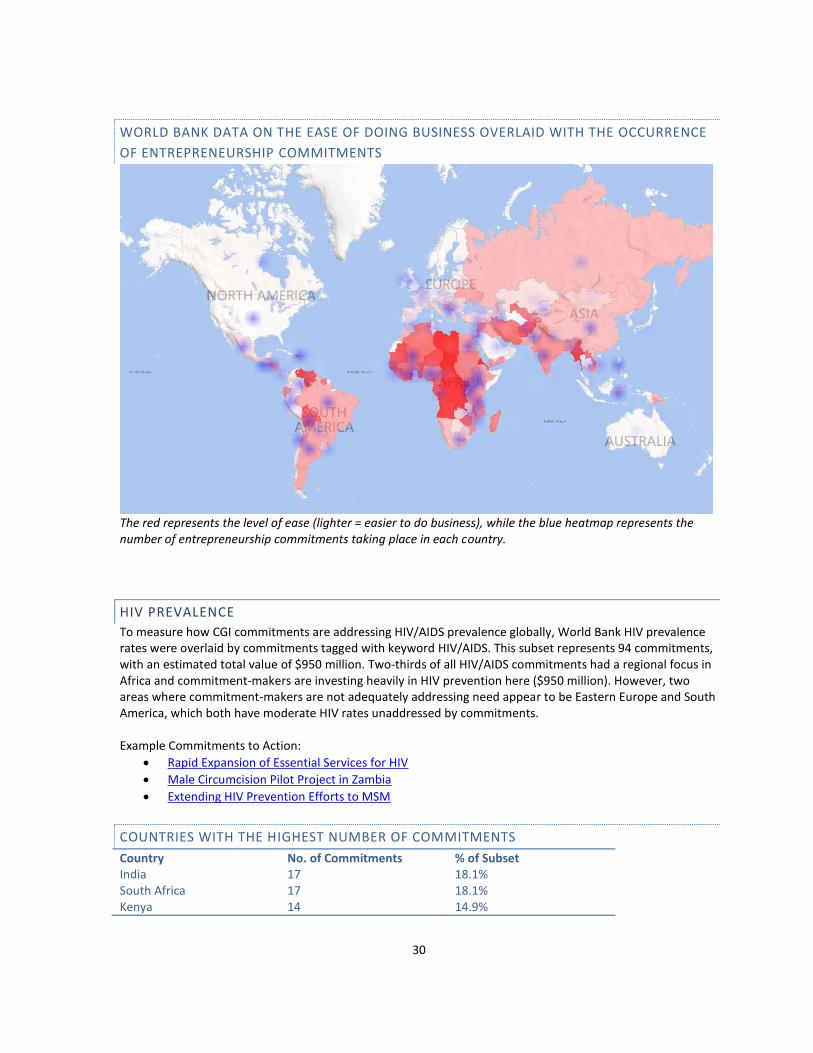
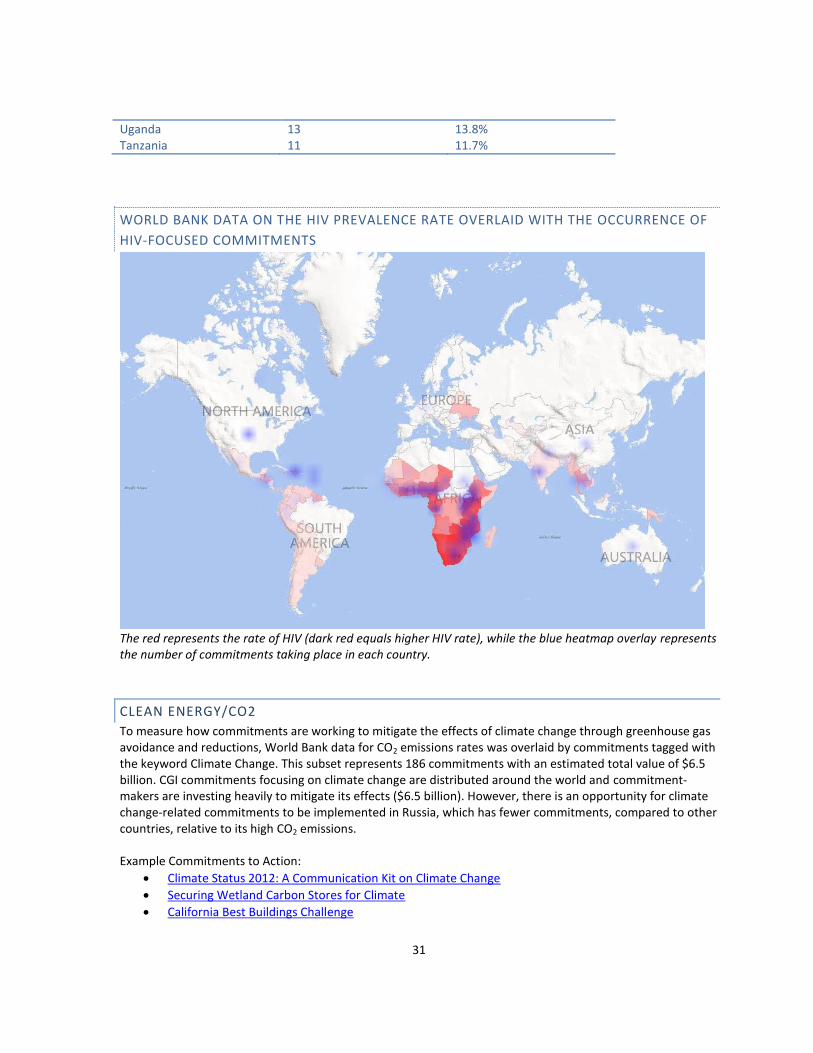
To measure how CGI commitments are addressing HIV/AIDS prevalence globally, World Bank HIV prevalence rates were overlaid by commitments tagged with keyword HIV/AIDS. This subset represents 94 commitments, with an estimated total value of $950 million. Two-thirds of all HIV/AIDS commitments had a regional focus in Africa and commitment-makers are investing heavily in HIV prevention here ($950 million). However, two areas where commitment-makers are not adequately addressing need appear to be Eastern Europe and South America, which both have moderate HIV rates unaddressed by commitments. Example Commitments to Action:
Rapid Expansion of Essential Services for HIV
Male Circumcision Pilot Project in Zambia
Extending HIV Prevention Efforts to MSM
COUNTRIES WITH THE HIGHEST NUMBER OF COMMITMENTS
Country No. of Commitments % of Subset India 17 18.1% South Africa 17 18.1% Kenya 14 14.9%
31
Uganda 13 13.8% Tanzania 11 11.7%
WORLD BANK DATA ON THE HIV PREVALENCE RATE OVERLAID WITH THE OCCURRENCE OF
HIV-FOCUSED COMMITMENTS
The red represents the rate of HIV (dark red equals higher HIV rate), while the blue heatmap overlay represents the number of commitments taking place in each country.
CLEAN ENERGY/CO2
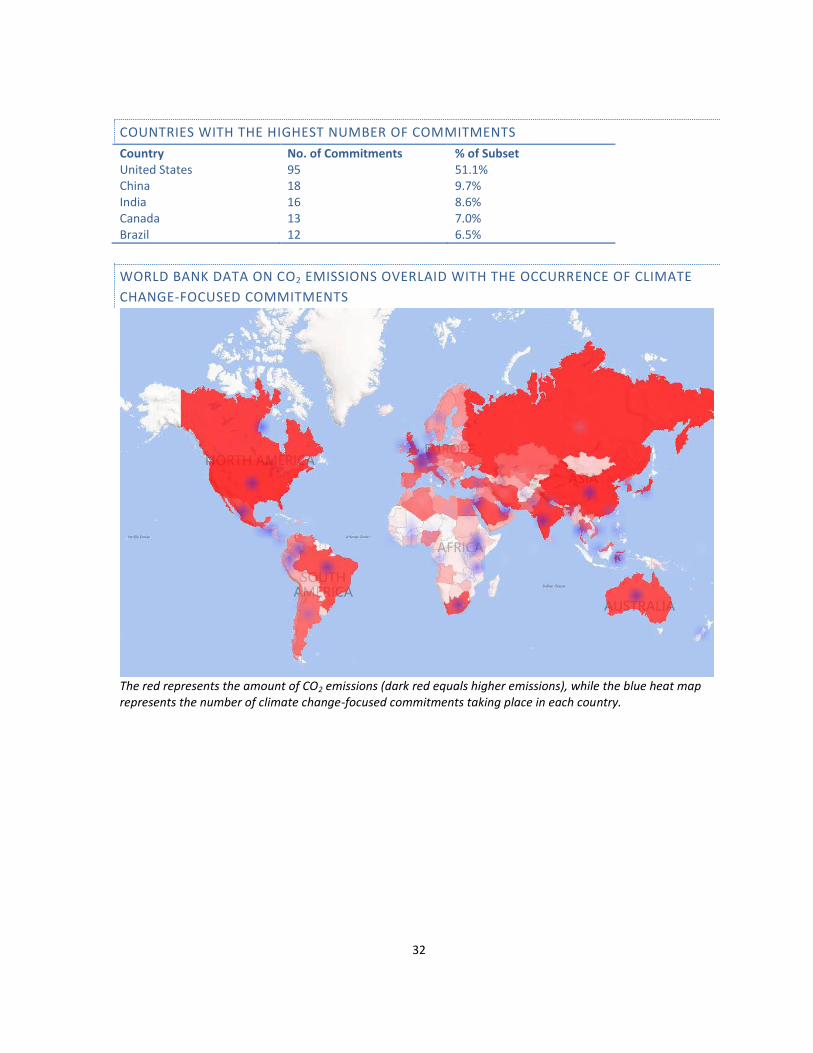
To measure how commitments are working to mitigate the effects of climate change through greenhouse gas avoidance and reductions, World Bank data for CO2 emissions rates was overlaid by commitments tagged with the keyword Climate Change. This subset represents 186 commitments with an estimated total value of $6.5 billion. CGI commitments focusing on climate change are distributed around the world and commitment-makers are investing heavily to mitigate its effects ($6.5 billion). However, there is an opportunity for climate change-related commitments to be implemented in Russia, which has fewer commitments, compared to other countries, relative to its high CO2 emissions. Example Commitments to Action:
Climate Status 2012: A Communication Kit on Climate Change
Securing Wetland Carbon Stores for Climate
California Best Buildings Challenge
32
COUNTRIES WITH THE HIGHEST NUMBER OF COMMITMENTS
Country No. of Commitments % of Subset United States 95 51.1% China 18 9.7% India 16 8.6% Canada 13 7.0% Brazil 12 6.5%
WORLD BANK DATA ON CO2 EMISSIONS OVERLAID WITH THE OCCURRENCE OF CLIMATE
CHANGE-FOCUSED COMMITMENTS
The red represents the amount of CO2 emissions (dark red equals higher emissions), while the blue heat map represents the number of climate change-focused commitments taking place in each country.
33
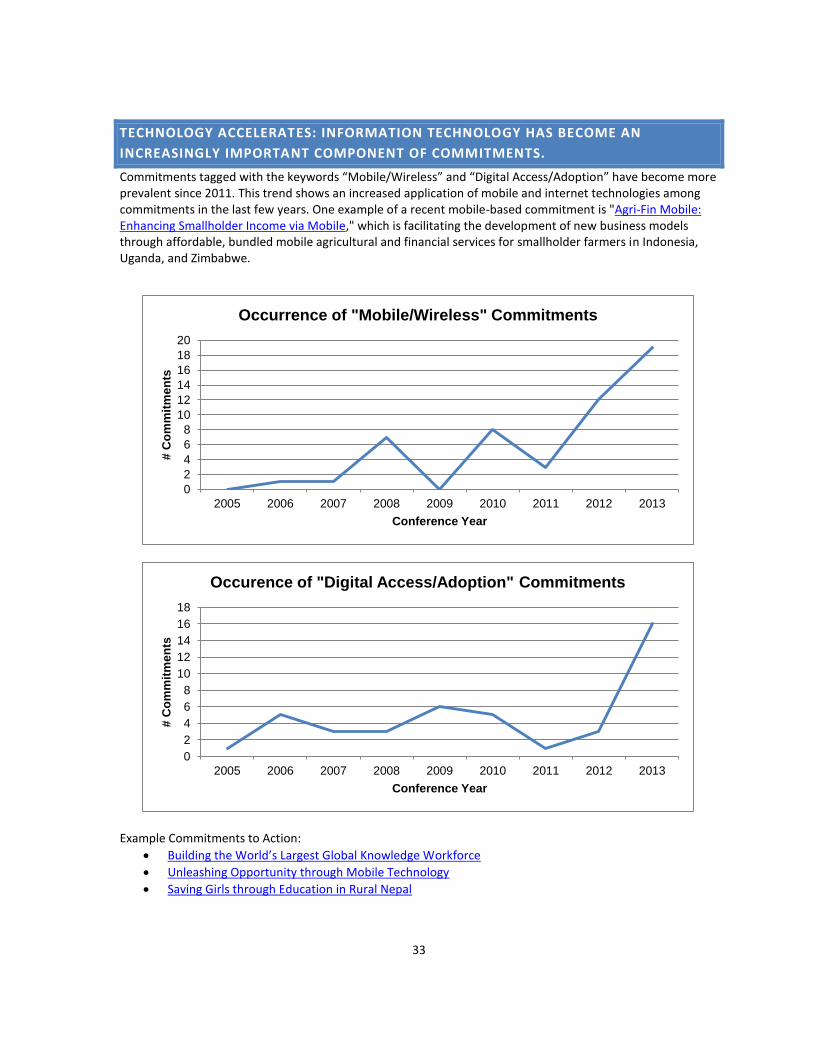
TECHNOLOGY ACCELERATES: INFORMATION TECHNOLOGY HAS BECOME AN
INCREASINGLY IMPORTANT COMPONENT OF COMMITMENTS.
Commitments tagged with the keywords “Mobile/Wireless” and “Digital Access/Adoption” have become more prevalent since 2011. This trend shows an increased application of mobile and internet technologies among commitments in the last few years. One example of a recent mobile-based commitment is "Agri-Fin Mobile: Enhancing Smallholder Income via Mobile," which is facilitating the development of new business models through affordable, bundled mobile agricultural and financial services for smallholder farmers in Indonesia, Uganda, and Zimbabwe.
Example Commitments to Action:
Building the World’s Largest Global Knowledge Workforce
Unleashing Opportunity through Mobile Technology
Saving Girls through Education in Rural Nepal
0
2
4
6
8
10
12
14
16
18
20
2005 2006 2007 2008 2009 2010 2011 2012 2013
# C
om
mit
me
nts
Conference Year
Occurrence of "Mobile/Wireless" Commitments
0
2
4
6
8
10
12
14
16
18
2005 2006 2007 2008 2009 2010 2011 2012 2013
# C
om
mit
me
nts
Conference Year
Occurence of "Digital Access/Adoption" Commitments
34
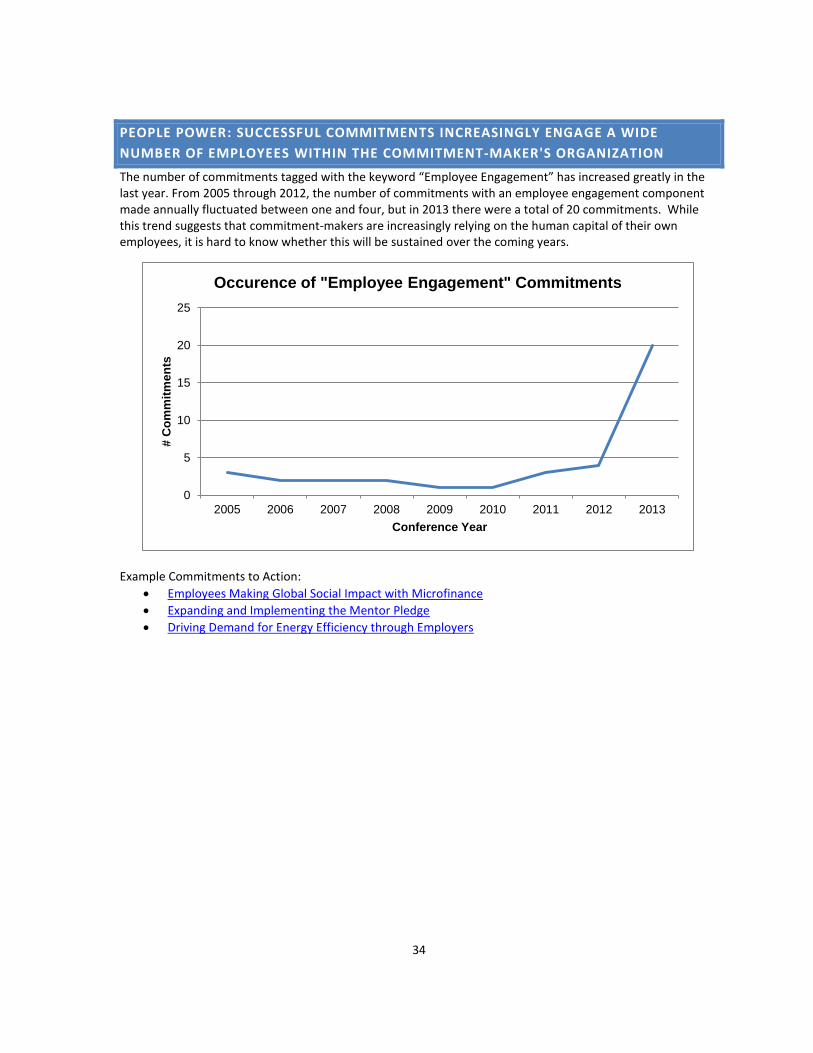
PEOPLE POWER: SUCCESSFUL COMMITMENTS INCREASINGLY ENGAGE A WIDE
NUMBER OF EMPLOYEES WITHIN THE COMMITMENT-MAKER'S ORGANIZATION
The number of commitments tagged with the keyword “Employee Engagement” has increased greatly in the last year. From 2005 through 2012, the number of commitments with an employee engagement component made annually fluctuated between one and four, but in 2013 there were a total of 20 commitments. While this trend suggests that commitment-makers are increasingly relying on the human capital of their own employees, it is hard to know whether this will be sustained over the coming years.
Example Commitments to Action:
Employees Making Global Social Impact with Microfinance
Expanding and Implementing the Mentor Pledge
Driving Demand for Energy Efficiency through Employers
0
5
10
15
20
25
2005 2006 2007 2008 2009 2010 2011 2012 2013
# C
om
mit
me
nts
Conference Year
Occurence of "Employee Engagement" Commitments