linskey way solidification/stabilization project case...
TRANSCRIPT

1
Linskey WayLinskey WaySolidification/StabilizationSolidification/StabilizationProject Case StudyProject Case Study
Presented by: Michael Bachand P.E.Presented by: Michael Bachand P.E.
Presentation OutlinePresentation Outline Background Investigation Program Solidification/Stabilization Bench Scale Testing Design
Design Constraints Proposed Layout
Construction Construction Sequence Monitoring Program Pilot Program Phase 1 and 2 Full Scale Production
Summary Questions

2
BackgroundBackground
The Massachusetts Department ofEnvironmental Protection (MA DEP) requiredmitigation of a DNAPL (Dense Non-AqueousPhase Liquid) layer under Linskey Way inCambridge, MA.
The site was previously used as amanufactured gas plant.
The site is located in an urban area under acity street.
The project involved solidifying/stabilizingapproximately 2,000 cubic yards of DNAPLmaterial.
BackgroundBackground
DNAPL layer rested at the bottom of a naturalsand stratum and on top of a low permeabilityclay stratum.
Material was located 15 to 20 feet belowexisting ground surface.
Thickness of impacted soil ranged between 1to 3 feet.
The impacted material was located along acity street under numerous utilities includinggas, water, sewer, electrical and stormwaterlines.

3
BackgroundBackground
BackgroundBackground

4
Investigation ProgramInvestigation Program
A subsurface investigation program wascarried out on 10/17/2006 to collect samplesto be used in the bench scale program.
Three test borings were advanced at the sitedown to a depth of 30 feet below groundsurface.
Investigation Program Investigation Program –– Boring BoringLocation PlanLocation Plan
CDM Borings

5
Investigation Program Investigation Program –– Soil Profile Soil Profile
Investigation ProgramInvestigation Program
During the investigationprocess, 3-inch diametersplit spoons wereadvanced to increasesample quantity.
DNAPL was detected inthe split spoon samplescollected as shown.
6
Solidification/Stabilization Bench ScaleSolidification/Stabilization Bench ScaleTestingTesting
Prepared three mixes: Mix 1 – 8% Cement and 2% Bentonite Mix 2 – 10% Cement and 4% Bentonite Mix 3 – 12% Cement and 4% Bentonite
Used: Soil proportioned by strata thickness Cement - Type 1 Portland Cement Bentonite - Premium grade natural untreated sodium cation
Tested permeability and DNAPL mobility (10 and 28 day) foreach mix.
Solidification/Stabilization BenchscaleSolidification/Stabilization BenchscaleTestingTesting
The intent of the test was to determine theoptimum mix required to eliminate themobility of the DNAPL in the grout-soil mixduring the field program.
Prepare mix similar to the proposedconstruction process.
All mixes were tested using ASTM D 425 – todetermine success.

7
Permeability ResultsPermeability Results
Bench Scale ResultsBench Scale Results
Optimum jet grout mix was determined tohave a minimum cement ratio of 10% and abentonite ratio of 4% by weight of the jetgrout/soil matrix
Proportion and injection was determined tocreate grout columns with maximum target 7-day permeability of 1 x 10⁻⁶ cm/sec

8
Summary of Centrifuge TestingSummary of Centrifuge Testing
All mixes passed centrifuge tests.
Design ConstraintsDesign Constraints
Avoid impact to utilities. Avoid encroachment on or under adjacent
buildings. Contractor staging and prep areas were
within city streets.

9
Design Design –– Proposed Layout Proposed Layout
DesignDesign
10
Construction SequenceConstruction Sequence
Pre-clear all jet grout hole locations Install monitoring points Perform pilot program Perform full scale jet grouting
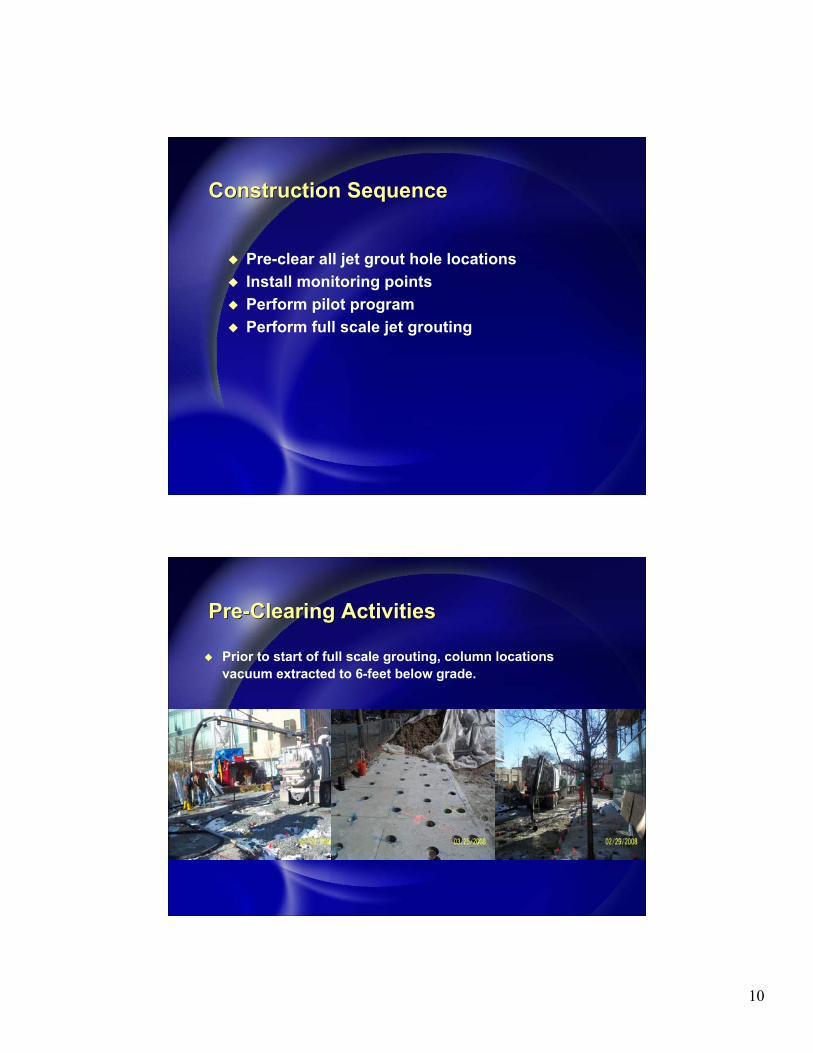
Pre-Clearing ActivitiesPre-Clearing Activities
Prior to start of full scale grouting, column locationsvacuum extracted to 6-feet below grade.

11
Monitoring ProgramMonitoring Program
Install utility and surface monitoring points. Required to monitor utilities within a 50-foot active
radius.
Monitoring ProgramMonitoring Program
Deformation monitoring points assignedthreshold levels of 0.125-inches
Ground surface monitoring points assignedthreshold levels of 0.25-inches.
Thermal expansion limits were 0.06-inches.

12
Monitoring Program Monitoring Program –– Utility Layout Utility Layout
Gas Line
Electrical LineSewer LineWater Line
Construction Construction –– Pilot Program Phase 1 Pilot Program Phase 1and 2and 2
The Phase 1 program was implemented todetermine : Optimum grout mix Radius of influence of the grout columns
The Phase 2 pilot program was implementedto increase the radius of influence of thegrout columns by: Increasing the grout pressure Reducing the rotation rate Reducing the lift rate

13
Construction Construction –– Full Scale Production Full Scale Production
Construction Construction –– Full Scale Production Full Scale Production
Geo-Con was contracted to install the groutcolumns at the site.
Full scale production commenced on03/10/2008.
Grout column diameter was set at 3.7 feet. Center to center spacing was 3.12 feet.

14
Construction Construction –– Full Scale Production Full Scale Production Final layout of grouted columns
SummarySummary
The full scale grouting phase tookapproximately 6 weeks to complete.
Of the 699 columns planned, 568columns were installed.
96 columns could not be installeddue to underlying obstructions andcould not be moved, 35 columnswere located outside the property.

15
Summary - Differential Movement Chart; Gas LinesSummary - Differential Movement Chart; Gas Lines
Summary Summary –– Total Movement Chart; Gas Lines Total Movement Chart; Gas Lines

16
Summary Summary –– Differential Movement Chart; Other Utilities Differential Movement Chart; Other Utilities(Water, Sanitary Sewer, Electrical)(Water, Sanitary Sewer, Electrical)
Summary Summary –– Total Movement Chart; Other Utilities Total Movement Chart; Other Utilities(Water, Sanitary Sewer, Electrical)(Water, Sanitary Sewer, Electrical)

17
Summary Summary –– Differential Movement Chart; Differential Movement Chart;Ground Surface Monitoring PointsGround Surface Monitoring Points
Summary Summary –– Total Movement Chart; Ground Total Movement Chart; GroundSurface Monitoring PointsSurface Monitoring Points

18
SummarySummary Setbacks encountered during the program
include: Discovery of abandoned high pressure
gas lines. Discovery of a buried railroad track.
Based on utility monitoring data, no totalmovement in utilities observed during theconstruction phase. Only movementobserved was mostly due to thermalexpansion.
After completion of the project, pavement andsidewalk were restored to original condition.
SummarySummary
Current condition of thesite

19
Questions?Questions?