linkedin q1 2015 earnings call
TRANSCRIPT
Q1’15 ResultsApril 2015
Safe harbor
2
“Safe Harbor” statement under the Private Securities Litigation Reform Act of 1995: This presentation and the accompanying conference call contain forward-looking statements about our products, including our investments in products, technology and other key strategic areas, certain non-financial metrics, such as customer and member growth and engagement, and our expected financial metrics such as revenue, adjusted EBITDA, non-GAAP EPS, depreciation and amortization, stock-based compensation and fully-diluted weighted shares for the second quarter of 2015 and the full fiscal year 2015. The achievement of the matters covered by such forward-looking statements involves risks, uncertainties and assumptions. If any of these risks or uncertainties materialize or if any of the assumptions prove incorrect, the company’s results could differ materially from the results expressed or implied by the forward-looking statements the company makes.
The risks and uncertainties referred to above include - but are not limited to - risks associated with: our limited operating history in a new and unproven market; engagement of our members; the price volatility of our Class A common stock; general economic conditions; expectations regarding the return on our strategic investments; execution of our plans and strategies, including with respect to mobile products and features; security measures and the risk that they may not be sufficient to secure our member data adequately or that we are subject to attacks that degrade or deny the ability of members to access our solutions; expectations regarding our ability to timely and effectively scale and adapt existing technology and network infrastructure to ensure that our solutions are accessible at all times with short or no perceptible load times; our ability to maintain our rate of revenue growth and manage our expenses and investment plans; our ability to accurately track our key metrics internally; members and customers curtailing or ceasing to use our solutions; our core value of putting members first, which may conflict with the short-term interests of the business; privacy and changes in regulations, which could impact our ability to serve our members or curtail our monetization efforts; litigation and regulatory issues; increasing competition; our ability to manage our growth; our international operations; our ability to recruit and retain our employees; the application of U.S. and international tax laws on our tax structure and any changes to such tax laws; acquisitions we have made or may make in the future; and the dual class structure of our Class A common stock.
Further information on these and other factors that could affect the company’s financial results is included in filings it makes with the Securities and Exchange Commission from time to time, including the section entitled “Risk Factors” in the company’s Annual Report on Form 10-K for the year ended December 31, 2014, and additional information will also be set forth in our Form 10-Q that will be filed for the quarter ended March 31, 2015, which should be read in conjunction with these financial results. These documents are or will be available on the SEC Filings section of the Investor Relations page of the company's website at http://investors.linkedin.com/. All information provided in this presentation is as of April 30, 2015, and LinkedIn undertakes no duty to update this information.

Connectwith your
professional world
Get hiredand build your
career
Our member value propositions
3
Stay informedthrough professional news and knowledge
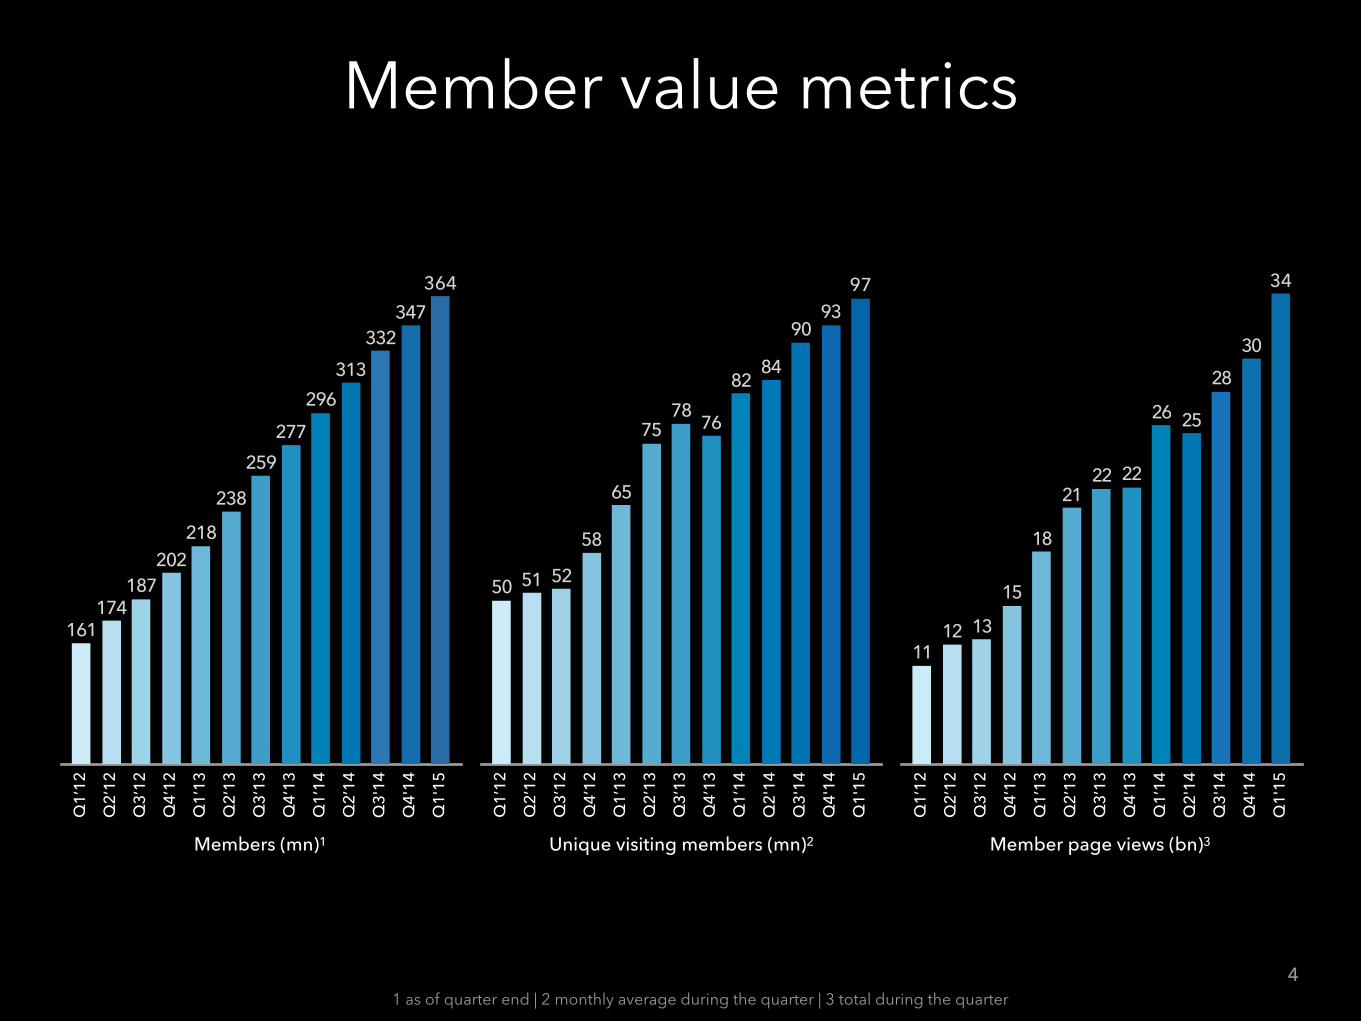
Member value metrics
4
Members (mn)1 Unique visiting members (mn)2
Q1’
12
Q2’
12
Q3’
12
Q4’
12
Q1’
13
Q2’
13
Q3’
13
Q4’
13
Q1’
14
Q2’
14
Q3'
14
Q4'
14
Q1'
15
364347
332
313
296
277
259
238
218202
187174
161
Q1’
12
Q2’
12
Q3’
12
Q4’
12
Q1’
13
Q2’
13
Q3’
13
Q4’
13
Q1’
14
Q2'
14
Q3'
14
Q4'
14
Q1'
15
9793
90
8482
7678
75
65
58
525150
Q1’
12
Q2’
12
Q3’
12
Q4’
12
Q1’
13
Q2’
13
Q3’
13
Q4’
13
Q1’
14
Q2'
14
Q3'
14
Q4'
14
Q1'
15
34
30
28
2526
222221
18
15
131211
Member page views (bn)3
1 as of quarter end | 2 monthly average during the quarter | 3 total during the quarter

Our customer value propositions
5
Hire SellMarket
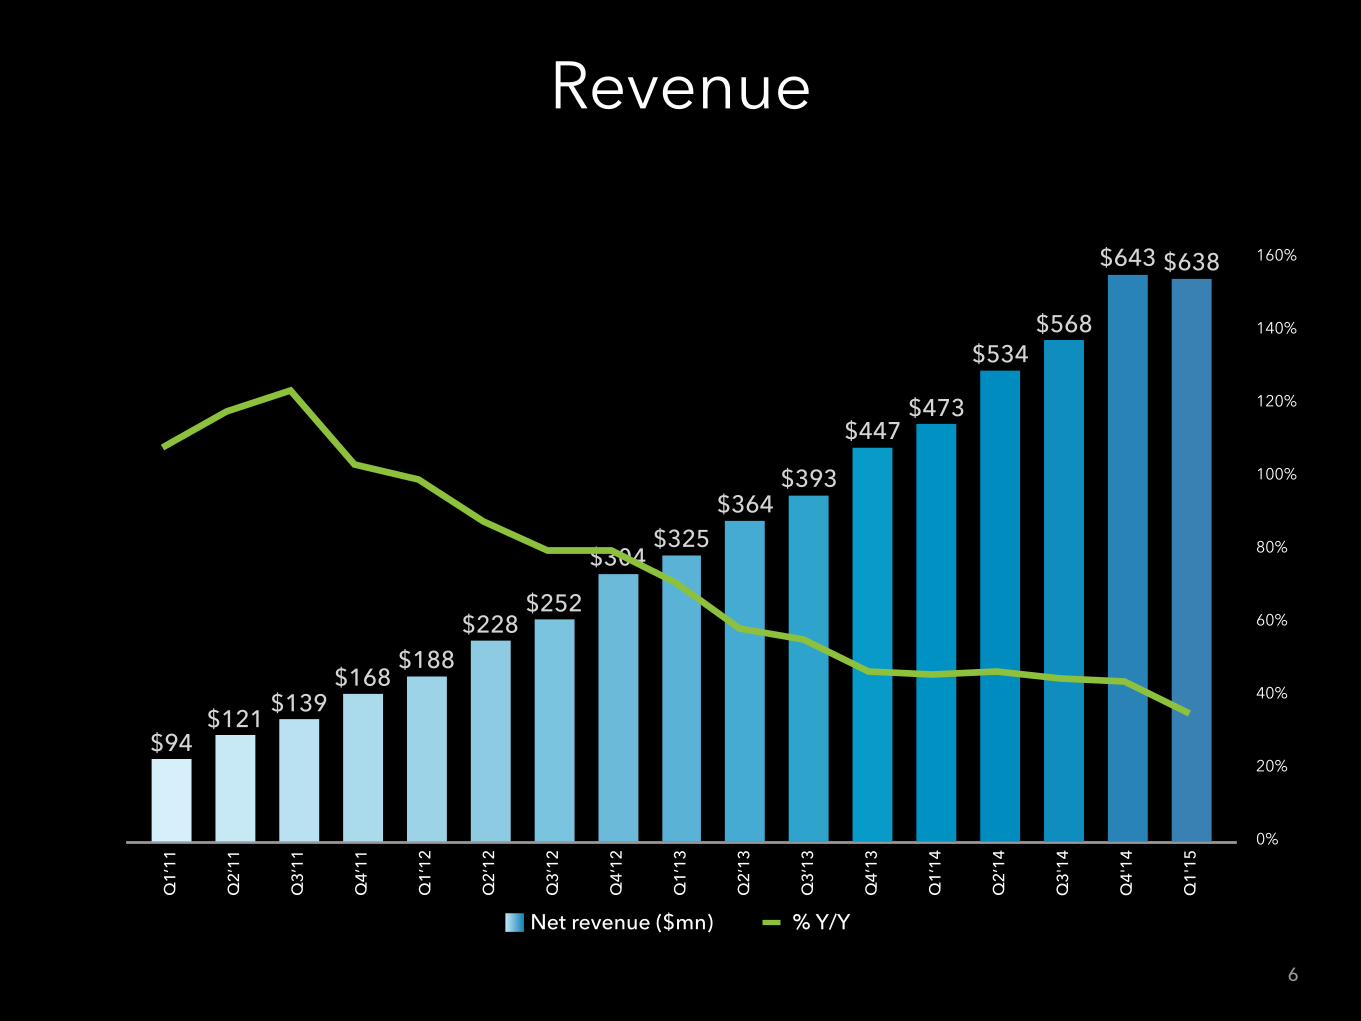
RevenueQ
1’11
Q2’
11
Q3’
11
Q4’
11
Q1’
12
Q2’
12
Q3’
12
Q4’
12
Q1’
13
Q2’
13
Q3’
13
Q4’
13
Q1’
14
Q2’
14
Q3'
14
Q4'
14
Q1'
15
$638$643
$568$534
$473$447
$393$364
$325$304
$252$228
$188$168
$139$121
$94
% Y/YNet revenue ($mn)
0%
20%
40%
60%
80%
100%
120%
140%
160%
6
Q1’
11
Q2’
11
Q3’
11
Q4’
11
Q1’
12
Q2’
12
Q3’
12
Q4’
12
Q1’
13
Q2’
13
Q3’
13
Q4’
13
Q1’
14
Q2'
14
Q3'
14
Q4'
14
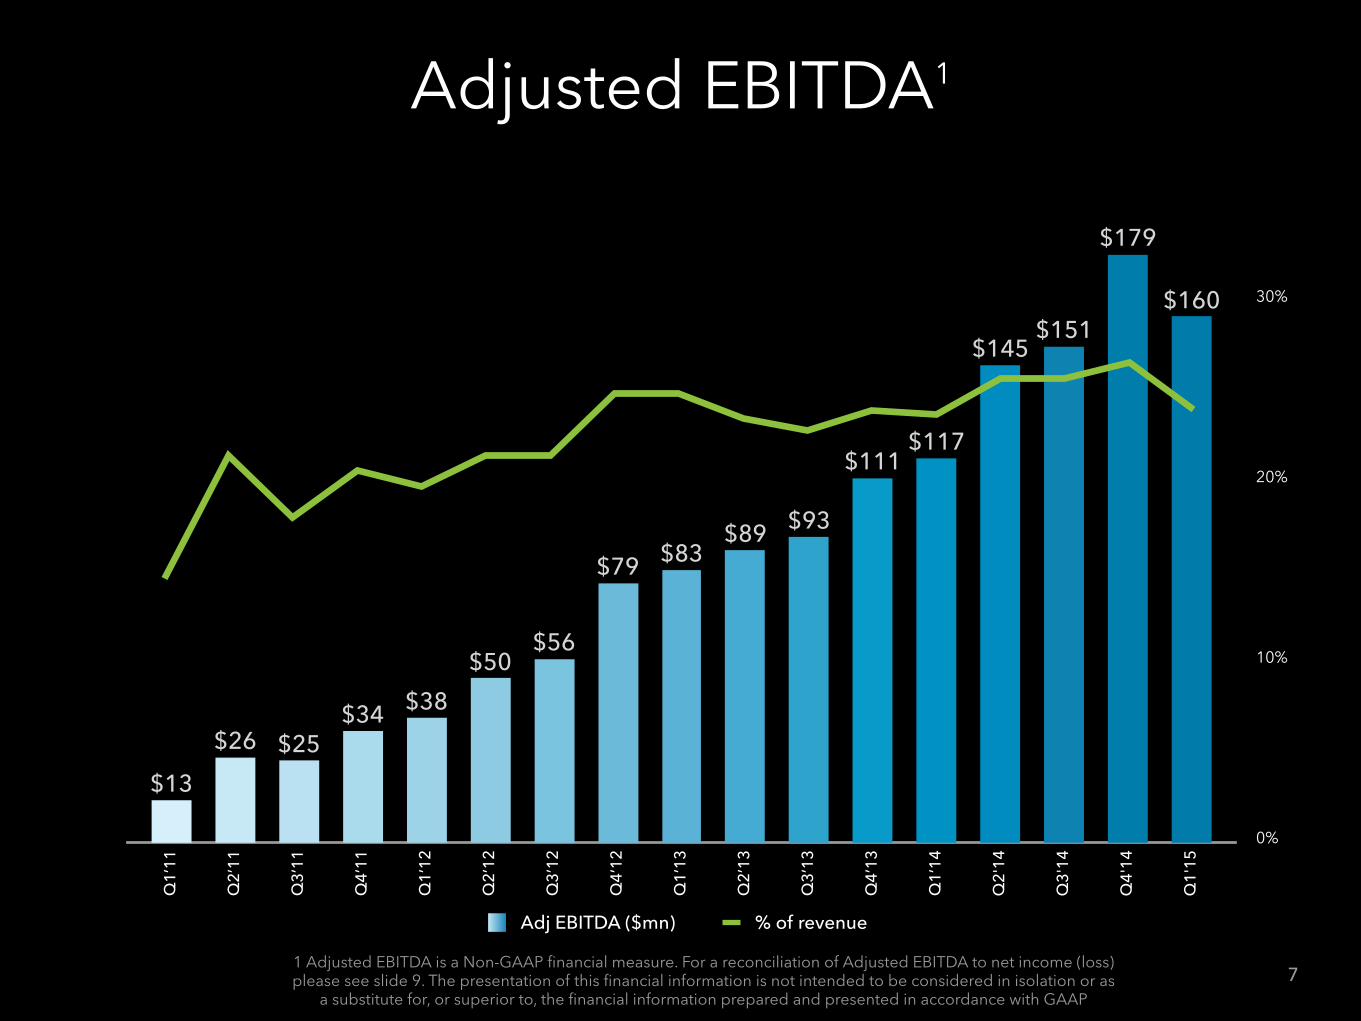
Q1'
15
$160
$179
$151$145
$117$111
$93$89$83$79
$56$50
$38$34$25$26
$13
Adjusted EBITDA1
% of revenueAdj EBITDA ($mn)
0%
10%
20%
30%
71 Adjusted EBITDA is a Non-GAAP financial measure. For a reconciliation of Adjusted EBITDA to net income (loss) please see slide 9. The presentation of this financial information is not intended to be considered in isolation or as
a substitute for, or superior to, the financial information prepared and presented in accordance with GAAP

Guidance1,2
Q2 2015 FY 2015
Revenue $670-675 ~$2,900
Adjusted EBITDA ~$120 ~$630
Non-Gaap EPS ~$0.28 ~$1.90
1 All guidance figures are approximate values | 2 Values are in $ millions except for non-GAAP EPS | 3 Q2’15 Adj EBITDA guidance assumes depreciation of ~$68m, amortization of ~$24m, stock-based comp of ~$144m & FY15 Adj EBITDA
guidance assumes depreciation of ~$290m, amortization of ~$128m, and stock-based comp of ~$500m. 8
3
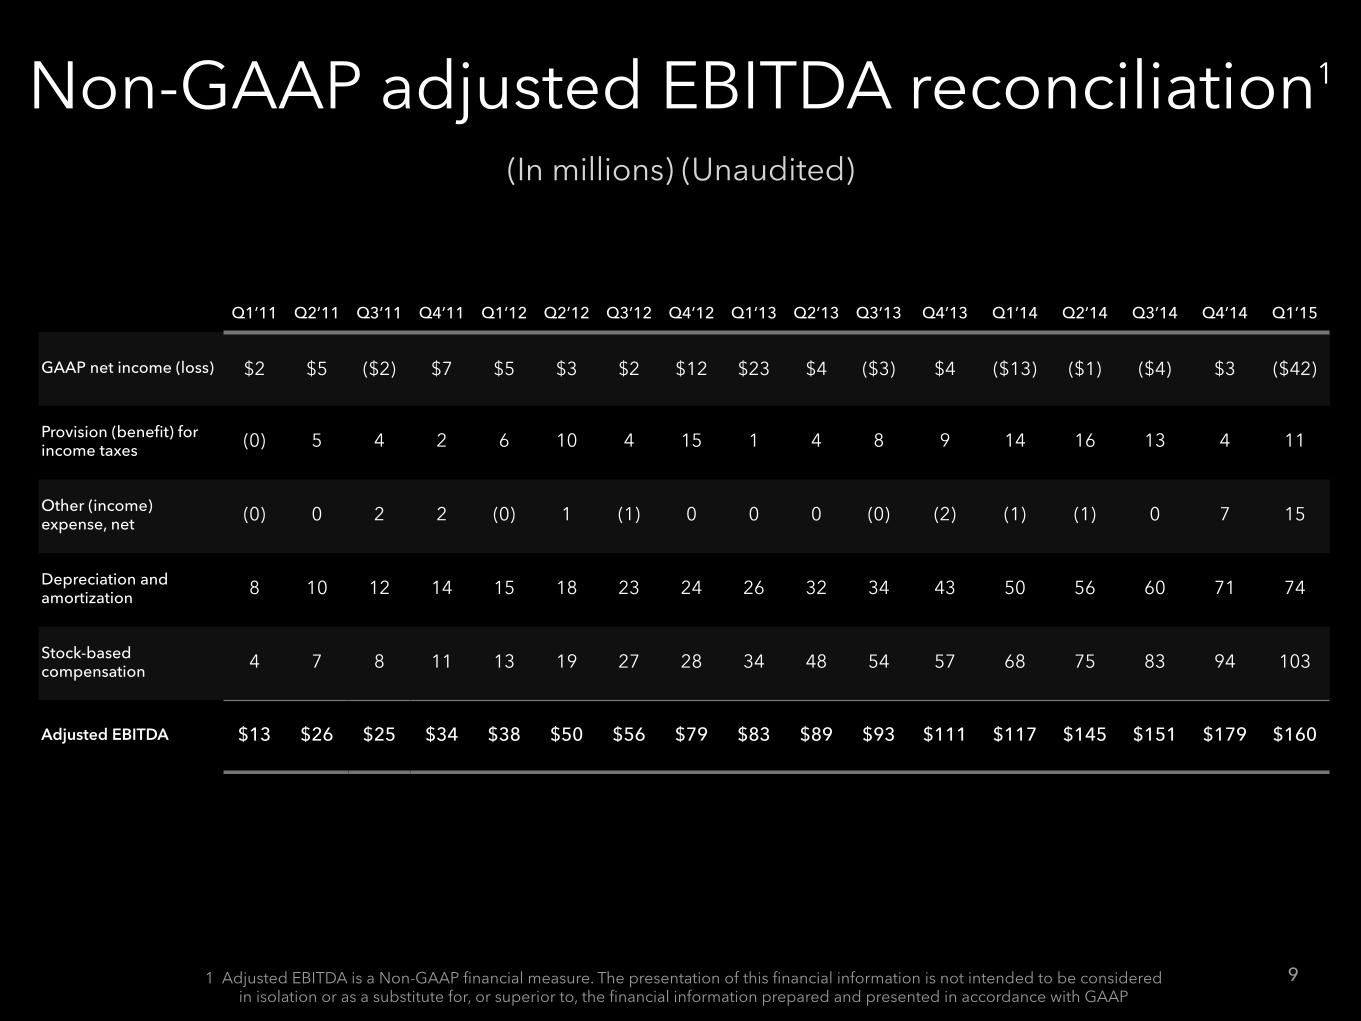
Non-GAAP adjusted EBITDA reconciliation1
Q1’11 Q2’11 Q3’11 Q4’11 Q1’12 Q2’12 Q3’12 Q4’12 Q1’13 Q2’13 Q3’13 Q4’13 Q1’14 Q2’14 Q3’14 Q4’14 Q1’15
GAAP net income (loss) $2 $5 ($2) $7 $5 $3 $2 $12 $23 $4 ($3) $4 ($13) ($1) ($4) $3 ($42)
Provision (benefit) for income taxes (0) 5 4 2 6 10 4 15 1 4 8 9 14 16 13 4 11
Other (income) expense, net (0) 0 2 2 (0) 1 (1) 0 0 0 (0) (2) (1) (1) 0 7 15
Depreciation and amortization 8 10 12 14 15 18 23 24 26 32 34 43 50 56 60 71 74
Stock-based compensation 4 7 8 11 13 19 27 28 34 48 54 57 68 75 83 94 103
Adjusted EBITDA $13 $26 $25 $34 $38 $50 $56 $79 $83 $89 $93 $111 $117 $145 $151 $179 $160
9
(In millions) (Unaudited)
1 Adjusted EBITDA is a Non-GAAP financial measure. The presentation of this financial information is not intended to be considered in isolation or as a substitute for, or superior to, the financial information prepared and presented in accordance with GAAP

©2015 LinkedIn Corporation. All Rights Reserved.