linkage disequilibrium between single nucleotide ... | investigation linkage disequilibrium between...
TRANSCRIPT
GENETICS | INVESTIGATION
Linkage disequilibrium between single nucleotidepolymorphisms and hypermutable loci
Sterling Sawaya∗,1, Matt Jones§ and Matt Keller∗∗Institute for Behavioral Genetics, University of Colorado, Boulder, CO 80302, USA, §Department of Psychology and Neuroscience, University of Colorado,
Boulder, CO 80302, USA
ABSTRACT Some diseases are caused by genetic loci with a high rate of change, and heritability in complex traits islikely to be partially caused by variation at these loci. These hypermutable elements, such as tandem repeats, changeat rates that are orders of magnitude higher than the rates at which most single nucleotides mutate. However, singlenucleotide polymorphisms, or SNPs, are currently the primary focus of genetic studies of human disease. Here wequantify the degree to which SNPs are correlated with hypermutable loci, examining a range of mutation rates thatcorrespond to mutation rates at tandem repeat loci. We use established population genetics theory to relate mutationrates to recombination rates and compare the theoretical predictions to simulations. Both simulations and theory agreethat, at the highest mutation rates, almost all correlation is lost between a hypermutable locus and surrounding SNPs.The theoretical predictions break down for middle to low mutation rates, differing widely from the simulated results. Thesimulation results suggest that some correlation remains between SNPs and hypermutable loci when mutation rates areon the lower end of the mutation spectrum. Consequently, in some cases SNPs can tag variation caused by tandem repeatloci. We also examine the linkage between SNPs and other SNPs and uncover ways in which the linkage disequilibriumof rare SNPs differs from that of hypermutable loci.
KEYWORDS Linkage Disequilibrium, Hypermutability, Tandem Repeats, Missing Heritability, Population Genetics
Introduction
Missing heritability and hypermutable lociMutation can take many forms, and can occur at vastly differentrates across the human genome (Rando and Verstrepen 2007).Hypermutable regions composed of tandem repeats are ofparticular interest because of the way in which they mutate.Tandem repeats expand and contract in repeat number at arate that is orders of magnitude higher than the rate of singlenucleotide point mutations (Ellegren 2004; Kelkar et al. 2008;Sun et al. 2012; Whittaker et al. 2003). These regions are ableto mutate new alleles and then revert to their original form,all while maintaining their ability to expand and contract.Therefore, not only are many of these loci highly polymor-
Copyright © 2015 by the Genetics Society of Americadoi: 10.1534/genetics.XXX.XXXXXXManuscript compiled: Saturday 13th June, 2015%1Institute for Behavioral Genetics, University of Colorado Boulder, 1480 30th St.Boulder, CO 80303. Email:[email protected]
phic, but their alleles can often be identical-by-state and notidentical-by-descent. Furthermore, tandem repeats are the mostcommon hypermutable loci in the human genome (Ellegren2004; Rando and Verstrepen 2007), and are often found inregions of functional significance (Sawaya et al. 2013).
The rates of expansion and contraction at tandem repeatsare known to depend on the length of the tandem repeats, thesize of the repeated subunit and the sequence composition. Themost mutable are tandem repeats composed of short subunits,called microsatellites (also known as short tandem repeats, orsimple sequence repeats). These repeats can have mutationrates up to 10−2 (Ellegren 2004), but most have rates between10−3 and 10−5 (Whittaker et al. 2003; Kelkar et al. 2008; Sun et al.2012). The most hypermutable microsatellites tend to have ahigh A/T content and have a large number of repeated subunits.Because long microsatellites have a tendency to contract moreoften than they expand (Xu et al. 2000), microsatellites undergo alifecycle in which they are “born” and “die” in the genome overevolutionary time (Kelkar et al. 2008; Buschiazzo and Gemmell
Genetics, Vol. XXX, XXXX–XXXX June 2015 1
.CC-BY-NC-ND 4.0 International licensepeer-reviewed) is the author/funder. It is made available under aThe copyright holder for this preprint (which was not. http://dx.doi.org/10.1101/020909doi: bioRxiv preprint first posted online Jun. 15, 2015;
2010).
Tandem repeats composed of subunits greater than ninebase pairs are called minisatellites. Unlike microsatellites, thesetandem repeats are not known for their extreme mutability.Their mutation rates are not as well documented (Gemayelet al. 2010), but a method to estimate their relative mutationrates is available (Legendre et al. 2007). Minisatellites arethought to expand and contract in repeat number throughrecombination (Jeffreys et al. 1998), in contrast to microsatelliteswhich mutate primarily through polymerase slippage andsubsequent mismatch repair (Ellegren 2004; Baptiste et al. 2013).
Tandem repeat alleles are associated with a range ofhuman diseases (Hannan 2010; Gemayel et al. 2010). Of thesediseases, perhaps the most well known are caused by expandedmicrosatellites: Fragile-X disease caused by an expanded CGGrepeat (Verkerk et al. 1991), and Huntingon’s disease causedby an expanded CAG repeat (MacDonald et al. 1993). Both ofthese repeats are found in promoters, functional regions nearthe start of a gene. Promoters have a relatively high density oftandem repeats, suggesting that these hypermutable sequencesmay play a role in regulating gene expression (Vinces et al. 2009;Sawaya et al. 2013).
Although tandem repeats are potential sources of heritabledisease, recent attention has focused on SNPs for geneticassociation studies due to technology that allows them to beinexpensively and rapidly genotyped genome-wide. CommonSNP variants can be used to measure genome-wide relatedness,and this relatedness can explain a moderate portion of theheritability for complex traits (Yang et al. 2011). However, manySNP studies have failed to uncover variants with significantassociations (Maher 2008). Furthermore, even SNPs with thestrongest associations can only explain a small fraction ofheritable genetic variation (Manolio et al. 2009).
This lack of significant GWAS hits has been referred to as“missing heritability” (Maher 2008; Manolio et al. 2009), and theheritability still not explained by modeling all genome-wideSNPs simultaneously has been termed the “still-missingheritability” (Witte et al. 2014; Wray et al. 2014). Tandemrepeats have been hypothesized to be partially responsiblefor missing heritability (Hannan 2010; Press et al. 2014), andmay also be partially responsible for some of the still-missingheritability. Due to their high mutability, tandem repeatscan mutate away from linkage with surrounding SNPs, andtherefore SNP association studies are not expected to pick upall of the heritability caused by hypermutable variants. Studiesusing large numbers of tandem repeat loci have shown thattandem repeat variants are usually very weakly linked withsurrounding SNPs (Willems et al. 2014; Payseur et al. 2008;Brahmachary et al. 2014). These studies highlight how SNP datacan be uninformative about tandem repeat variation, providingfurther support for the hypothesis that missing heritabilitymight be caused by these hypermutable loci (Willems et al. 2014).
However, not all tandem repeat variants are weaklytagged by SNPs. A recent genome wide association study ofamyotrophic lateral sclerosis (ALS) in the Finnish population(Laaksovirta et al. 2010) uncovered a microsatellite tandemrepeat as the most prevalent cause of familial ALS found to
date (DeJesus-Hernandez et al. 2011). In the C9ORF72 gene,expansion of a CCGGGG repeat in the first intron resultsin a dominant allele that causes ALS and can also causefrontal-temporal dementia (DeJesus-Hernandez et al. 2011).The expanded repeat allele is in strong linkage disequilibriumwith surrounding SNPs (Laaksovirta et al. 2010; Mok et al. 2012;Majounie et al. 2012). Studies of the associated haplotype revealthat the expanded repeat likely arose only once (Mok et al. 2012;Majounie et al. 2012) and then spread around the globe, possiblyalong with Viking conquests (Pliner et al. 2014). This discoverydemonstrates that tandem repeat diseases can be uncoveredfrom SNP association studies.
The 5HTTLPR gene provides another example of how SNPscan be associated with functional tandem repeat variants.Variation in a minisatellite within the 5HTTLPR promotermay be associated with a range of personality phenotypes andneurological diseases (Lesch et al. 1996; Wray et al. 2009). TwoSNPs adjacent to the promoter repeat are in strong linkagedisequilibrium with the repeat alleles that have been associatedwith disease (r2=0.72; Wray et al. (2009)).
Together, these studies raise the possibility that more tandemrepeat alleles can be uncovered as sources of disease usingSNP data. But how quickly do tandem repeats need to mutateto lose their linkage with SNPS and therefore be hidden inSNP association studies? Due to the size of their repeatedsubunit and their C/G content, the C9ORF72 repeat and the5HTTLPR repeat are both predicted to have a mutation ratethat is lower than most tandem repeats. This suggests thatlow-mutating tandem repeats have the potential to be taggedby SNPs. To explore this possibility we utilize establishedpopulation genetics theory and simulations to investigate howmutation rate is related to linkage disequilibrium between ahypermutable locus and surrounding SNPs.
Materials and Methods
Theory relating linkage disequilibrium with mutation ratesWe examine the linkage disequilibrium between a hypermutablelocus, A/a, and an adjacent SNP marker, B/b, defined by thefollowing mutation dynamics:
AµA−⇀↽−µa
a
BµB−⇀↽−µb
b.
We model the hypermutable locus (A/a) as having only twoalleles, with equal forward and backward mutation rates (sothat µA = µa), although it does not perfectly correspond tohypermutable tandem repeat loci. This allows for a simple mea-sure of correlation between the two loci, fitting the populationgenetics theory outlined below.
We assume the SNP locus (B/b) has a standard low mutationrate and the hypermutable locus has a high mutation rate, suchthat µA + µa >> µB + µb. The allele frequencies at locus B willbe primarily influenced by drift, while the allele frequencies
2 Sterling Sawaya et al.
.CC-BY-NC-ND 4.0 International licensepeer-reviewed) is the author/funder. It is made available under aThe copyright holder for this preprint (which was not. http://dx.doi.org/10.1101/020909doi: bioRxiv preprint first posted online Jun. 15, 2015;
at A will be influenced by both drift and mutation (we ignorethe possibility of selection). Denote the allele frequency of A(B) as pA (pB). The allele frequency at locus A is influenced bymutational equilibrium, in which:
pA ≈ µa
µA + µa. (1)
In a large population with limited drift, the frequencyof allele A primarily depends on its forward and backwardmutation rates. As population sizes get smaller, and/or themutation rate gets lower, the allele frequencies are increasinglyinfluenced by population dynamics (as shown in the results).
The allele frequencies at each locus are important becausethere is an important relationship between the standardizedmeasure of linkage disequilibrium (LD), r2, and relative allelefrequencies (VanLiere and Rosenberg 2008; Wray 2005; Eberleet al. 2007; Hedrick 1987; Hill and Robertson 1968). Themaximum possible value of r2 between two loci is inverselyrelated to the difference between the minor allele frequencies,so if there is a large difference in frequency between the twoloci, r2 cannot be large (Hedrick 1987; Wray 2005; VanLiere andRosenberg 2008).
Our primary interest is the expected correlation between twoloci when one locus has a high mutation rate. For this, thefrequency of haplotype AB will be defined as pAB. Linkagedisequilibrium, D, is defined as:
D = pAB − pA pB. (2)
The square of the correlation between allele frequencies, r2,provides the proportion of variance at one locus that can beexplained by another locus, and acts as a standardized measureof LD (Hill and Robertson 1968):
r2 =D2
pA(1 − pA)pB(1 − pB). (3)
How much correlation is expected between loci? To examinethis, Ohta and Kimura (1969) define a new variable, ρ2, as anapproximation for E(r2). They use the approximation E(x/y) ≈E(x)/E(y) to find an approximation for E(r2),
E(r2) ≈ ρ2 ≡ E(D2)
E[pA(1 − pA)pB(1 − pB)]. (4)
Ohta and Kimura (1969) then solve for the expected values ofthe numerator and denominator for a diffusion model, obtain-ing:
ρ2 =1
3 + 4N(c + k)− 4/(5 + 2N(c + k) + 2Nk), (5)
where N is effective population size, and c is the recombi-nation rate between these two loci (here measured in Morgans,M). The variable k is the sum of the mutation rates acrossboth loci, k ≡ µA + µa + µB + µb, which is dominated by themutation rates at the hypermutable locus (k ≈ µA + µa). Tosimplify notation, the forward/backward mutation rates at thehypermutable loci will be referred to as simply µ, such thatk ≈ 2µ.
Somewhat counterintuitively, allele frequency is not presentin the approximation for ρ2 (5). Although allele frequen-cies are present in the numerator, E(D2), and denominator,E[pA(1 − pA)pB(1 − pB)], their terms cancel resulting in anexpression that only involves population size, N, recombi-nation rate, c and the sum of mutation rates, k (Ohta andKimura 1969). As discussed above, the maximum r2 valueis determined by relative allele frequencies, but these resultssuggest that, on average at equilibrium, r2 is a function ofonly N, c and k. This prediction is examined here usingsimulated data (see next section). The simulations alsouse the diffusion model, so the equivalence of (4) and (5),as well as all of our results, rely on the assumptions of the model.
Furthermore, Ohta and Kimura (1969) showed that ρ2 is onlyan accurate approximation of E(r2) when N(c+ k) is sufficientlylarger than one. In this case ρ2 is approximated as:
ρ2 ≈ 14N(c + k)
. (6)
This approximation suggests that mutation and recombina-tion act similarly to reduce linkage disequilibrium. Mutationis slightly different than recombination, however, becauseit changes allele frequencies, but this effect is reduced if thelocus is in mutational equilibrium. More importantly, (6) alsosuggests that the expected correlation between allele frequenciesis very small when N(c + k) is large. Therefore, if the mutationrate is large one would expect a weak correlation between ahypermutable locus and an adjacent SNP marker, unless theeffective population size is small.
A. SimulationsUsing the coalescent simulation program FastSimCoal (Excoffierand Foll 2011), we simulated a population of 10,000 individualsfor a region of 100,000 base pairs (100kb). At the center of the100kb region we placed hypermutable locus (referred to asa “microsatellite” in FastSimCoal documentation) limited toonly two alleles (A and a), with equal forward and backwardmutation rates (µ) set to 10−3, 10−4, and 10−5 for differentsimulations. Two-thousand simulation results were obtainedfor each mutation rate. The recombination rate betweenadjacent base pairs was set to 10−8, and the mutation ratesat surrounding DNA loci were set to 5 · 10−8. The positionsof the polymorphic locus, i.e. loci with a non-zero minorallele frequency, their variants, and the variants at the centralhypermutable locus were retrieved from FastSimCoal. Theseresults were converted to necessary file types using custompython scripts, and analyzed in python and R. There were46 simulations for µ = 10−5 that were excluded becausehypermutable loci were not polymorphic.
For each simulation, four statistics were calculated. First,the r2 values between the central hypermutable locus andsurrounding SNPs were calculated. The mean of this valueacross simulations is referred to as “mean r2”. We expect thissimulated measure of LD to be the most accurate estimate ofthe true degree of association because it does not rely on asmany assumptions as the analytical approximation. Second,the average empirical values for D2 and pA(1 − pA)pB(1 − pB)were calculated from the simulations. We refer to the ratio ofthese two measures as “empirical ρ2”. Next, the values of ρ2
Linkage disequilibrium with hypermutable loci 3
.CC-BY-NC-ND 4.0 International licensepeer-reviewed) is the author/funder. It is made available under aThe copyright holder for this preprint (which was not. http://dx.doi.org/10.1101/020909doi: bioRxiv preprint first posted online Jun. 15, 2015;
from (5) were calculated using the three parameters, N, c, andk, that were used in the simulation. We expect the analyticalapproximation ρ2 from (5) and empirical ρ2 to closely matchbecause both the simulations and the statistical approach ofOhta and Kimura (1969) rely on the diffusion approximation.Finally, the position and r2 for the individual SNP with thehighest r2 value were recorded from each individual simulation.
The simulation results were binned into regions of 100base-pairs, corresponding to regions along the simulatedchromosome relative to the position of the hypermutable locus.The values for r2 and empirical ρ2 were calculated and thenaveraged across SNPs for each 100 base pair bin. The resultingplots were smoothed with LOESS smoothing.
To compare the hypermutable results with SNP-SNP corre-lations, we simulated a 150-kb region 50 times, with the sameparameters as above (10,000 population size, recombination ratesof 10−8, and mutation rate of 5 · 10−8). For each simulation, weused SNPs that were at least 50-kb from the end of the region.Each SNP in this central region was examined separately for itscorrelations with surrounding SNPs at most 50kb away. This isequivalent to a central SNP in a 100kb region, thus making theLD between two SNPs comparable to the LD between SNPs andhypermutable loci.
1. Results
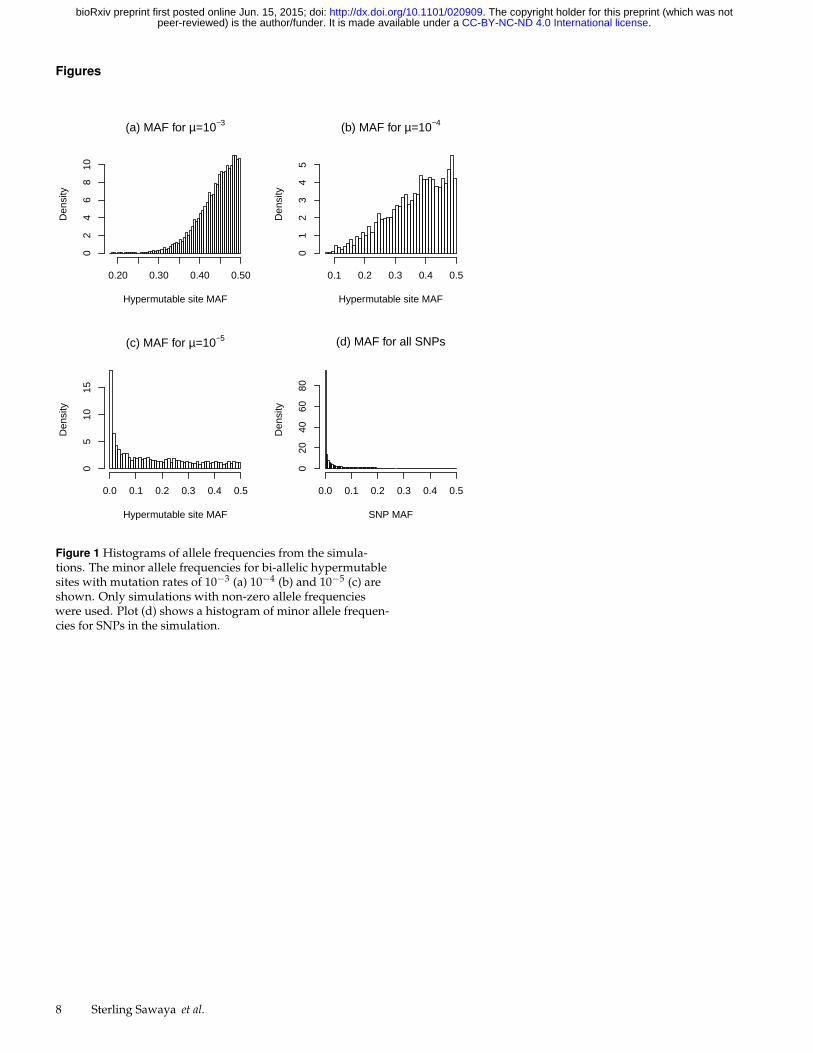
A. Allele frequencies from simulationsFigures 1 (a)-(c) display the minor allele frequencies (MAFs) forthe hypermutable loci, for each mutation rate. At mutation ratesof 10−3 or 10−4 most of the hypermutable alleles have a highMAF. These high mutation rates drive the allele frequenciestoward their mutational equilibria of 0.5. In contrast, the allelefrequencies for loci with the mutation rate of 10−5 are stronglyright skewed, with mostly rare alleles. At this lower mutationrate, the allele frequencies appear to be strongly influenced bypopulation dynamics.
The simulated SNP allele frequencies are also stronglyinfluenced by population dynamics, and the MAFs for most ofthese loci are very low (Figure 1 (d)). As discussed previously,the difference in allele frequencies between two loci influencestheir maximum possible r2. Hypermutable loci with a mutationrate of 10−3 have, on average, a high MAF, whereas the averageSNP MAF is very low. Therefore, a large difference in allelefrequencies exists between rare SNPs and most hypermutableloci, limiting their maximum r2.
B. Comparing r2 estimates with simulated results
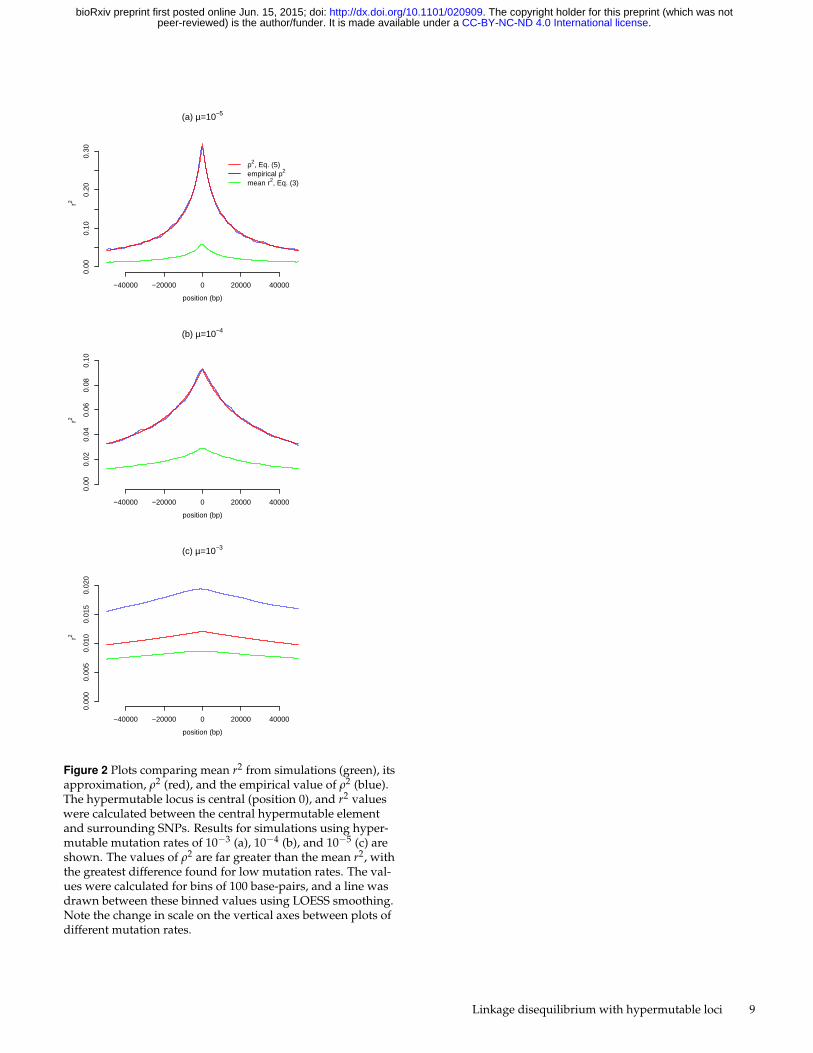
For each mutation rate we plot the mean r2 between a centralhypermutable locus and SNPs with any MAF across the entiresimulated region (Figure 2, green line). These mean r2 valuesare primarily influenced by associations between hypermutableloci and rare SNPs. The mean r2 values for simulations witha mutation rate of 10−3 are very low (Figure 2 (c)), increasingslightly for 10−4 (Figure 2 (b)), and more so for 10−5 (Figure 2(a)). We also plot the estimate of ρ2 made by Ohta and Kimura(1969), equation (5), in red. This approximation is greater thanthe mean r2 value for each scenario examined here, and muchgreater when the mutation rate is low or the inter-locus distance
is short. Importantly, when mutation rates are low or loci arein close proximity, the value of N(c + k) is much less than 1.Consequently, as predicted by Ohta and Kimura (1969), thiscauses the estimate of ρ2 to differ from the mean r2.
Because the simulations use the same diffusion approxima-tion assumptions as the analytical approach of Ohta and Kimura(1969), we expect the empirical ρ2 to match the approximationρ2 from (5). Empirical ρ2 and the approximation (5) are nearlyidentical for the simulations using a hypermutable mutationrate of 10−5 or 10−4, but not for 10−3 (Figure 2, blue andred lines). We cannot explain this discrepancy. Nevertheless,for a mutation rate of 10−3 all three measures of r2 are very small.
Importantly, the mean r2 measured here uses hypermutableloci and SNPs with any allele frequencies above 0 (following theassumptions of Ohta and Kimura (1969)). This corresponds toa study in which all, or most, SNPs are genotyped, such as asequencing study. If a study only uses common alleles, suchas on a SNP chip with only common SNPs (MAF > 0.05), thenthe mean r2 values found between these common SNPs and ahypermutable site should be different.
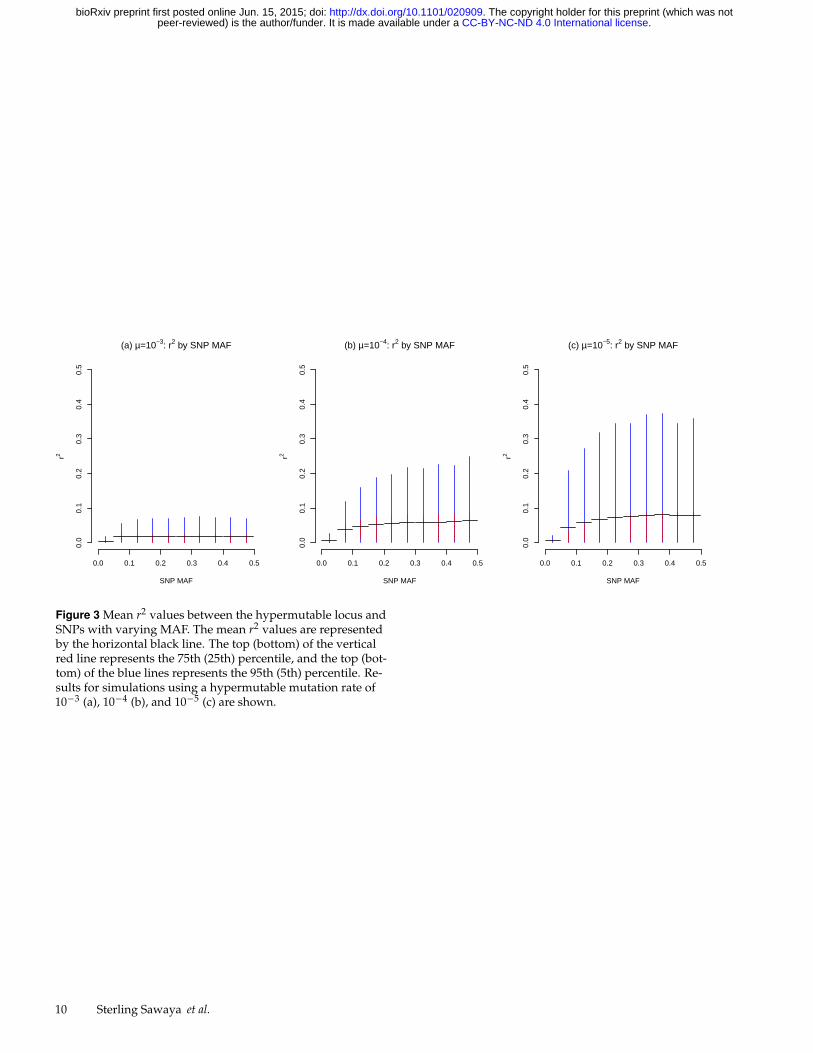
To address how SNP minor allele frequencies influence ther2 between the SNPs and hypermutable loci, we examine ther2 values for SNPs with different MAFs, averaged across allregions. The horizontal black line in Figure 3 shows the meanempirical r2 for SNPs binned by MAF value, for each mutationrate. The outer ends of the red vertical lines in this figureindicate the range between the 25th and 75th percentiles (5thand 95th for the ends of the blue lines).
In general, the SNP MAF only has a weak effect on themean r2; the range of r2 values is similar for most SNP MAFs.However, for the lowest-MAF SNPs, the maximum possibler2 values are very small and the distribution of r2 shows thatalmost all low-MAF SNPs have very weak associations withthe hypermutable locus. More importantly, Figures 3 (b) and(c) show that common SNPs (MAF > 0.1) can sometimes bein relatively high LD (r2 > 0.2) with hypermutable loci at thelower range of mutation rates (µ = 10−4 to 10−5).
C. SNP-SNP correlations
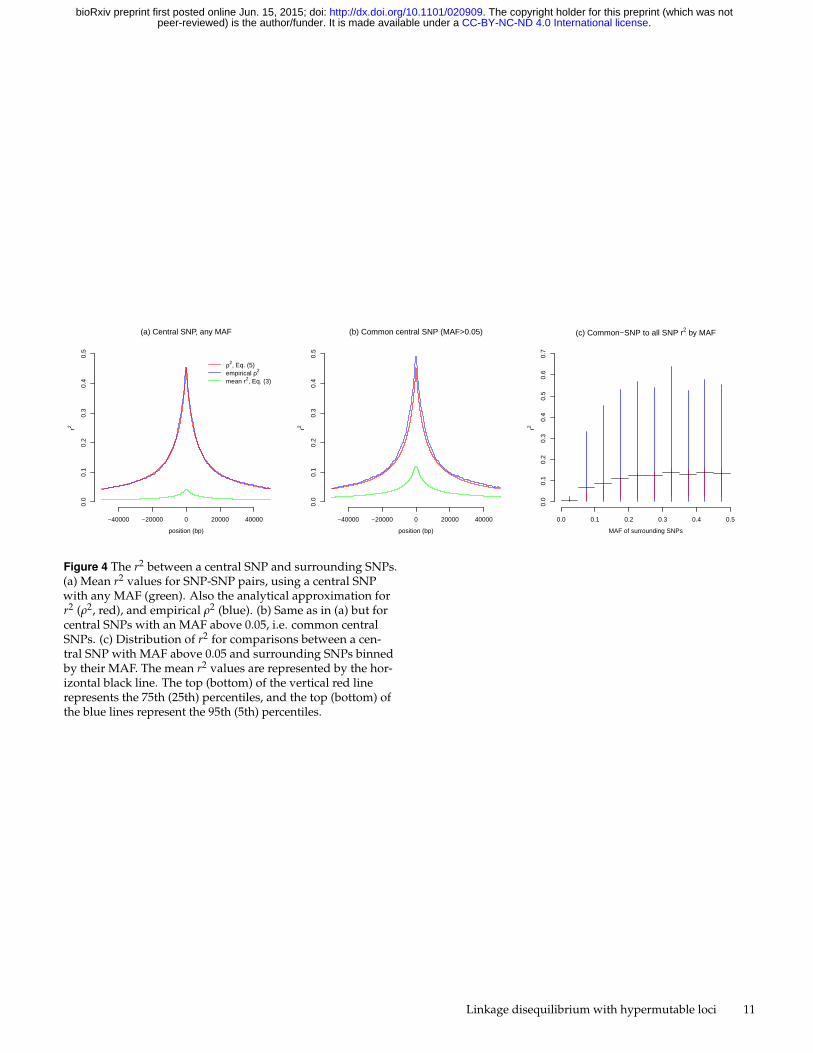
To put all of the above results in context, we examine how SNPsare correlated with each other. We find that, on average, SNPshave an extremely low mean r2 value with other SNPs (Figure 4(a)). The maximum mean r2 value, provided by SNPs in closeproximity to the central SNP, is less than 0.05. Importantly, mostSNPs have extremely low MAF (Figure 1 (d)), and the meanr2 value is strongly influenced by weak associations with rareSNPs (not shown). The correlation between common SNPs andrare SNPs is known to be weak (Sun et al. 2011), so the lack of aregional association between a single rare SNP and surroundingSNPs is expected. Furthermore, this scenario represents abreakdown of the approximation; the value of N(c+k) is toosmall for the approximation to be accurate. Therefore thepredicted and emperical ρ2 of almost 0.45 for the SNPs that arein close proximity are clearly not a good approximation for themean r2.
Because hypermutable elements tend to have higher
4 Sterling Sawaya et al.
.CC-BY-NC-ND 4.0 International licensepeer-reviewed) is the author/funder. It is made available under aThe copyright holder for this preprint (which was not. http://dx.doi.org/10.1101/020909doi: bioRxiv preprint first posted online Jun. 15, 2015;
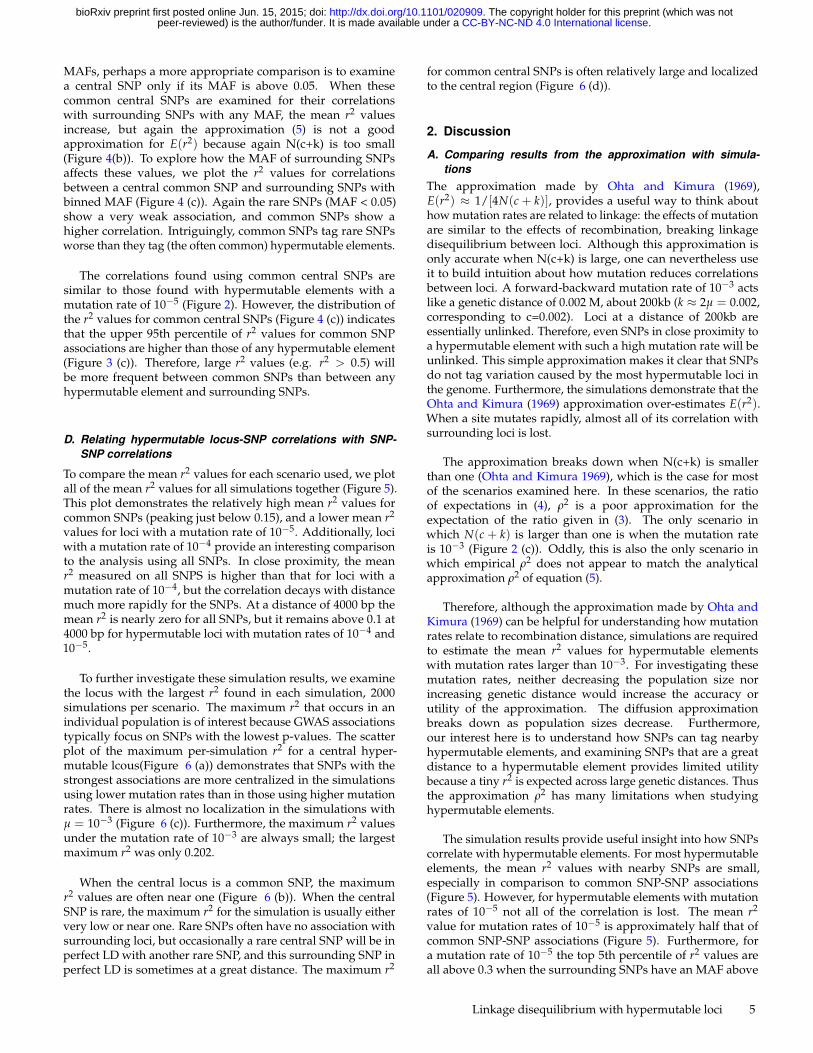
MAFs, perhaps a more appropriate comparison is to examinea central SNP only if its MAF is above 0.05. When thesecommon central SNPs are examined for their correlationswith surrounding SNPs with any MAF, the mean r2 valuesincrease, but again the approximation (5) is not a goodapproximation for E(r2) because again N(c+k) is too small(Figure 4(b)). To explore how the MAF of surrounding SNPsaffects these values, we plot the r2 values for correlationsbetween a central common SNP and surrounding SNPs withbinned MAF (Figure 4 (c)). Again the rare SNPs (MAF < 0.05)show a very weak association, and common SNPs show ahigher correlation. Intriguingly, common SNPs tag rare SNPsworse than they tag (the often common) hypermutable elements.
The correlations found using common central SNPs aresimilar to those found with hypermutable elements with amutation rate of 10−5 (Figure 2). However, the distribution ofthe r2 values for common central SNPs (Figure 4 (c)) indicatesthat the upper 95th percentile of r2 values for common SNPassociations are higher than those of any hypermutable element(Figure 3 (c)). Therefore, large r2 values (e.g. r2 > 0.5) willbe more frequent between common SNPs than between anyhypermutable element and surrounding SNPs.
D. Relating hypermutable locus-SNP correlations with SNP-SNP correlations
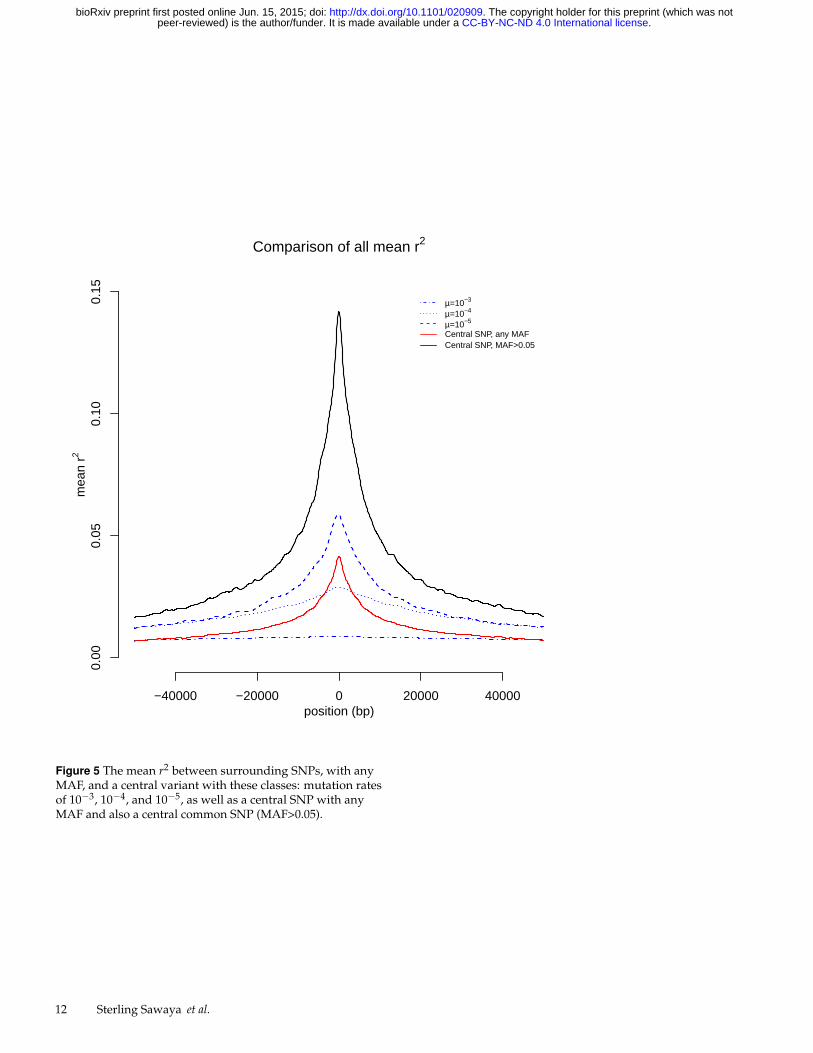
To compare the mean r2 values for each scenario used, we plotall of the mean r2 values for all simulations together (Figure 5).This plot demonstrates the relatively high mean r2 values forcommon SNPs (peaking just below 0.15), and a lower mean r2
values for loci with a mutation rate of 10−5. Additionally, lociwith a mutation rate of 10−4 provide an interesting comparisonto the analysis using all SNPs. In close proximity, the meanr2 measured on all SNPS is higher than that for loci with amutation rate of 10−4, but the correlation decays with distancemuch more rapidly for the SNPs. At a distance of 4000 bp themean r2 is nearly zero for all SNPs, but it remains above 0.1 at4000 bp for hypermutable loci with mutation rates of 10−4 and10−5.
To further investigate these simulation results, we examinethe locus with the largest r2 found in each simulation, 2000simulations per scenario. The maximum r2 that occurs in anindividual population is of interest because GWAS associationstypically focus on SNPs with the lowest p-values. The scatterplot of the maximum per-simulation r2 for a central hyper-mutable lcous(Figure 6 (a)) demonstrates that SNPs with thestrongest associations are more centralized in the simulationsusing lower mutation rates than in those using higher mutationrates. There is almost no localization in the simulations withµ = 10−3 (Figure 6 (c)). Furthermore, the maximum r2 valuesunder the mutation rate of 10−3 are always small; the largestmaximum r2 was only 0.202.
When the central locus is a common SNP, the maximumr2 values are often near one (Figure 6 (b)). When the centralSNP is rare, the maximum r2 for the simulation is usually eithervery low or near one. Rare SNPs often have no association withsurrounding loci, but occasionally a rare central SNP will be inperfect LD with another rare SNP, and this surrounding SNP inperfect LD is sometimes at a great distance. The maximum r2
for common central SNPs is often relatively large and localizedto the central region (Figure 6 (d)).
2. Discussion
A. Comparing results from the approximation with simula-tions
The approximation made by Ohta and Kimura (1969),E(r2) ≈ 1/[4N(c + k)], provides a useful way to think abouthow mutation rates are related to linkage: the effects of mutationare similar to the effects of recombination, breaking linkagedisequilibrium between loci. Although this approximation isonly accurate when N(c+k) is large, one can nevertheless useit to build intuition about how mutation reduces correlationsbetween loci. A forward-backward mutation rate of 10−3 actslike a genetic distance of 0.002 M, about 200kb (k ≈ 2µ = 0.002,corresponding to c=0.002). Loci at a distance of 200kb areessentially unlinked. Therefore, even SNPs in close proximity toa hypermutable element with such a high mutation rate will beunlinked. This simple approximation makes it clear that SNPsdo not tag variation caused by the most hypermutable loci inthe genome. Furthermore, the simulations demonstrate that theOhta and Kimura (1969) approximation over-estimates E(r2).When a site mutates rapidly, almost all of its correlation withsurrounding loci is lost.
The approximation breaks down when N(c+k) is smallerthan one (Ohta and Kimura 1969), which is the case for mostof the scenarios examined here. In these scenarios, the ratioof expectations in (4), ρ2 is a poor approximation for theexpectation of the ratio given in (3). The only scenario inwhich N(c + k) is larger than one is when the mutation rateis 10−3 (Figure 2 (c)). Oddly, this is also the only scenario inwhich empirical ρ2 does not appear to match the analyticalapproximation ρ2 of equation (5).
Therefore, although the approximation made by Ohta andKimura (1969) can be helpful for understanding how mutationrates relate to recombination distance, simulations are requiredto estimate the mean r2 values for hypermutable elementswith mutation rates larger than 10−3. For investigating thesemutation rates, neither decreasing the population size norincreasing genetic distance would increase the accuracy orutility of the approximation. The diffusion approximationbreaks down as population sizes decrease. Furthermore,our interest here is to understand how SNPs can tag nearbyhypermutable elements, and examining SNPs that are a greatdistance to a hypermutable element provides limited utilitybecause a tiny r2 is expected across large genetic distances. Thusthe approximation ρ2 has many limitations when studyinghypermutable elements.
The simulation results provide useful insight into how SNPscorrelate with hypermutable elements. For most hypermutableelements, the mean r2 values with nearby SNPs are small,especially in comparison to common SNP-SNP associations(Figure 5). However, for hypermutable elements with mutationrates of 10−5 not all of the correlation is lost. The mean r2
value for mutation rates of 10−5 is approximately half that ofcommon SNP-SNP associations (Figure 5). Furthermore, fora mutation rate of 10−5 the top 5th percentile of r2 values areall above 0.3 when the surrounding SNPs have an MAF above
Linkage disequilibrium with hypermutable loci 5
.CC-BY-NC-ND 4.0 International licensepeer-reviewed) is the author/funder. It is made available under aThe copyright holder for this preprint (which was not. http://dx.doi.org/10.1101/020909doi: bioRxiv preprint first posted online Jun. 15, 2015;
0.2 (Figure 3 (c)). Stronger associations exist between commonSNPs and other common SNPs (Figure 4 (c)), but the scenariowith mutation rates of 10−5 is somewhat comparable.
Rare SNPs are known to have a small r2 value with otherSNPs (Sun et al. 2011), and rare SNPs are a potential explanationfor missing heritability (Manolio et al. 2009) and still-missingheritability (Wray et al. 2014; Witte et al. 2014). The simulationsindicate that rare SNPs have a low mean r2 with other SNPs,comparable to hypermutable elements with mutation rates of10−4 or smaller. However, the mean r2 diminishes across geneticdistance faster for SNPs than for hypermutable loci (Figure 5).This suggests that although hypermutable elements may behavesimilarly to rare SNPs, associations with hypermutable elementsmay show weaker localization. This delocalization spreads asso-ciations with hypermutable loci around the genome. Therefore,methods that use all SNPs together to measure overall geneticeffects, such as GCTA (Yang et al. 2011), may be able to recoverinformation about causal hypermutable loci.
B. Implications for GWAS
Hypermutable tandem repeat loci may be partially responsiblefor missing heritability (Hannan 2010; Press et al. 2014) and alsostill-missing heritability. The results presented here suggestthat loci with high mutation rates are not well tagged by SNPs,and therefore much of the heritable variation caused by suchloci will not have been captured in modern GWAS analyses.Scientists have just recently begun to estimate the mutation ratesof hypermutable elements in the human genome (Whittakeret al. 2003; Kelkar et al. 2008; Sun et al. 2012; Legendre et al. 2007),and a database of know tandem repeat variants has recentlybeen developed (Willems et al. 2014). As more tandem repeatvariants are cataloged, understanding how these variants can betagged by SNPs will allow researchers to measure their relativecontributions to phenotypes.
When a tandem repeat has a lower mutation rate (such asG/C rich microsatellites or minisatellites), studies have shownthat SNPs can be linked to disease repeat alleles (Wray et al.2009; Laaksovirta et al. 2010; Mok et al. 2012; Majounie et al.2012; Pliner et al. 2014), and our results corroborate this. For theC9orf72 repeat expansion there appears to have been a singlerepeat expansion in the European population, with nearby SNPsin strong linkage disequilibrium (Mok et al. 2012). This finding,along with the analyses here, suggests that other GWAS couldbe picking up phenotypic variation caused by tandem repeats.However, because SNPs are the main focus of contemporarygenetics research, tandem repeats are often overlooked aspotential causal variants. Furthermore, due to the limitations ofPCR and next-gen sequencing technologies, tandem repeats areoften difficult to genotype or sequence (Treangen and Salzberg2012; Loomis et al. 2013; Press et al. 2014; Gymrek et al. 2012;Brahmachary et al. 2014; Krsticevic et al. 2015; Ummat andBashir 2014; Doi et al. 2014). Consequently, researchers couldeasily miss a causal tandem repeat variant while investigating aGWAS signal using DNA sequencing.
An important consideration when investigating a GWASsignal is the distance between the SNP with the lowest p-valueand the variant(s) driving the association. The position ofthe lowest p-value SNP is often used to link a gene with aphenotype. Our results suggest that the top SNP associations
are far less localized for hypermutable elements, with almostno localization for elements with a mutation rate of 10−3
(Figure 6 (c)). Therefore, if a hypermutable element is causinga SNP association, the strongest SNP association may occur ata great distance from the causal element. Associations withhypermutable elements are also spread across a larger region(Figure 5), providing an association signature that may benoticeably distinct from other types of associations.
Finally, because traits can be influenced by hypermutableelements and/or low frequency variants, SNP data alone cannotbe used to exclude a gene or region of the genome as causal.If a gene is affected by hypermutable elements and/or rarevariants, then SNPs will often fail to find an association. Regionsor genes that contain potentially functional hypermutableelements require further genotyping of these elements beforethey can be totally excluded as potentially impacting a trait.Furthermore, many sequencing technologies have a limitedability to genotype some tandem repeat variants (Treangen andSalzberg 2012; Loomis et al. 2013; Press et al. 2014; Krsticevicet al. 2015; Doi et al. 2014), so our results apply to any data thatis limited to SNPs. Recent advances in sequencing technology(Loomis et al. 2013; Ummat and Bashir 2014; Krsticevic et al. 2015)and tandem repeat genotyping (Gymrek et al. 2012; Carlson et al.2015; Brahmachary et al. 2014; Doi et al. 2014) provide hope thatsome hypermutable elements will be included in future studiesof genetic heritability and genetic disease. Nevertheless, someof the missing heritability cause by hypermutable elements mayremain missing, at least for the near future.
C. Limitations and potential extensions
This study only use two possible states at each locus, and theforward and backward mutations are equal. This simplifies boththe analytical approach as well as the simulations, and can beused as a simple model of tandem repeat evolution. Tandemrepeats often have more than two states, but diseases causedby tandem repeats are often caused by expansion (Hannan2010; Gemayel et al. 2010). Therefore, tandem repeats cansometimes fit into a two-allele model as was done here (shortversus long). However, transitions between a short allele and along allele depend on the repeat length (Kelkar et al. 2008), andthus forward and backward mutation rates are not necessarilyequivalent. A step-wise mutation model, allowing multipleallele sizes at the hypermutable locus and binning them asshort or long, may provide a more accurate model of tandemrepeat diseases. These more complicated models are likelyto return similar results because empirical data indicates thatsmall r2 values are found between SNPs and tandem repeat loci,whether they are bi-allellic or multi-allelic Willems et al. (2014).
In addition, the use of a stable population with an effectivesize of 10,000 without population history may further limit thedirect application of these results. The results from smallerpopulation sizes might drastically change because the diffusionapproximation does not work well for small effective populationsizes. In addition, complicated population histories maychange these results in unexpected ways, especially becausetandem repeats and SNPs provide different information aboutpopulation histories (Payseur and Jing 2009). Future simulationscould address these possibilities.
6 Sterling Sawaya et al.
.CC-BY-NC-ND 4.0 International licensepeer-reviewed) is the author/funder. It is made available under aThe copyright holder for this preprint (which was not. http://dx.doi.org/10.1101/020909doi: bioRxiv preprint first posted online Jun. 15, 2015;
Equation (6) suggests that increasing the population size willresult in an approximately harmonic decrease in the mean r2.Therefore, one can expect the mean r2 from an effective popula-tion size of 20,000 to be approximately half of the mean r2 foundhere with an effective population size of 10,000. Extrapolatingthe results presented here to smaller population sizes would notbe as straightforward. Due to the aforementioned effect thatsmall populations have on the accuracy of the diffusion approxi-mation, estimating how these result would change if one useda smaller population size is not as simple as applying a lineartransformation.
D. Summary and conclusionAs shown by Ohta and Kimura (1969), mutation and re-combination act in a similar fashion to break up linkagebetween loci. The magnitude of the mutation rate can beapproximately equated to recombination distance in Morgans.However, this approximation only holds when the mutationrates are high and/or population sizes are large. With lowermutation rates the approximation breaks down and simula-tions must be used to estimate the expected linkage between loci.
The simulations reported here suggest that the variationcaused by some hypermutable elements can be captured usingSNPs. At mutation rates of 10−5 or smaller the associationsbetween hypermutable loci and SNPs is comparable to, althoughlower than, common SNP - common SNP associations. Onthe other hand, the correlations between SNPs and loci withmutation rates of 10−4 and 10−3 are relatively low, and thereforevariation caused by loci with these mutation rates are likely toshow only weak association with SNPs of any MAF.
Heritable variation can be caused by genetic loci with a rangeof mutation rates (Rando and Verstrepen 2007). Hypermutableloci can remain highly polymorphic in a population, and theymay be important causes of human disease and heritability ofcomplex traits. Common SNP variants are currently inexpensiveand widely used to search for genes that contribute to heritablevariation. Unfortunately, many hypermutable loci will havepoor linkage with SNPs, and therefore these loci will be unlikelyto be uncovered using SNP GWAS methods. Direct genotypingwill be necessary to uncover the effects that many hypermutableloci have on genetic variation. We hope that this work will helpresearchers investigating the sources of human diseases andheritable traits.
Linkage disequilibrium with hypermutable loci 7
.CC-BY-NC-ND 4.0 International licensepeer-reviewed) is the author/funder. It is made available under aThe copyright holder for this preprint (which was not. http://dx.doi.org/10.1101/020909doi: bioRxiv preprint first posted online Jun. 15, 2015;
Figures
(a) MAF for µ=10−3
Hypermutable site MAF
Den
sity
0.20 0.30 0.40 0.50
02
46
810
(c) MAF for µ=10−5
Hypermutable site MAF
Den
sity
0.0 0.1 0.2 0.3 0.4 0.5
05
1015
(b) MAF for µ=10−4
Hypermutable site MAF
Den
sity
0.1 0.2 0.3 0.4 0.5
01
23
45
(d) MAF for all SNPs
SNP MAF
Den
sity
0.0 0.1 0.2 0.3 0.4 0.5
020
4060
80
Figure 1 Histograms of allele frequencies from the simula-tions. The minor allele frequencies for bi-allelic hypermutablesites with mutation rates of 10−3 (a) 10−4 (b) and 10−5 (c) areshown. Only simulations with non-zero allele frequencieswere used. Plot (d) shows a histogram of minor allele frequen-cies for SNPs in the simulation.
8 Sterling Sawaya et al.
.CC-BY-NC-ND 4.0 International licensepeer-reviewed) is the author/funder. It is made available under aThe copyright holder for this preprint (which was not. http://dx.doi.org/10.1101/020909doi: bioRxiv preprint first posted online Jun. 15, 2015;
−40000 −20000 0 20000 40000
0.00
0.10
0.20
0.30
(a) µ=10−5
position (bp)
r2
ρ2, Eq. (5)empirical ρ2
mean r2, Eq. (3)
−40000 −20000 0 20000 40000
0.00
0.02
0.04
0.06
0.08
0.10
(b) µ=10−4
position (bp)
r2
ρ2, Eq. (5)empirical ρ2
mean r2, Eq. (3)
−40000 −20000 0 20000 40000
0.00
00.
005
0.01
00.
015
0.02
0
(c) µ=10−3
position (bp)
r2
Figure 2 Plots comparing mean r2 from simulations (green), itsapproximation, ρ2 (red), and the empirical value of ρ2 (blue).The hypermutable locus is central (position 0), and r2 valueswere calculated between the central hypermutable elementand surrounding SNPs. Results for simulations using hyper-mutable mutation rates of 10−3 (a), 10−4 (b), and 10−5 (c) areshown. The values of ρ2 are far greater than the mean r2, withthe greatest difference found for low mutation rates. The val-ues were calculated for bins of 100 base-pairs, and a line wasdrawn between these binned values using LOESS smoothing.Note the change in scale on the vertical axes between plots ofdifferent mutation rates.
Linkage disequilibrium with hypermutable loci 9
.CC-BY-NC-ND 4.0 International licensepeer-reviewed) is the author/funder. It is made available under aThe copyright holder for this preprint (which was not. http://dx.doi.org/10.1101/020909doi: bioRxiv preprint first posted online Jun. 15, 2015;
0.0 0.1 0.2 0.3 0.4 0.5
0.0
0.1
0.2
0.3
0.4
0.5
(a) µ=10−3: r2 by SNP MAF
SNP MAF
r2
0.0 0.1 0.2 0.3 0.4 0.5
0.0
0.1
0.2
0.3
0.4
0.5
(b) µ=10−4: r2 by SNP MAF
SNP MAF
r2
0.0 0.1 0.2 0.3 0.4 0.5
0.0
0.1
0.2
0.3
0.4
0.5
(c) µ=10−5: r2 by SNP MAF
SNP MAF
r2
Figure 3 Mean r2 values between the hypermutable locus andSNPs with varying MAF. The mean r2 values are representedby the horizontal black line. The top (bottom) of the verticalred line represents the 75th (25th) percentile, and the top (bot-tom) of the blue lines represents the 95th (5th) percentile. Re-sults for simulations using a hypermutable mutation rate of10−3 (a), 10−4 (b), and 10−5 (c) are shown.
10 Sterling Sawaya et al.
.CC-BY-NC-ND 4.0 International licensepeer-reviewed) is the author/funder. It is made available under aThe copyright holder for this preprint (which was not. http://dx.doi.org/10.1101/020909doi: bioRxiv preprint first posted online Jun. 15, 2015;
−40000 −20000 0 20000 40000
0.0
0.1
0.2
0.3
0.4
0.5
(a) Central SNP, any MAF
position (bp)
r2
ρ2, Eq. (5)empirical ρ2
mean r2, Eq. (3)
−40000 −20000 0 20000 40000
0.0
0.1
0.2
0.3
0.4
0.5
(b) Common central SNP (MAF>0.05)
position (bp)
r2
0.0 0.1 0.2 0.3 0.4 0.5
0.0
0.1
0.2
0.3
0.4
0.5
0.6
0.7
(c) Common−SNP to all SNP r2 by MAF
MAF of surrounding SNPsr2
Figure 4 The r2 between a central SNP and surrounding SNPs.(a) Mean r2 values for SNP-SNP pairs, using a central SNPwith any MAF (green). Also the analytical approximation forr2 (ρ2, red), and empirical ρ2 (blue). (b) Same as in (a) but forcentral SNPs with an MAF above 0.05, i.e. common centralSNPs. (c) Distribution of r2 for comparisons between a cen-tral SNP with MAF above 0.05 and surrounding SNPs binnedby their MAF. The mean r2 values are represented by the hor-izontal black line. The top (bottom) of the vertical red linerepresents the 75th (25th) percentiles, and the top (bottom) ofthe blue lines represent the 95th (5th) percentiles.
Linkage disequilibrium with hypermutable loci 11
.CC-BY-NC-ND 4.0 International licensepeer-reviewed) is the author/funder. It is made available under aThe copyright holder for this preprint (which was not. http://dx.doi.org/10.1101/020909doi: bioRxiv preprint first posted online Jun. 15, 2015;
−40000 −20000 0 20000 40000
0.00
0.05
0.10
0.15
Comparison of all mean r2
position (bp)
mea
n r2
µ=10−3
µ=10−4
µ=10−5
Central SNP, any MAFCentral SNP, MAF>0.05
Figure 5 The mean r2 between surrounding SNPs, with anyMAF, and a central variant with these classes: mutation ratesof 10−3, 10−4, and 10−5, as well as a central SNP with anyMAF and also a central common SNP (MAF>0.05).
12 Sterling Sawaya et al.
.CC-BY-NC-ND 4.0 International licensepeer-reviewed) is the author/funder. It is made available under aThe copyright holder for this preprint (which was not. http://dx.doi.org/10.1101/020909doi: bioRxiv preprint first posted online Jun. 15, 2015;
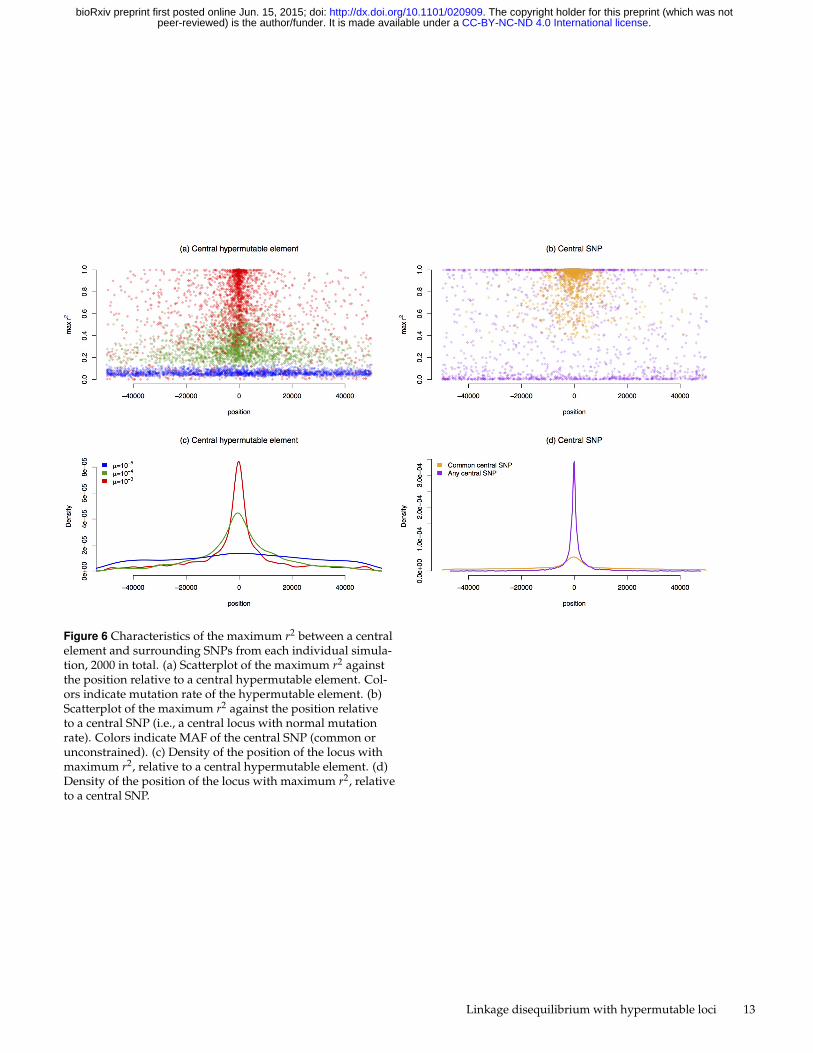
Figure 6 Characteristics of the maximum r2 between a centralelement and surrounding SNPs from each individual simula-tion, 2000 in total. (a) Scatterplot of the maximum r2 againstthe position relative to a central hypermutable element. Col-ors indicate mutation rate of the hypermutable element. (b)Scatterplot of the maximum r2 against the position relativeto a central SNP (i.e., a central locus with normal mutationrate). Colors indicate MAF of the central SNP (common orunconstrained). (c) Density of the position of the locus withmaximum r2, relative to a central hypermutable element. (d)Density of the position of the locus with maximum r2, relativeto a central SNP.
Linkage disequilibrium with hypermutable loci 13
.CC-BY-NC-ND 4.0 International licensepeer-reviewed) is the author/funder. It is made available under aThe copyright holder for this preprint (which was not. http://dx.doi.org/10.1101/020909doi: bioRxiv preprint first posted online Jun. 15, 2015;
Literature Cited
Baptiste, B. A., G. Ananda, N. Strubczewski, A. Lutzkanin, S. J.Khoo, A. Srikanth, N. Kim, K. D. Makova, M. M. Krasilnikova,and K. A. Eckert, 2013 Mature microsatellites: mechanismsunderlying dinucleotide microsatellite mutational biases inhuman cells. G3 (Bethesda) 3: 451–463.
Brahmachary, M., A. Guilmatre, J. Quilez, D. Hasson, C. Borel,P. Warburton, and A. J. Sharp, 2014 Digital genotyping ofmacrosatellites and multicopy genes reveals novel biologi-cal functions associated with copy number variation of largetandem repeats. PLoS Genet. 10: e1004418.
Buschiazzo, E. and N. J. Gemmell, 2010 Conservation of humanmicrosatellites across 450 million years of evolution. GenomeBiol Evol 2: 153–165.
Carlson, K. D., P. H. Sudmant, M. O. Press, E. E. Eichler, J. Shen-dure, and C. Queitsch, 2015 Mipstr: a method for multiplexgenotyping of germline and somatic str variation across manyindividuals. Genome Research .
DeJesus-Hernandez, M., I. R. Mackenzie, B. F. Boeve, A. L. Boxer,M. Baker, N. J. Rutherford, A. M. Nicholson, N. A. Finch,H. Flynn, J. Adamson, N. Kouri, A. Wojtas, P. Sengdy, G. Y.Hsiung, A. Karydas, W. W. Seeley, K. A. Josephs, G. Coppola,D. H. Geschwind, Z. K. Wszolek, H. Feldman, D. S. Knopman,R. C. Petersen, B. L. Miller, D. W. Dickson, K. B. Boylan, N. R.Graff-Radford, and R. Rademakers, 2011 Expanded GGGGCChexanucleotide repeat in noncoding region of C9ORF72 causeschromosome 9p-linked FTD and ALS. Neuron 72: 245–256.
Doi, K., T. Monjo, P. H. Hoang, J. Yoshimura, H. Yurino, J. Mit-sui, H. Ishiura, Y. Takahashi, Y. Ichikawa, J. Goto, S. Tsuji,and S. Morishita, 2014 Rapid detection of expanded short tan-dem repeats in personal genomics using hybrid sequencing.Bioinformatics 30: 815–822.
Eberle, M. A., P. C. Ng, K. Kuhn, L. Zhou, D. A. Peiffer, L. Galver,K. A. Viaud-Martinez, C. T. Lawley, K. L. Gunderson, R. Shen,and S. S. Murray, 2007 Power to detect risk alleles usinggenome-wide tag SNP panels. PLoS Genet. 3: 1827–1837.
Ellegren, H., 2004 Microsatellites: simple sequences with com-plex evolution. Nature Reviews Genetics 5: 435–445.
Excoffier, L. and M. Foll, 2011 fastsimcoal: a continuous-time co-alescent simulator of genomic diversity under arbitrarily com-plex evolutionary scenarios. Bioinformatics 27: 1332–1334.
Gemayel, R., M. D. Vinces, M. Legendre, and K. J. Verstrepen,2010 Variable tandem repeats accelerate evolution of codingand regulatory sequences. Annu. Rev. Genet. 44: 445–477.
Gymrek, M., D. Golan, S. Rosset, and Y. Erlich, 2012 lobstr: Ashort tandem repeat profiler for personal genomes. GenomeResearch 22: 1154–1162.
Hannan, A., 2010 Tandem repeat polymorphisms: modulators ofdisease susceptibility and candidates for ’missing heritability’.Trends in Genetics 26: 59–65.
Hedrick, P. W., 1987 Gametic disequilibrium measures: proceedwith caution. Genetics 117: 331–341.
Hill, W. G. and A. Robertson, 1968 Linkage disequilibrium infinite populations. Theor. Appl. Genet. 38: 226–231.
Jeffreys, A. J., D. L. Neil, and R. Neumann, 1998 Repeat instabil-ity at human minisatellites arising from meiotic recombination.EMBO J. 17: 4147–4157.
Kelkar, Y. D., S. Tyekucheva, F. Chiaromonte, and K. D. Makova,2008 The genome-wide determinants of human and chim-panzee microsatellite evolution. Genome Res. 18: 30–38.
Krsticevic, F. J., C. G. Schrago, and A. B. Carvalho, 2015 Long-Read Single Molecule Sequencing To Resolve Tandem Gene
Copies: The Mst77Y Region on the Drosophila melanogasterY Chromosome. G3 (Bethesda) .
Laaksovirta, H., T. Peuralinna, J. C. Schymick, S. W. Scholz, S. L.Lai, L. Myllykangas, R. Sulkava, L. Jansson, D. G. Hernandez,J. R. Gibbs, M. A. Nalls, D. Heckerman, P. J. Tienari, andB. J. Traynor, 2010 Chromosome 9p21 in amyotrophic lateralsclerosis in Finland: a genome-wide association study. LancetNeurol 9: 978–985.
Legendre, M., N. Pochet, T. Pak, and K. J. Verstrepen, 2007Sequence-based estimation of minisatellite and microsatelliterepeat variability. Genome Res. 17: 1787–1796.
Lesch, K. P., D. Bengel, A. Heils, S. Z. Sabol, B. D. Greenberg,S. Petri, J. Benjamin, C. R. Muller, D. H. Hamer, and D. L.Murphy, 1996 Association of anxiety-related traits with a poly-morphism in the serotonin transporter gene regulatory region.Science 274: 1527–1531.
Loomis, E. W., J. S. Eid, P. Peluso, J. Yin, L. Hickey, D. Rank,S. McCalmon, R. J. Hagerman, F. Tassone, and P. J. Hagerman,2013 Sequencing the unsequenceable: expanded CGG-repeatalleles of the fragile X gene. Genome Res. 23: 121–128.
MacDonald, M. E., C. M. Ambrose, M. P. Duyao, R. H. My-ers, C. Lin, L. Srinidhi, G. Barnes, S. A. Taylor, M. James,N. Groot, H. MacFarlane, B. Jenkins, M. A. Anderson, N. S.Wexler, J. F. Gusella, G. P. Bates, S. Baxendale, H. Hummerich,S. Kirby, M. North, S. Youngman, R. Mott, G. Zehetner, Z. Sed-lacek, A. Poustka, A.-M. Frischauf, H. Lehrach, A. J. Buckler,D. Church, L. Doucette-Stamm, M. C. O’Donovan, L. Riba-Ramirez, M. Shah, V. P. Stanton, S. A. Strobel, K. M. Draths,J. L. Wales, P. Dervan, D. E. Housman, M. Altherr, R. Shi-ang, L. Thompson, T. Fielder, J. J. Wasmuth, D. Tagle, J. Valdes,L. Elmer, M. Allard, L. Castilla, M. Swaroop, K. Blanchard, F. S.Collins, R. Snell, T. Holloway, K. Gillespie, N. Datson, D. Shaw,and P. S. Harper, 1993 A novel gene containing a trinucleotiderepeat that is expanded and unstable on Huntington’s dis-ease chromosomes. The Huntington’s Disease CollaborativeResearch Group. Cell 72: 971–983.
Maher, B., 2008 Personal genomes: The case of the missingheritability. Nature 456: 18–21.
Majounie, E., A. E. Renton, K. Mok, E. G. Dopper, A. Waite,S. Rollinson, A. Chio, G. Restagno, N. Nicolaou, J. Simon-Sanchez, J. C. van Swieten, Y. Abramzon, J. O. Johnson,M. Sendtner, R. Pamphlett, R. W. Orrell, S. Mead, K. C. Si-dle, H. Houlden, J. D. Rohrer, K. E. Morrison, H. Pall, K. Tal-bot, O. Ansorge, D. G. Hernandez, S. Arepalli, M. Sabatelli,G. Mora, M. Corbo, F. Giannini, A. Calvo, E. Englund,G. Borghero, G. L. Floris, A. M. Remes, H. Laaksovirta, L. Mc-Cluskey, J. Q. Trojanowski, V. M. V. Deerlin, G. D. Schellenberg,M. A. Nalls, V. E. Drory, C.-S. Lu, T.-H. Yeh, H. Ishiura, Y. Taka-hashi, S. Tsuji, I. L. Ber, A. Brice, C. Drepper, N. Williams,J. Kirby, P. Shaw, J. Hardy, P. J. Tienari, P. Heutink, H. R. Mor-ris, S. Pickering-Brown, and B. J. Traynor, 2012 Frequency ofthe c9orf72 hexanucleotide repeat expansion in patients withamyotrophic lateral sclerosis and frontotemporal dementia: across-sectional study. The Lancet Neurology 11: 323–330.
Manolio, T. A., F. S. Collins, N. J. Cox, D. B. Goldstein, L. A.Hindorff, D. J. Hunter, M. I. McCarthy, E. M. Ramos, L. R.Cardon, A. Chakravarti, J. H. Cho, A. E. Guttmacher, A. Kong,L. Kruglyak, E. Mardis, C. N. Rotimi, M. Slatkin, D. Valle, A. S.Whittemore, M. Boehnke, A. G. Clark, E. E. Eichler, G. Gibson,J. L. Haines, T. F. Mackay, S. A. McCarroll, and P. M. Visscher,2009 Finding the missing heritability of complex diseases.Nature 461: 747–753.
14 Sterling Sawaya et al.
.CC-BY-NC-ND 4.0 International licensepeer-reviewed) is the author/funder. It is made available under aThe copyright holder for this preprint (which was not. http://dx.doi.org/10.1101/020909doi: bioRxiv preprint first posted online Jun. 15, 2015;
Mok, K., B. J. Traynor, J. Schymick, P. J. Tienari, H. Laaksovirta,T. Peuralinna, L. Myllykangas, A. Chio, A. Shatunov, B. F.Boeve, A. L. Boxer, M. DeJesus-Hernandez, I. R. Mackenzie,A. Waite, N. Williams, H. R. Morris, J. Simon-Sanchez, J. C.van Swieten, P. Heutink, G. Restagno, G. Mora, K. E. Morri-son, P. J. Shaw, P. S. Rollinson, A. Al-Chalabi, R. Rademakers,S. Pickering-Brown, R. W. Orrell, M. A. Nalls, and J. Hardy,2012 Chromosome 9 ALS and FTD locus is probably derivedfrom a single founder. Neurobiol. Aging 33: 3–8.
Ohta, T. and M. Kimura, 1969 Linkage disequilibrium at steadystate determined by random genetic drift and recurrent muta-tion. Genetics 63: 229–238.
Payseur, B. A. and P. Jing, 2009 A genomewide comparison ofpopulation structure at STRPs and nearby SNPs in humans.Mol. Biol. Evol. 26: 1369–1377.
Payseur, B. A., M. Place, and J. L. Weber, 2008 Linkage disequi-librium between STRPs and SNPs across the human genome.Am. J. Hum. Genet. 82: 1039–1050.
Pliner, H. A., D. M. Mann, and B. J. Traynor, 2014 Searchingfor Grendel: origin and global spread of the C9ORF72 repeatexpansion. Acta Neuropathol. 127: 391–396.
Press, M. O., K. D. Carlson, and C. Queitsch, 2014 The over-due promise of short tandem repeat variation for heritability.Trends Genet. 30: 504–512.
Rando, O. J. and K. J. Verstrepen, 2007 Timescales of genetic andepigenetic inheritance. Cell 128: 655–668.
Sawaya, S., A. Bagshaw, E. Buschiazzo, P. Kumar, S. Chowdhury,M. A. Black, and N. Gemmell, 2013 Microsatellite tandemrepeats are abundant in human promoters and are associatedwith regulatory elements. PLoS ONE 8: e54710.
Sun, J. X., A. Helgason, G. Masson, S. S. Ebenesersdottir, H. Li,S. Mallick, S. Gnerre, N. Patterson, A. Kong, D. Reich, andK. Stefansson, 2012 A direct characterization of human muta-tion based on microsatellites. Nat. Genet. 44: 1161–1165.
Sun, X., J. Namkung, X. Zhu, and R. C. Elston, 2011 Capabilityof common SNPs to tag rare variants. BMC Proc 5 Suppl 9:S88.
Treangen, T. J. and S. L. Salzberg, 2012 Repetitive DNA andnext-generation sequencing: computational challenges andsolutions. Nat. Rev. Genet. 13: 36–46.
Ummat, A. and A. Bashir, 2014 Resolving complex tandem re-peats with long reads. Bioinformatics 30: 3491–3498.
VanLiere, J. M. and N. A. Rosenberg, 2008 Mathematical proper-ties of the r2 measure of linkage disequilibrium. Theor PopulBiol 74: 130–137.
Verkerk, A. J., M. Pieretti, J. S. Sutcliffe, Y. H. Fu, D. P. Kuhl,A. Pizzuti, O. Reiner, S. Richards, M. F. Victoria, and F. P.Zhang, 1991 Identification of a gene (FMR-1) containing aCGG repeat coincident with a breakpoint cluster region ex-hibiting length variation in fragile X syndrome. Cell 65: 905–914.
Vinces, M. D., M. Legendre, M. Caldara, M. Hagihara, and K. J.Verstrepen, 2009 Unstable tandem repeats in promoters confertranscriptional evolvability. Science 324: 1213–1216.
Whittaker, J. C., R. M. Harbord, N. Boxall, I. Mackay, G. Daw-son, and R. M. Sibly, 2003 Likelihood-based estimation ofmicrosatellite mutation rates. Genetics 164: 781–787.
Willems, T. F., M. Gymrek, G. Highnam, T. . G. Project, D. Mittel-man, and Y. Erlich, 2014 The landscape of human str variation.Genome Research .
Witte, J. S., P. M. Visscher, and N. R. Wray, 2014 The contributionof genetic variants to disease depends on the ruler. Nat. Rev.
Genet. 15: 765–776.Wray, N. R., 2005 Allele frequencies and the r2 measure of link-
age disequilibrium: impact on design and interpretation ofassociation studies. Twin Res Hum Genet 8: 87–94.
Wray, N. R., M. R. James, S. D. Gordon, T. Dumenil, L. Ryan,W. L. Coventry, D. J. Statham, M. L. Pergadia, P. A. Madden,A. C. Heath, G. W. Montgomery, and N. G. Martin, 2009 Ac-curate, large-scale genotyping of 5httlpr and flanking singlenucleotide polymorphisms in an association study of depres-sion, anxiety, and personality measures. Biological Psychiatry66: 468 – 476, Medical Consequences and Contributions toDepression.
Wray, N. R., S. H. Lee, D. Mehta, A. A. Vinkhuyzen, F. Dudbridge,and C. M. Middeldorp, 2014 Research review: Polygenic meth-ods and their application to psychiatric traits. J Child PsycholPsychiatry 55: 1068–1087.
Xu, X., M. Peng, and Z. Fang, 2000 The direction of microsatellitemutations is dependent upon allele length. Nat. Genet. 24:396–399.
Yang, J., S. H. Lee, M. E. Goddard, and P. M. Visscher, 2011GCTA: a tool for genome-wide complex trait analysis. Am. J.Hum. Genet. 88: 76–82.
Linkage disequilibrium with hypermutable loci 15
.CC-BY-NC-ND 4.0 International licensepeer-reviewed) is the author/funder. It is made available under aThe copyright holder for this preprint (which was not. http://dx.doi.org/10.1101/020909doi: bioRxiv preprint first posted online Jun. 15, 2015;