linear scheduling with p6 visualizer 8 -...
TRANSCRIPT
Linear Scheduling with P6 Visualizer 8.3
Don McNatty, PSP
May 21, 2014
2014 Technical
Webinar Series
2
Thank you for joining today’s technical webinar
� Mute – all call in phones are automatically muted in order to
preserve the quality of the audio for all attendees.
� Questions – during the session, questions can be submitted through
the Questions Box on the right side of the screen . We will try to
address your questions at the end of the presentation, time
permitting.
� Follow up – all registrants will receive an Excel file listing all
questions and responses along with a link to the recorded webinar.
3
Safe Harbor
� The statements made in this technical presentation are based on
our current knowledge of the tools.
� Our statements should not be construed to be an official “Oracle
perspective”, but are intended to be the sharing of technical and
user knowledge gained as we explore new paths and
technologies, usually in advance of our clients.
� Our statements should not be construed as in conflict with any
Oracle statement, as the Oracle statement is likely made based
on more current knowledge than is available to us.
4
Abstract – Linear Graphics with Visualizer 8.3
� Linear scheduling has been around a long time and serves a very specific need - to help visualize scheduling conflicts between stationary and moving construction activities. At one time, the argument was that "CPM Schedules did not meet the needs of highway or pipeline contractors." However, as scheduling technology advanced, we found that a "linear schedule graphic" could be developed from a critical path schedule. Using the built-in capabilities of the Primavera scheduling tool, Activity Codes and Milestones are combined with the Time Scale to create a linear graphic matrix. The graphic is completed in a PDF format to add “lines” to demonstrate conflicts and the flow of work on a linear project. With the recent enhancements in P6 Pro 8.3's Visualizer tool, we have another tool in our bag to create a simple linear schedule graphic with P6 Visualizer and PDF Annotator software. This approach is simple and not intended for large complex projects but can be an invaluable tool for analyzing and presenting conflicts in smaller subsets (fragnets) of larger schedules.
5
� Oracle Primavera Software
� Oracle Primavera Certified Training & Implementation Services
� Custom Integration, Analytics and Dashboard Utilities
� Project Support Services and Partnering
� Global, dedicated environment hosting services
� Primavera OPPM, P6 EPPM, P6 Pro, Primavera Unifier, Contract Management, BI Publisher, UCM/Sharepoint, P6 Risk, AutoVue and Analytics
� Hard Dollar, HCSS, Acumen Fuse, Ecosys, Prism G2, US Cost, Microsoft…
� Global Data Centers in USA, London, Singapore and Brisbane
6
Agenda
� New Features in 8.3
� Overview of P6 Visualizer
� Overview of a Linear Project
� Overview of a “Linear Graphic’
� Structuring P6 to Support a “Linear Graphic”
� Creating a “Linear Graphic” with P6 Visualizer
� Completing the graphic presentation
� Summary & Questions
Linear Scheduling with P6 Visualizer 8.3
7
Significant New Features in P6 8.3
� Top Down Estimation
� Discussion Tab on the Activities Window
� Visualizer – Bar Chart & Time-scaled Logic Diagram graphics
� Modify Global Data on XML Import
� Export project data to UN/CEFACT
� Online HTML Help
� Loading Resource Summary Data on Startup
� Improved Integration with Unifier
Visualizer in 8.3 replaces the Time Scaled Logic Diagram in 8.2
8
New Features in P6 8.3
� Visualizer
– Creates Gantt (bar) charts and Time-Scaled Logic Diagrams (TSLD)
– Rolling dates on filters and timescales
– Group and sort by hierarchical fields
– Import Activity Layouts (bar charts) from P6 Professional
– Show Line Numbers on the grid
– Rename Column Titles
– Save Grid Settings back to Options
Added in SP1 (July) and SP2 (January)
9
Overview of P6 Visualizer
� Desktop application that installs automatically with P6 Pro.
� Directly connects to a P6 database (Pro or EPPM).
� Allows multiple activities on one line to reduce output pages.
� More color, shape and font control than P6 Layouts.
� Stores separate set of Layouts from P6 Pro (can import P6 Pro Layouts).
� Can share Visualizer Layouts from other users by importing.
� Uses P6 Admin Preferences and security.
Reporting tool that supports Gantt and Time Scaled Logic diagrams
Where to Get P6 DocumentationFor the most up-to-date versions of all manuals and technical documents related to installing, administering, and using P6 Professional, go to:http://download.oracle.com/docs/cd/E35157_01/index.htm.
10
Overview of a “Linear Project”
� A Highway or a pipeline would be a “linear project” based on distance.
� A high-rise building could be linear based on height.
� Some activities occur at fixed locations (culverts, bridges…).
� Some activities start at one location and move to another (paving…).
� Schedule conflicts can occur between “moving” & “stationary” activities.
� Critical Path diagrams may require more detail to incorporate conflicts.
� The staggered “crew chase” of these projects may preclude “true CPM”
methodology or at least force “complicated compliance”.
Project scope incorporates distance (length or height)
11
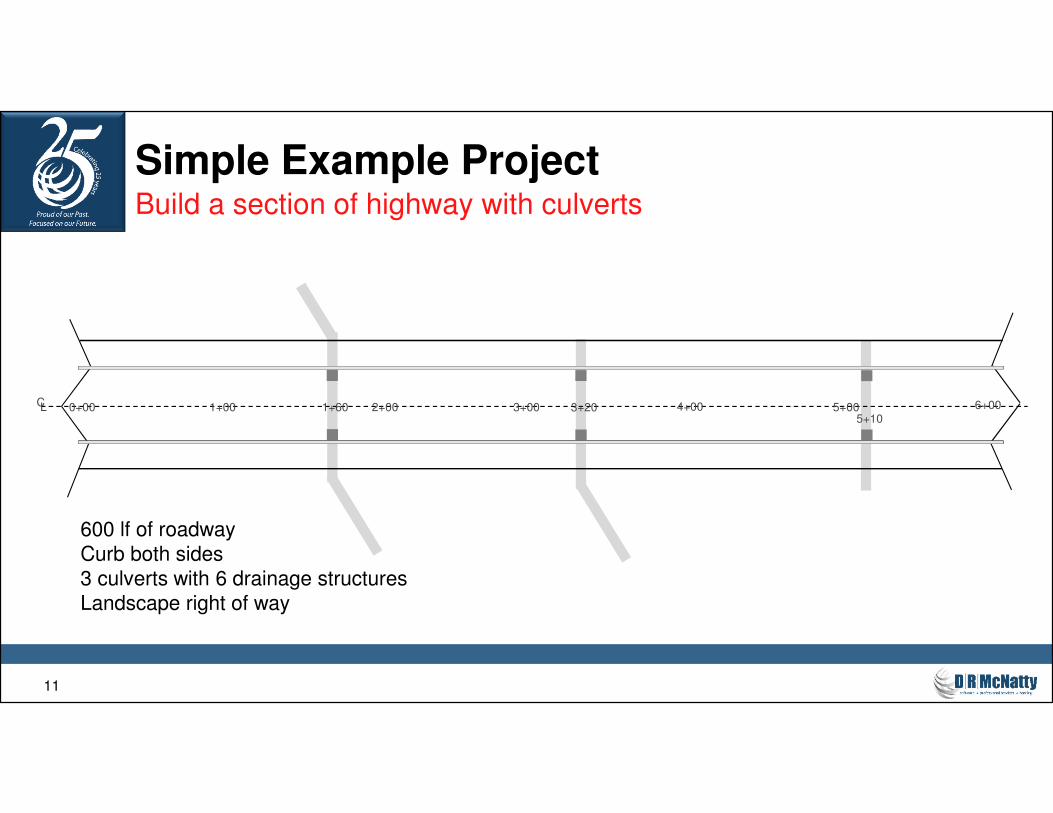
Simple Example ProjectBuild a section of highway with culverts
CL 0+00 6+001+00 2+00 3+00 4+00 5+001+60 3+205+10
600 lf of roadway
Curb both sides
3 culverts with 6 drainage structures
Landscape right of way
12
Overview of a “Linear Graphic”
� Mobile activities: excavation, grading, stone base, curbing, paving
� Stationary activities: drainage structures and culverts.
� Stationary activities that are not completed on time will interrupt the flow
of mobile activities that have to pass through the same space.
� Most mobile activities overlap – commonly referred to as a “crew chase”.
� Overlap starts/finishes require SS/FF with lags, usually driven by the
finish of a predecessor – can force “negative lag”.
� A “Linear Graphic” can show conflicts without forcing too much detail.
Compares mobile to stationary activities
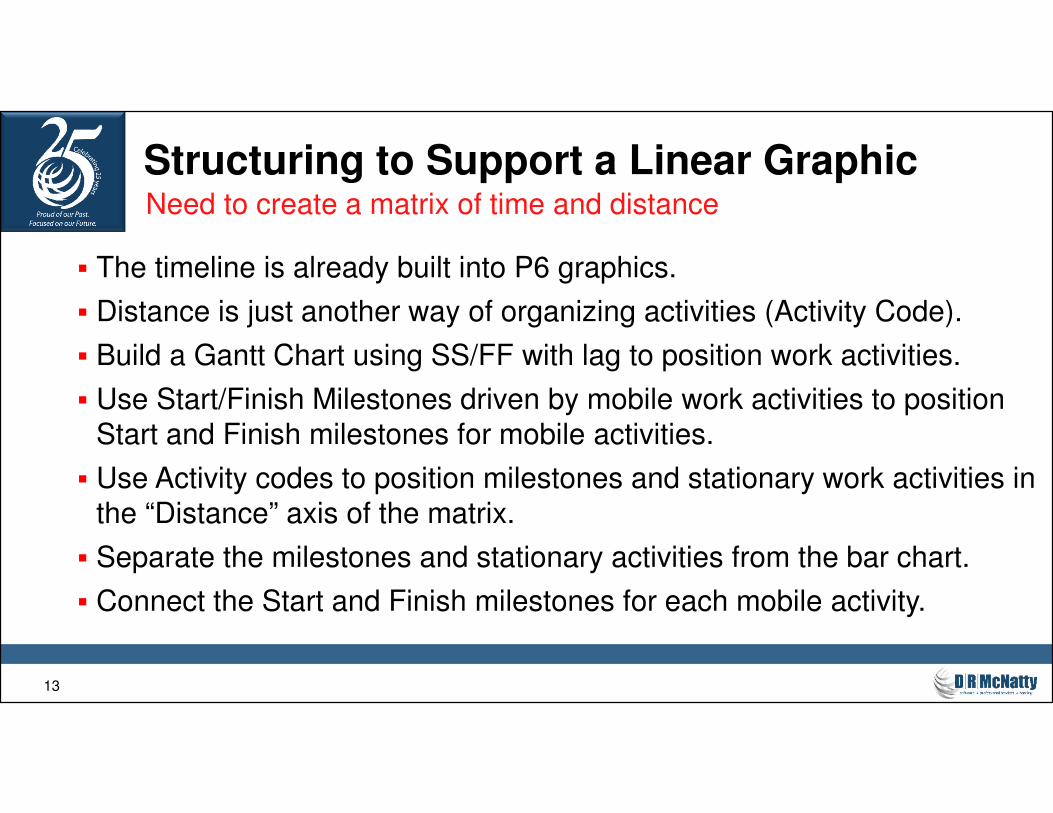
13
Structuring to Support a Linear Graphic
� The timeline is already built into P6 graphics.
� Distance is just another way of organizing activities (Activity Code).
� Build a Gantt Chart using SS/FF with lag to position work activities.
� Use Start/Finish Milestones driven by mobile work activities to position
Start and Finish milestones for mobile activities.
� Use Activity codes to position milestones and stationary work activities in
the “Distance” axis of the matrix.
� Separate the milestones and stationary activities from the bar chart.
� Connect the Start and Finish milestones for each mobile activity.
Need to create a matrix of time and distance
14
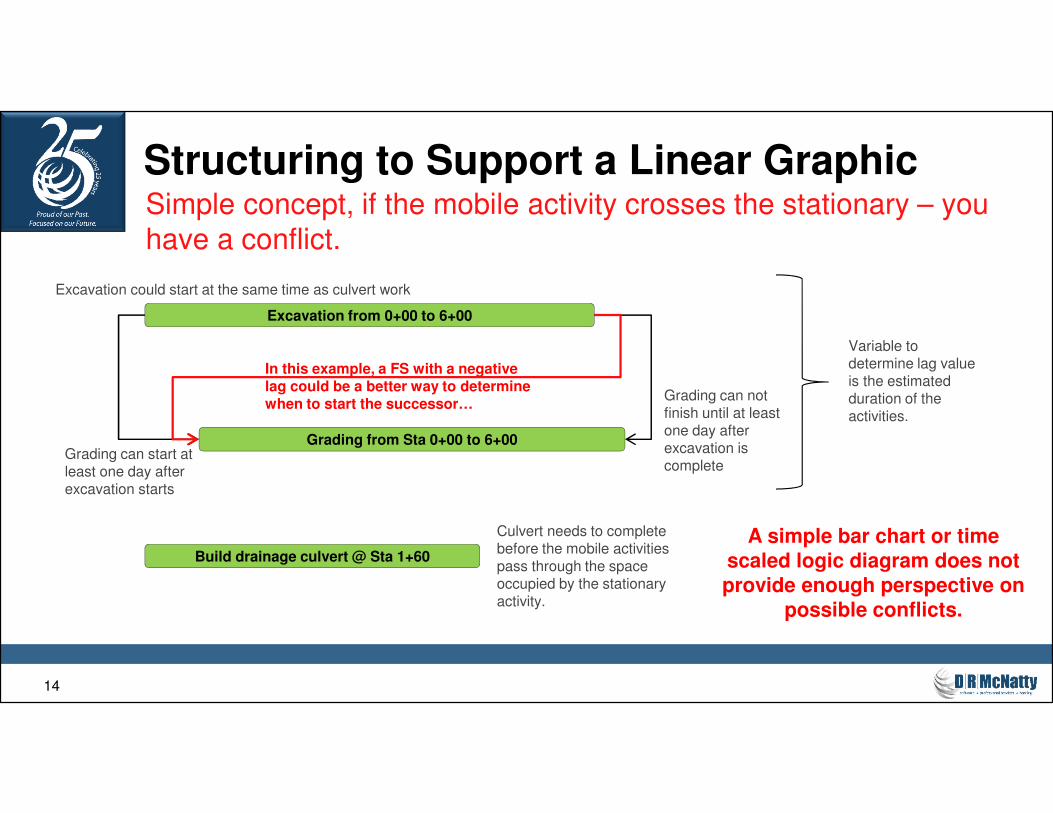
Structuring to Support a Linear GraphicSimple concept, if the mobile activity crosses the stationary – you
have a conflict.
Excavation from 0+00 to 6+00
Grading from Sta 0+00 to 6+00
Build drainage culvert @ Sta 1+60
Excavation could start at the same time as culvert work
Grading can not finish until at least one day after excavation is complete
Grading can start at least one day after excavation starts
Culvert needs to complete before the mobile activities pass through the space occupied by the stationary activity.
Variable to determine lag value is the estimated duration of the activities.
In this example, a FS with a negative lag could be a better way to determine when to start the successor…
A simple bar chart or time scaled logic diagram does not provide enough perspective on
possible conflicts.
15
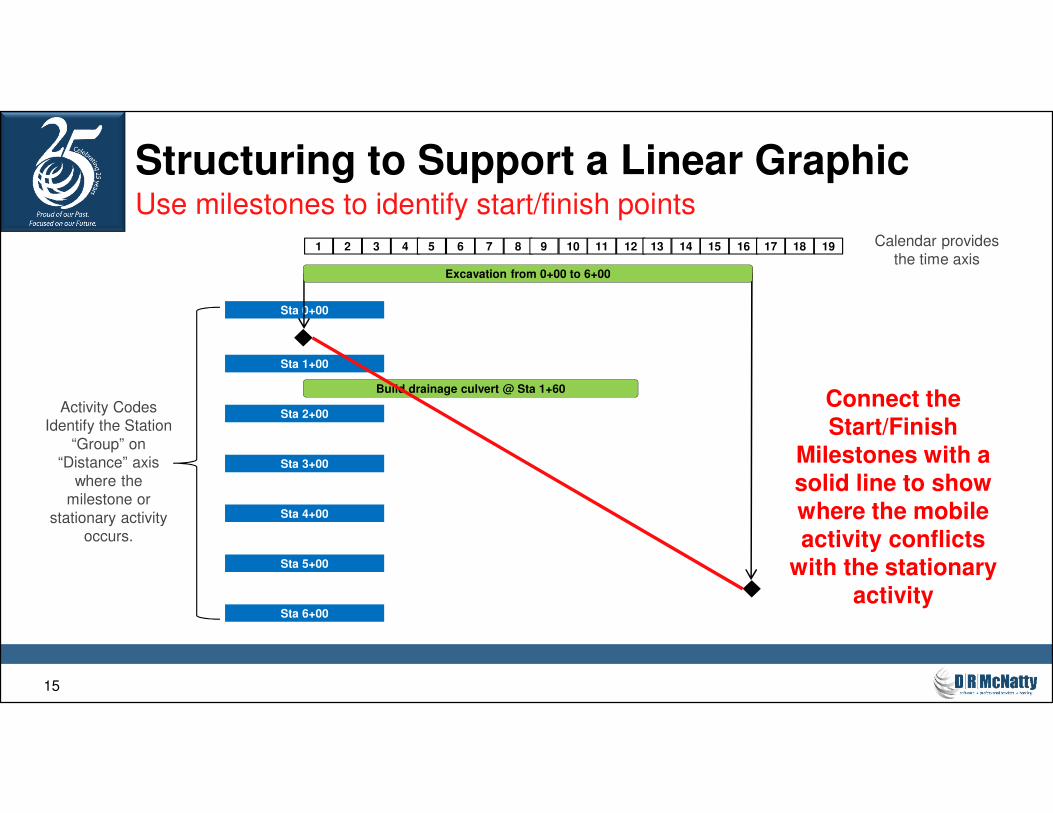
Sta 0+00
Structuring to Support a Linear GraphicUse milestones to identify start/finish points
Excavation from 0+00 to 6+00
Build drainage culvert @ Sta 1+60
Sta 1+00
Sta 2+00
Sta 3+00
Sta 4+00
Sta 5+00
Sta 6+00
1
Activity CodesIdentify the Station
“Group” on “Distance” axis
where the milestone or
stationary activity occurs.
2 3 4 5 6 7 8 9 10 11 12 13 14 15 16 Calendar provides the time axis
Connect the Start/Finish
Milestones with a solid line to show where the mobile activity conflicts
with the stationary activity
17 18 19
16
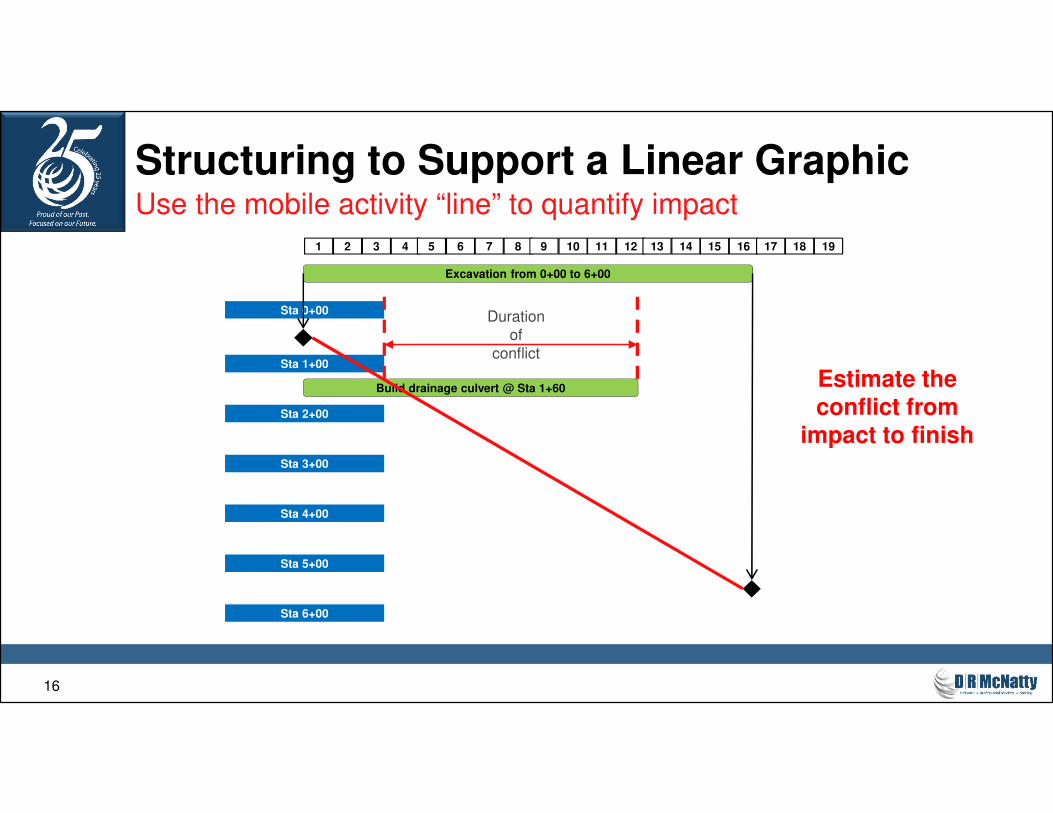
Structuring to Support a Linear GraphicUse the mobile activity “line” to quantify impact
Excavation from 0+00 to 6+00
Build drainage culvert @ Sta 1+60
Sta 0+00
Sta 1+00
Sta 2+00
Sta 3+00
Sta 4+00
Sta 5+00
Sta 6+00
1 2 3 4 5 6 7 8 9 10 11 12 13 14 15 16
Duration of
conflict
Estimate the conflict from
impact to finish
17 18 19
17
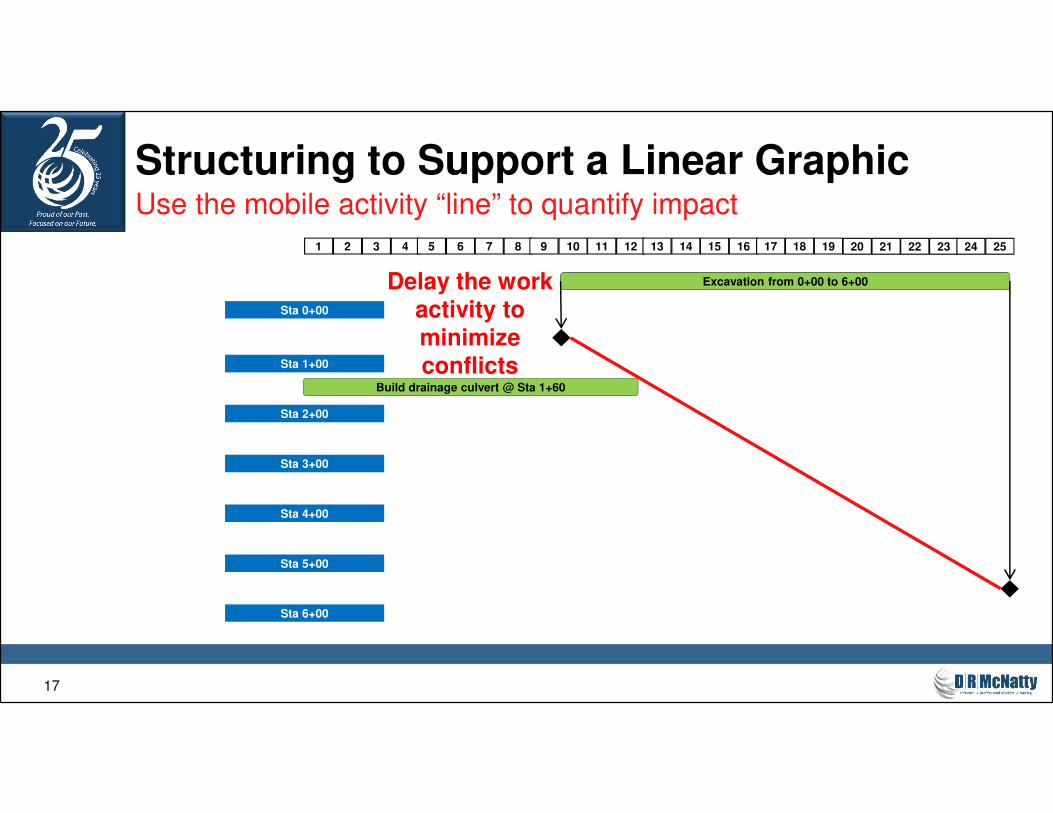
Structuring to Support a Linear GraphicUse the mobile activity “line” to quantify impact
Excavation from 0+00 to 6+00
Build drainage culvert @ Sta 1+60
Sta 0+00
Sta 1+00
Sta 2+00
Sta 3+00
Sta 4+00
Sta 5+00
Sta 6+00
1 2 3 4 5 6 7 8 9 10 11 12 13 14 15 16
Delay the work activity to minimize conflicts
17 18 19 20 21 22 23 24 25
18
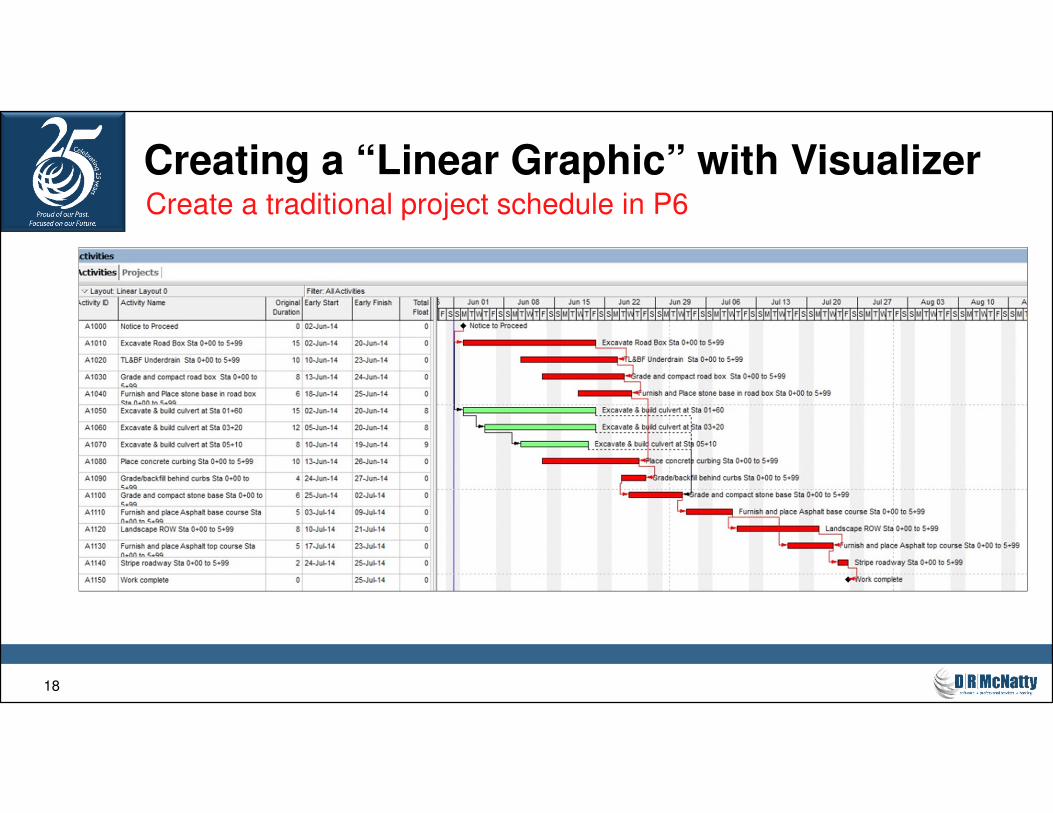
Creating a “Linear Graphic” with VisualizerCreate a traditional project schedule in P6
19
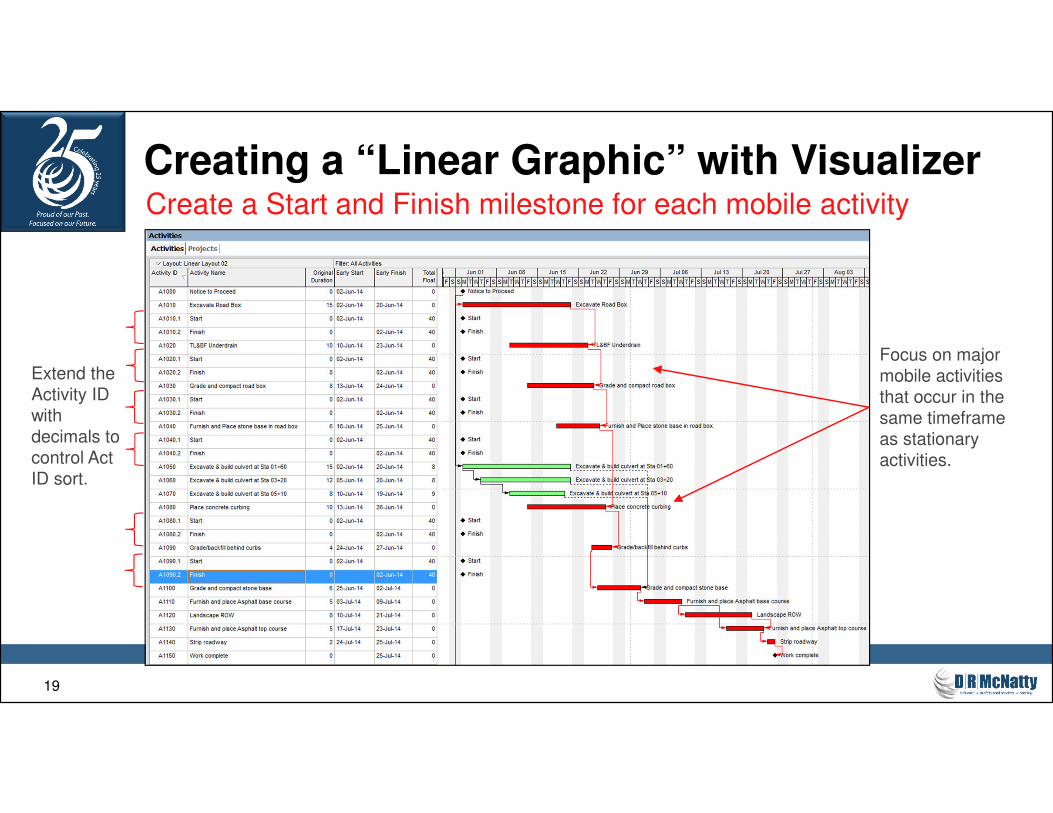
Creating a “Linear Graphic” with VisualizerCreate a Start and Finish milestone for each mobile activity
Extend the
Activity ID
with
decimals to
control Act
ID sort.
Focus on major
mobile activities
that occur in the
same timeframe
as stationary
activities.
20
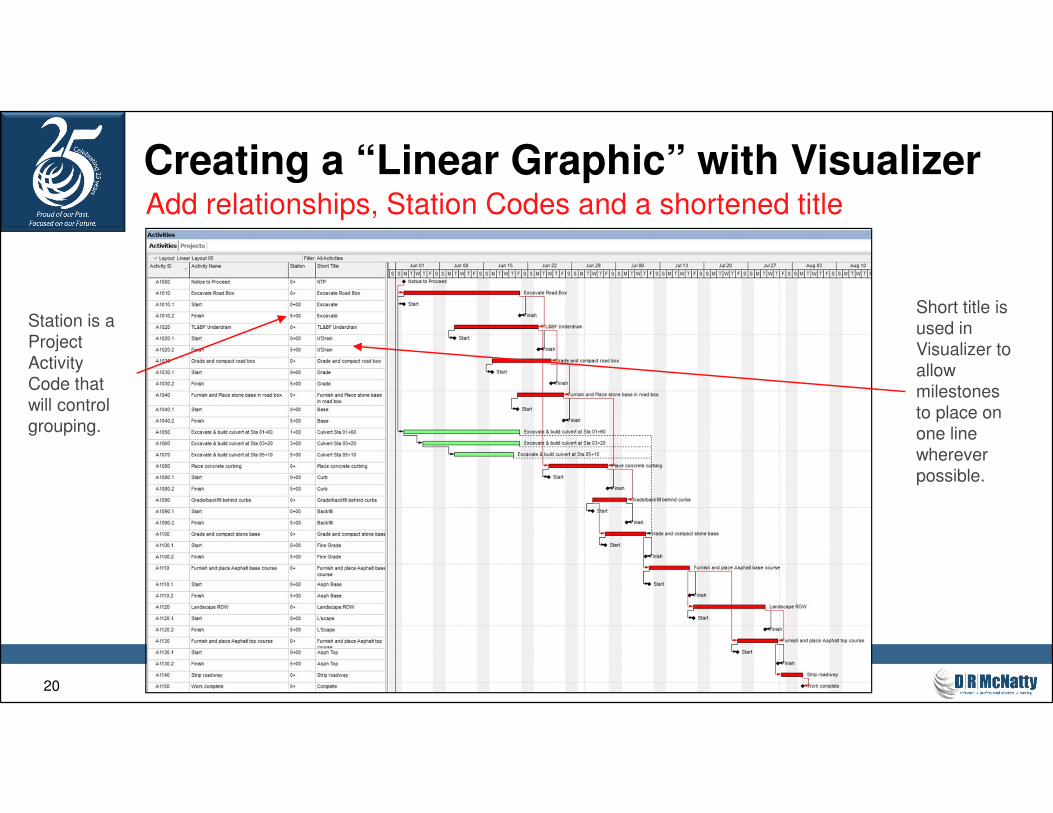
Creating a “Linear Graphic” with VisualizerAdd relationships, Station Codes and a shortened title
Station is a
Project
Activity
Code that
will control
grouping.
Short title is
used in
Visualizer to
allow
milestones
to place on
one line
wherever
possible.
21
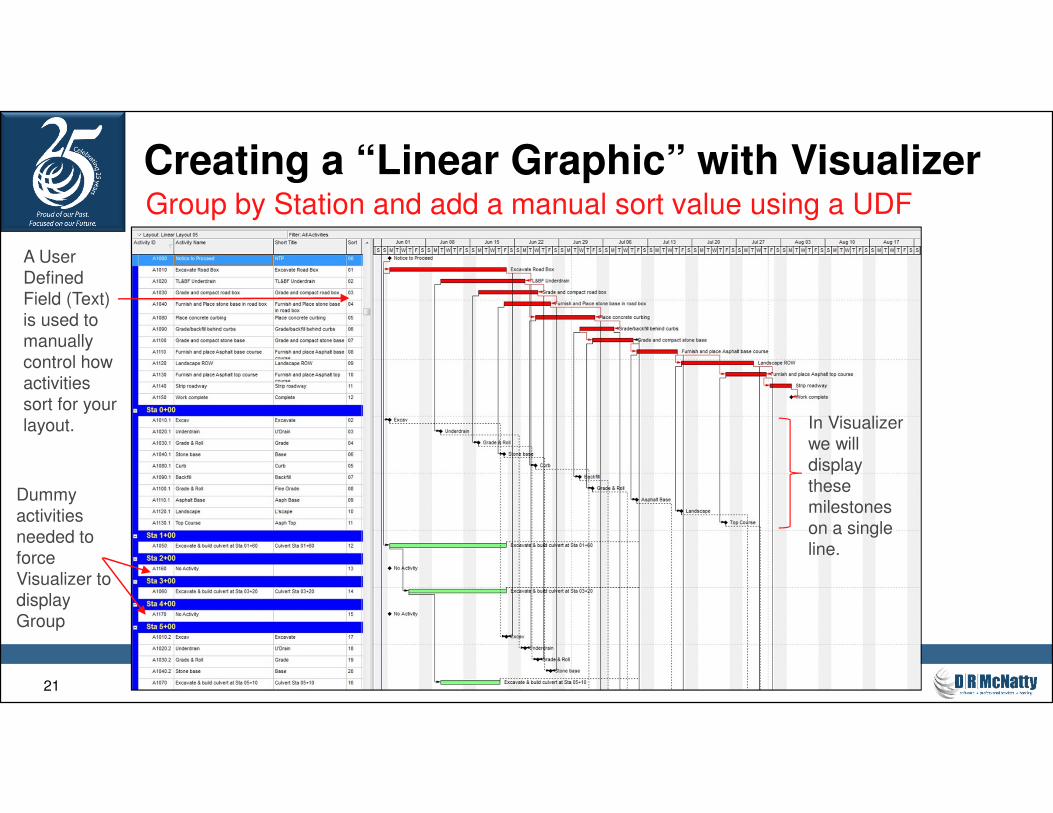
Creating a “Linear Graphic” with VisualizerGroup by Station and add a manual sort value using a UDF
A User
Defined
Field (Text)
is used to
manually
control how
activities
sort for your
layout.
Dummy
activities
needed to
force
Visualizer to
display
Group
In Visualizer
we will
display
these
milestones
on a single
line.
22
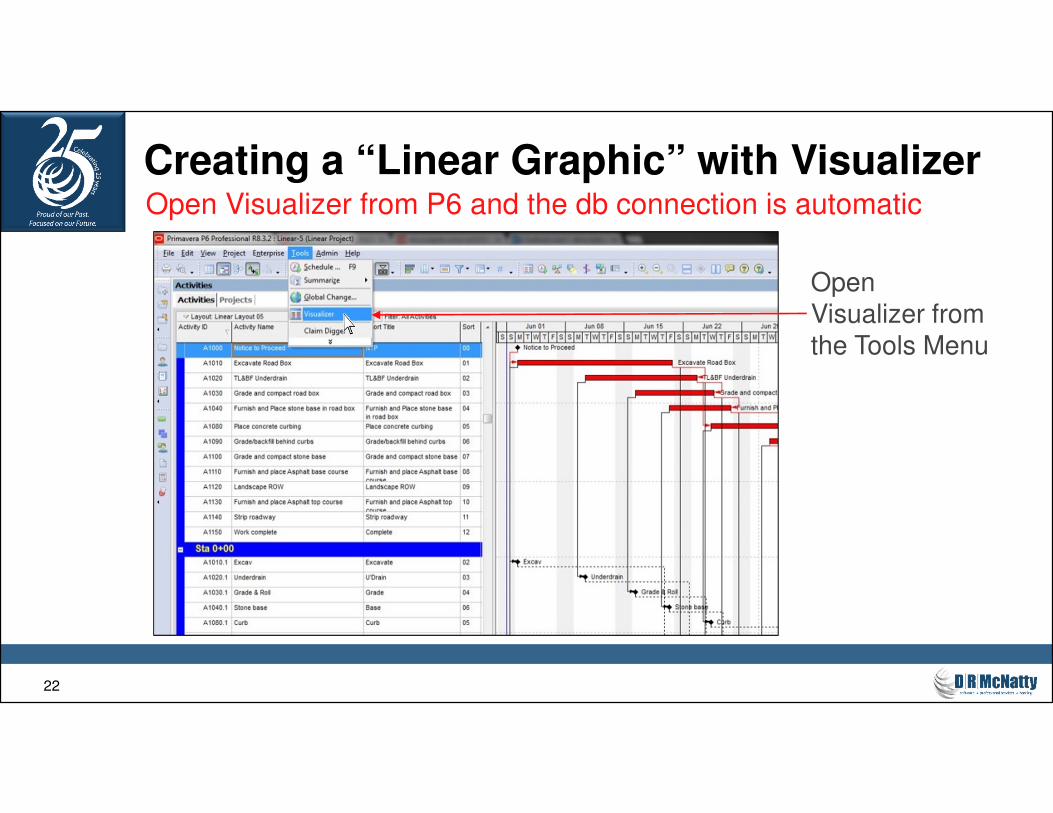
Creating a “Linear Graphic” with VisualizerOpen Visualizer from P6 and the db connection is automatic
Open
Visualizer from
the Tools Menu
23
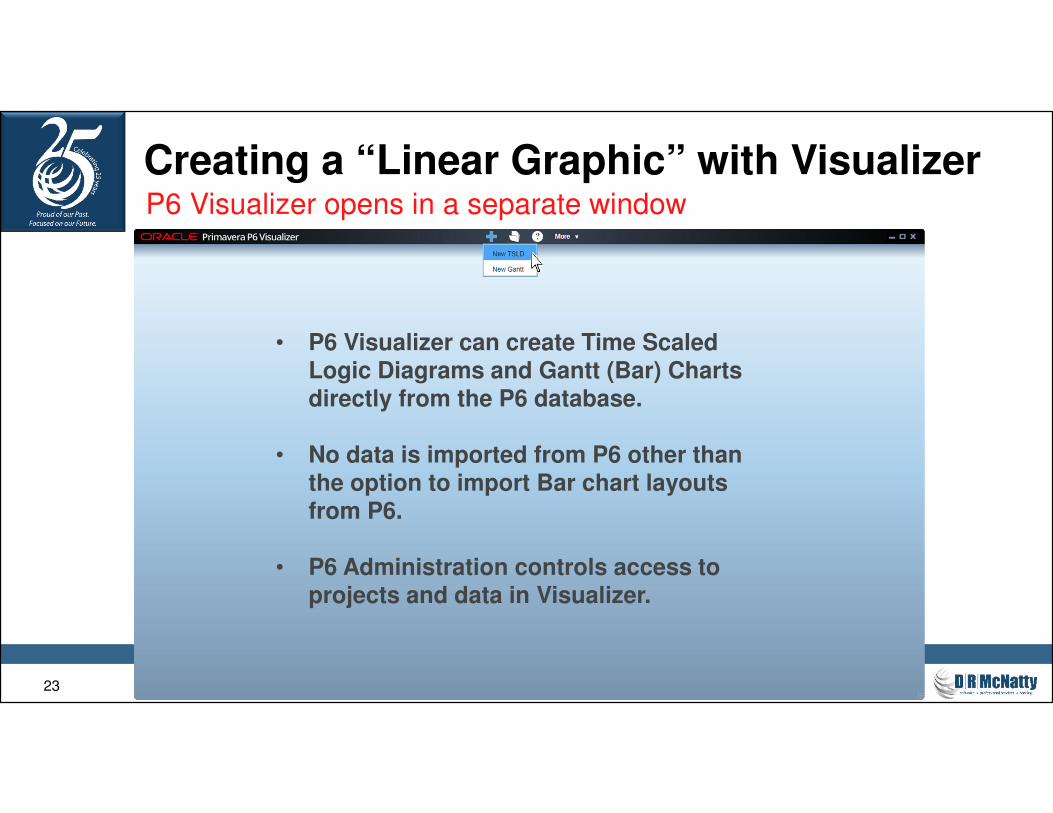
Creating a “Linear Graphic” with VisualizerP6 Visualizer opens in a separate window
• P6 Visualizer can create Time Scaled Logic Diagrams and Gantt (Bar) Charts directly from the P6 database.
• No data is imported from P6 other than the option to import Bar chart layouts from P6.
• P6 Administration controls access to projects and data in Visualizer.
24
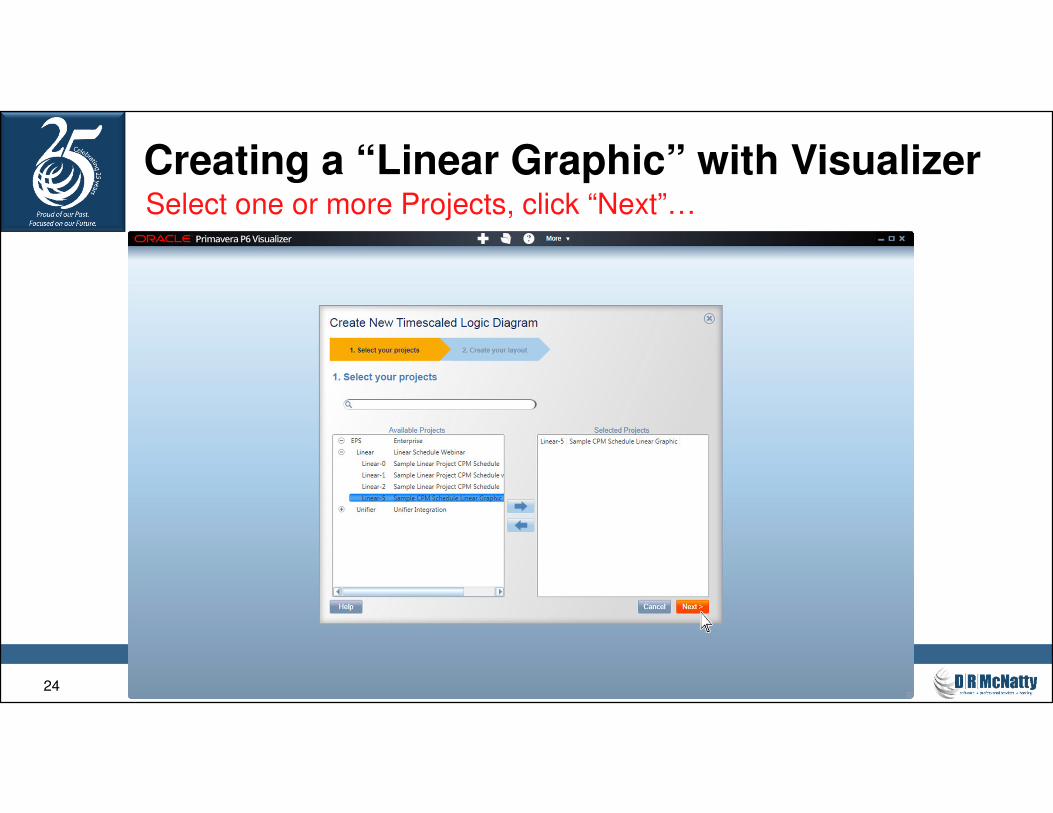
Creating a “Linear Graphic” with VisualizerSelect one or more Projects, click “Next”…
25
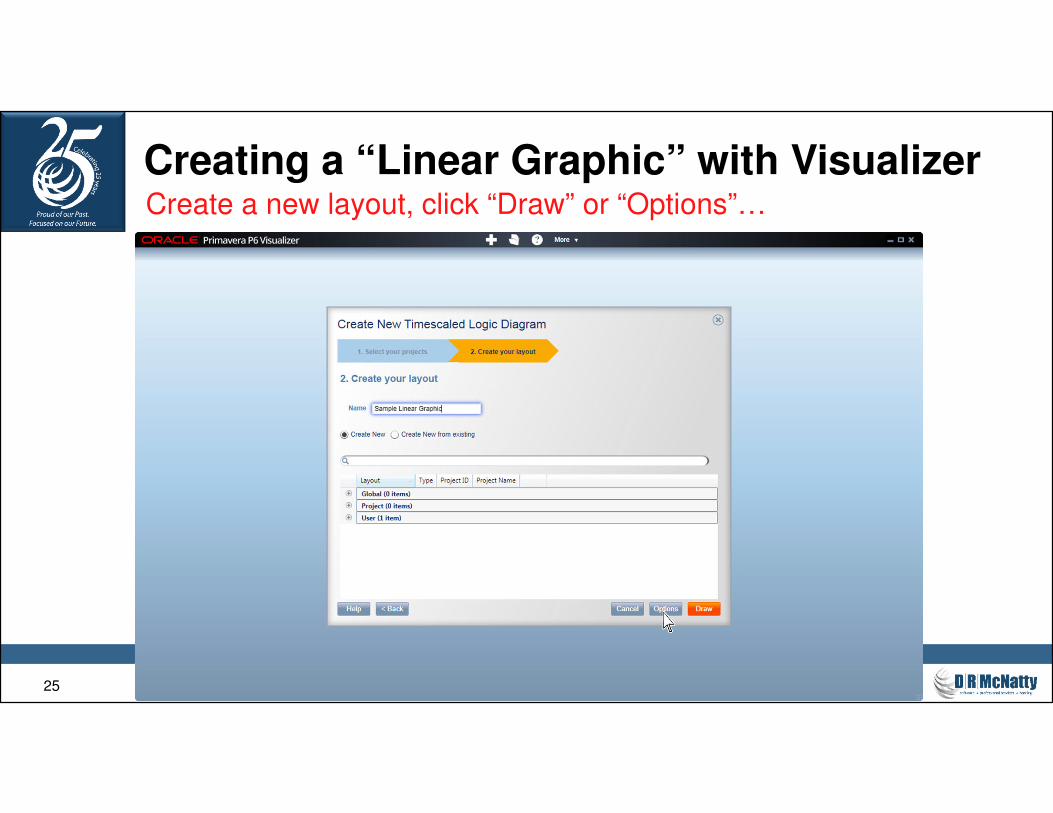
Creating a “Linear Graphic” with VisualizerCreate a new layout, click “Draw” or “Options”…
26
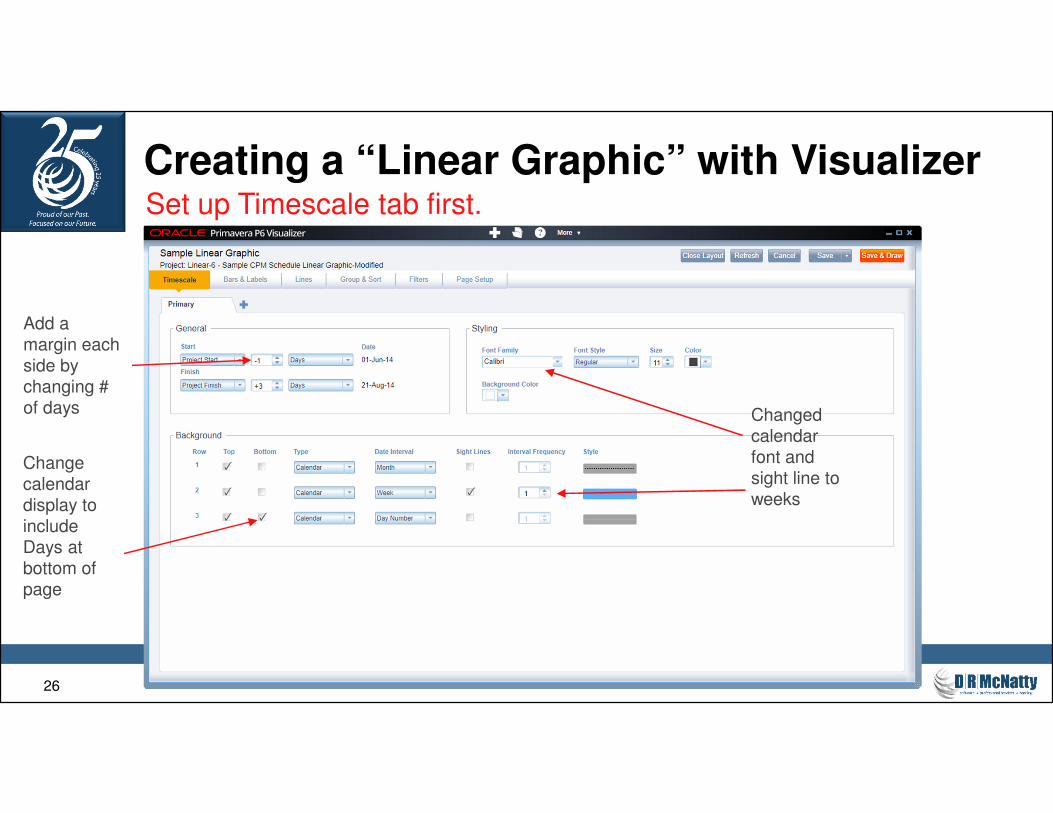
Creating a “Linear Graphic” with VisualizerSet up Timescale tab first.
Add a
margin each
side by
changing #
of days
Change
calendar
display to
include
Days at
bottom of
page
Changed
calendar
font and
sight line to
weeks
27
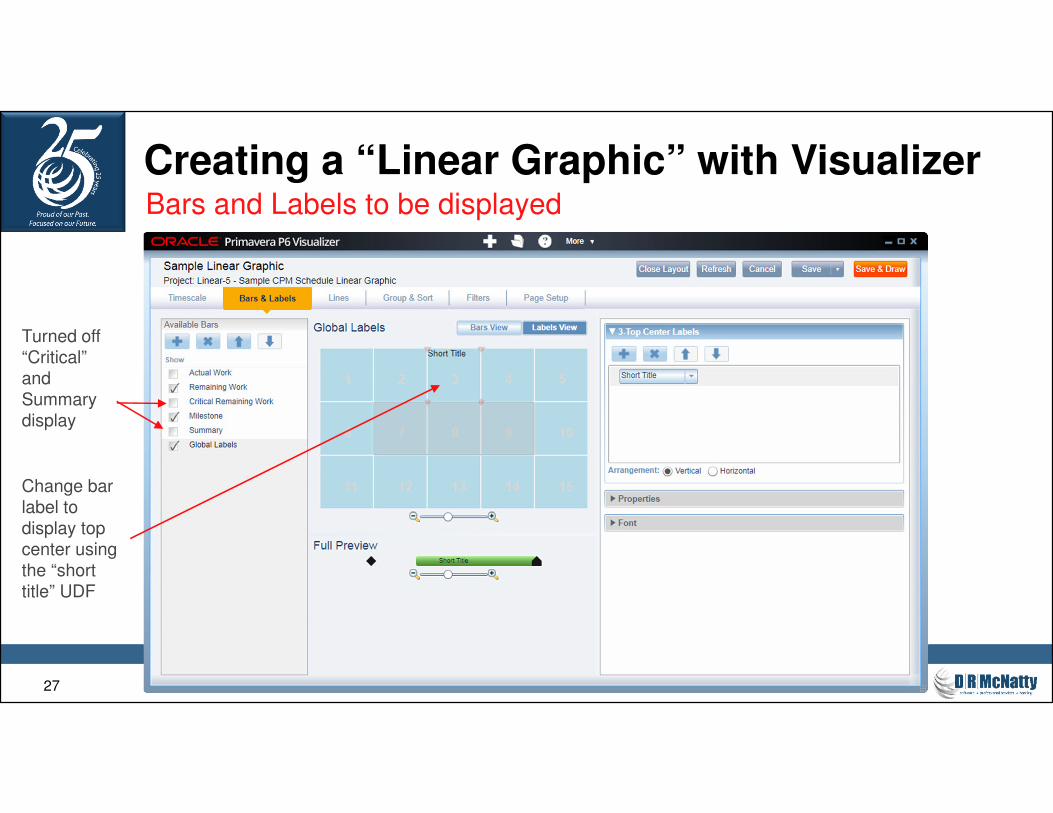
Creating a “Linear Graphic” with VisualizerBars and Labels to be displayed
Turned off
“Critical”
and
Summary
display
Change bar
label to
display top
center using
the “short
title” UDF
28
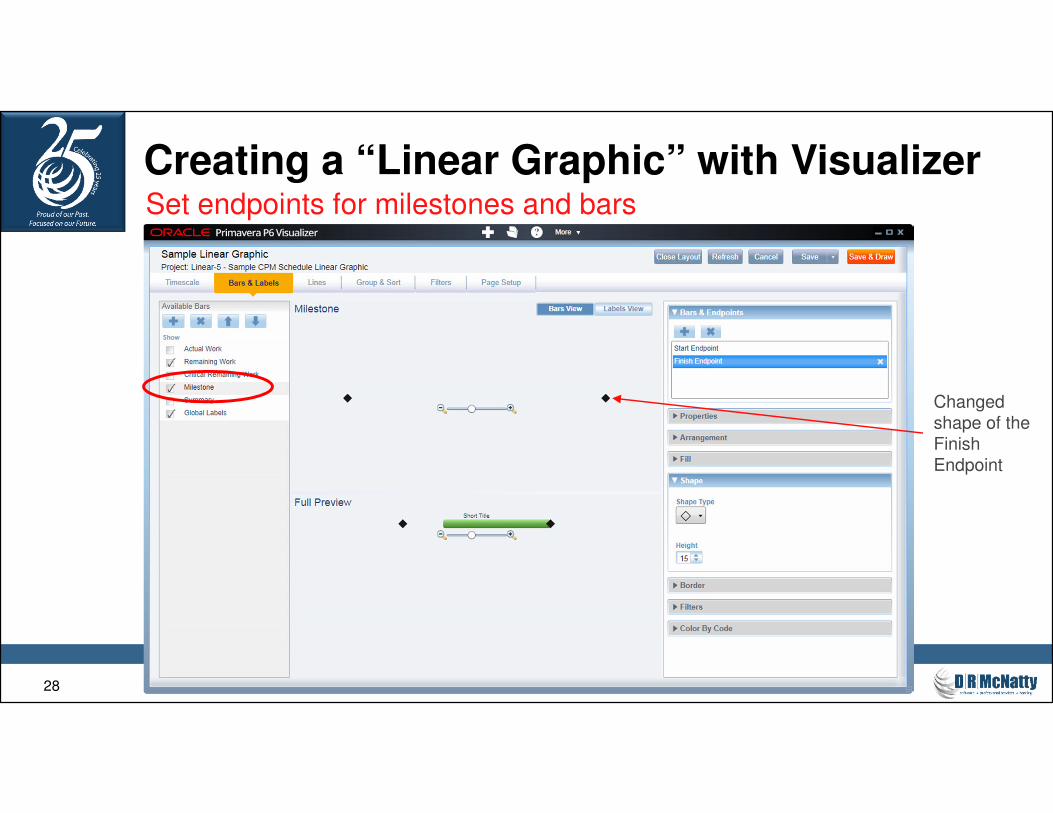
Creating a “Linear Graphic” with VisualizerSet endpoints for milestones and bars
Changed
shape of the
Finish
Endpoint
29
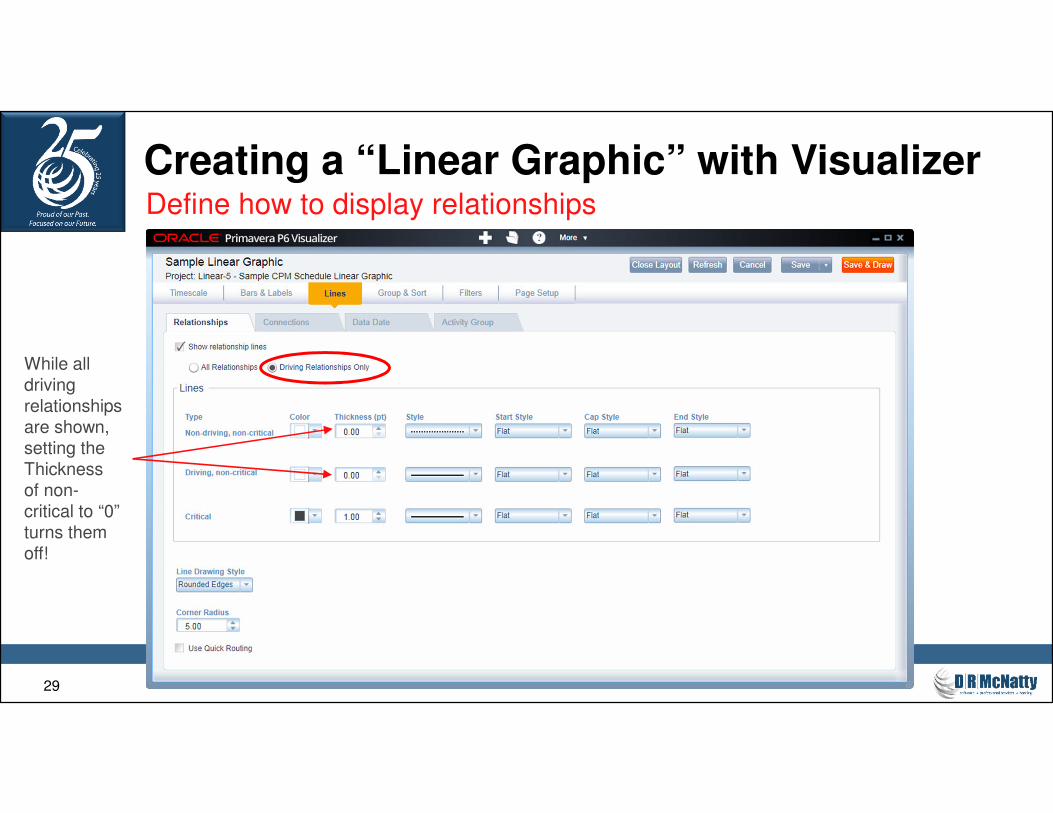
Creating a “Linear Graphic” with VisualizerDefine how to display relationships
While all
driving
relationships
are shown,
setting the
Thickness
of non-
critical to “0”
turns them
off!
30
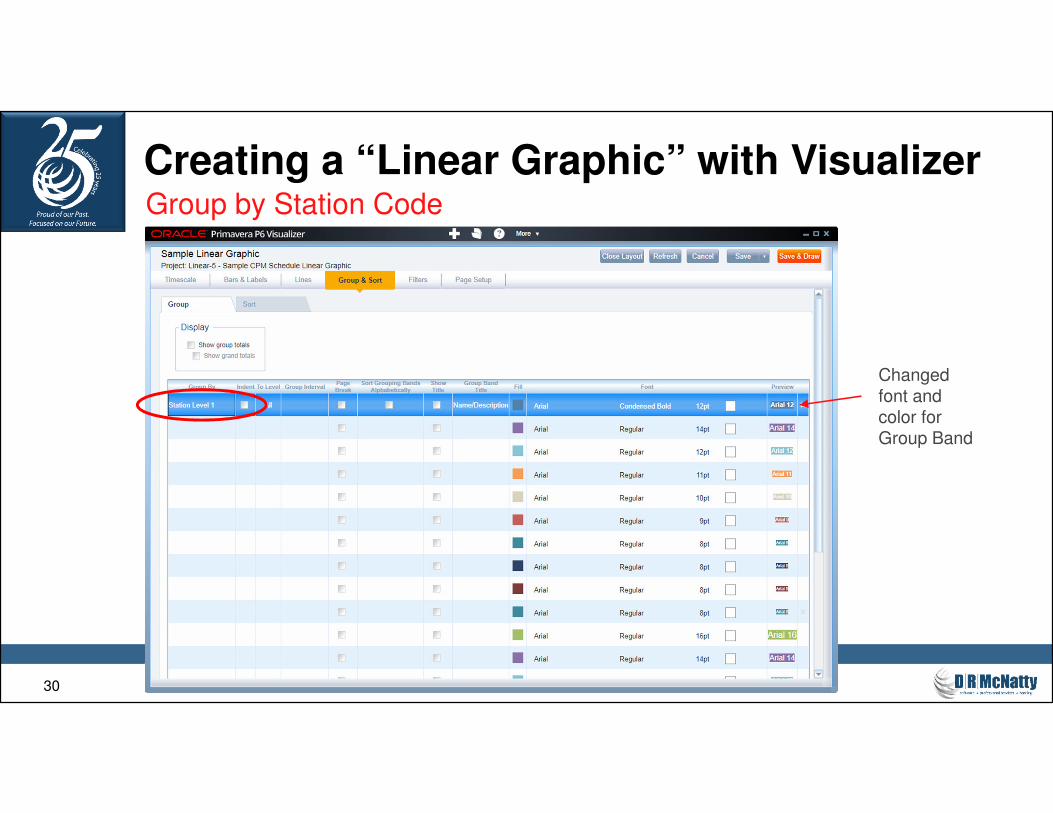
Creating a “Linear Graphic” with VisualizerGroup by Station Code
Changed
font and
color for
Group Band
31
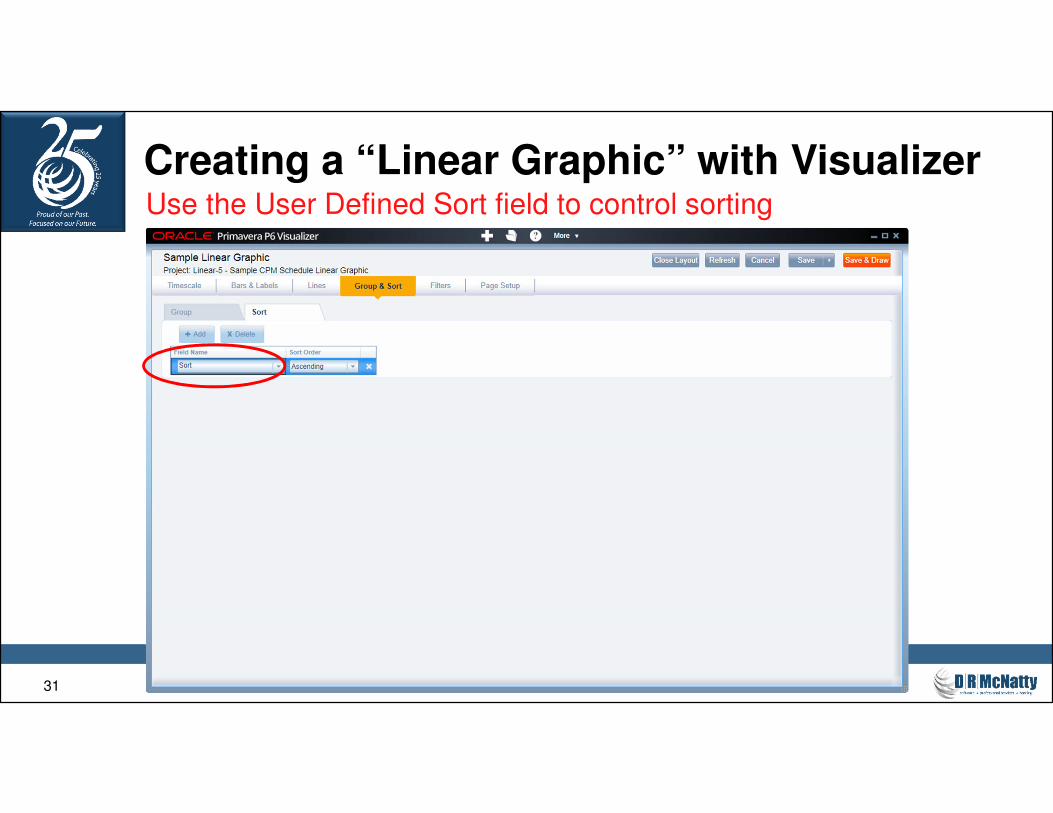
Creating a “Linear Graphic” with VisualizerUse the User Defined Sort field to control sorting
32
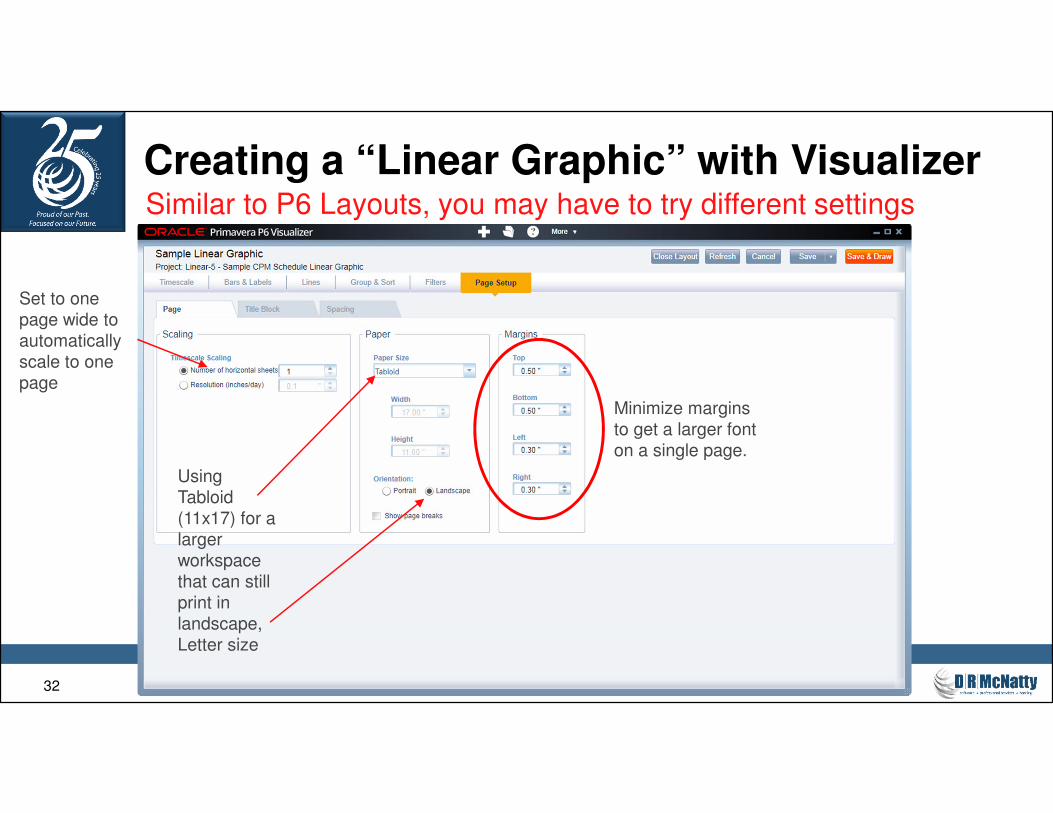
Creating a “Linear Graphic” with VisualizerSimilar to P6 Layouts, you may have to try different settings
Using
Tabloid
(11x17) for a
larger
workspace
that can still
print in
landscape,
Letter size
Set to one
page wide to
automatically
scale to one
page
Minimize margins
to get a larger font
on a single page.
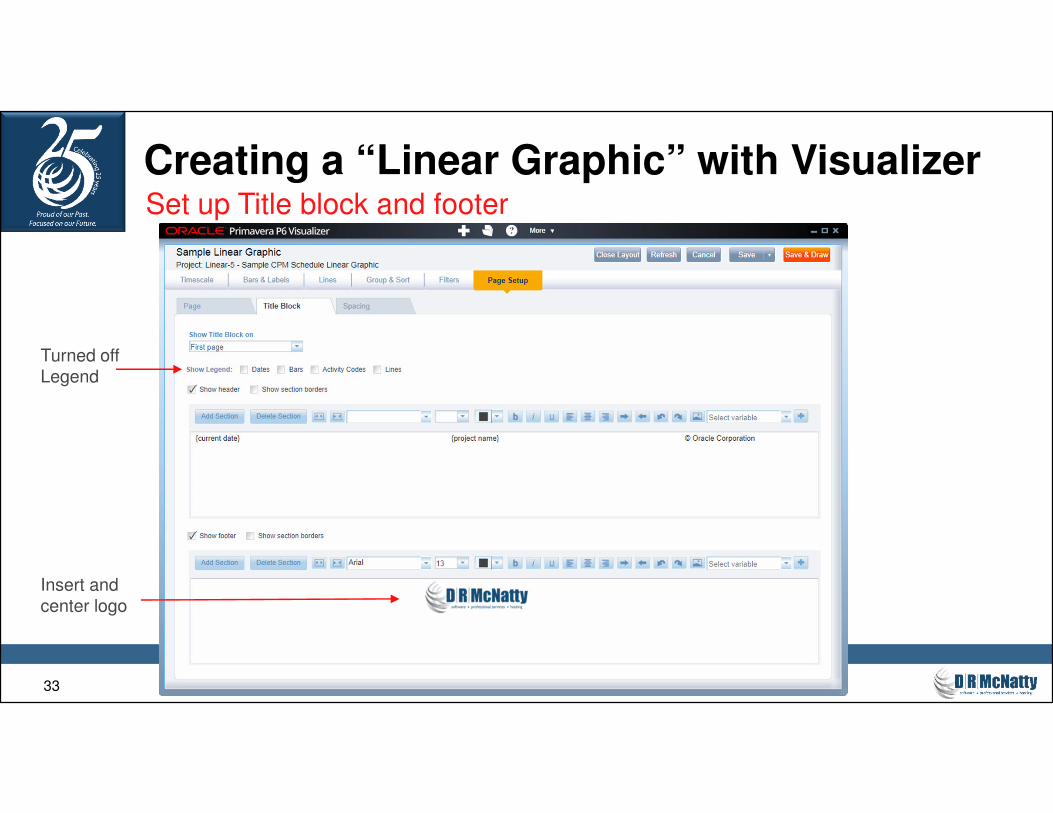
33
Creating a “Linear Graphic” with VisualizerSet up Title block and footer
Insert and
center logo
Turned off
Legend
34
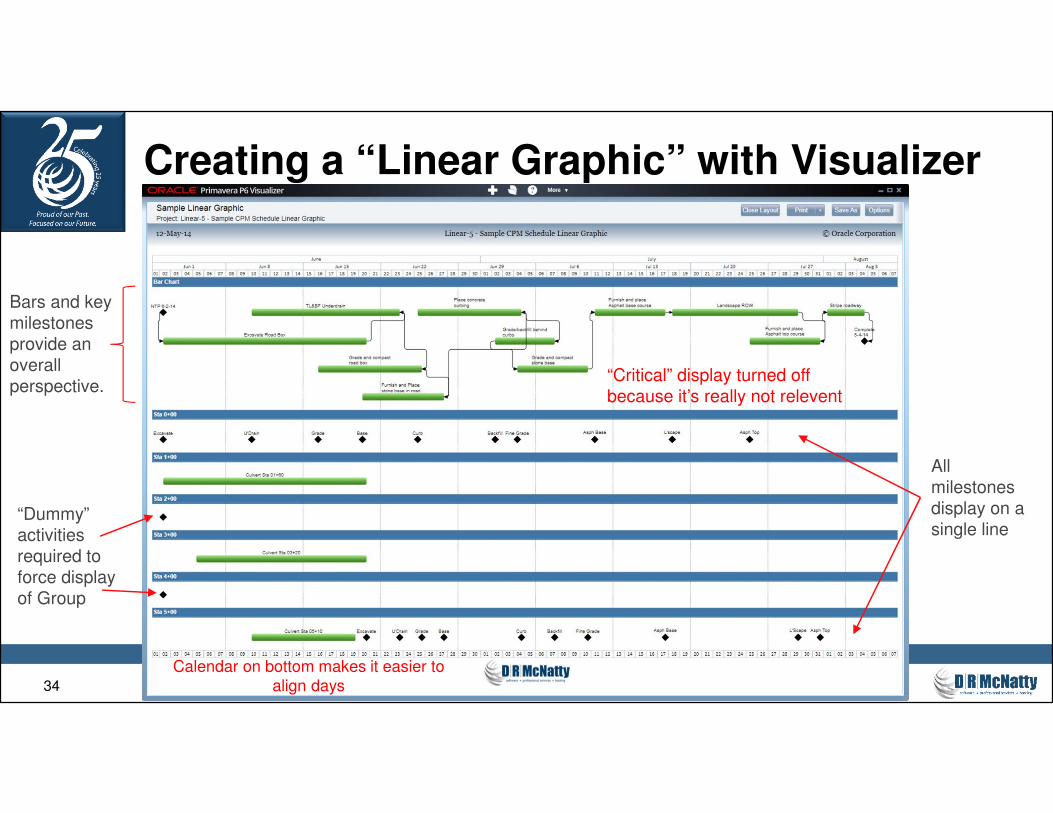
Creating a “Linear Graphic” with VisualizerSubtitle
Bars and key
milestones
provide an
overall
perspective.“Critical” display turned off
because it’s really not relevent
All
milestones
display on a
single line“Dummy”
activities
required to
force display
of Group
Calendar on bottom makes it easier to align days
35
Creating a “Linear Graphic” with Visualizer
� Similar to P6 Print/Preview, change one setting to impact another setting
– It took several iterations to get everything on one page and milestones on a
single line.
� Little things such as a Start milestone on the first day of the project would
not display until the day before the Start was included in the display
– EF on a Start Milestone is the day before the Milestone starts…
� The last step is to “connect the milestones”
– I used PDF Annotator software to modify a PDF graphic and finish the
presentation.
Working with the various tabs requires experimentation
36
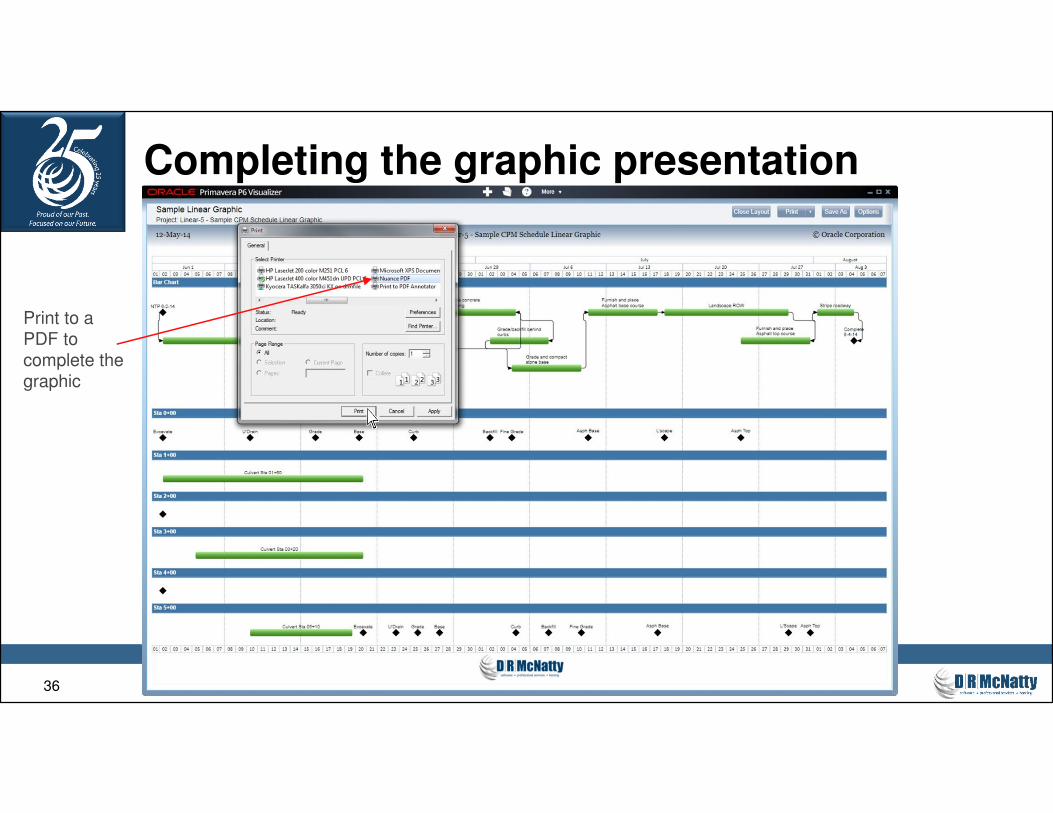
Completing the graphic presentationSubtitle
Print to a
PDF to
complete the
graphic
37
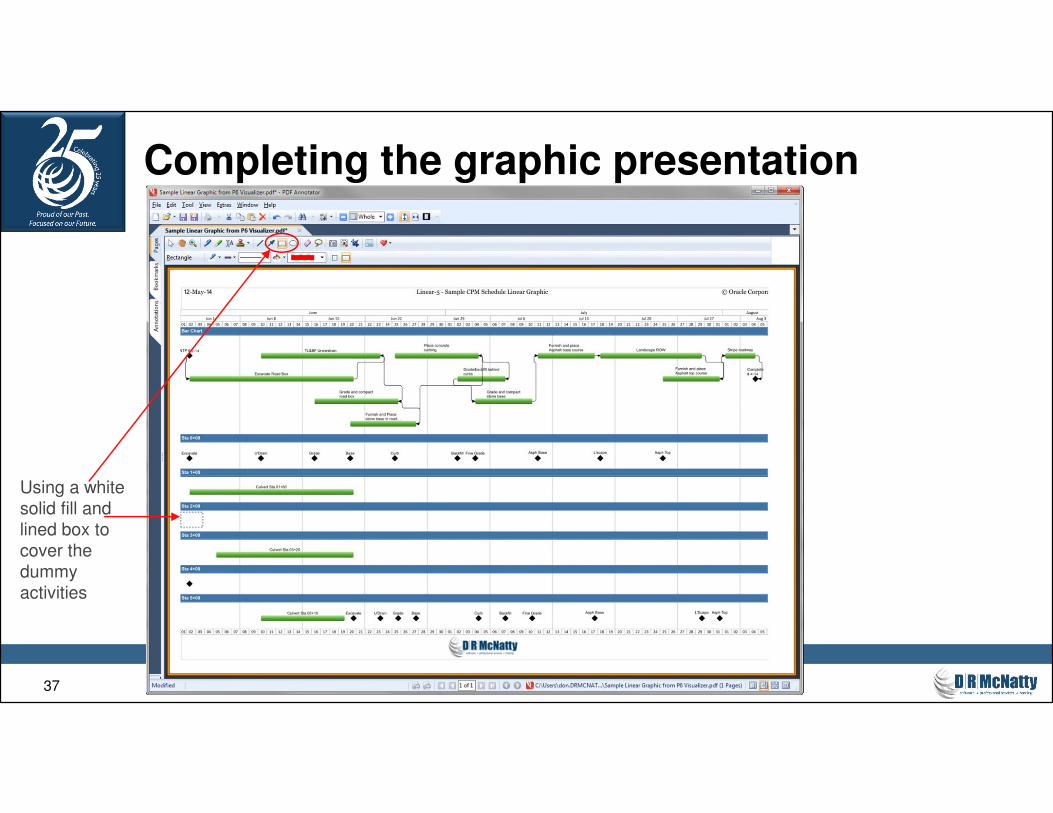
Completing the graphic presentationSubtitle
Using a white
solid fill and
lined box to
cover the
dummy
activities
38
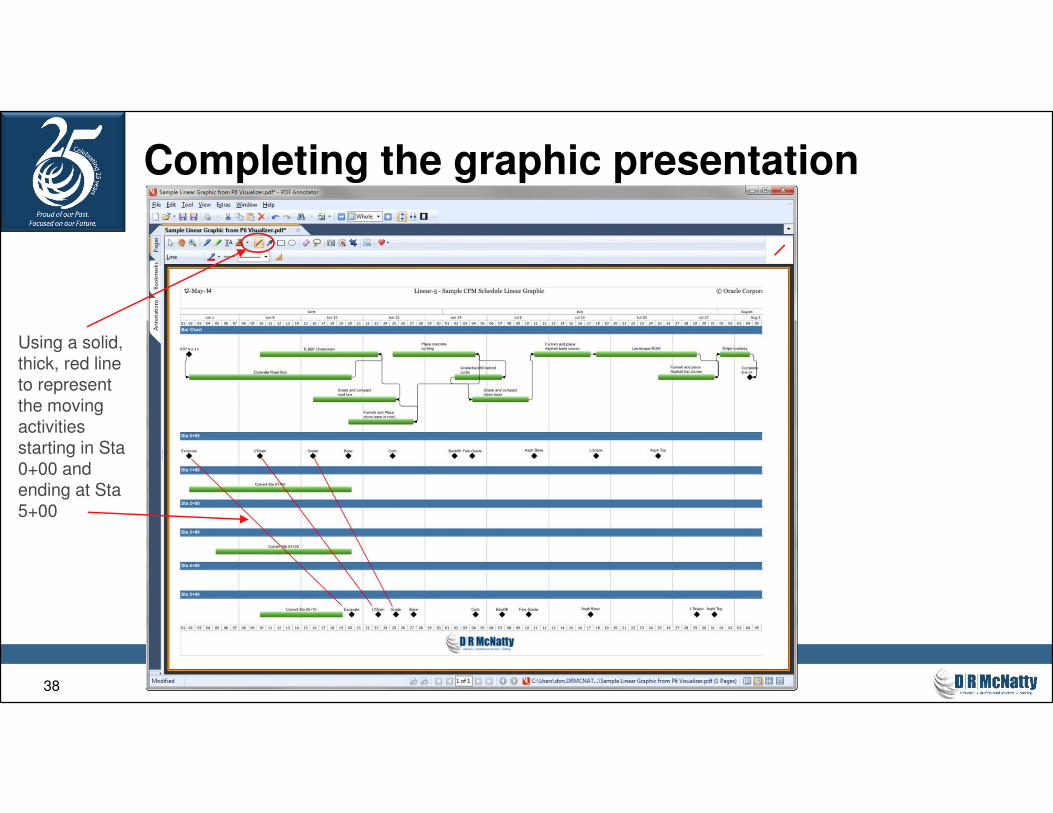
Completing the graphic presentationSubtitle
Using a solid,
thick, red line
to represent
the moving
activities
starting in Sta
0+00 and
ending at Sta
5+00
39
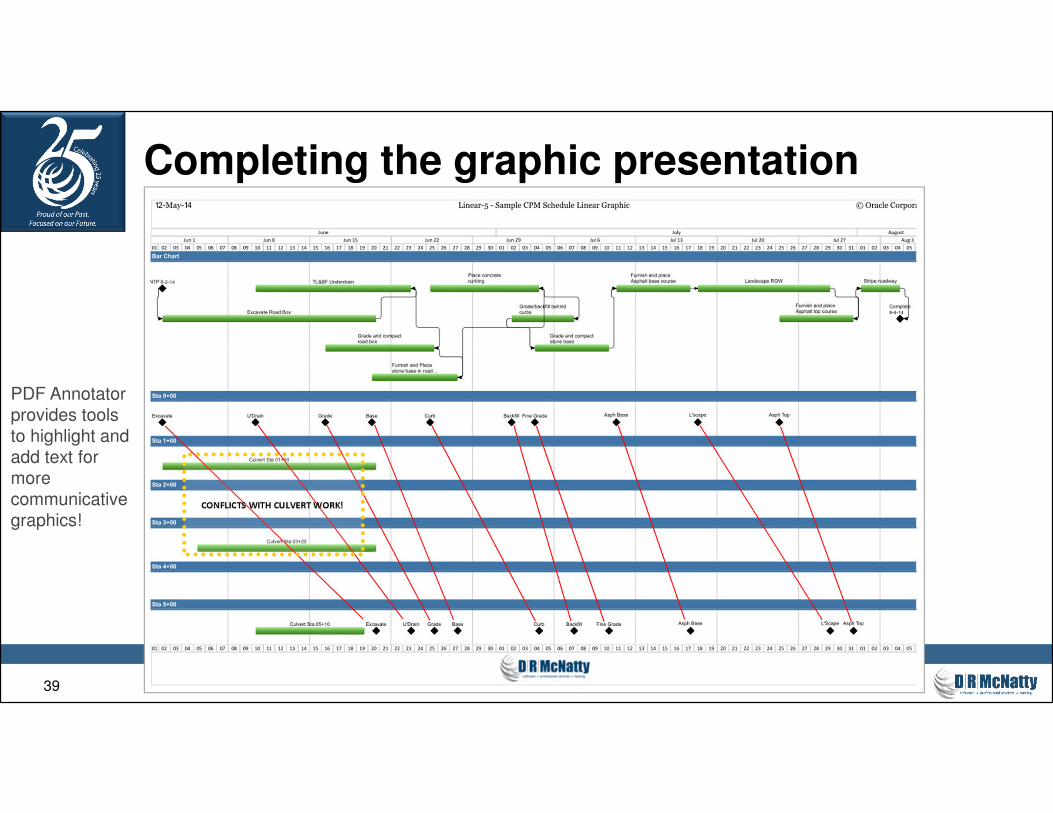
Completing the graphic presentation
PDF Annotator
provides tools
to highlight and
add text for
more
communicative
graphics!
40
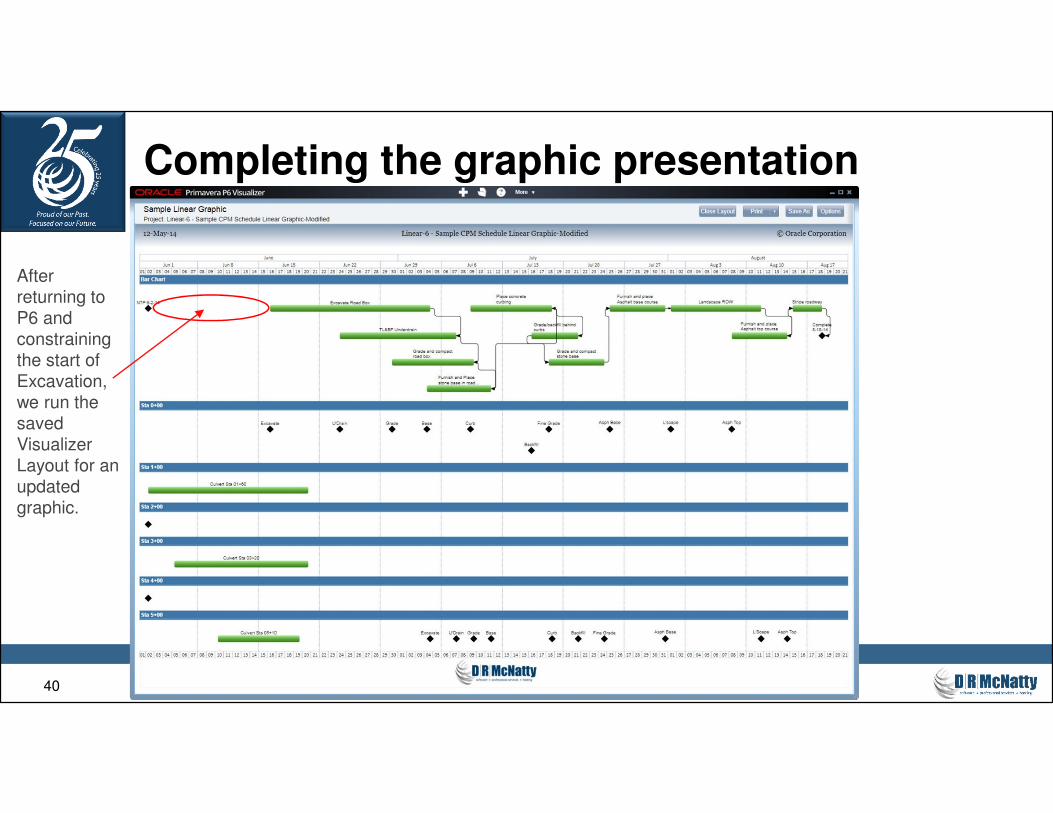
Completing the graphic presentation
After
returning to
P6 and
constraining
the start of
Excavation,
we run the
saved
Visualizer
Layout for an
updated
graphic.
41
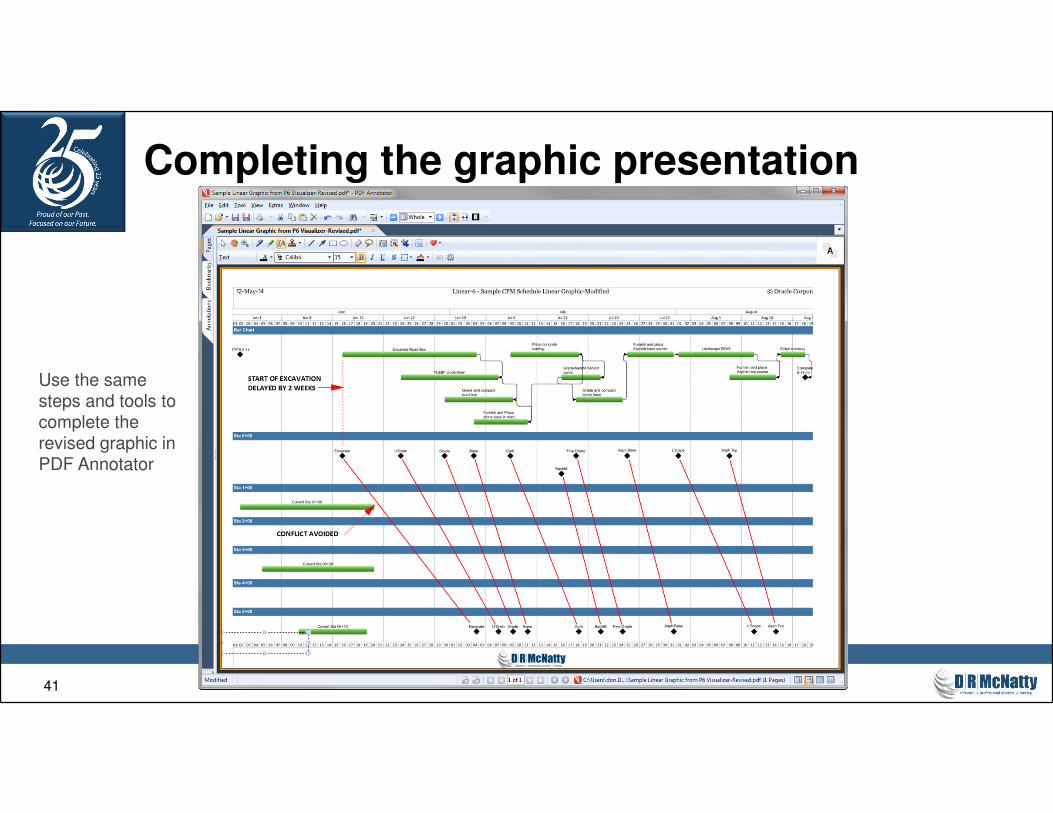
Completing the graphic presentation
Use the same
steps and tools to
complete the
revised graphic in
PDF Annotator
42
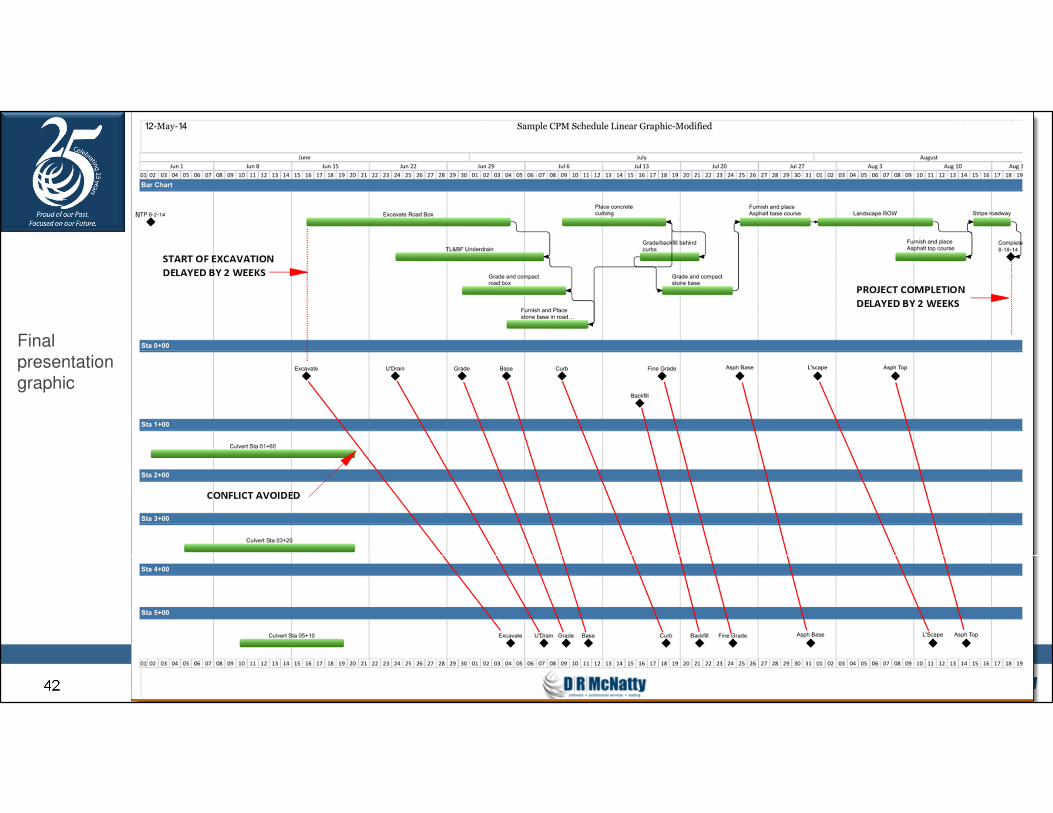
Final
presentation
graphic
43
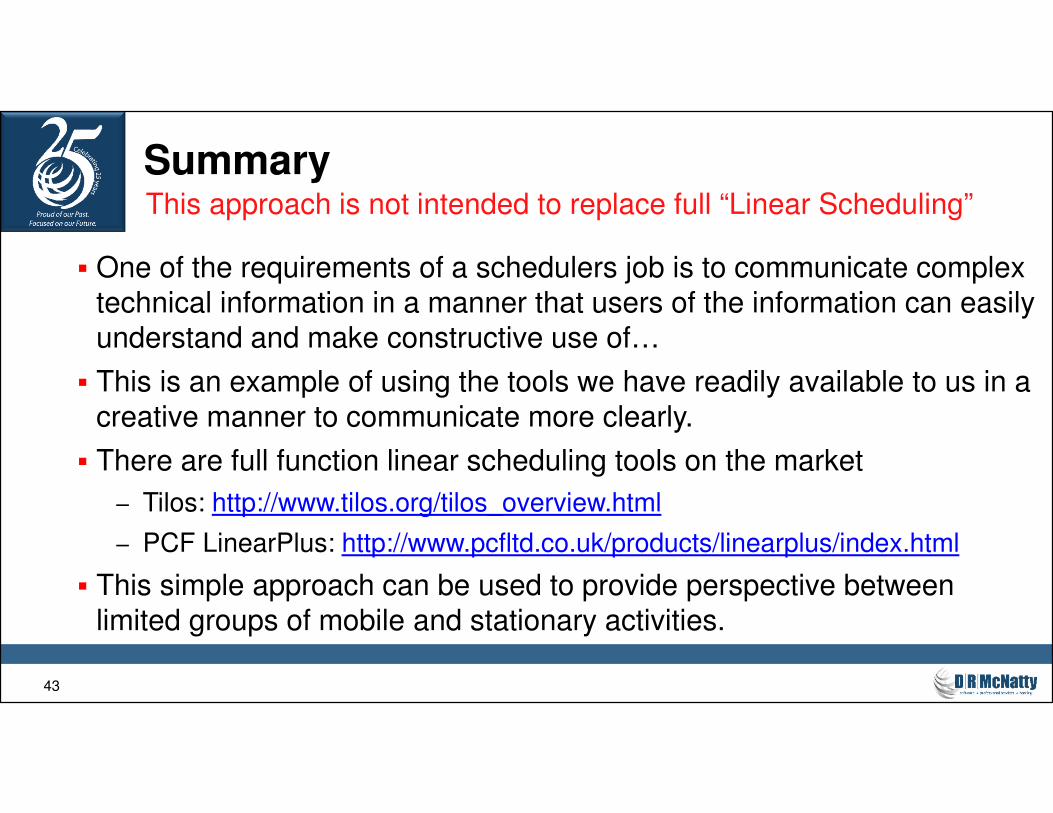
Summary
� One of the requirements of a schedulers job is to communicate complex
technical information in a manner that users of the information can easily
understand and make constructive use of…
� This is an example of using the tools we have readily available to us in a
creative manner to communicate more clearly.
� There are full function linear scheduling tools on the market
– Tilos: http://www.tilos.org/tilos_overview.html
– PCF LinearPlus: http://www.pcfltd.co.uk/products/linearplus/index.html
� This simple approach can be used to provide perspective between
limited groups of mobile and stationary activities.
This approach is not intended to replace full “Linear Scheduling”
44
Questions
� Answers are based on our own experiences using the
various software products related to your questions.
All questions are gathered into a master sheet, answered and
distributed to all registrants as well as posted on our website.
Thank you for participating� Don McNatty – [email protected]
45
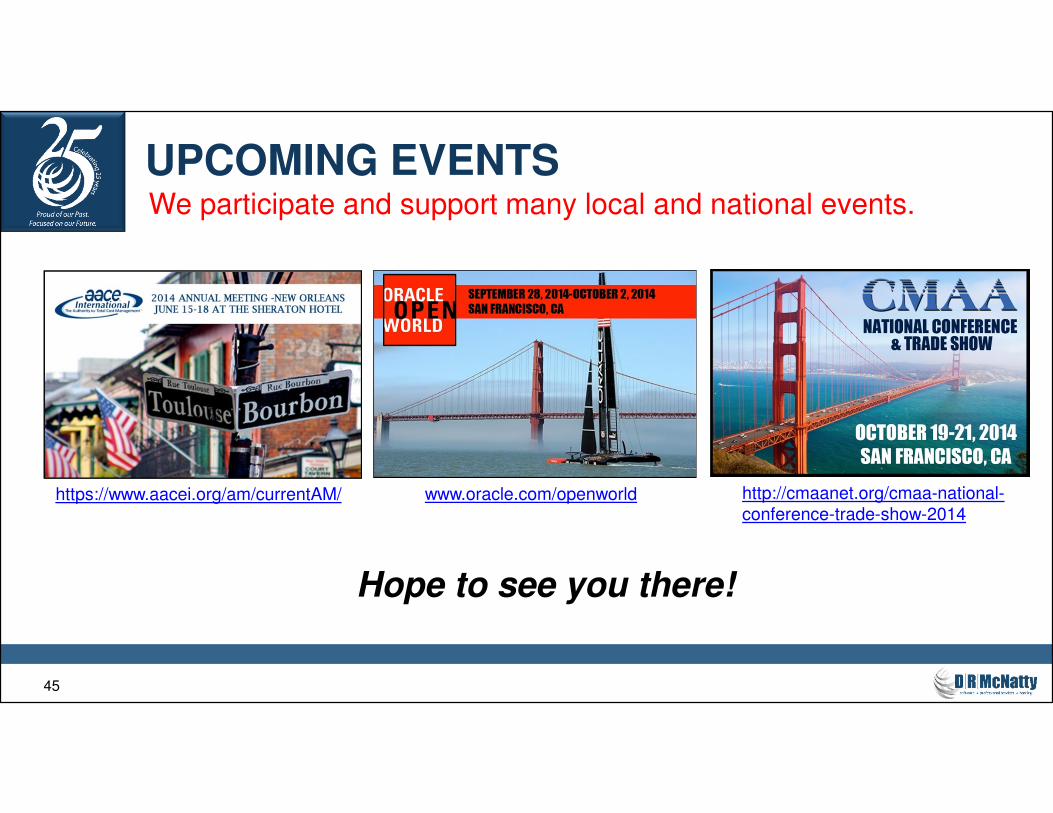
UPCOMING EVENTS
Hope to see you there!
We participate and support many local and national events.
https://www.aacei.org/am/currentAM/ www.oracle.com/openworld http://cmaanet.org/cmaa-national-
conference-trade-show-2014
46
Get updates on the latest news, events and upcoming webinars.
Sign up for our newsletter on our website www.drmcnatty.comClick on “News”
DRMcNatty monthly e-newsletter