limnological and fisheries investigations of flooded north ...€¦ · limnological and fisheries...
TRANSCRIPT
Limnological and Fisheries Investigations of Flooded North Slope Gravel Mine Sites, 1988
by Carl R. Hemming, Phyllis K. Weber,
and Jack F. Winters
Technical Report No. 89- 1
Alaska Department of Fish & Game Division of Habitat
Limnological and Fisheries Investigations of Flooded North Slope
Gravel Mine Sites, 1988
by Carl R. Hemming, Phyllis K. Weber,
and Jack F. Winters
Technical Report No. 89-1
Frank Rue Director
Habitat Division Alaska Department of Fish and Game
P.O. Box 3-2000 Juneau, Alaska 99802
August 1989
TABLE OF CONTENTS
............................................................................................................................................ List of Tables v
.......................................................................................................................................... List of Figures vi
Acknowledgements .................................................................................................................................. vii
Executive Summary ................................................................................................................................ ix
............................................................................................................................................... Introduction 1
Limnological Investigations ............................................................................................................... Introduction ...................................................................................................................................... Methods ................................................................................................................................................ Results ..................................................................................................................................................
............................................................................ Temperature and Dissolved Oxygen . . Primary P r o d u c t ~ v ~ t y ...........................................................................................................
......................................................................................... Phytoplankton Standing Crop Zooplankton .............................................................................................................................
Discussion ........................................................................................................................................... ................................................................................ Physical Limnology of Reservoirs . .
Primary Productlvlty ........................................................................................................... ......................................................................................... Phytoplankton Standing Crop
............................................................................................................................. Zooplankton
Arctic Grayling Population Estimate ............................................................................................ 28 Introduction ...................................................................................................................................... 28 Methods ................................................................................................................................................ 28 Results .................................................................................................................................................. 31
............................................................................................................. Population Estimate 31 ...................................................................... Use of the Enhancement Area by Fish 34
........................................................................................................................................... Discussion 34
................................................................................................. Arctic Grayling Disease Screening 41 Introduction ...................................................................................................................................... 41 Mcthods ................................................................................................................................................ 42 Results .................................................................................................................................................. 43
........................................................................................................................................... Discussion 45
Conclusions ................................................................................................................................................. 48
Literature Cited ....................................................................................................................................... 50
Appendix I: Dissolved oxygen and temperature data ........................................................... 52
Appendix 11: Fish disease screening results ............................................................................... 54
Appendix 111: Length. age. and sex of arctic grayling collected for ............................................................................................................................ disease screening 55
i i i

Appendix IV: Numbers of fish. by species. caught in fyke nets in the .............................................................. . Sagavanirktok River. 28 July 3 August 1988 57
Appendix V: Numbers of fish. by species. caught in gill nets in the Sagavanirktok River. 3-4 August 1988 ............................................................................... 58
Appendix VI: Lengths of fish. by species. caught i n fyke nets in the .............................................................. . Sagavanirktok River. 28 July 3 August 1988 59
LIST OF TABLES
Samples f rom North Slope flooded gravel mine sites with measurable amounts of photosynthetic activity, July and August 1988.
Average concentrations of chlorophyll-a in f ive flooded gravel mine sites on the North Slope, Alaska.
Average concentrations of chlorophyll-b and c in flooded gravel mine sites on the North Slope.
Estimated density of immature zooplankton (Daphnia < 0.75 mm; copepods < 0.5 mm) in flooded gravel mine sites, 1988.
Estimated densities of large (Daphnia > 0.75 mm; copepods > 0.5 mm) zooplankton in flooded gravel mine sites, 1988.
Number and percent of adult zooplankton by species present in flooded gravel mine sites, 1988.
Number of f ish captured, by species, and the catch per unit ef for t (CPUE) for four fyke nets in Sag Site C, 1988.
Age-length relationships for otolith- and scale-aged arctic grayling collected for disease screening 28 July - 4 August 1988 f rom the Sagavanirktok River near Prudhoe Bay.
Summary of physical and biological characteristics a t four flooded gravel mine sites.
LIST OF FIGURES
Map of the Prudhoe Bay - Kuparuk oilfields depicting the locations of flooded gravel mine sites sampled in 1988. 3
Concentrations of chlorophyll-a in f ive flooded gravel mine sites on the North Slope, Alaska. May 1988. 12
Concentrations of chlorophyll-a in four flooded gravel mine sites on the North Slope, Alaska. July 1988. 14
Concentrations of chlorophyll-a in four flooded gravel mine sites on the North Slope, Alaska. August 1988. 15
Locations of fyke nets for f ish sampling in Sag Site C, July and August 1988. 30
Proportions of each fish species captured, as percent of the total catch, f rom fyke nets in Sag Site C, 1988. 32
Size distribution of arctic grayling captured and marked in Sag Site C, July 1988. 3 3
Water temperatures in shallow and deep water areas of Sag Site C, July and August 1988. 3 7
The size distribution of arctic grayling captured in the shallow water habitat of Sag Site C between July 8 and July 11 1988. 3 8
ACKNOWLEDGEMENTS
Alan Townsend, Dr. Alvin Ott, and Roger Post of the Region I11 Habitat Division
and Janice Ott, a student volunteer f rom the University of Alaska-Fairbanks
assisted with field data collection. ARCO Alaska Inc. supplied equipment and
camp support. Mike Joyce arranged camp space in the ARCO Prudhoe and
Kuparuk camps. Field Environmental Coordinators Chris Garlasco and Kevin
Meyers, and treatment plant operator Tito Yancha, loaned water sampling
equipment and assisted with instrument calibration.
Cal Skaugstad, ADF&G Sport Fish Division, provided information on arctic
grayling sampling techniques in ponds and furnished three fyke nets. John Burr,
ADF&G Sport Fish Division, assisted with analysis and statistical testing of the
fish-sampling data from Sag Site C.
Dr. Jacqueline D. LaPerriere of the University of Alaska Cooperative Fisheries
Research Uni t reviewed the study design for the limnological sampling program.
The Fisheries Uni t also loaned sampling equipment and gave laboratory support.
Laura Jacobs provided analytical assistance. Dr. Ed Brown, Director of the Water
Research Center, authorized the use of lab equipment necessary to analyze
chlorophyll-a samples.
Financial assistance for this report was provided by ARCO Alaska, Inc. and
Standard Alaska Production Company, now BP Exploration, through a grant to the
ADF&G Habitat Division. Steve Taylor (BP) and Pat Metz (ARCO) helped in
supporting efforts to obtain the grant. Financial assistance was also provided by
the Alaska Coastal Management Program through the Coastal Zone Management
Act of 1972, as amended, and administered by the Office of Ocean and Coastal
Resource Management, National Oceanic and Atmospheric Administration.
v i i
EXECUTIVE SUMMARY
Fishery and limnological investigations were conducted a t f ive flooded gravel mine
sites in the Prudhoe Bay - Kuparuk oilfields from May through August 1988. Our
study included three components: chemical and biological limnology in four mine
sites, a n arctic grayling (Tltynzall~~s arctictis) population estimate in Sag Site C, and
disease screening of arctic grayling in the Savavanirktok River.
The flooded gravel mine sites are cold monomictic lakes that either mix
continuously during the ice-free season or form weak thermoclines. Dissolved
oxygen concentrations were a t or near saturation throughout the water column.
Primary production experiments with light/dark bottles d id not have sufficient
sensitivity to detect the low production rates found in most of the sites. Where
production was detectable, i t usually occurred in mine sites with extensive shallow
water habitat.
Phytoplankton standing crop, estimated by measuring concentrations of
chlorophyll-a, were low at all sites but comparable to concentrations reported by
other researchers f rom northern latitude systems. I t was interesting that lowest
concentrations occurred in the mine site with greatest zooplankton densities. We
speculate that grazing by zooplankton accounted fo r the low phytoplankton
standing crop.
Zooplankton densities, cstimated with vertical plankton tows, were highest in mine
sites with extensive littoral habitat and virtually non-existent in mine sites where
there is limited littoral habitat.
Arctic grayling in Sag Site C werc marked by f i n clips or tags in mid July and
then recaptured in early August. A modified Peterson mark-recapture analysis was
used fo r the population estimate, and produced an estimate of 229 arctic grayling
larger than 80 mm within Sag Site C.
Arctic grayling were the most frequently captured species in Sag Site C. Of the
1636 fish captured (including recaptures), 605 fish were arctic grayling. Round
whitefish (Prosopium cylindmcelinz) made up 30% of the catch, broad whitefish
(Coregon~~s nnsus) made up 8%, and Dolly Varden char (Snlvelilt14s mnlmn), burbot
(Lotn lota), slimy sculpin (Cot t l~s cog1znttis), and ninespine stickleback (Pungitius
pungitius) each made up less than 1% of the total catch. Seventy seven percent of
all f ish were captured in a shallow water area of the mine site. Water
temperatures in the shallow water area of the mine site were up to 8' C warmer
than those found in the main body of the mine site in mid July and influenced
the distribution of fish, particularly small fish. Catches of f ish were more evenly
distributed between the littoral habitat area and the main portion of the mine site
in August, as the difference in water temperature between these areas was
considerably less than that observed in July.
Arctic grayling f rom the Sagavanirktok River were collected and sampled for
bacterial and viral diseases as part of the requirements fo r issuance of a f ish
transport permit to allow eventual transport of arctic grayling to flooded gravel
mine sites. Sixty arctic grayling from the Sagavanirktok River in the vicinity of
Prudhoe Bay were captured in fyke nets and gill nets, sacrificed, and screened fo r
bacterial kidney disease, f ish furunculosis, and infectious pancreatic necrosis.
Analyses found no evidence of these diseases in the sacrificed arctic grayling,
satisfying disease screening requirements for issuance of a f ish transport permit.
Sagavanirktok River arctic grayling may now be transported to flooded gravel
mine sites within the Prudhoe Bay - Kuparuk oilfields.
Two previous attempts a t introducing fish to barren lakes within the coastal plain
of northern Alaska were unsuccessful. A history of these stocking attempts a t
Barrow and Prudhoe Bay is presented.
INTRODUCTION
Fish populations in the mid-Beaufort Coastal Plain region of northern Alaska are
limited by the availability of overwintering habitat (Bendock 1977, Adams 1987).
Most lakes and tundra streams in the region are unsuitable as year round fish
habitat, because they contain insufficient quantities of under ice water, or because
the water quality in winter is unsuitable. Flooded gravel mine sites created fo r oil
development provide suitable overwintering habitat for several species of
freshwater and anadromous fish because they retain large quantities of water with
dissolved oxygen concentrations that are a t or near saturation throughout the year.
Previous sampling of the mine sites during the open water season indicated that
the sites might also have sufficient primary and invertebrate productivity to
sustain summer populations of fish; however, the productivity appeared to vary
considerably among the mine sites (Hemming 1988).
Colonization of flooded gravel mine sites by fish is governed by the permanence of
the connection to a stream: A permanent hydrological connection allows movement
of f ish into or out of the site throughout the open water season, whereas a
temporary connection limits f ish migration to periods of high water, The
permanence of the connection will also determine the ability of f ish to leave the
mine site. Aquatic productivity of the mine site may play a primary role in
determining growth and survival of f ish during periods when sites are isolated
f rom adjacent riverine habitats.
In 1988, the Alaska Department of Fish and Game conducted studies of selected
gravel mine sites on the North Slope of Alaska to determine their relative
productivity and the feasibility of establishing fish in sites that provide suitable
habitat but where colonization by fish was unlikely to occur. Five flooded gravel
mine sites were investigated: Sag Site C, Kuparuk Mine Sites B and D, and
Kuparuk Deadarm Mine Site 6. Limited investigations were also conducted in
Kuparuk Deadarm Mine Site 5.
Sag Site C is a 15.5 ha site located in the floodplain of the West Channel of the
Sagavanirktok (Sag) River. This site is bounded on the south side by the Sag River
causeway and to the north by the Sag River oil pipeline crossing. The mine site
was flooded on June 8, 1986 when the perimeter berm on the west side of the site
was breached, allowing Sag River flood water to enter the mine site. Habitat
rehabilitation to establish littoral areas was conducted in Sag Site C in autumn
1987.
Kuparuk Mine Site B consists of two adjacent basins covering a total of 3.7 ha.
The excavated area was flooded in 1978 and is connected to a tundra stream,
known locally as "East Creek," that drains directly into the Beaufort Sea. Kuparuk
Mine Site B contains ninespine stickleback (Pllngitius puizgitius) and broad whitefish
(Coregonus nnsus).
Kuparuk Mine Site D is the largest flooded mine site connected to a tundra stream,
covering 15.6 ha adjacent to "Charlie Creek," a western tr ibutary to the Ugnuravik
River, itself a tundra stream. Tllc Ugnuravik River is reported to contain
ninespine stickleback only (Hemming 1988) and is not connected to a larger river
system.
The Kuparuk Deadarm arca is a formcr high-water channel on the east side of the
Kuparuk River floodplain. The site consists of six connected flooded gravel mine
sites covering 58.3 ha. The lower sites (5 & 6) were flooded by water backing up
into the high-water channel from the East Channel of the Kuparuk River in 1986.
Kuparuk Mine Sites 5 & 6 contain arctic cisco (Coregonus nutunznnlis) and arctic
grayling (Tlzynznllus arcticzis) (Hemming 1988). More detailed descriptions of the
mine sites investigated in this report are presented in Hemming (1988).
This annual progress report contains three studies: a limnological investigation to
determine biological productivity and standing crop of each site, a n arctic grayling
population estimate including an evaluation of f ish use of a habitat enhancement
area, and an examination of arctic grayling for disease in preparation for
experimental f ish transplants. The physical and chemical features and fish species
present in these sites have been documented in a report on the first two years of
this project (Hemming 1988).
The limnological section includes temperature and dissolved oxygen measurements,
estimates of rates of primary productivity, estimates of phytoplankton standing
crop, and estimates of densities and species composition of zooplankton sampled a t
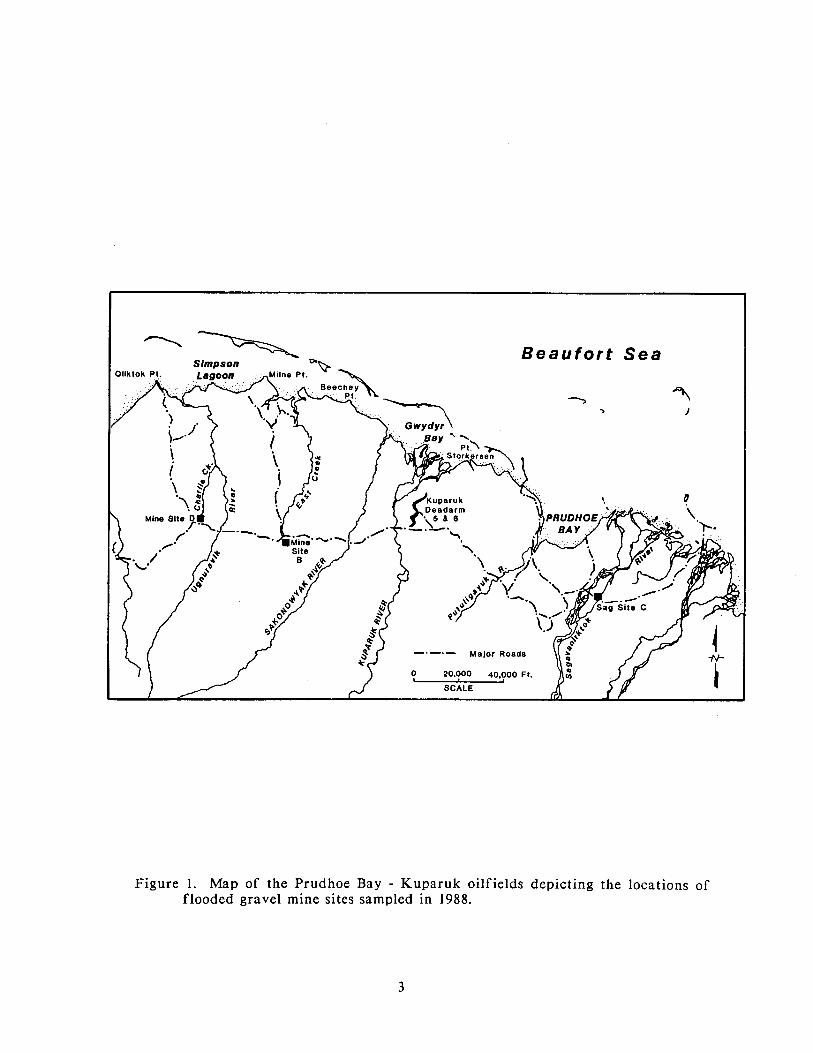
four flooded mine sites (Figurc 1). Limited sampling was conducted in a f i f th
mine site. The limnological data provide the basis for comparing physical and
chemical characteristics and biological productivity among the flooded mine sites.
Beaufor t S e a
-.-.- Major Roads
Figure 1. Map of the Prudhoe Bay - Kuparuk oilfields depicting the locations of flooded gravel mine sites sampled in 1988.
An arctic grayling population estimate was conducted in Sag Site C to provide
information on the level of colonization that might be expected in a flooded mine
site with a high water connection to a large river system and to assess the use of
the recently rehabilitated section of Sag Site C. Previous sampling by gill nets
(reported in Hemming 1988) documented the presence of f ish in all of the mine
sites investigated in the present study; however, the population levels were
unknown. Sag Site C was selected for initial population estimates because previous
sampling with gill nets showed that this site had the highest catch per unit effort .
An experimental introduction of arctic grayling to sites where colonization is
likely to be limited is proposed. Fish will be transported f rom neighboring
drainages into sites that are connected to riverine systems that may provide
spawning habitat. Arctic grayling from the Sagavanirktok River were collected
and screened for diseases to assure that the fish to be transplanted are disease free,
thereby avoiding the introduction of diseases to other systems. Disease screening
of these fish, and of future collections, will also provide information about the
health of arctic grayling populations f rom sampled drainages where a disease
history is not available. Additional information on the fish captured f rom the
lower Sagavanirktok River during this project is presented in appendices.
This annual progress report provides technical background information used to
develop specific recommendations for enhancing flooded gravel mine site habitat.
Enhancement projects involve habitat manipulation by physically altering basin
morphology or providing a mechanism for f ish use through the construction or
improvement of a hydrologic connection to a n adjacent stream or river. An
experimental arctic grayling transplant is proposed fo r sites where suitable habitat
is present but where the adjacent riverine system has few fish.
LIMNOLOGICAL INVESTIGATIONS
INTRODUCTION
Since 1986, the Alaska Department of Fish and Game has conducted limnological
sampling in selected flooded gravel mine sites on the North Slope to determine
whether or not these sites would provide suitable habitat for f ish and wildlife.
Earlier investigations (reported in Hemming 1988) concentrated on chemical and
physical features of the sites. An important f inding was that these flooded mine
sites retain dissolved oxygen concentrations that are a t or near saturation
throughout the year, thus providing potential overwintering habitat fo r fish. All
of the mine sites investigated were adjacent to or connected to a riverine system;
thus there were opportunities for f ish to migrate into the sites during periods of
high water. Sampling of the mine sites during summer 1987 (Hemming 1988)
indicated that the sites might also have sufficient primary and invertebrate
productivity to sustain summer rearing populations of fish; however, the
productivity appeared to vary considerably among the mine sites.
The current study focuses on identifying particular features of each site that may
influence algal productivity and zooplankton densities. Limnological sampling
included four components: temperature and dissolved oxygen measurements,
estimation of rates of primary productivity, estimation of phytoplankton standing
crop, and estimation of densities and species composition of zooplankton. The first
three components not only provide physical and chemical information, and
indications of productivity of the sites, but they also give indirect evidence of the
extent of nutrient availability to primary producers within the sites. Zooplankton
analyses provide information on the availability and degree of complexity of food
resources available to fish.
METHODS
In 1988, limnological sampling was conducted a t four flooded mine sites: Kuparuk
Mine Sites B and D, Kuparuk Deadarm Reservoir 6, and Sag Site C. Limited
samples were collected from Kuparuk Deadarm Reservoir 5 in May. Sampling was
conducted a t Sag Site C on May 16-17, July 13-14, and August 25; a t Kuparuk
Deadarm Reservoir 6 on May 18, July 15-16, and August 25; a t Kuparuk Mine Site
B (a-side) on May 19, July 13-14, and August 24; and a t Kuparuk Mine Site D on
May 19, July 16, and August 24. Kuparuk Mine Site B (b-side) and Kuparuk
Deadarm Reservoir 5 were only sampled on May 19 and May 18, respectively.
Water samples were collected to determine chlorophyll concentrations with a
vanDorn water sampling bottle. Depths sampled (site bathymetry permitting) were
2 (just below ice level), 5, 10, and 15 m in May, and 1, 2, 4, 6, 8, and 10 m in July
and August. A sample was collected just above the site bottom a t those sites less
than 15 m deep in May and less than 10 m deep in July and August. U p to 3 L of
water fo r each sample were filtered through a 0.3 um Gelman A/E glass f iber f i l ter
using a Nalge hand vacuum pump. One sample was taken a t each depth during
May; three samples were taken a t each depth in July and August. Saturated
magnesium carbonate solution was added to the fi l ter to prevent acidification of
the chlorophyll. Each fi l ter was labeled, placed in a plastic bag containing
dessicant, and frozen pending analysis. Filters were ground in 90% aqueous
acetone solution and allowed to extract for 2 hr. T h e samples were then
centrifuged and the absorbance of the supernatant was determined on a
spectrophotometer using a 4-cm cell, according to Wetzel and Likens (1979).
Amounts of chlorophyll-a, -by and -c were determined using a trichromatic method
and corrected fo r turbidity, according to Strickland and Parsons (1968). The
samples were acidified to correct fo r phaeophytin, using a monochromatic method
(Wetzel and Likens 1979).
Zooplankton tows were conducted a t each of the mine sites. A Wisconsin-type
plankton net was lowered to the bottom and slowly hauled to the surface. Two
plankton tows were conducted a t each mine site in May, whereas f ive tows were
conducted in July and August (except Kuparuk Deadarm 6 where 10 were
conducted). Zooplankton were stored in 70% ethanol pending analysis. Larger
zooplankton were identified to genus and counted. Numbers of larval or immature
zooplankton too small to identify (<0.75 mm for Daphnia and <0.5 mm for
copepods) were estimated for July and August samples, and because of low
numbers, counted directly in May. Genera of immature copepods were not
identified.
Temperature and dissolved oxygen measurements were taken a t depth a t each of
the mine sites. Depths sampled were identical to those sampled fo r chlorophyll.
Water samples a t depth were obtained with a vanDorn water sampling bottle. In
July and August, biochemical oxygen demand (BOD) bottles were filled for
dissolved oxygen analysis by placing a tube f rom the vanDorn bottle into the
bottom of the BOD bottle and overfilling i t the equivalent of three times its
volume. In May, a i r temperatures were too low to keep the tube f rom the vanDorn
bottle f rom freezing, therefore samples were filled by immersing the entire BOD
bottle, mouth up, into the vanDorn sampler and overfilling it. Water temperatures
were measured in the vanDorn bottle with a hand-held thermometer or by a
temperature probe on a dissolved oxygen meter (calibrated against a mercury
thermometer) in May, and with a digital thermometer that was calibrated against
hand-held mercury thermometers in July and August. Dissolved oxygen
concentrations were measured by the azide modification of the Winkler procedure,
using 300 mL samples and a digital titrator (hand-held buret). Kuparuk Deadarm
Reservoir 5 and Kuparuk Mine Site B (b-side) were only sampled in May.
Estimates of primary productivity a t flooded mine sites were made in July and
August by measuring changes in dissolved oxygen concentrations within light and
dark BOD bottles. Productivity measurements were made a t Sag Site C, Kuparuk
Mine Sites B and D, and Kuparuk Deadarm Reservoir 6 in July, and a t Kuparuk
Deadarm Reservoir 6 only in August. A device was fabricated f rom
polyvinylchloride (PVC) pipe that held one dark and two light bottles horizontally
for incubation a t the depth f rom which the water was taken. Water collected with
a vanDorn bottle from a given depth was used to fill the three BOD bottles.
Bottles were suspended a t the same depth f rom which the water was taken and
incubated for 24 hr. Water was collected f rom and incubated f rom the following
depths: 1, 2, 4, 6, 8, and 10 m. Kuparuk Deadarm Reservoir 6, however, because of
its relatively shallow depth, allowed sampling only to 7 m. An additional series of
bottles were placed in Kuparuk Deadarm Reservoir 6 a t 1, 2, and 3 m (3 m was the
maximum depth a t this location). At all sites, one dark and two light bottles were
set a t each sampled depth. Initial dissolved oxygen concentrations and
temperatures were measured fo r each sampled depth a t the time the BOD bottles
were filled. Dissolved oxygen was measured with the azide modification of the
Winkler titration. After 24 hr, dissolved oxygen concentrations were measured in
all BOD bottles using a dissolved oxygen meter calibrated with Winkler titration in
July, and by Winkler titration in August.
RESULTS
Temperature and Dissolved Oxygen
Water temperature and dissolved oxygen concentrations a t depth for Prudhoe Bay
and Kuparuk mine sites are presented in Appendix 1. In May, water temperatures
were essentially isothermal a t all sites and ranged f rom 0 to 1.7OC. Dissolved
oxygen concentrations in May were a t or near saturation fo r Sag Site C and
Kuparuk Deadarm Reservoirs 5 and 6. Kuparuk Mine Sites B and D, however, had
dissolved oxygen concentrations considerably lower than saturation. In Kuparuk
Mine Site B, concentrations a t depth ranged f rom 10.0 to 12.0 mg/L (a-side) and 8.2
to 9.5 mg/L (b-side), which correspond to concentrations 70 to 83% and 58 to 68%
of saturation, respectively. Dissolved oxygen concentrations were even lower in
Kuparuk Mine Site D, ranging from 6.4 to 10.1 mg/L (45 to 70% of saturation).
By the July sampling period, some sites began to show slight temperature
stratification. Kuparuk Mine Site B, the smallest mine site sampled, had the
strongest temperature stratification, with temperatures ranging f rom 12.2OC at a
depth of 1 m to 3.9OC a t a depth of 10 m. Kuparuk Deadarm Reservoir 6 was
isothermal a t 1 1°C to a depth of 3 m, but water temperature declined to 6.8OC a t 6
m. Kuparuk Mine Site D, ice-free for 6 days a t the time of sampling, showed a
weak temperature stratification of approximately 2OC between the surface and a
depth of 10 m. Sag Site C was isothermal a t 3OC and was partially ice-covered a t
the time of sampling. Concentrations of dissolved oxygen were a t or near
saturation a t all sampled depths a t each site, except for the 10 m depth a t Kuparuk
Mine Site B where the dissolved oxygen concentration was 75% of saturation (10
mg/L).
By the August sampling period, water temperatures had declined a t most sites and
were isothermal a t all sites. Water temperatures were approximately 7OC a t
Kuparuk Mine Sites B and D and Sag Site C, and near 5OC for the Kuparuk
Deadarm Reservoir 6. Concentrations of dissolved oxygen were a t or near
saturation for all sites during the August sampling period.
Primary Productivity
Rates of primary productivity were extremely low in July and August in all
reservoirs sampled (estimates were not made in Kuparuk Mine Site D in July, nor
in Kuparuk Mine Sites B or D, and Sag Site C in August). Final concentrations of
oxygen were lower than the initial concentrations in 10 of the 12 samples f rom
Kuparuk Mine Site B, in 2 of the 12 samples f rom Sag Site C, in 4 of the 8 samples
f rom Kuparuk Deadarm Reservoir 6 in July, and in 1 of the 10 samples from
Kuparuk Deadarm Reservoir 6 in August. Of the 54 samples from all reservoirs,
only 10 samples contained oxygen concentrations in the light bottles that were
sufficient to estimate gross photosynthetic activity (Table 1). Dissolved oxygen
concentrations increased by 0.3 mg/L 02 /24 h r in 9 of the 10 samples, and by 0.4
mg/L 02 /24 h r in one sample from Kuparuk Deadarm Reservoir 6. Although
considered measurable, these concentrations are below the recommended amounts to
achieve a statistical probability limit of 0.05 (Wetzel and Likens 1979) and should
be viewed with caution. Of the samples with sufficient oxygen concentrations to
estimate photosynthetic activity, all samples f rom Kuparuk Mine Site B and 5 of
the 6 samples f rom Kuparuk Deadarm Reservoir 6 occurred in the top 2 m of
water, whereas the sample f rom Sag Site C with sufficient oxygen concentrations
to estimate photosynthetic activity occurred a t 4 m.
Phytoplankton Standing Crop
Phytoplankton standing crop, estimated as concentration of chlorophyll-a, was low
in all of the mine sites in May, July, and August (Table 2). Concentrations of
chlorophyll-a were significantly di f ferent among the mine sites (Kruskall-Wallis
one-way ANOVA, p<0.05), with the highest overall concentrations found in
Kuparuk Mine Site D (average 2.10 ug/L) and the lowest in Kuparuk Deadarm
Reservoir 6 (average 0.98 ug/L). Average concentrations in Kuparuk Mine Site B
(1.88 ug/L) and Sag Site C (1.85 ug/L) were slightly lower (but not significantly,
Kruskall-Wallis one-way ANOVA, p> 0.05) than those found in Kuparuk Mine Site
D. Kuparuk Deadarm Reservoir 5 was sampled in May only; a t that time
chlorophyll-a concentrations were 1.66 ug/L Kuparuk Deadarm Reservoir 5
compared to 0.95 ug/L in Kuparuk Deadarm Reservoir 6.
In May, the highest concentrations were found in Kuparuk Mine Site D, where
they ranged from 2.8 to 3.9 ug/L (Figure 2). Sag Site C, Kuparuk Mine Site B, and
Kuparuk Deadarm Reservoir 6 all had low concentrations that were less than 1.5
ug/L a t all of the depths measured. Concentrations of chlorophyll-a did not vary
appreciably with depth in any of the four mine sites.
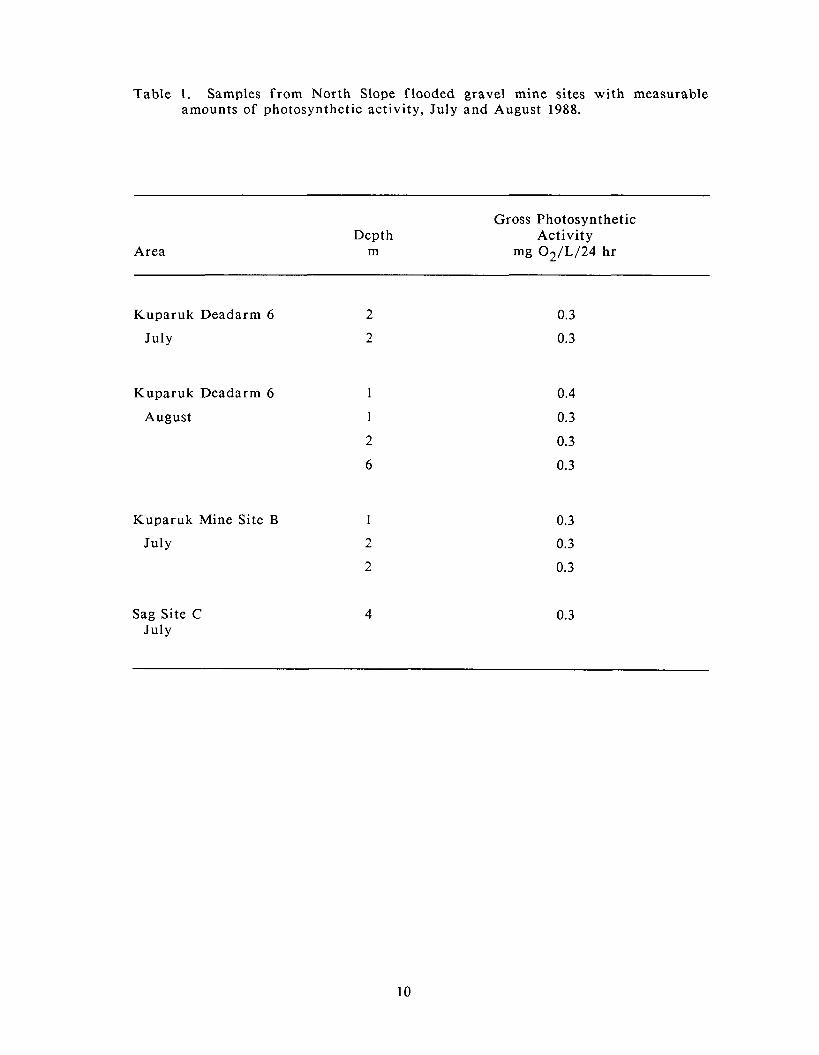
Table 1. Samples f rom North Slope flooded gravel mine sites wi th measurable amounts of photosynthetic activity, July and August 1988.
Area Depth
m
Gross Photosynthetic Activity
mg 02/L/24 h r
Kuparuk Deadarm 6
July
Kuparuk Deadarm 6
August
Kuparuk Mine Site B
July
Sag Site C July
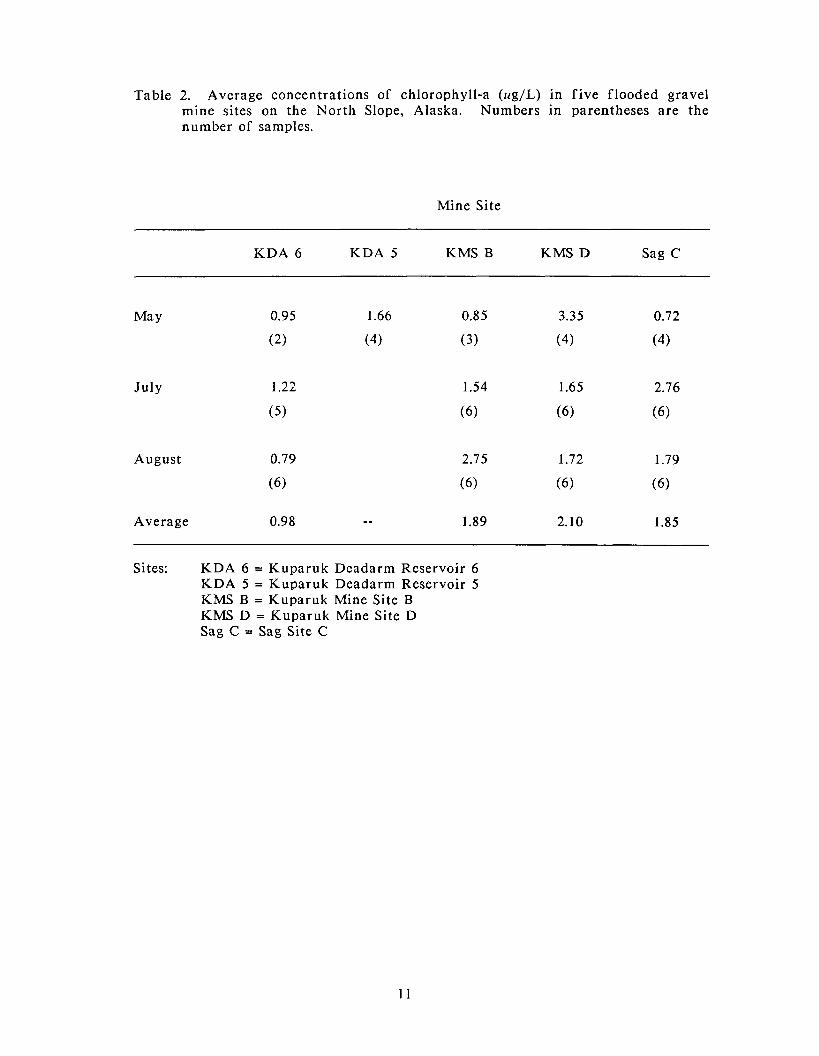
Table 2. Average concentrations of chlorophyll-a (ug/L) in f ive flooded gravel mine sites on the North Slope, Alaska. Numbers in parentheses are the number of samples.
Mine Site
KDA 6 KDA 5 KMS B KMS D Sag C
July
August 0.79
(6)
Average 0.98 - - 1.89 2.10 1.85
Sites: KDA 6 = Kuparuk Deadarm Reservoir 6 KDA 5 = Kuparuk Deadarm Reservoir 5 KMS B = Kuparuk Mine Site B KMS D = Kuparuk Mine Site D Sag C = Sag Site C
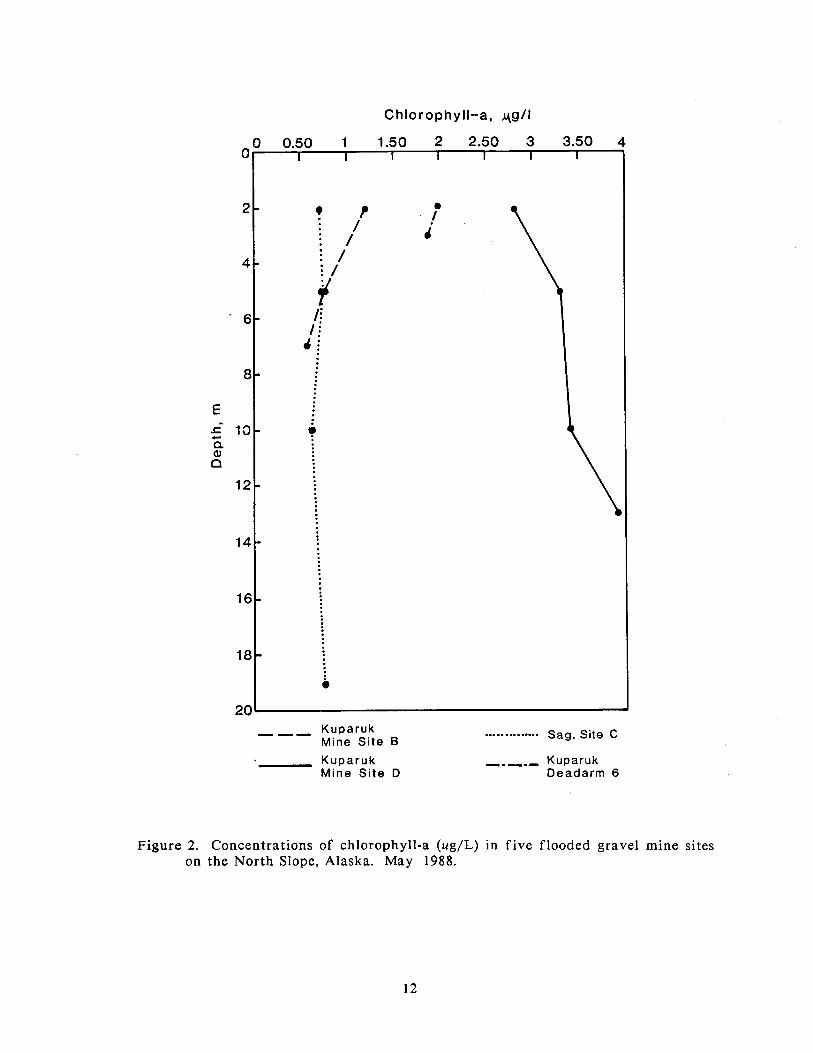
--- Kuparuk Mine Site B
. . . . . . . . . ... . . Sag. Site C
Kuparuk ,.,., Kuparuk Mine Site D Deadarm 6
Figure 2. Concentrations of chlorophyll-a (ug/L) in f ive flooded gravel mine sites on the North Slope, Alaska. May 1988.
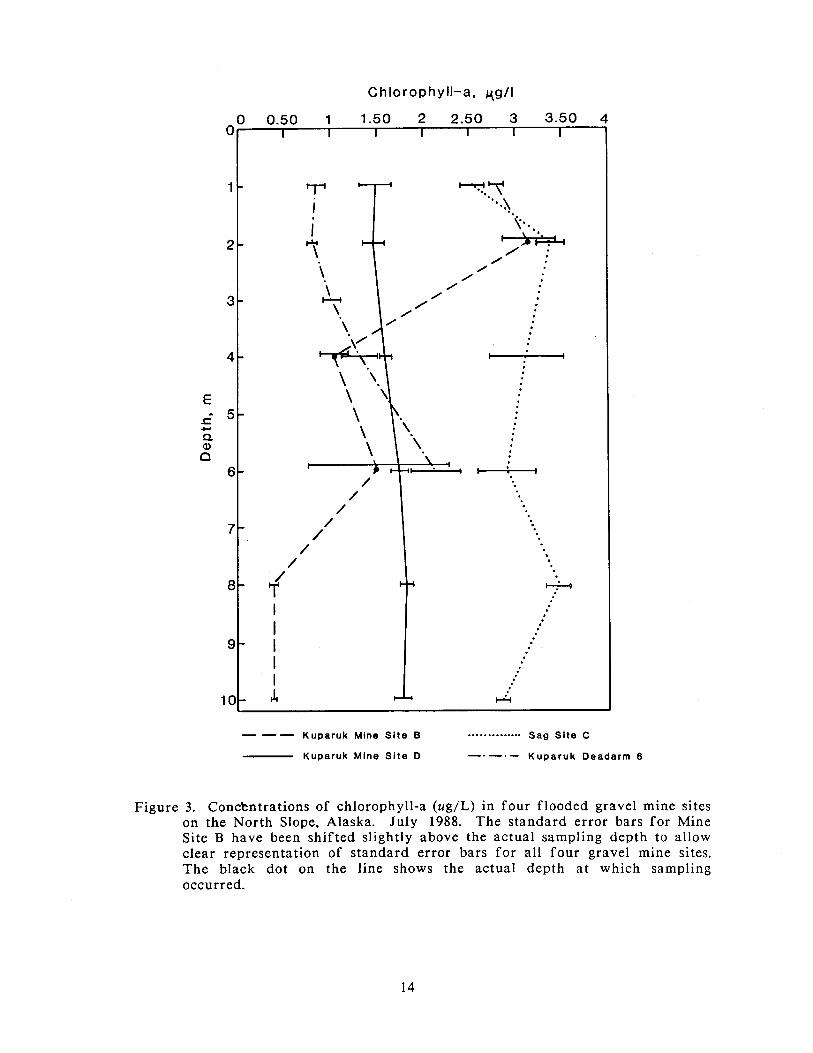
In July, the concentration of chlorophyll-a increased in Sag Site C and Kuparuk
Mine Site B, but remained low in Kuparuk Deadarm Reservoir 6 (Figure 3).
Concentrations in Kuparuk Mine Site D were lower in July than in May.
Concentrations of chlorophyll-a did not vary appreciably with depth in any of the
mine sites except Kuparuk Mine Site B. Algal standing crop in Kuparuk Mine Site
B was highest a t 1 and 2 m, where the concentrations of chlorophyll-a were 2.8 and
3.15 ug/L, respectively. Concentrations a t 4 m and 6 m (in the area of the
thermocline) were 1.04 ug/L and 1.5 ug/L, respectively (or about 33 to 50% of the
concentrations found in the upper levels) and a t 8 and 10 m, the concentrations
were only 0.38 ug/L.
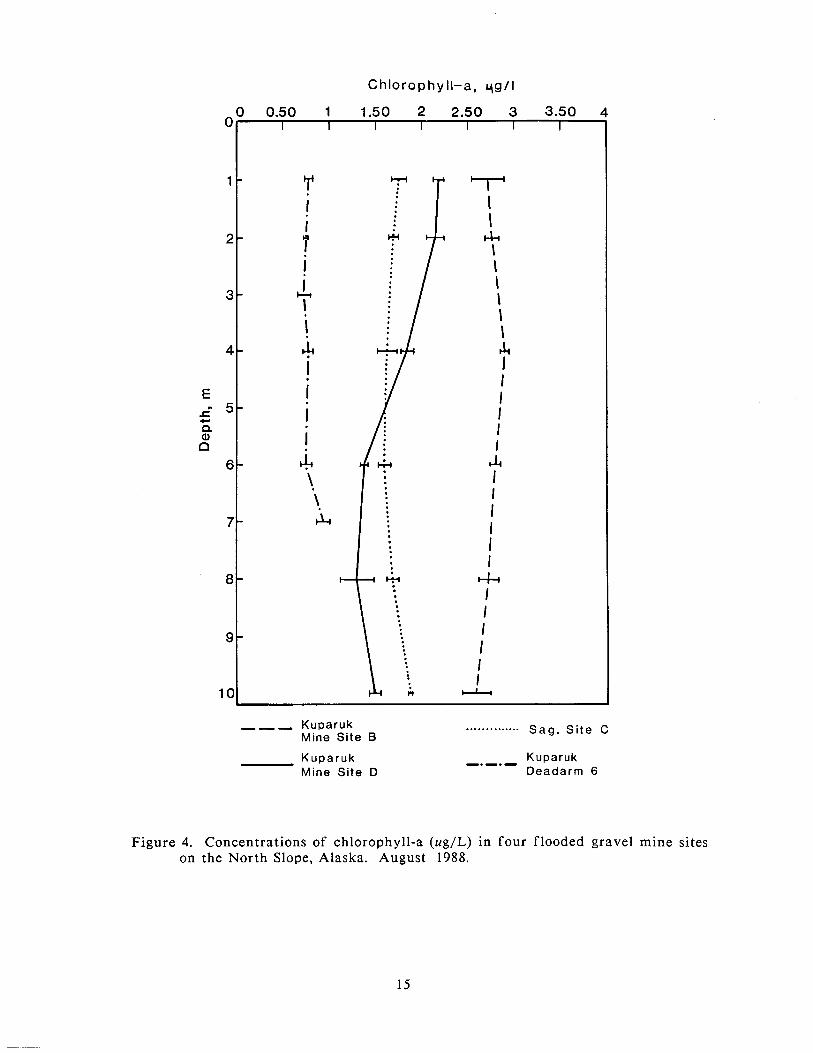
In August, chlorophyll-a concentrations were highest in Kuparuk Mine Site B
(average of 2.75 ug/L), followed by Kuparuk Mine Site D (average of 1.72 ug/L)
and Sag Site C (average of 1.7 ~ ig /L) (Figure 4). Concentrations were lowest in
Kuparuk Deadarm Reservoir 6 (average of 0.79 ug/L). Phytoplankton standing
crop showed little variation with depth in the four mine sites sampled in August.
No seasonal patterns in phytoplankton standing crop were evident f rom the
samples.
Average concentrations of chlorophyll-b were low in all mine sites (Table 3) where
they ranged f rom 0.14 ug/L in Sag Site C to 0.20 ug/L in Kuparuk Mine Site D.
The ratio of chlorophyll-b to chlorophyll-a was correspondingly low, f rom 0.07 in
Kuparuk Mine Site D to 0.16 in Kuparuk Deadarm Reservoir 6. Concentrations of
chlorophyll-c (Table 3) ranged from a n average of 0.67 ug/L in Kuparuk Deadarm
Reservoir 6 to 1.03 ug/L in Kuparuk Mine Site B, while the rat io of chlorophyll-c
to chlorophyll-a ranged f rom 0.41 in Kuparuk Mine Site D to 0.71 in Kuparuk
Deadarm Reservoir 6.
Zooplankton
Numbers of zooplankton present in the flooded mine sites varied considerably
among the May, July, and August sampling periods. In addition, the relative
number of "immature" versus "adult" zooplankton varied among the sampling
periods and mine sites.
In May, estimated densities of immature zooplankton (copepods and Daplzrtia)
present in the sites were low, generally less than l /L, with the exception of
--- Kuparuk Mine S i te B . . . . . . . . . . . . . . Sag Site C
Kuparuk Mine S i te D -. -. - Kuparuk Deadarm 6
Figure 3. Conckntrations of chlorophyll-a (ug/L) in four flooded gravel mine sites on the North Slope, Alaska. July 1988. The standard error bars fo r Mine Site B have been shifted slightly above the actual sampling depth to allow clear representation of standard error bars fo r all four gravel mine sites. The black dot on the line shows the actual depth a t which sampling occurred.
,,- Kuparuk Mine Site 6
Kuparuk Mine Site D
. . . . . . . . . . . . . . Sag. S i te C
-.-.- Kuparuk Deadarm 6
Figure 4. Concentrations of chlorophyll-a (ug/L) in four flooded gravel mine sites on the North Slope, Alaska. August 1988.
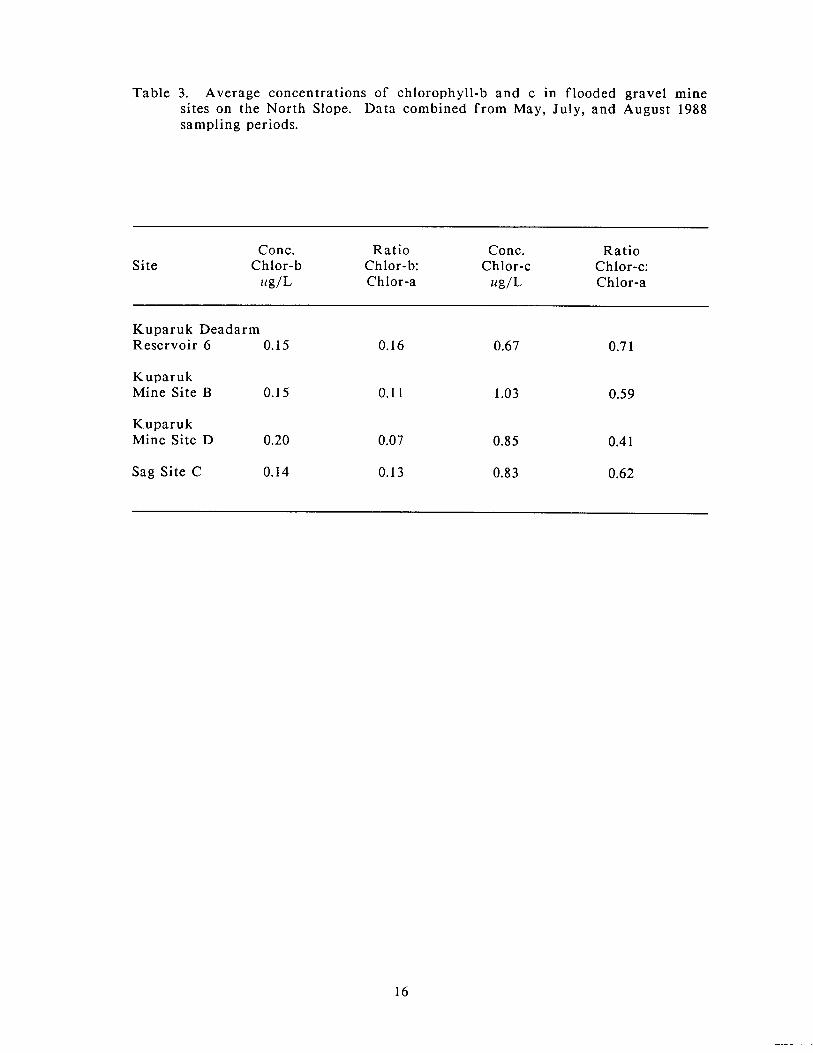
Table 3. Average concentrations of chlorophyll-b and c in flooded gravel mine sites on the North Slope. Data combined f rom May, July, and August 1988 sampling periods.
Conc. Ratio Conc. Ratio Site Chlor-b Chlor-b: Chlor-c Chlor-c:
tG/L Chlor-a ug/L Chlor-a
Kuparuk Deadarm Reservoir 6 0.15 0.16 0.67 0.7 1
Kuparuk Mine Site B 0.15 0.1 1 1.03 0.59
Kuparuk Mine Site D 0.20 0.07 0.85 0.4 1
Sag Site C 0.14 0.13 0.83 0.62
Kuparuk Deadarm Reservoir 6, where the estimated density was in the range of 2-
10/L (Table 4). No zooplankton were found in the samples collected f rom Sag Site
C. No zooplankton collected in May at any of the sites were mature (Table 5).
In July, estimated densities of large zooplankton were highest in Kuparuk
Deadarm Reservoir 6, in fact , in numbers two to three orders of magnitude above
those recorded in the other sites (Table 5). The cladoceran Daphnia sp. and the
copepod Cyclops sp. made up 71 and 26%, respectively, of the 532 large zooplankton
collected in the samples a t this site (Table 6). The samples f rom the other three
sites had f a r fewer large zooplankton a t this time than did Kuparuk Deadarm
Reservoir 6. Kuparuk Mine Site B samples contained 26 large zooplankton (92%
Cyclops sp. and 8% Diaptomus sp.), Kuparuk Mine Site D samples contained only 2
Daphnia sp. and 1 Cyclops sp., and Sag Site C samples contained only 1 unidentified
organism.
The pattern of estimated densities of immature zooplankton present in the July
mine site samples was similar to the pattern recorded for the large zooplankton
(Tables 4 and 5). Immature zooplankton were most numerous in Kuparuk Deadarm
Reservoir 6 and least abundant in Sag Site C. Estimated densities of immature
zooplankton in Kuparuk Mine Site D were higher than those found in Kuparuk
Mine Site B, but were less than those found in Kuparuk Deadarm Reservoir 6.
The highest estimated densities of large zooplankton observed in 1988 occurred in
August, again a t Kuparuk Deadarm Reservoir 6 (Table 5). Kuparuk Mine Site B
had estimated densities approximately one half that of Kuparuk Deadarm
Reservoir 6. Estimated densities of large zooplankton in Kuparuk Mine Site D and
Sag Site C were equal and approximately two orders of magnitude less than that
recorded for Kuparuk Deadarm Reservoir 6.
The most numerous of the large zooplankton collected during the August sampling
interval were Diaptom~is sp. (Table 6). These organisms contributed over 50% of
the zooplankton collected in Kuparuk Deadarm Reservoir 6 and over 95% in
Kuparuk Mine Site B. Cyclops sp. comprised over 30% of the total in Kuparuk
Deadarm Reservoir 6, with the remainder a t this and other sites contributed
primarily by Daplznin sp. and Heterocope septerttrionalis.
The estimated densities of immature zooplankton during August were highest in
Kuparuk Mine Site D, an increase over that recorded for this site in July (Table 4).
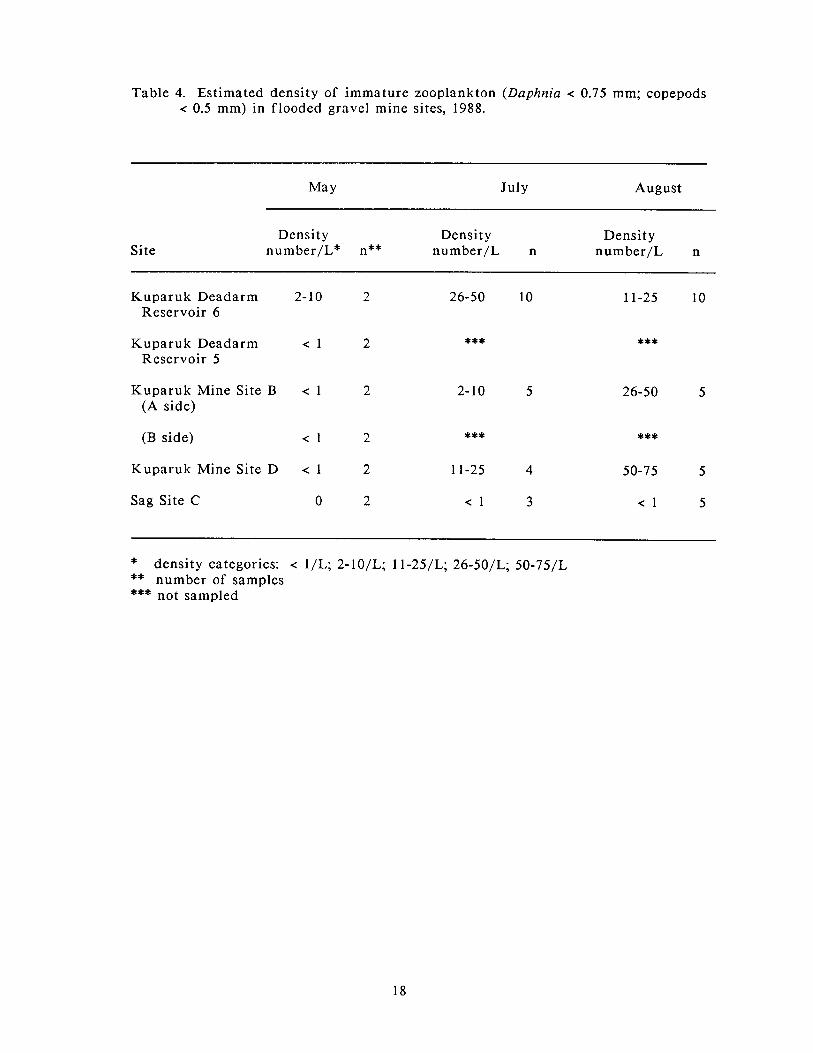
Table 4. Estimated density of immature zooplankton (Daphnia < 0.75 mm; copepods < 0.5 mm) in flooded gravel mine sites, 1988.
May July August
Site Density Density Density
number/L* n** number/L n number/L n
Kuparuk Deadarm 2- 10 Reservoir 6
Kuparuk Deadarm < 1 Reservoir 5
Kuparuk Mine Site B < 1 (A side)
(B side) < 1
Kuparuk Mine Site D < 1
Sag Site C 0
* density categories: < 1/L; 2-10/L; 1 1-25/L; 26-50/L; 50-75/L ** number of samples *** not sampled
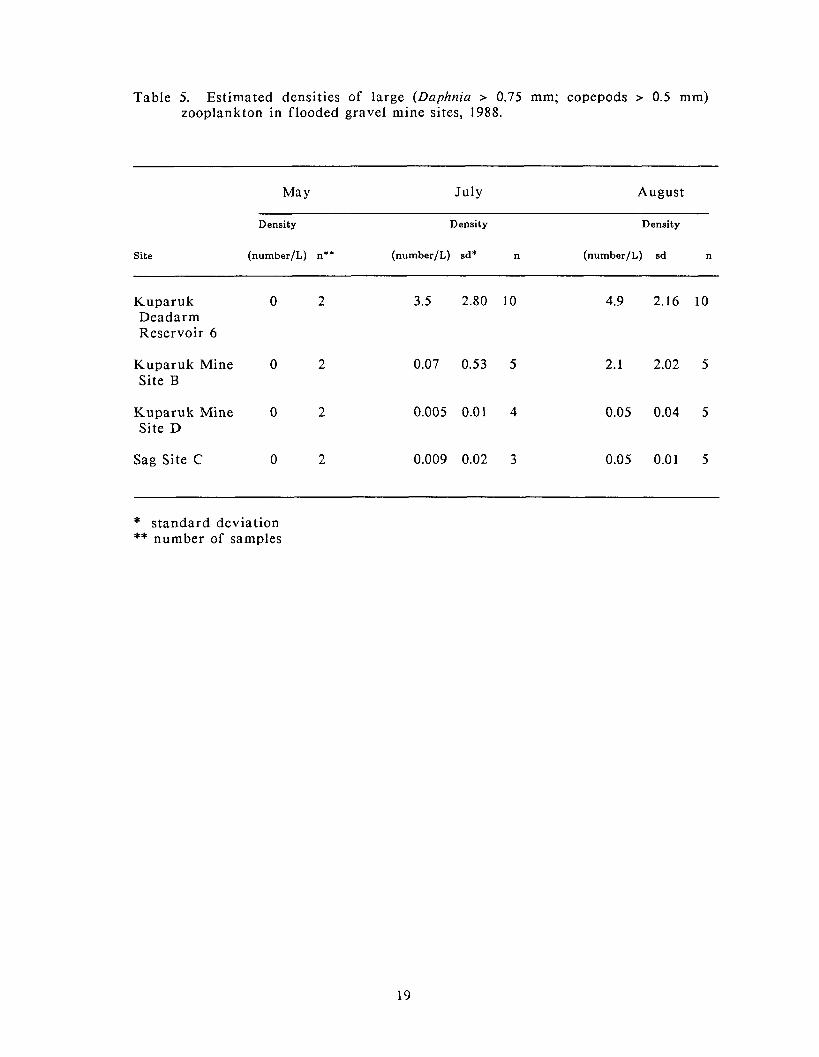
Table 5. Estimated densities of large (Daphnia > 0.75 mm; copepods > 0.5 mm) zooplankton in flooded gravel mine sites, 1988.
May July August
Site
Density Density Density
(number/L) n** (number/L) sd* n (number/L) sd n
Kuparuk 0 2 Deadarm Reservoir 6
Kuparuk Mine 0 2 0.07 0.53 5 2.1 2.02 5 Site B
Kuparuk Mine 0 2 0.005 0.01 4 0.05 0.04 5 Site D
Sag Site C 0 2 0.009 0.02 3 0.05 0.01 5
* standard deviation ** number of samples
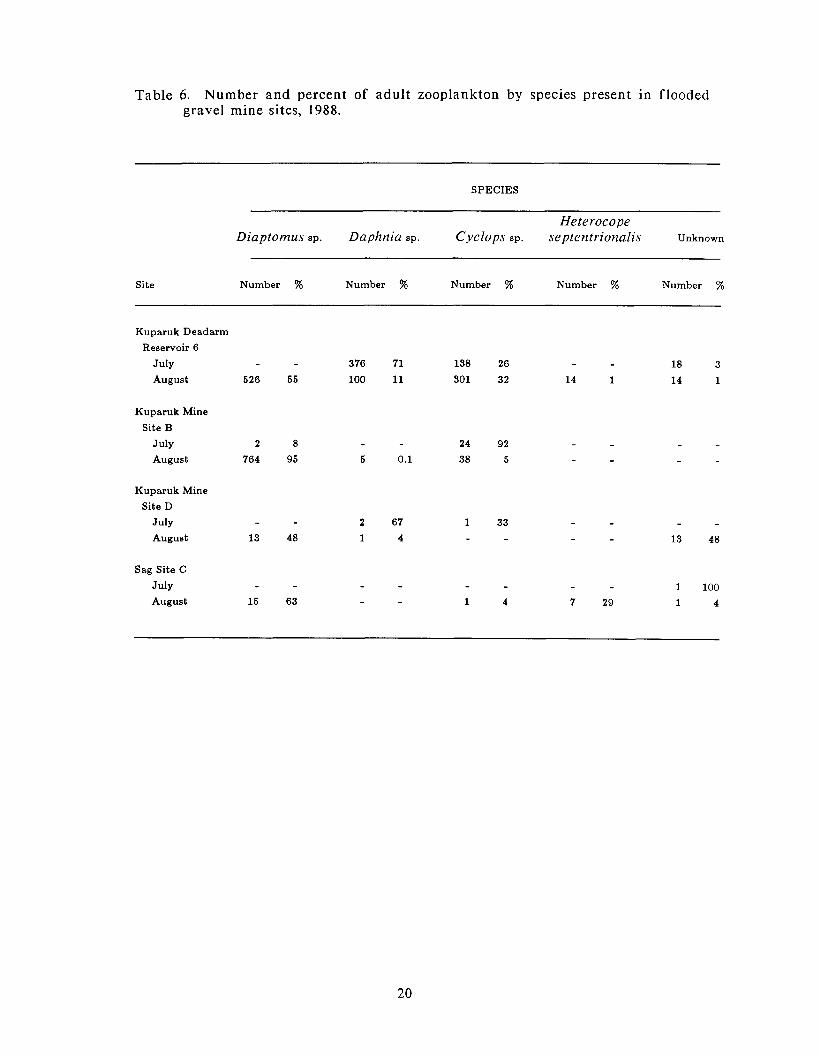
Table 6 . Number and percent of adult zooplankton by species present in flooded gravel mine sites, 1988.
SPECIES
--
Heterocope Diaptomus sp. Daphnia sp. Cyclops sp. septentrionalis Unknown
Site Number % Number % Number % Number % Number %
Kuparuk Deadarm
Reservoir 6
July
August 526 55
Kuparuk Mine
Site B July 2 8
August 764 95
Kuparuk Mine
Site D
July
August
Sag Site C
July 1 100
August 15 63 1 4 7 29 1 4
Estimated densities of immature zooplankton also increased in Kuparuk Mine Site
B over that recorded a t this site in July, whereas estimated densities decreased in
Kuparuk Deadarm Reservoir 6. Again, few organisms were recorded fo r Sag Site
C.
DISCUSSION
Physical Limnology of Reservoirs
The mine site reservoirs are basically cold, monomictic lakes that either mix
continuously during the ice-free period or form weak thermoclines. Epilimnion
depths in deep, northern latitude lakes are usually greater than fo r similar lakes a t
lower latitudes, which has been attributed to slower heating, frequent winds, lack
of wind protection by trees or the landscape, and less intensive maximum solar
radiation than a t lower latitudes (Welch et al. 1987). Ice-out typically occurs in
early- to mid-July, depending upon spring air temperatures and characteristics of
the reservoirs. Ice-out occurred later on Sag Site C than on the other reservoirs.
Slower thermal heating in Sag Site C may be because this reservoir lies closer to
the coast and is more strongly influenced by coastal fog and the associated cooler
microclimate.
Rapid cooling and prevalent winds in September probably prevent icing over until
the entire water column of the reservoirs is below 1°C. Freezing of the surface
appears to occur when the reservoirs are isothermal. The ice-rich soils that are
prevalent on the North Slope, combined with the great depth of the reservoirs
probably prevent heating of the benthos; therefore, there is relatively little heat
contribution f rom the reservoir bottom to form an inverse thermocline in the
winter. In addition, there is no solar input fo r a period of 2+ months when the
sun sets in late November and rises again in early February. In January 1988, Sag
Site C was essentially isothermal in the range of 0.2 to 1.2'~. Temperatures in
February and April were similar a t 0 . 9 ' ~ (Hemming 1988). (Few winter
temperature data are available for the other reservoirs.) Convective mixing under
the ice is probably responsible for the isothermal nature of the mine sites.
High oxygen concentrations throughout the year are probably attributable to
frequent mixing in the summer and relatively low densities of biological organisms
and low biochemical oxygen demands during the winter months. Primary
productivity in the early spring may increase dissolved oxygen concentrations.
Primary Productivity
Phytoplankton production rates were near or below the detection limit in all
samples. However, production rates did indicate that the four sampled mine sites
can be ranked in order from highest to lowest productivity as (1) Kuparuk
Deadarm Reservoir 6, (2) Kuparuk Mine Site B, and (3, tied) Kuparuk Mine Site D
and Sag Site C.
The light-dark bottle method for measuring changes in dissolved oxygen
concentrations was not sensitive enough to detect production rates in these cold-
water, high latitude systems. In fact, 42 of the 52 samples contained higher
concentrations of dissolved oxygen in the dark bottle than the light bottle a t the
end of the experiment. Dugdale and Wallace (1960) also reported lower
concentrations of dissolved oxygen in light bottles than in the initial
concentrations or concentrations in dark bottles f rom lakes in southcentral Alaska.
They postulated that higher oxygen concentrations in dark than light bottles may
be due to the dependence of respiration rates upon oxygen concentration. The lack
of locally high oxygen tensions in dark bottles (hence low respiration rates) may
result in negative calculated gross photosynthetic rates, especially a t low rates of
production. According to Dugdale and Wallace, Hutchinson (1957) also reported
negative calculated values for gross primary productivity f rom Lake Quassaparig,
Connecticut. Hutchinson suggests that a photokinetic effect on the zooplankton
might be responsible for the oxygen depletion occurring in the light bottle.
Although gross primary productivity rates are undoubtedly low in all of the
flooded mine sites sampled, the rates are probably detectable with a more sensitive
technique, such as carbon-14 isotope. Future studies should incorporate a more
sensitive method and investigate the possibility that heterotrophic production may
be a n important contribution to the food web of these systems.
Phytoplankton Standing Crop
Phytoplankton standing crop was low in the gravel mine sites; however, the
average concentrations (0.8 to 2.8 zlg/L) were comparable to or somewhat higher
than those reported by Alexander et al. (1980) for tundra ponds near Barrow (0.1 to
1.2 ug/L) and in Ikroavik Lake (0.03 to 2.37 ug/L). In Peters and Schrader lakes,
deep lakes in the Brooks Range, Hobbie (1959, cited in Alexander et al. 1980)
found u p to 1.6 ug chlorophyll-a/L during a n under-ice bloom in May, but
concentrations dropped to 0.8 ug/L during the open-water period. Concentrations
in our study were generally highest under the ice (May) in Kuparuk Mine Site D
and during ice-out (July) in Sag Site C. Alexander et al. (1980) reported that the
chlorophyll content of Barrow area tundra ponds showed a rapid rise a f t e r spring
melt, then fell to low values in mid-July, followed by a rise in August. Except for
concentrations in Kuparuk Mine Site D, the flooded mine sites sampled in our
study did not show a similar seasonal pattern. Unfortunately, we have only three
samples f rom each mine site (May, July, and August) so annual cycles in
phytoplankton populations are unknown and we may have missed sampling peak
seasonal blooms. Overall, the low concentrations of chlorophyll-a indicate
extremely small quantities of algae and ultra-oligotrophic systems.
Highest concentrations of chlorophyll-a in Kuparuk Deadarm Reservoir 6 were
found on the bottom of the reservoir in July and averaged 2.12 ug/L. This pattern
of concentration with depth is consistent with findings in 1987 when 18 ug/L
chlorophyll-a were found near the water-sediment interface in Kuparuk Deadarm
Reservoir 6 and a n average of only 1.3 ug/L in the water column (Hemming 1988).
Kuparuk Deadarm Reservoir 6 is the shallowest mine site of the study with an
average depth of 2.5 m; most of the benthos is within the photic zone. Epipelic
algae (algae living in the top 2 mm of sediments) are probably not significant in
the other mine sites sampled because of their greater depth and lack of shallow
littoral areas. The shallow littoral area created in Sag Site C in 1988 was not
sampled fo r chlorophyll. Higher concentrations occurring near the sediment layer
have also been reported by other researchers. For example, Kalf f and Welch (1974)
reported highest chlorophyll-a concentrations near the sediment layer in Charr
Lake on Resolute Island. They estimated that 80% of the primary productivity,
including mosses, occurred in the lake bottom. Alexander et al. (1980) also
reported algal-rich sediments from shallow ponds (20 cm deep) in the Barrow area
where algae in the sediments were about 60 times more abundant than planktonic
algae. They postulated that the higher abundance of algae in the sediment layer
was due to higher concentrations of nitrogen and phosphorous in the thick
organic/soil layer a t the bottom of the pond.
Alexander et al. (1980) describe possible factors limiting algal production and
standing crop in tundra ponds as light, nutrients, and grazing. Light is probably
limiting in the mine sites during spring, particularly in Kuparuk Mine Site B
where snow cover was thickest and the lowest concentrations of chlorophyll-a
occurred. The other three mine sites are more exposed to wind, had less snow
cover, and had higher concentrations of chlorophyll-a. Light transmission through
clear black ice is assumed to be the same as through pure water (Welch et al. 1987).
Nutrients undoubtedly limit algal production and standing crop in the mine sites;
concentrations of nitrogen and phosphorus are below detection limits in all four
mine sites (Hemming 1987, unpublished data). Grazing of phytoplankton by
zooplankton or of epipelic algae by benthic organisms is probably a more
important factor limiting algal standing crop in Kuparuk Deadarm Reservoir 6
than in the other three sites. Overall, Kuparuk Deadarm Reservoir 6 had the
lowest concentrations of chlorophyll-a, while gross primary productivity rates were
highest and zooplankton densities were about 10 times higher than in any of the
other mine sites in July and about 2 times higher in August. Estimates suggest that
on the order of 20% of the annual phytoplankton production in tundra ponds is
lost to zooplankton grazing (Alexander et al. 1980).
Chlorophyll-b and -c were detected in all mine sites in May, July, and August.
Chlorophyta and Euglenophyta, both of which contain chlorophyll-b, are known to
occur in similar high-latitude lakes and ponds (Wright 1964, Alexander et al. 1980).
Relative concentrations of chlorophyll-b were similar to those reported by Wright
(1964) f rom small tundra lakes near Barrow. Although there may be other algal
genera that contain chlorophyll-c, Cryptomonads have been identified by Wright
(1964) and Alexander et al. (1980) as important components of algal communities in
f a r northern lakes and ponds. Relative concentrations of chlorophyll-c in the
flooded gravel mine sites were higher than those reported by Wright. We found
concentrations of chlorophyll-c ranging from 41% to 71% of the chlorophyll-a
concentrations, whereas Wright reported ratios of 1:3, or about 33%.
Concentrations of chlorophylls a, b, and c were low in all mine sites, which is
expected in high latitude, ultra-oligotrophic systems.
Zooplankton
The four sampled mine sites can be ranked using estimates of zooplankton
abundance as a n indicator of productivity. Based on this approach, Kuparuk
Deadarm Reservoir 6 is the most productive site, followed by Kuparuk Mine Site
B, Kuparuk Mine Site D, and Sag Site C. Hemming (1988) found a similar pattern
of relative abundance of zooplankton a t these four mine sites, and ranked them in
a similar fashion.
Seasonal changes in the abundance of immature and adult zooplankton found in
the mine sites reflect the life-cycle patterns of these organisms. The lack of any
adult crustaceans in the May samples reflects the fact that these organisms
overwinter as resting eggs, or in the case of cyclopoid copepods (Cyclops), as
copepodids (preadults) (Hobbie 1973, 1984, Stross et al. 1980). However,
zooplankton in deeper arctic lakes can overwinter as free-swimming forms (Hobbie
1973). Hobbie (1984) states that the copepodids mature and reproduce shortly af ter
ice melts in June (studies discussed by Hobbie were primarily on small ponds near
Barrow) and that the other copepods and cladocerans also hatch as the ice melts
and then reproduce in mid-to-late July. The presence of adult zooplankton in July,
particularly in Kuparuk Deadarm Reservoir 6 and Kuparuk Mine Site B, suggests
that zooplankton in these sites are maintaining temporal patterns of reproduction
and growth similar to that recorded in ponds a t Barrow, even though the ice in
these large sites is retained longer than that of shallow ponds.
In Kuparuk Mine Site D, numbers of immature zooplankton (which include what
appeared to be overwintering eggs) increased substantially f rom mid-July to late
August, and were the highest numbers observed in the four sites, all in the
apparent absence of adult zooplankton. Very few adult zooplankton were observed
in Kuparuk Mine Site D a t any time, and numbers were substantially lower than
those found a t Kuparuk Deadarm Reservoir 6 or Kuparuk Mine Site B, sites that
had lesser numbers of immature zooplankton in August than did Kuparuk Mine
Site D. One possible explanation for the observed lack of adult zooplankton that
could produce large numbers of immature zooplankton in Kuparuk Mine Site D is
that the sampling locations may have been situated such that concentrations of
adult zooplankton were missed. Hobbie (1984) reported that zooplankton are
di f f icul t to sample because they tend to form clumps. For example, large Dnphnia
often congregate along the margin of the pond away f rom the sun and in
midsummer may even circle the pond over a 24 hr period. (It is unlikely, however,
that a Daplz~zia could circumnavigate Kuparuk Mine site D in 24 hrs; such travel
would encompass approximately 1.6 km of directed travel a t the average rate of 1.1
m/min. Luecke and O'Brien [I9831 reported a cruising velocity of 0.356 cm/sec for
Daphrzia rniddendorjfiann.) Even though zooplankton samples were collected a t f ive
di f ferent sites in Kuparuk Mine Site D, if adult zooplankton were indeed
congregating a t specific locations within the site, i t would be entirely possible to
miss such congregations. Such a pattern of irregular distribution could also affect
the accuracy of sampling a t other sites and time periods.
A second possible explanation for the lack of adult zooplankton in Kuparuk Mine
Site D in August is that these adult organisms may have died prior to the August
sampling period. Zooplankton populations survive the winter as resting or resistant
eggs or as copepodids on or in the bottom muds, and generally not as adults
(Hobbie 1973). Zooplankton in Kuparuk Mine Site D may have completed the
reproductive stage of their l ife cycle and subsequently were in the overwintering
stage a t the time of sampling in August. If such is the case, this scenario does not
explain why zooplankton in Kuparuk Mine Site D are in the resting stage of their
l ife cycle while those in other mine sites still had numerous individuals within the
growth and reproductive stage of their l ife cycle.
Fish stomach samples reported by Hemming (1988) showed that f ish in di f ferent
reservoirs showed a dependence upon different food sources: arctic grayling in Sag
Site C had fed almost entirely on terrestrial insects, broad whitefish and round
whitefish (Prosopiunz cylindrnceum) in Sag Site C fed primarily on midge (Diptera:
Chironomidae) larvae. Broad whitefish f rom Kuparuk Mine Site B fed on
caddisfly (Trichoptera: Limnophilidae) larvae and freshwater snails (Gastropoda).
In comparison, arctic cisco from Kuparuk Deadarm Reservoir 6 fed on either
Dnplzrzia sp. or on one of three copepods: Heterocope sp., Diaptonzus sp., or Cyclops
SP.
The difference in food habits found among fish f rom these reservoirs reflects
differences in physical characteristics of the mine sites, zooplankton densities, and
algal production, as wcll as inherent differences in food habits of the different
f ish species.
Both primary productivity and zooplankton densities were highest in Kuparuk
Deadarm Reservoir 6 (although algal standing crop was low). This reservoir has an
extensive area of littoral habitat that contributes to the presence of relatively
warm water a t this site, as this site averages about 2.5 m in depth. Deeper areas
provide overwintering habitat for fish.
Kuparuk Mine Site B, ranked second in terms of primary productivity and
zooplankton densities, is older than the other sites, contains noticeable amounts of
peat, and has some emergent vegetation. Fish stomach samples reported by
Hemming (1988) indicate that the reservoir also supports a benthic invertebrate
community. The shallow and deep water areas combined with areas of emergent
and submergent vegetation provide the most diverse community types of any of the
reservoirs sampled. A small, interconnecting tundra stream provides access for
anadromous fish to the reservoir.
In contrast, Kuparuk Mine Site D and Sag Site C are relatively young, large, deep
sites that have no emergent vegetation and little littoral habitat. Estimated
primary productivity rates and zooplankton densities are lowest in these two mine
sites. Kuparuk Mine Site D is attached to a tundra stream and has extensive
overburden berms containing some organic material that erodes into the site in
summer; these factors likely contribute to this site's apparent higher productivity
than Sag Site C. Fish in Sag Site C appear to feed almost entirely on terrestrial
insects and a limited benthic community. The littoral habitat created in 1988 may
be sufficient to increase habitat diversity and eventually supply a zooplankton-
terrestrial insect food base for fish. Because the benthos of the littoral zone is
unconsolidated gravel, we do not expect a benthic invertebrate community similar
to that found in Kuparuk Mine Site B to establish itself here in the near future.
ARCTIC GRAYLING POPULATION ESTIMATE SAG SITE C
INTRODUCTION
Sag Site C was flooded in June 1986 when the perimeter berm of the 15.5 ha
former gravel mine site was breached allowing Sagavanirktok River water to f i l l
the excavated area. Information on the physical, chemical, and biological
characteristics of the site were gathered during 1986 and 1987 and a re presented in
ADF&G Habitat Division Technical Report 88-1 (Hemming 1988). Gillnet sampling
documented the presence of four species of fish: arctic grayling, Dolly Varden
(Salvelinus nzalma), round whitefish, and broad whitefish. Arctic grayling were the
most abundant fish captured during July and August. In the fa l l of 1987, a
habitat cnhancernent project was completed a t the site. This project involved
removing a 183 m section of the gravel perimeter berm and excavating the gravel
floodplain area outside of the berm 0.6 to 1.2 m below the water-surface elevation
to create 2.0 ha of shallow-water littoral habitat.
This section of the progress report describes a mark-recapture estimate of arctic
grayling abundance in Sag Site C and an evaluation of use of the shallow-water
zone by fish.
METHODS
Fyke nets were uscd to capture fish for the mark-recapture experiment. The nets
were 3.7 m in length with two 1.2 m entrance frames, 5 hoops, and a 1.8 m cod end.
Net wings measuring 1.2 m by 7.6 m were attached to the first entrance frame.
The netting material consisted of 4.8 mm square-measure, knotless nylon. The nets
were set perpendicular to shore with a center lead connected to the first entrance
f rame to divert f ish into the net. The length of the center lead depended on water
depth and ice conditions a t each net site, but did not exceed 15.2 m.
U p to four nets a t a given time were fished during sampling in mid-July and early
August 1988. Arctic grayling were initially tagged between July 9 and 16 and
recaptured on August 4 and 5. The 18 day period between marking and
recapturing allowed adequate mixing of f ish and loss of temporary "trap behavior."
The nets were fished a t four locations: in the newly excavated shallow-water zone,
off the access ramp, off the outlet channel, and a t the southeast corner of the site
(Figure 5). These sites were the only areas where enough shallow water was
available to deploy the nets.
Only arctic grayling over 80 mm fork length (FL) were marked. Fish greater than
200 mm were tagged beneath the central portion of the dorsal f i n with Floy fine-
fabric, internal-anchor tags, each identified by a n individual number. Fish
between 80 mm and 200 mm were marked by clipping a portion of the caudal f in.
Fin-clipped fish were identified by trap location, with those initially captured in
the shallow water zone receiving a top-caudal f in clip and those captured in the
main portion of the site receiving a bottom-caudal f i n clip.
Arctic grayling under 80 mm FL and other f ish species captured were identified,
counted, and released. Arctic grayling over 80 mm were measured to the nearest
millimeter (FL), marked either by f i n clip or Floy tag, and released during the
first sampling period and examined for marks, measured, and released during the
second period.
Surface water temperatures were measured a t the t rap locations with a hand-held
mercury or a n electronic digital thermometer.
The population estimate was calculated using Chapman's modification of the
Peterson mark-recapture formula (Seber 1982):
where: N = the estimated population size,
n l = the number of fish marked during the first sampling period,
n, = the total number of fish caught during the second sampling period, and
m2 = the number of marked fish recaptured.
The sampling variance of this estimate was calculated as:
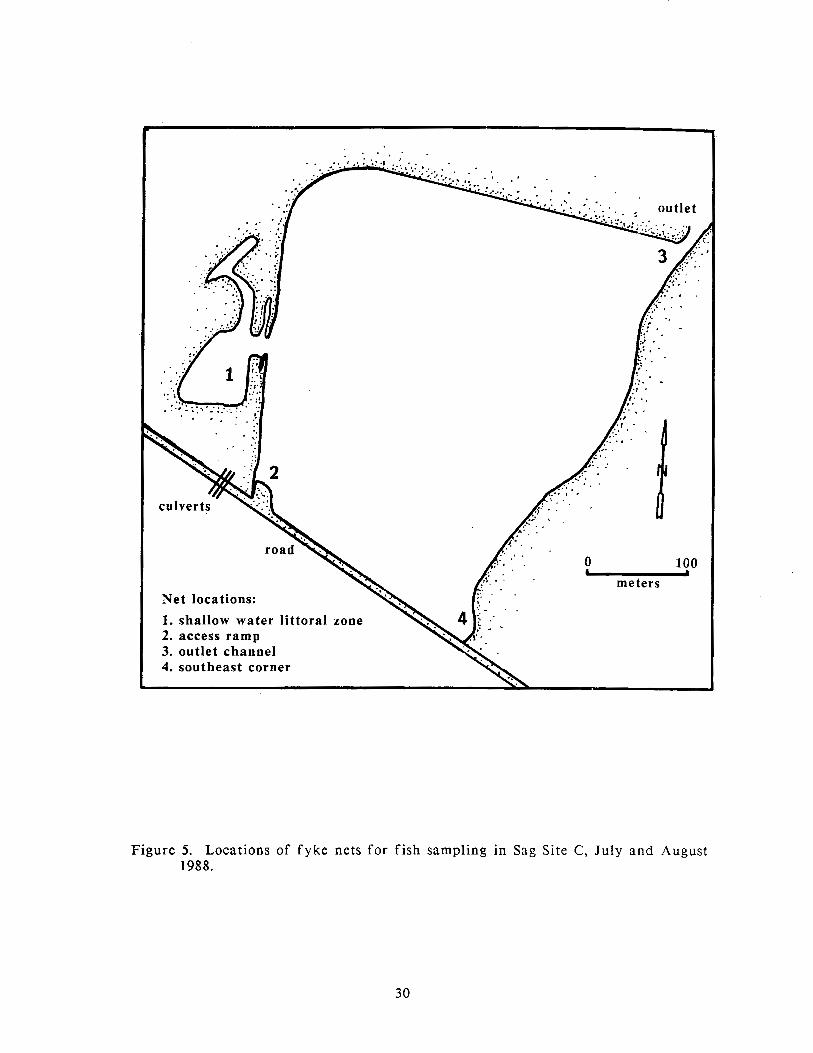
. meters
Net locations:
1. shallow water littoral zone 2. access ramp 3. outlet channel 4. southeast corner
Figure 5. Locations of fyke nets for fish sampling in Sag Site C, July and August 1988.
RESULTS
Population Estimate
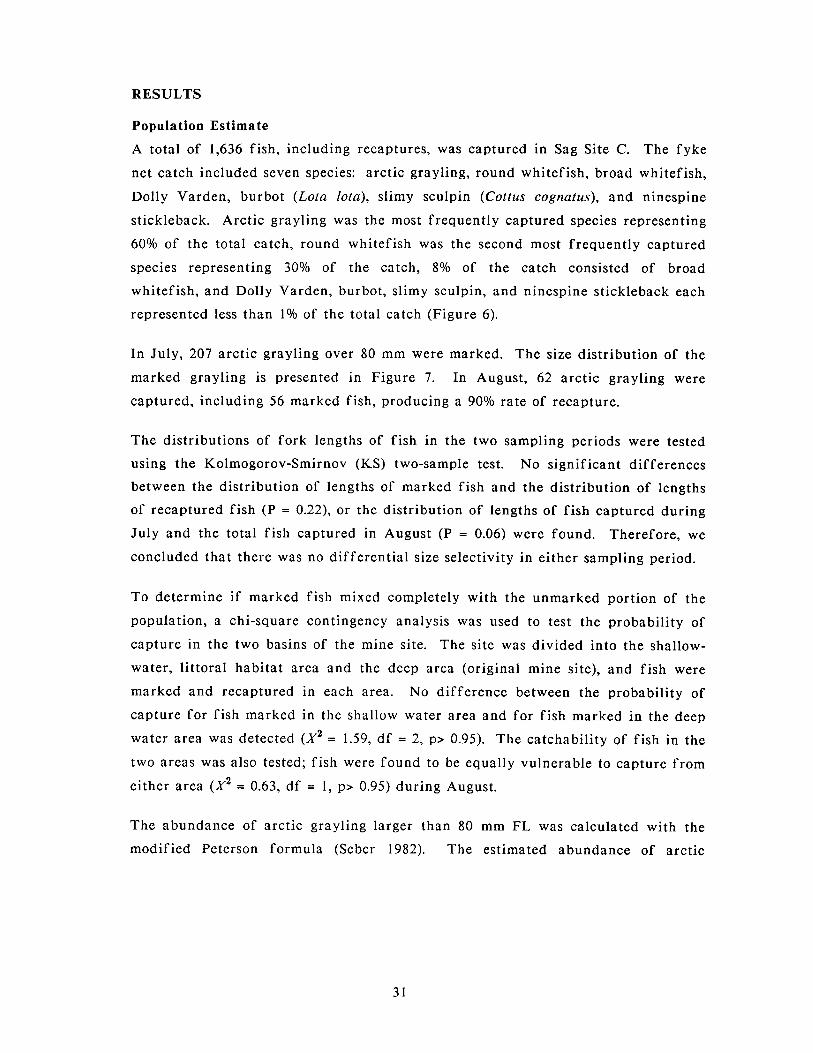
A total of 1,636 fish, including recaptures, was captured in Sag Site C. The fyke
net catch included seven species: arctic grayling, round whitefish, broad whitefish,
Dolly Varden, burbot (Lota Iota), slimy sculpin (Cottus cognatus), and ninespine
stickleback. Arctic grayling was the most frequently captured species representing
60% of the total catch, round whitefish was the second most frequently captured
species representing 30% of the catch, 8% of the catch consisted of broad
whitefish, and Dolly Varden, burbot, slimy sculpin, and ninespine stickleback each
represented less than 1% of the total catch (Figure 6).
In July, 207 arctic grayling over 80 mm were marked. The size distribution of the
marked grayling is presented in Figure 7. In August, 62 arctic grayling were
captured, including 56 marked fish, producing a 90% rate of recapture.
The distributions of fork lengths of f ish in the two sampling periods were tested
using the Kolmogorov-Smirnov (KS) two-sample test. No significant differences
between the distribution of lengths of marked fish and the distribution of lengths
of recaptured fish (P = 0.22), or the distribution of lengths of f ish captured during
July and the total f ish captured in August (P = 0.06) were found. Therefore, we
concluded that there was no differential size selectivity in either sampling period.
To determine if marked fish mixed completely with the unmarked portion of the
population, a chi-square contingency analysis was used to test the probability of
capture in the two basins of the mine site. The site was divided into the shallow-
water, littoral habitat area and the deep area (original mine site), and fish were
marked and recaptured in each area. No difference between the probability of
capture fo r fish marked in the shallow water area and for f ish marked in the deep
water area was detected ( x 2 = 1.59, df = 2, p> 0.95). The catchability of f ish in the
two areas was also tested; f ish were found to be equally vulnerable to capture f rom
either area ( x 2 = 0.63, df = 1, p> 0.95) during August.
The abundance of arctic grayling larger than 80 mm FL was calculated with the
modified Peterson formula (Seber 1982). The estimated abundance of arctic
Species Captured
Figure 6. Proportions of each fish species captured, as percent of the total catch, f rom fyke nets in Sag Site C, 1988. n = 1636.
A G = arctic grayling NSB = ninespine stickleback BWF = broad whitefish RWF = round whitefish BB = burbot SSc = slimy sculpin DV = Dolly Varden
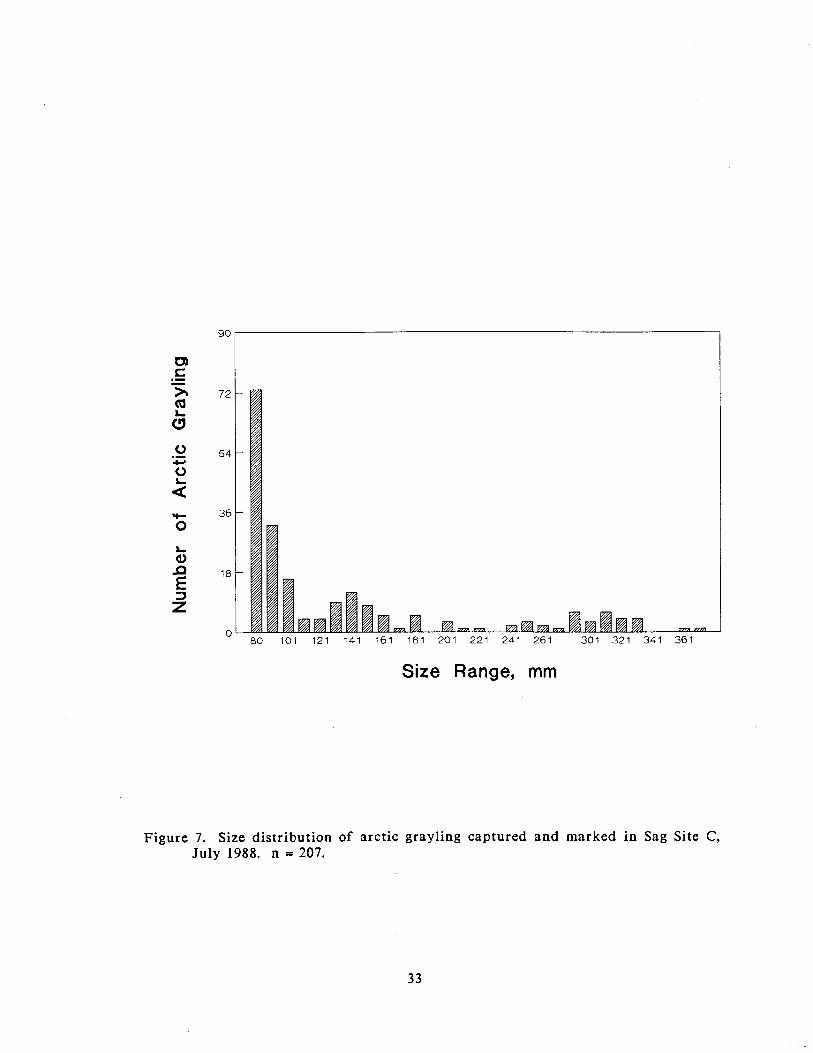
Size Range, mm
Figure 7. Size distribution of arctic grayling captured and marked in Sag Site C, July 1988. n = 207.
grayling in Sag Site C was 229 + 16 (standard error = 8; 95% confidence interval).
The estimated density of arctic grayling larger than 80 mm FL is 14.8 grayling per
ha. Neither the inlet nor the outlet channels were connected to the Sagavanirktok
River beteen July 9 and August 5, thus immigration or emigration a re not factors
affecting this estimate.
Use of the Enhancement Area by Fish
The net located in the shallow-water zone captured 1,259 fish including recaptures,
and a total of six species during the two sampling periods. Seventy-seven percent
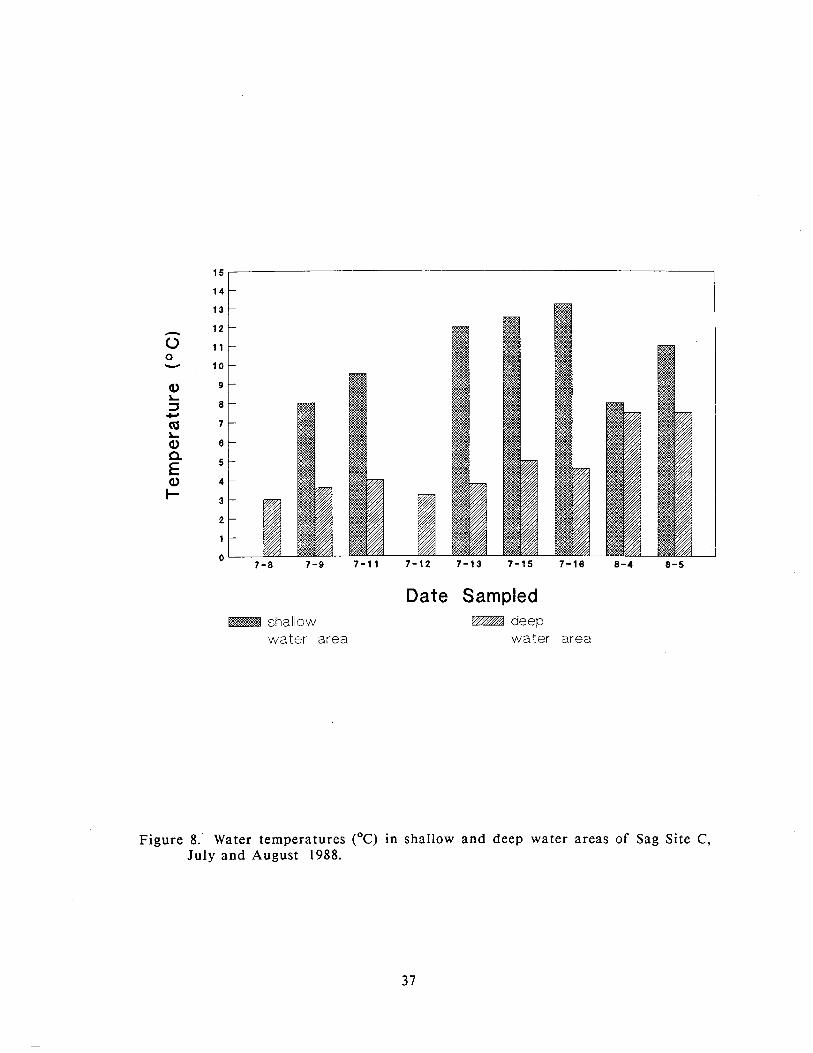
of all captures occurred in the shallow-water zone. The catch per unit ef for t
(CPUE) of 125.9 fish per net-day for the shallow-water site exceeded the CPUE for
the other sites (Table 7). The shallow-water net was fished longer than the nets a t
other sites because the shallow water habitat was ice-free earlier, allowing early
deployment of this net. The water temperatures in the shallow water habitat were
up to 8 ' ~ warmer than the remainder of the mine site during July (Figure 8).
During August, water temperatures had risen in the main portion of the mine site
while the water temperatures in the shallow water habitat had decreased.
Approximately the same numbers of f ish were caught in the shallow and deep
water areas in August.
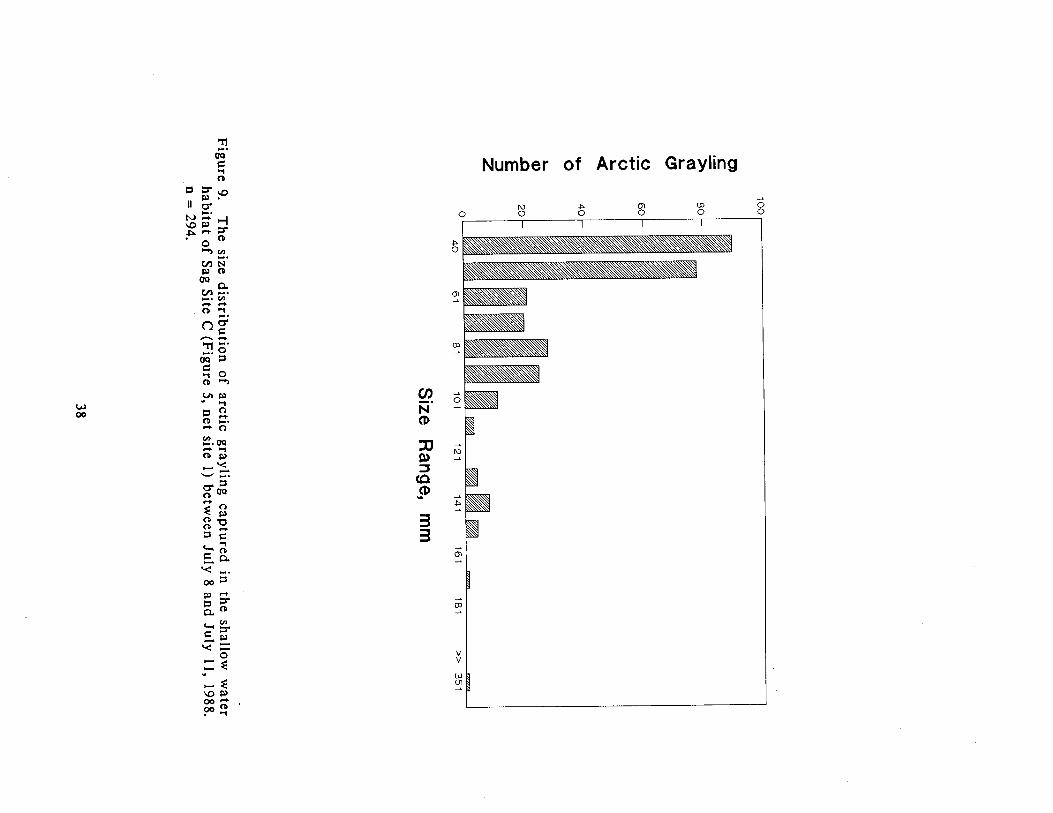
The shallow-water area was the only area fished f rom July 8 to 11 when ice
conditions prevented net placement in the main portion of the mine site. During
this time period, 496 fish were captured: 294 arctic grayling, 189 round whitefish,
and 13 broad whitefish. The size composition of the arctic grayling captured in
the shallow water habitat between July 8 and 11 is presented in Figure 9. The
round whitefish captured during this time period ranged f rom 50 to 188 mm FL
and averaged 66.9 mm (sd = 19.6 mm), and the broad whitefish ranged f rom 57 to
75 mm F L and averaged 66.4 mm (sd = 6.6 mm).
DISCUSSION
The density of arctic grayling in Sag Site C is low when compared to the densities
of arctic grayling supported by gravel mine sites and ponds in interior Alaska.
The ADF&G Sport Fish Division has stocked fingerling and sac-fry arctic grayling
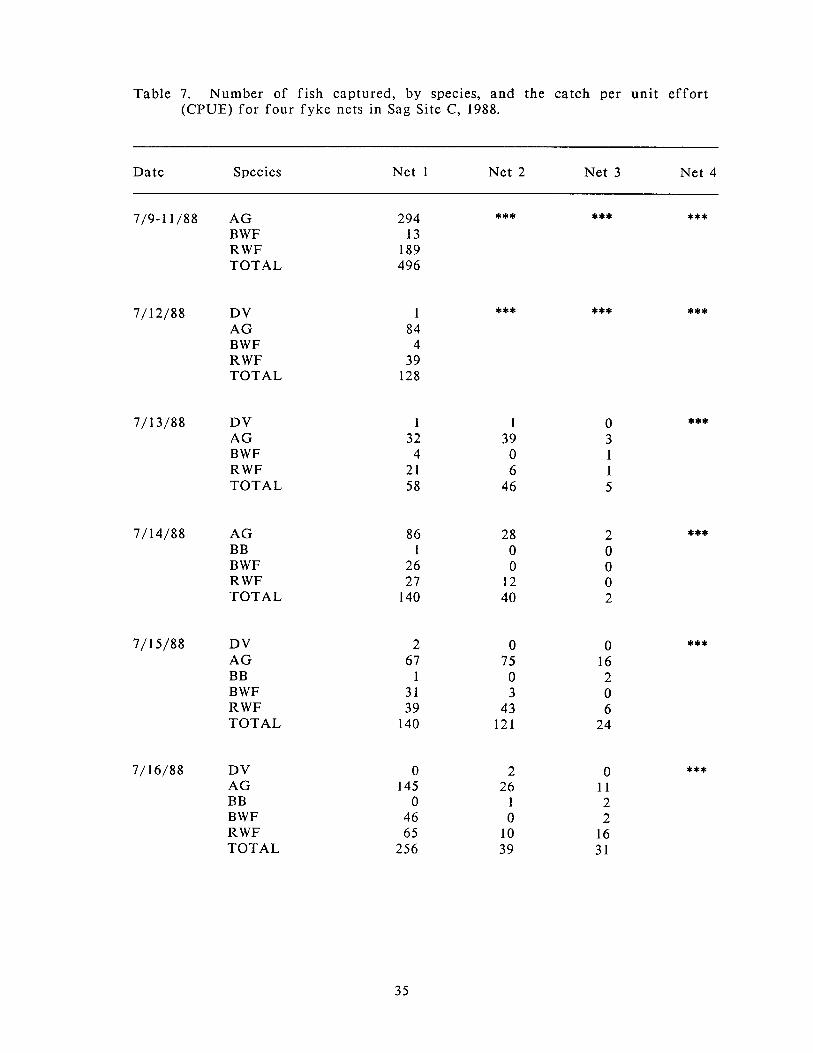
Table 7. Number of f ish captured, by species, and the catch per unit ef for t (CPUE) for four fyke ncts in Sag Site C, 1988.
Date Species Net 1 Net 2 Net 3 Net 4
7/9-11/88 A G B W F R W F TOTAL
7/12/88 DV A G B W F R W F TOTAL
7/ 13/88 DV A G B W F RWF TOTAL
7/ 14/88 A G B B B W F R W F TOTAL
7/ 15/88 DV A G B B B W F R W F TOTAL
7/16/88 DV AG B B B W F R W F TOTAL
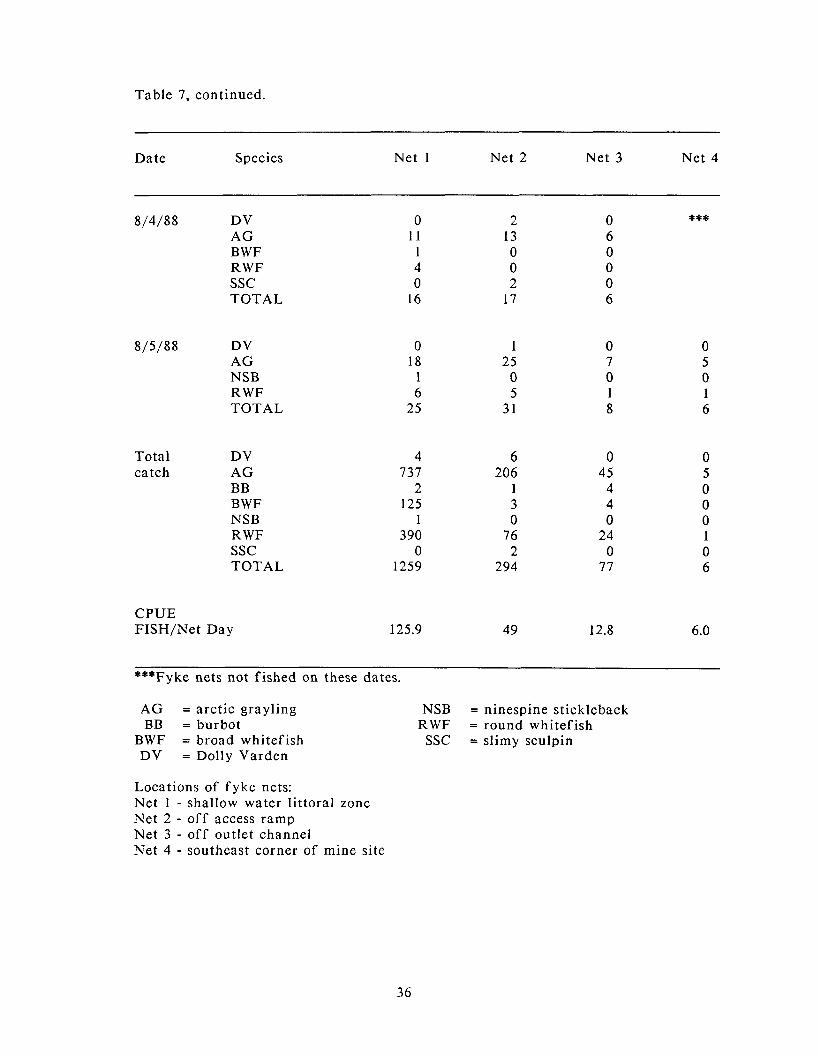
Table 7, continued.
Date Species Net 1 Net 2 Net 3 Net 4
8/4/88 DV AG BWF RWF SSC TOTAL
8/5/88 DV AG NSB RWF TOTAL
Total DV catch AG
BB BWF NSB RWF SSC TOTAL
CPUE FISH/Net Day
***Fyke nets not fished on these dates.
AG = arctic grayling BB = burbot
BWF = broad whitefish DV = Dolly Varden
NSB = ninespine stickleback RWF = round whitefish
SSC = slimy sculpin
Locations of fyke nets: Net 1 - shallow water littoral zone Net 2 - off access ramp Net 3 - off outlet channel Net 4 - southeast corner of mine site
shallow water area
Date Sampled EBBZ4 deep
water area
Figure 8. Water temperatures ( O C ) in shallow and deep water areas of Sag Site C, July a n d August 1988.
Number of Arctic Grayling
in numerous ponds and lakes (Doxey 1987). The stocking density generally used
fo r development of sport fisheries has been 80 fingerling arctic grayling per ha.
An evaluation of survival of grayling fingerlings f rom age of stocking to age 1
was calculated to be 0.33 in a 1.6 ha shallow (3.0 m depth) pond (Ridder 1987), or
an average density of 26 fish per ha. In contrast, we estimated the arctic grayling
density in Sag Site C was 14.8 fish per ha. The density of f ish in Sag Site C may be
more closely related to immigration during flooding of the site by the
Sagavanirktok River than by other factors. The presence of other species of f ish
and the potential fo r interspecific competition, as well as high latitude conditions
creating low site productivity, may limit population levels during periods when the
site is isolated f rom the Sagavanirktok River.
The arctic grayling population in Sag Site C is dominated by the 40 to 50 mm size
class and the 80 to 90 mm size class, which most likely represent age classes 1 and
2. I t is possible that these juvenile fish colonized the site in 1987 when high water
kept the site connected to the Sagavanirktok River for most of the open-water
season or during the very brief period of high water in June 1988. Observations
made in late summer failed to verify the presence of young-of-the-year arctic
grayling. I t is unlikely that spawning in the mine site accounts for the age 1 and
age 2 arctic grayling.
The higher CPUE in the shallow water area suggested a preference by juvenile fish
fo r this habitat type. The differences in the CPUE were greatest during the first
sampling period as juvenile arctic grayling, round whitefish, and broad whitefish
were captured most frequently in the shallow warm-water area. For example, 95%
of the total broad whitefish were caught in the shallow-water site. During August
a f t e r ice was off the mine site, catches were more evenly distributed between the
littoral area and the main portion of the mine site. At this time, water
temperatures were similar in the littoral area and the main portion of the site.
The enhancement project a t Sag Site C was designed to provide an additional 2.0
ha of shallow water habitat, but only a portion of the excavated area was flooded
in 1988, due to limited spring mflooding of the site. The flooded shallow water
zone was estimated to be less than 1 ha in size. A 1 ha littoral zone expansion to
this 15.5 ha lake represents less than 5% littoral habitat fo r the entire lake
complex. Previous studies have recommended 25% littoral habitat for sites
designed fo r f ish (Joyce et al. 1980). The substantial use of this small area by

juvenile f ish in mid-July suggests a preference fo r shallow water habitat during
July when the ice was melting.
No documentation of overwinter survival of f ish in the gravel mine sites currently
exists, although temperature and dissolved oxygen concentrations indicate high
quality overwintering habitat is present. We recommend that fu tu re sampling
address winter survival of arctic grayling.
ARCTIC GRAYLING DISEASE SCREENING SAGAVANIRKTOK RIVER
INTRODUCTION
As part of the requirements for issuance of a f ish transport permit to allow the
transport of arctic grayling f rom the Sagavanirktok River to flooded gravel mine
sites in the Prudhoe Bay - Kuparuk oilfields, 60 arctic grayling were collected and
sacrificed to establish a disease history for this stock. The disease screening
focused on three fish diseases: the bacterial diseases, f ish furunculosis and
bacterial kidney disease (BKD); and the viral disease, infectious pancreatic necrosis
(IPN).
Fish furunculosis, a bacterial disease caused by the bacterium Aeromonas
salmonicida, is a widespread disease that frequently occurs in salmonid fishes, and
commonly occurs in Alaska salmonids. This disease is characterized by a number
of symptoms that include, depending on the severity of the disease: massive
bacteremia; lesions in muscle tissue that often contain blood, pus, and necrotized
tissue; hemorrhagic spots in muscle; liquefactive necrosis of the kidneys and spleen;
congestion of the posterior part of the intestine; bloody discharge f rom the vent;
bleeding f rom the gills; hemorrhages and necrotic lesions a t the base of pectoral
and pelvic fins; and fraying of the f ins (Snieszko and Bullock 1975). A.
salnzonicidn can survive in water and sediment fo r days or weeks, but cannot
reproduce indefinitely outside of fish. It is considered a n obligate pathogen of
fish, and diseased or carrier fish are sources and reservoirs of the bacteria.
Transmission of A. salrnonicida occurs through contaminated water, contact with
diseased or carrier fish, or f rom contaminated eggs. Disinfectants and
antimicrobial drugs can be used to prevent, control, and treat furunculosis.
Bacterial kidney disease (BKD), caused by the bacterium Renibacteriunz
salnzoninarum, is a systemic infection that often causes high mortality among wild
and propagated salmonids. This disease is commonly found in Alaska salmonids (L.
Wenderoff, Microbiologist, ADF&G, FRED Div., Anchorage, pers. comm.). BKD
progresses slowly, is systemic, and may not show clinical signs until the disease is
well established. Typical cxternal characteristics of this disease include protrusion
of the eyes, open lateral lcsions, and small closed blebs containing blood cells,
necrotized tissue, and large numbers of R. salmoninarum (Bullock 1980). Internally,
the disease is characterized by swollen kidneys with white areas containing
bacteria, cell debris, and leucocytes; hemorrhages in the body wall and testes; and
necrotic areas within the kidneys, spleen and liver (Bullock 1980). In advanced
cases, much kidney tissue is destroyed, affecting both excretory and hematopoietic
functions. Transmission of the disease occurs f rom fish to f ish through skin
lesions, and with sex products. A 100% transmission has also been achieved by
feeding infected viscera to fingerling salmon. Subclinically infected or carrier
f ish serve as a reservoir for infection.
Infectious pancreatic necrosis (IPN) is a viral infection of salmonid fishes causing
high mortality in f r y and fingerlings, and occasionally in larger fish. IPN has not
been found in arctic grayling in Alaska (L. Wenderoff, pers. comm.). Symptoms of
the disease include overall darkening, protruding eyes, abdominal distention,
hemorrhages in ventral areas including bases of fins, multiple hemorrhages in the
pyloric caecal area, pale liver and spleen, depressed hematocrit, and pronounced
pancreatic necrosis (Wolf 1966). Behavioral abnormalities include weak respiration
and lying on the bottom alternating with periods of whirling swimming (rotating
about their long axis) when near death. IPN seldom kills all infected fish; some
recover and attain functional sexual maturity. These recovered fish serve as
carriers of the disease, shedding the virus in their feces, and thus transmitting the
disease through flowing water. The virus is also transmitted in eggs and sperm.
METHODS
U p to 4 fyke nets and 4 gill nets were used to obtain 60 arctic grayling f rom the
Sagavanirktok River during the period 28 July - 4 August 1988. Nets were set in
slack-water areas in a 10.5 km strctch of river f rom about 1 km upstream of the
Deadhorse airport to about 3 km downstream of the Sagavanirktok River bridge.
Fyke nets were fished f rom 5-7 days and usually checked on a daily basis. Because
arctic grayling greater than 150 mm in length were desired for disease screening,
and catches of the desired size fish were usually small, arctic grayling were usually
held in the fyke nets for several days before they were sacrificed to obtain
sufficient numbers for sampling and shipment. Fish other than arctic grayling and
arctic grayling less than 150 mm in length were released, generally on a daily basis.
Gill nets were fished f rom 1-2 days and live f ish other than arctic grayling were
released.
Sacrificed arctic grayling were measured and scales and otoliths were collected for
age determination. Otoliths were immersed in Loess' solution and aged under a
dissecting microscope. Scales were cleaned, pressed on to heated acetate sheets, and
the impressions read on a microfiche reader. The arctic grayling were rinsed with
Betadyne disinfectant and their spleen and kidneys were removed. The kidneys
and spleens were placed in labeled plastic bags, packed in ice, and shipped to the
Fish Pathology Section, FRED Division, ADF&G, Anchorage, fo r disease screening.
Fluorescent antibody techniques were used to test for the presence of the bacterial
diseases. Traditional viral assay was used to test fo r the presence of IPN virus.
RESULTS
Analyses of the arctic grayling tissue samples found no presence of f ish
furunculosis, kidney disease bacteria, or IPN virus (Appendix 11), thus satisfying
all requirements for implementation of the fish transport permit.
Of the 60 arctic grayling sacrificed for disease screening, 33 were female, 20 were
male, and 7 were not sexed. Females ranged in fork length f rom 176 to 384 mm
(mean = 302.3, sd = 48.8), males ranged in length from 181 to 378 mm (mean =
268.9, sd = 61.6), and the unsexed arctic grayling ranged in length f rom 159-310
mm (mean = 186.7, sd = 54.8) (Appendix 111). Ages of the sacrificed arctic grayling
ranged from 3 to 10 based on scales and f rom 3 to 12 based on otoliths (Table 8).
For those fish that were aged by otoliths and by scales (n = 53), the mean otolith-
based age was 1 yr greatcr than that determined f rom scales (7.1 vs 6.1 yrs). Scale-
based ages were similar to thosc determined f rom otoliths through age 5, but
generally were 1 yr less for fish aged 6-10. For fish aged 8-10 by scales, an
underestimation of 1-4 years occurred from ages determined by otoliths. This
observed difference between scale- and otolith-based ages is similar to that found
in other studies of North Slope arctic grayling (Craig and Poulin 1975, McCart et
al. 1972).
The total number and size of fish per species caught in the fyke nets and the
number of fish caught in gill ncts are listed in Appendices IV, V, and VI. Fish
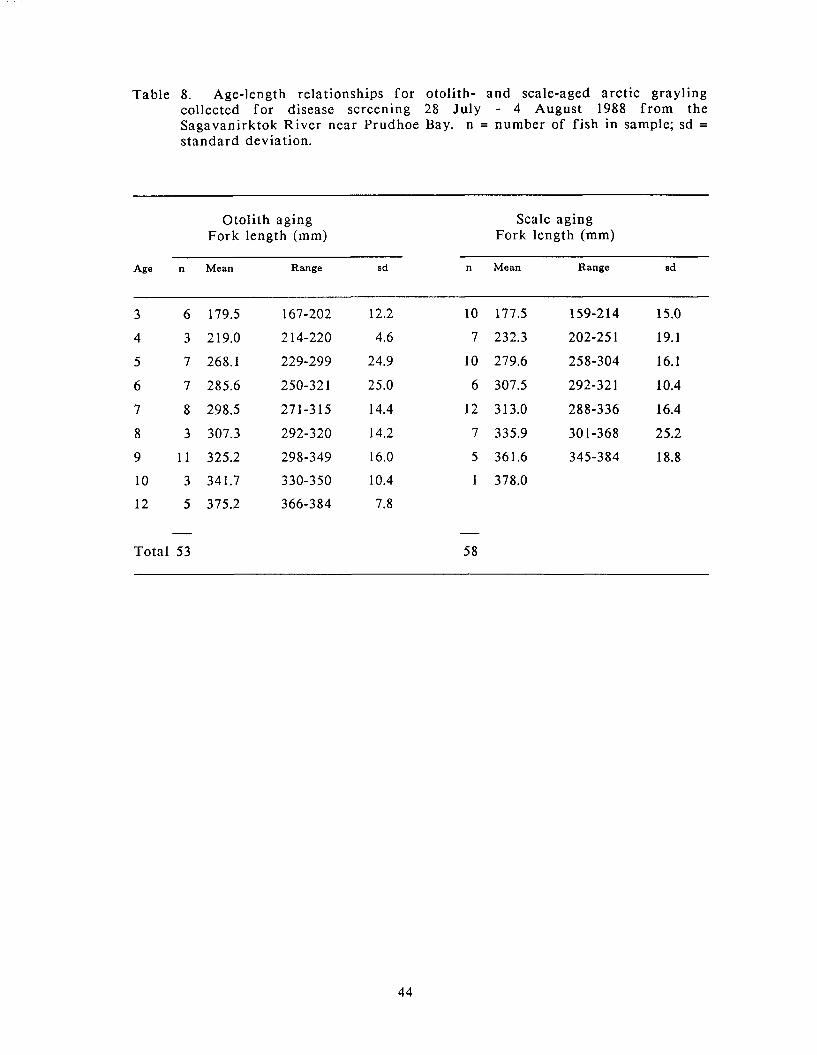
Table 8. Age-length relationships for otolith- and scale-aged arctic grayling collected for disease screening 28 July - 4 August 1988 f rom the Sagavanirktok River near Prudhoe Bay. n = number of f ish in sample; sd = standard deviation.
Otolith aging Fork length (mm)
Scale aging Fork length (mm)
Age n Mean Range sd n Mean Range sd
- - Total 53 5 8
caught other than arctic grayling included round, broad, and humpback whitefish;
Dolly Varden; and slimy sculpin.
DISCUSSION
Disease screening showed no evidence of diseases in arctic grayling in the
Sagavanirktok River, thus enabling the use of a readily available source of arctic
grayling fo r transplants to other sites within the Prudhoe Bay-Kuparuk oilfields.
However, the sampling effor t for the disease sample indicates that the numbers of
arctic grayling that are accessible to capture by fyke nets in the lower
Sagavanirktok River are low. Sampling suggests that in each of the fyke net-
fishable slack-water areas, only a few arctic grayling are present, and that these
fish are quickly captured. This necessitates either leaving a net a t a site for
extensive periods or moving the net to new or more productive sites. The number
of fyke net-fishable sites in the Sagavanirktok River in the vicinity of Prudhoe
Bay is limited in number and accessibility, although there are other potential sites
inland of the Dalton Highway. More efficient capture sites may be found,
particularly in early summer, in or near small tundra streams feeding the
Sagavanirktok River, such as those found in the vicinity of and including Happy
Valley Creek.
Tundra streams, such as Happy Valley Creek, Dan Creek, and others may provide
a n easily obtainable source of adult arctic grayling in the early summer as these
fish descend these streams to larger rivers following spawning. After this
postspawning downstream migration, few adult arctic grayling remain, although
the system may prove to be important rearing habitat fo r juveniles (Craig and
Poulin 1975, McCart et al. 1972). Craig and Poulin (1975) counted 13 adult arctic
grayling (>300 mm) (0.29 adults/km) at a weir on Weir Creek, a stream about 45 km
in length and a tr ibutary of the Kavik River. Catches of juveniles (arctic grayling
~ 3 0 0 mm, excluding f ry ) numbered 2,165 (0.47/km). McCart et al. (1972) tagged a
total of 80 arctic grayling >200 mm in Happy Valley Creek in 1971, yielding an
estimate of 0.43 fish/km for this crcek. More adult arctic grayling were probably
in these systems, as some individuals probably left the systems prior to
establishment of the weirs or during upset periods. If the Weir Creek densities are
applied to Happy Valley Creek, using a stream length of 34.4 km for Happy Valley
Creek, an estimated 10 adult arctic grayling and 1,643 juveniles should use this
stream. Thus, because of the low numbers of adult arctic grayling present in these
small streams, care must be taken to avoid removing excessive numbers of adult
arctic grayling f rom any particular stream.
Two unsuccessful attempts a t introducing fish to barren lakes have been conducted
within the coastal plain of northern Alaska. In June 1981, 50,000 newly hatched
arctic grayling f r y were stocked in Isatkoak Lagoon a t Barrow as part of a n
experimental stocking program to enhance recreational fishing opportunities for
local residents (Bendock 1982). This impounded former salt water lagoon has been
dredged to a maximum depth of 7.6 m, and the upper two (of three) impoundments
serve as a municipal water supply. The arctic grayling f r y f rom Clear Hatchery
stock were stocked in the uppermost lagoon in June, a time when the lagoon was
ice covered. Limited open water was present where tundra runoff had melted a
small amount of ice. The f r y were placed in this open water area and appeared to
be in good condition when released (T. Bendock, Fishery Biologist, ADF&G, Sport
Fish Division, Soldotna, pers. comm). Predation on the f r y by gulls and terns was
noted shortly af ter the f r y were released. Sampling in August 1983 failed to
capture any arctic grayling, and workers a t the Barrow water facility had not
observed any arctic grayling or arctic grayling-sized fish (Bendock and Burr 1984).
Workers did observe a number of ninespine sticklebacks a t the water intake in the
upper lagoon. Bendock (pers. comm.) believed that this stocking occurred too early
in the year for this location and that better survival may have occurred if the f ish
had been released when the lagoon was ice free. The lagoon has not been
restocked since this apparent stocking failure. The North Slope Borough is
currently developing plans to stock this reservoir with adult arctic grayling taken
f rom local stocks (M. Philo, Research Biologist, North Slope Borough, Barrow, pers.
comm.).
On 23 August 1977, 3,000 fingerling rainbow trout were stocked in Webster
Reservoir (Unpubl. data files, ADF&G, Sport Fish Division, Fairbanks), a 12 ha
tundra lake adjacent to thc Sagavanirktok River floodplain that had been
deepened and serves as a water supply reservoir fo r oilfield activities. In the
summer of 1978 or 1979, gill nets were fished overnight in Webster Reservoir on
several occasions; no rainbow trout were caught in these nets, suggesting that no
trout survived (T. Bendock, pers. comm).
The current plan to introduce large juvenile and adult arctic grayling to systems
lacking arctic grayling should prove to be more successful than the two previous
attempts to stock lakes. The large fish are unlikely to be eaten by birds as would
f r y or fingerling fish. Abundant ninespine stickleback may provide a plentiful
source of food fo r some large arctic grayling and access to streams may provide
additional feeding habitat. Access to a stream system that will have higher water
temperatures in the spring may provide conditions more suitable to spawning than
in the mine site. Such factors may allow an arctic grayling population to become
established in a system previously barren of a population of f ish other than
ninespine stickleback and broad whitefish.
CONCLUSIONS
Biological sampling conducted during summer 1988 indicated that the amount of
littoral habitat present in a flooded gravel mine site strongly influences the
productivity in that site. Highest rates of algal production and greatest
zooplankton densities were found in mine sites with extensive littoral habitat
(Table 9). Fish sampling a t Sag Site C suggested a preference fo r shallow water
habitats by juvenile fish during the ice-out period when this habitat is accessible
to them. Results of this study suggest that enhancement of gravel mine sites for
f ish habitat should emphasize creation of additional littoral habitat to increase
algal production, zooplankton densities, and use by fish.
Permanently connecting a mine site to a river will allow colonization of the mine
site by fish and will provide the mine site-resident fish access to the river for
rearing and potential spawning. A deep mine site connected to a river system may
also increase the capacity of a system to overwinter fish. Sites with ephemeral
connections will likely not provide conditions as beneficial to f ish as will
permanently connected sites if the mine sites do not provide habitat fo r spawning,
rearing, and overwintering. At such temporarily connected sites, the productivity
of the site, in terms of food available to fish, will be important to the survival of
f ish in the site until a river connection is reestablished and fish have the
opportunity to leave the site.
Mine sites associated with small tundra streams and not connected to a major river
with overwintering habitat have low fish species diversity (Table 9). An arctic
grayling transplant is proposed to increase fish species diversity and use of
available habitat. I t is assumed that arctic grayling will use mine sites for
overwintering and potentially, connected tundra streams fo r spawning. Rearing
may occur in either the mine sites or the tundra streams. Large numbers of
ninespine stickleback found in these sites may provide a readily available source
of food for large juvenile and adult arctic grayling. Success with this arctic
grayling transplant in a tundra stream/mine site setting will likely direct the
design of future gravel mine sites toward the optimization of use by fish and other
species.
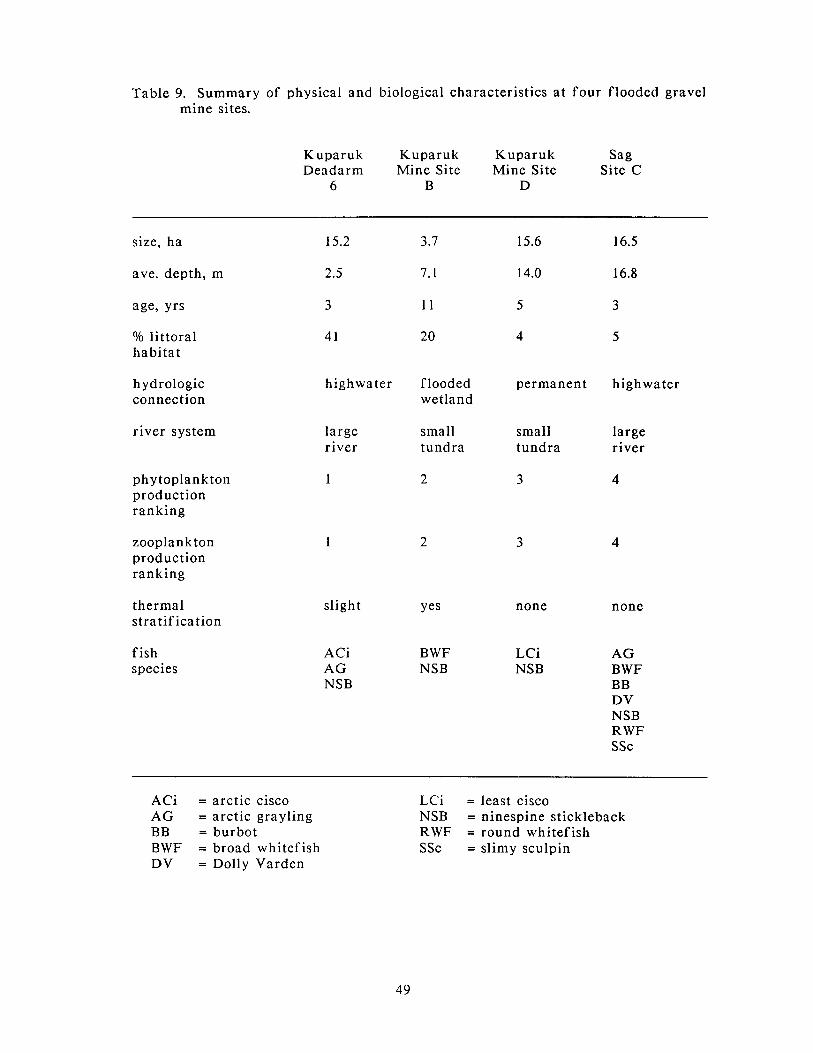
Table 9. Summary of physical and biological characteristics a t four flooded gravel mine sites.
Kuparuk Kuparuk Kuparuk Sag Deadarm Mine Site Mine Site Site C
6 B D
size, ha
ave. depth, m
% littoral habitat
hydrologic connection
highwater flooded wetland
highwater permanent
river system large small river tundra
small tundra
large river
phytoplankton production ranking
zooplankton production ranking
thermal stratification
slight yes none none
fish species
ACi AG NSB
BWF LCi AG NSB NSB BWF
BB DV NSB RWF s s c
ACi = arctic cisco A G = arctic grayling BB = burbot BWF = broad whitefish DV = Dolly Varden
LCi = least cisco NSB = ninespine stickleback RWF = round whitefish SSc = slimy sculpin
LITERATURE CITED
Adams, B., and T.C. Cannon. 1987. Overwintering study. in 1985 f inal report for the Endicott Environmental Monitoring Program. Vol. 7, Part V. Prepared by Envirosphere Co. for U.S. Army Corps of Engineers, Anchorage, Alaska. 33 PP.
Alexander, V., D.W. Stanley, R.J. Daley, and C.P. McRoy. 1980. Primary producers. Pages 179-250 in J.E. Hobbie, ed. Limnology of tundra ponds, Barrow, Alaska. U.S./IBP Synthesis Ser. Vol. 13. Dowden, Hutchinson & Ross, Inc., Stroundsburg, PA. 514 pp.
Bendock, T.N. 1977. Beaufort Sea estuarine fishery study. RU-233. Pages 670-729 in Environmental Assessment of the Alaska Continental Shelf. Final reports of principal investigators. Vol. 4. Biological studies. 1979. USDC:NOAA; USD1:MMS. 1979.
Bendock, T.N. 1982. Inventory and cataloging of arctic waters. ADF&G, Fed. Aid in Fish. Rest. Ann. Performance Rept. Vol. 23. Project F-9-14, Job G-1-1. Juneau. 43 pp.
Bendock, T.N., and J.M. Burr 1984. Inventory and cataloging of arctic waters. ADF&G, Fed. Aid in Fish. Rest. Ann. Performance Rept. Vol. 25. Project F-9-16, Job G-1-1. Juneau. 46 pp.
Bullock, G.L. 1980. Bacterial kidney disease of salmonid fishes caused by Renibacteriunz salnzoninnrum. Fish Disease Leaflet 60. USFWS, Washington, D.C. 10 pp.
Craig, P.C., and V.A. Poulin. 1975. Movements and growth of arctic grayling (Tlzymallus arcticus) and juvenile arctic char (Salvelinus alpinus) in a small arctic stream, Alaska. J. Fish. Res. Board Can. 32:689-697.
Doxey, M. 1987. Tanana drainage lake stocking evaluations, 1986. Alaska Dept. of Fish and Game, Sport Fish Division, Fisheries Data Series, No. 31. Juneau. 32 pp.
Dugdale, R.C., and J.T. Wallace. 1960. Light and dark bottle experiments in Alaska. Limnol. and Occanogr. 5(2): 230-23 1.
Hemming, C.R. 1988. Aquatic habitat evaluation of flooded North Slope gravel mine sites (1986-1987). Alaska Dept. of Fish and Game, Habitat Division Tech. Rept. No. 88-1. Juneau. 69 pp.
Hobbie, J.E. 1959. Limnological studies on Lakes Peters and Schrader, Alaska. M.S. Thesis. Univ. California, Berkeley. 62 pp.
Hobbie, J.E. 1973. Arctic limnology: a review. Pages 127-168 in M.E. Britton, ed. Alaska arctic tundra. Arctic Inst. N. Am. Tech. Pap. 25. 224 pp.
Hobbie, J.E. 1984. The ecology of tundra ponds of the Arctic Coastal Plain: a community profile. FWS/OBS - 83/25. USD1:USFWS. 52 pp.
Hutchinson, G.E. 1957. A treatise on limnology. Volume 1. J. Wiley and Sons. 1,015 pp.
Joyce, M.R., L.A. Rundquist, and L.L. Moulton. 1980. Gravel removal guidelines manual fo r arctic and subarctic floodplains. FWS/OBS-80/09. USD1:USFWS. 403 pp.
Kalf f , J., and H.E. Welch. 1974. Phytoplankton production in Char Lake, a natural polar lake, and in Meretta Lake, a polluted polar lake, Cornwallis Island, Northwest Territories. J. Fish. Res. Board Can. 31:621-636.
Luecke, C., and W.J. O'Brien. 1983. The effect of Heterocope predation on zooplankton communities in arctic ponds. Limnol. and Oceanogr. 28(2): 367- 377.
McCart, P., P. Craig, and H. Bain. 1972. Report on fisheries investigations in the Sagavanirktok River and neighboring drainages. Prepared fo r Alyeska Pipeline Service Co. 143 pp.
Ridder, W., and C. Skaugstad. 1987. Evaluation of arctic grayling enhancement in the Tanana drainage during 1986. Alaska Dept. of Fish and Game, Sport Fish Division, Fisheries Data Series, No. 9. Juneau. 14 pp.
Seber, G.A.F. 1982. The estimation of annual abundance and related parameters. Second edition. Lubrecht and Cramer LTD. 654 pp.
Snieszko, S.F., and G.L. Bullock. 1975. Fish furunculosis. Fish Disease Leaflet 43. USFWS, Washington, D.C. 10 pp.
Strickland, J.D.H., and T.R. Parsons. 1968. A practical handbook of seawater analysis. Bull. Fish Res. Board Can. 167. 31 1 pp.
Stross, R.G., M.C. Millar, and R.J. Daley. 1980. Zooplankton. Pages 251-296 in J.E. Hobbie, ed. Limnology of tundra ponds, Barrow, Alaska. U.S./IBP Synthesis Ser. Vol. 13. Dowden, Hutchinson & Ross, Inc., Stroundsburg, PA. 514 pp.
Welch, H.E., J.A. Legault, and M.A. Bergmann. 1987. Effects of snow and ice on the annual cycles of heat and light in Saqvaqjuac lakes. Can. J. Fish. Aquat. Sci. 44:1451-1461.
Wetzel, R.G., and G.E. Likens. 1979. Limnological analyses. W.B. Saunders Co., Philadelphia. 357 pp.
Wolf, K. 1966. Infectious pancreatic necrosis (IPN) of salmonid fishes. Fish Disease Leaflet 1. USFWS, Washington, D.C. 4 pp.
Wright, R.T. 1964. Dynamics of a phytoplankton community in an ice-covered lake. Limnol. and Oceanogr. 9(2):163-178.
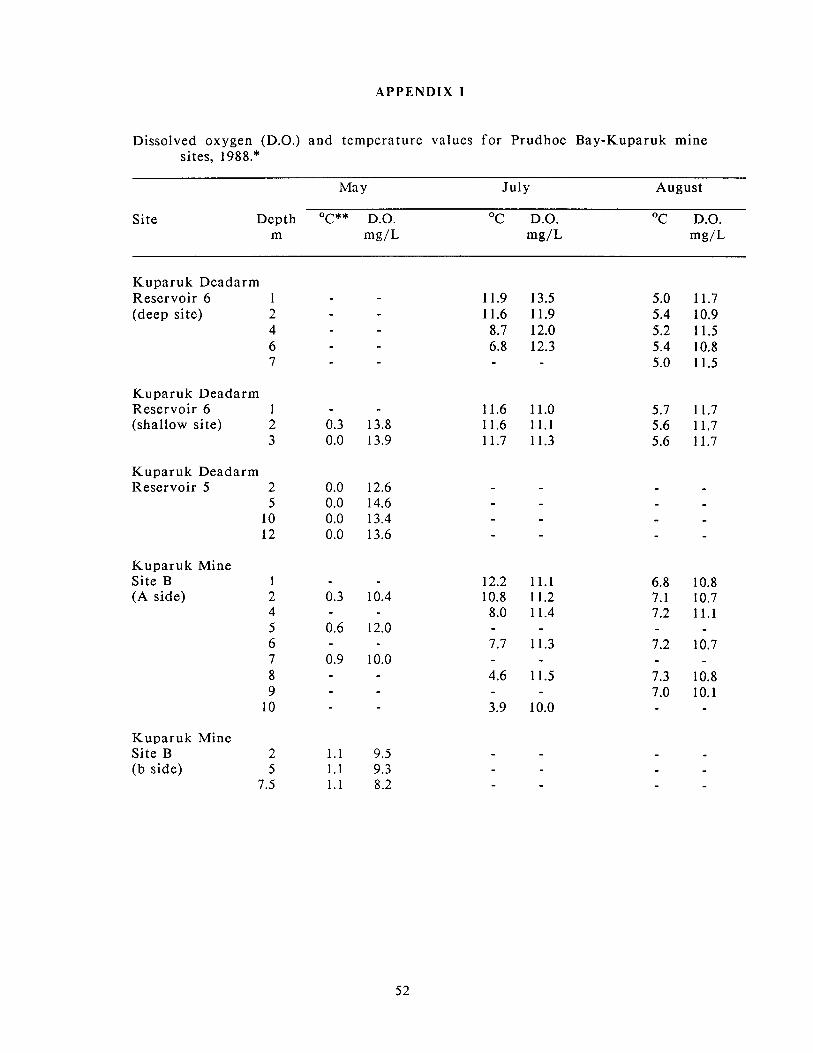
APPENDIX I
Dissolved oxygen (D.O.) and temperature values for Prudhoe Bay-Kuparuk mine sites, 1988.*
Ma Y July August
Site Depth OC** D.O. OC D.O. OC D.O. m mg/L mg/L mg/L
Kuparuk Deadarm Reservoir 6 1 (deep site) 2
4 6 7
Kuparuk Deadarm Reservoir 6 1 (shallow site) 2
3
Kuparuk Deadarm Reservoir 5 2
5 10 12
Kuparuk Mine Site B 1 (A side) 2
4 5 6 7 8 9
10
Kuparuk Mine Site B 2 (b side) 5
7.5
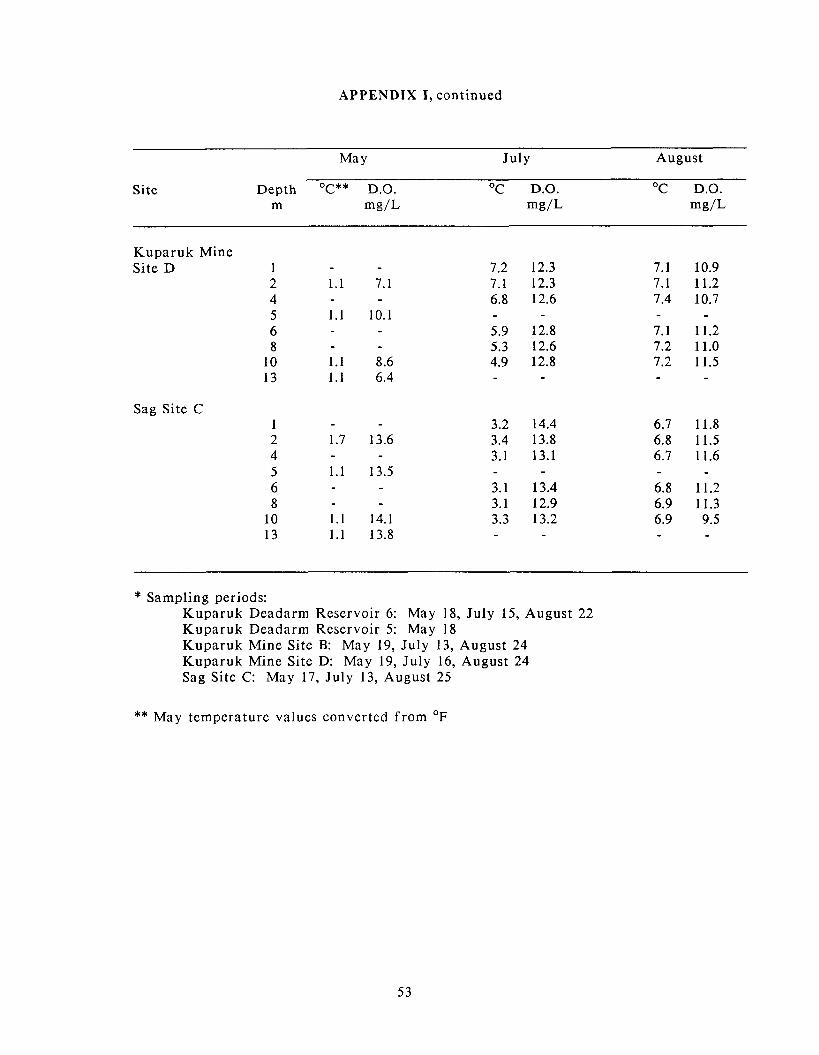
APPENDIX I, continued
Site
Ma Y July August
Depth OC** D.O. OC D.O. OC D.O. m mg/L mg/L mg/L
Kuparuk Mine Site D 1
2 4 5 6 8
10 13
Sag Site C
* Sampling periods: Kuparuk Deadarm Reservoir 6: May 18, July 15, August 22 Kuparuk Deadarm Reservoir 5: May 18 Kuparuk Mine Site B: May 19, July 13, August 24 Kuparuk Mine Site D: May 19, July 16, August 24 Sag Site C: May 17, July 13, August 25
** May temperature values converted f rom OF
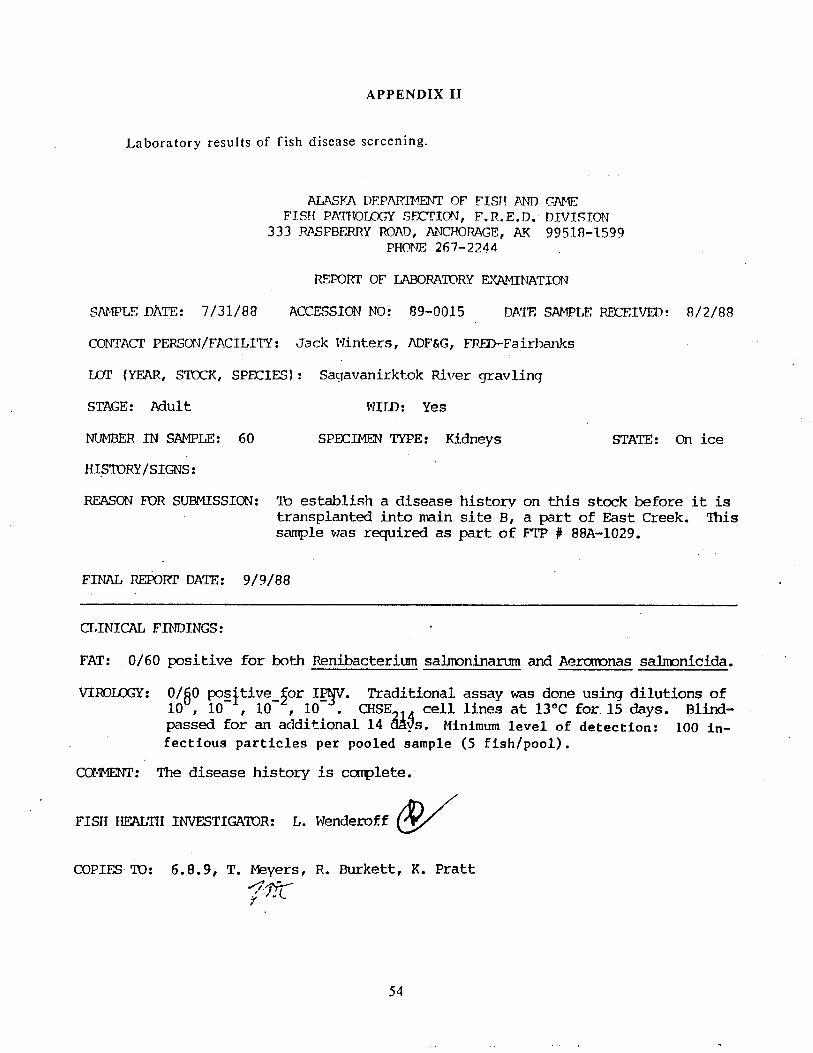
APPENDIX I1
Laboratory results of f i sh disease screening.
ALASKA DEPARTFENT OF FISH ANn CAME FIS!I PATHOLCGY S.WION, F. R.E. D. DIVISION
333 WSFBERRY ROAD, ANCHORAGE, AY 99518-1599 PFlObE 267-2244
S A M P ~ D ~ T E : 7/31/88 ACCESSIONNO: 89-0015 DATE SAMPTIE RElZEDm: 8/2/88
CONTACT PERSON/FE?CILITY: Jack Winters, ADF&G, FRED-Fairbanks
LMT (YEAR, STOCK, SPECIES) : Sayavanirktok River gravlinq
STAGE: Adult FTILD: Yes
MJMBER I N SAMPLE: 60 SPEXIM?3N TYPE: Kidneys STATE: On ice
REASON FOR SUBMISSION: 'Ib establish a disease history on this stock before it is transplanted into main site BI a part of East Creek. This sample was required as part of FTP #! 88A-1029.
FINAL REPORT DATE: 9/9/88
a m r m F~NDINGS:
FAT: 0/60 positive for both Renibacterium salmoninarum and A e m n a s salmnicida.
V I R O W : O / B O posftive ior IPIJV. - Traditional assay was done using dilutions of 10 , 10- , 10- , 10 . CHSE cell lines at 13OC for 15 days. Blind- passed for an additional 14 @S. M i n i m e l of c i e i o n : 100 in- f ec t ious p a r t i c l e s per pooled sample (5 f i sh /poo l ) .
C m : The disease history is complete.
FISH HEALTH INVESTIGATDR: L. Wenderoff v COPIFS 'ID: 6.8 .9 , T. Meyers, R. Burkett, K. Pratt
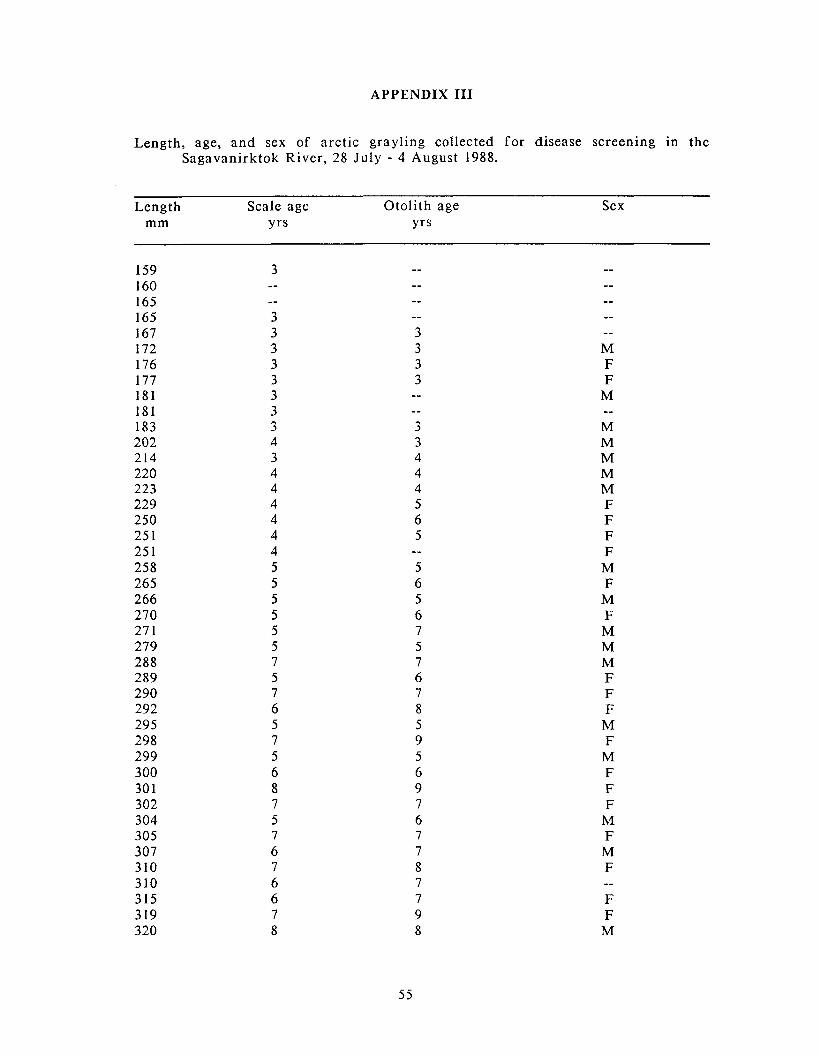
APPENDIX I11
Length, age, and sex of arctic grayling collected for disease screening in the Sagavanirktok River, 28 July - 4 August 1988.
Length Scale age Otolith age Sex mm Yrs Yrs
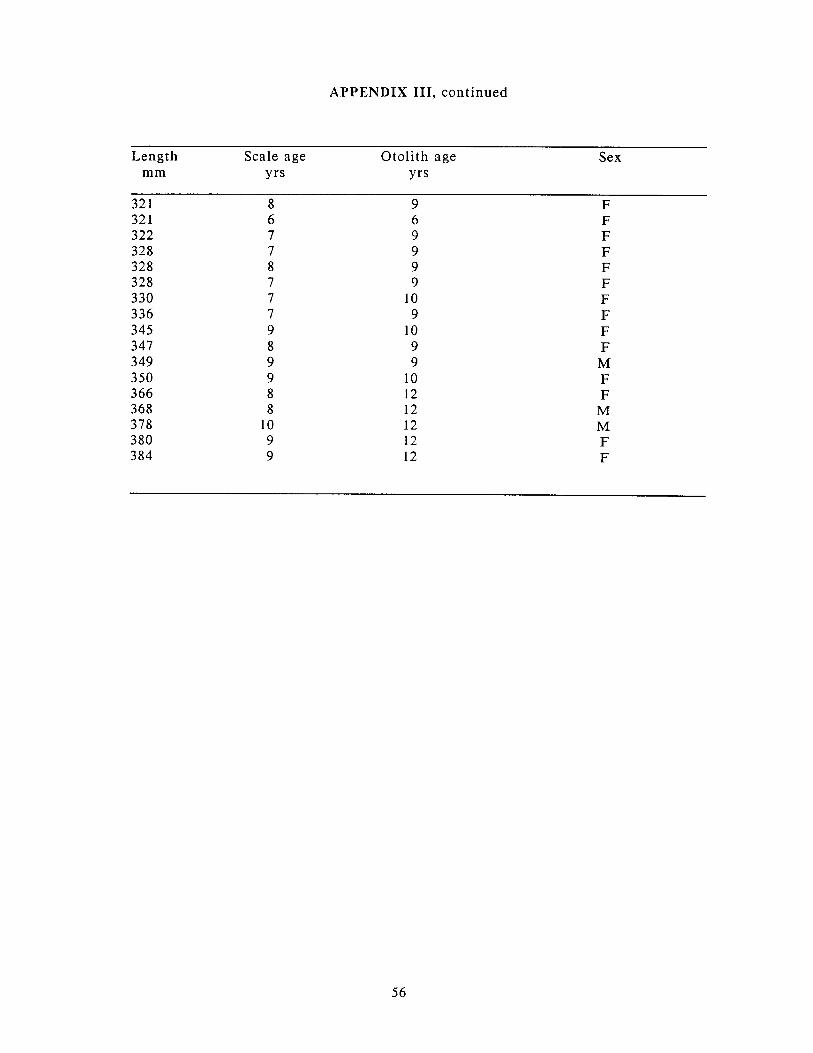
APPENDIX 111, continued
Length Scale age Otolith age Sex mm Yrs Yrs
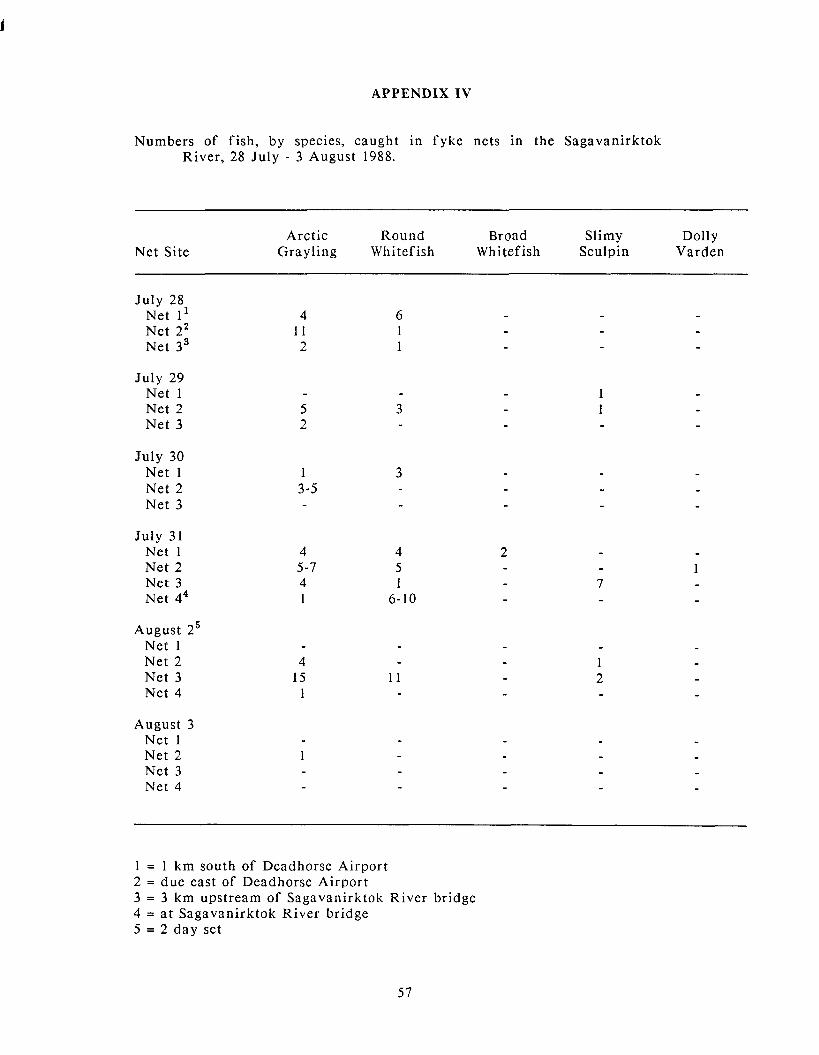
APPENDIX IV
Numbers of fish, by species, caught in fyke nets in the Sagavanirktok River, 28 July - 3 August 1988.
Arctic Round Broad Slimy Dolly Net Site Grayling Whitefish Whitefish Sculpin Varden
July 28 Net 1' Net 2' Net 33
July 29 Net 1 Net 2 Net 3
July 30 Net 1 Net 2 Net 3
July 31 Net 1 Net 2 Net 3 Net 44
A U ~ U S ~ 25 Net 1 Net 2 Net 3 Net 4
August 3 Net 1 Net 2 Net 3 Net 4
1 = 1 km south of Deadhorse Airport 2 = d u e east of Deadhorse Airport 3 = 3 km upstream of Sagavanirktok River bridge 4 = a t Sagavanirktok River bridge 5 = 2 day set
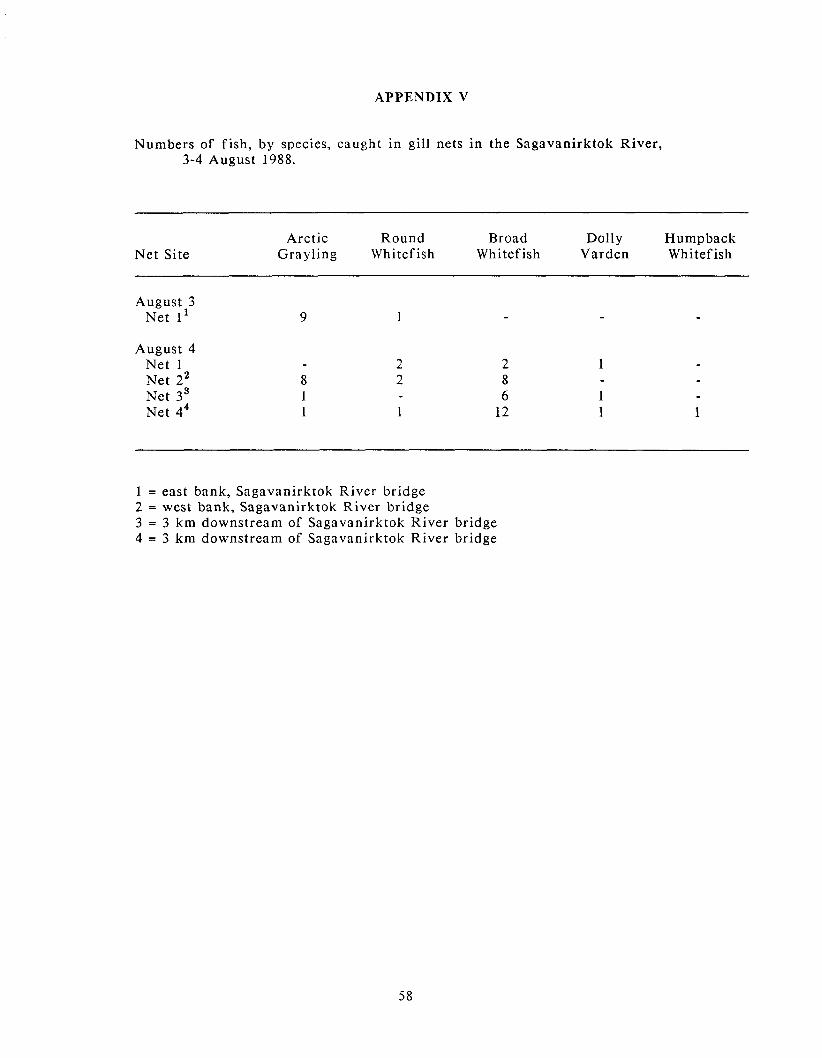
APPENDIX V
Numbers of fish, by species, caught in gill nets in the Sagavanirktok River, 3-4 August 1988.
Net Site Arctic Round Broad Dolly Humpback
Grayling Whitefish Whitefish Varden Whitefish
August 3 Net 1'
August 4 Net 1 Net 22 Net 33 Net 44
1 = east bank, Sagavanirktok River bridge 2 = west bank, Sagavanirktok Rivcr bridge 3 = 3 km downstream of Sagavanirktok River bridge 4 = 3 km downstream of Sagavanirktok River bridge
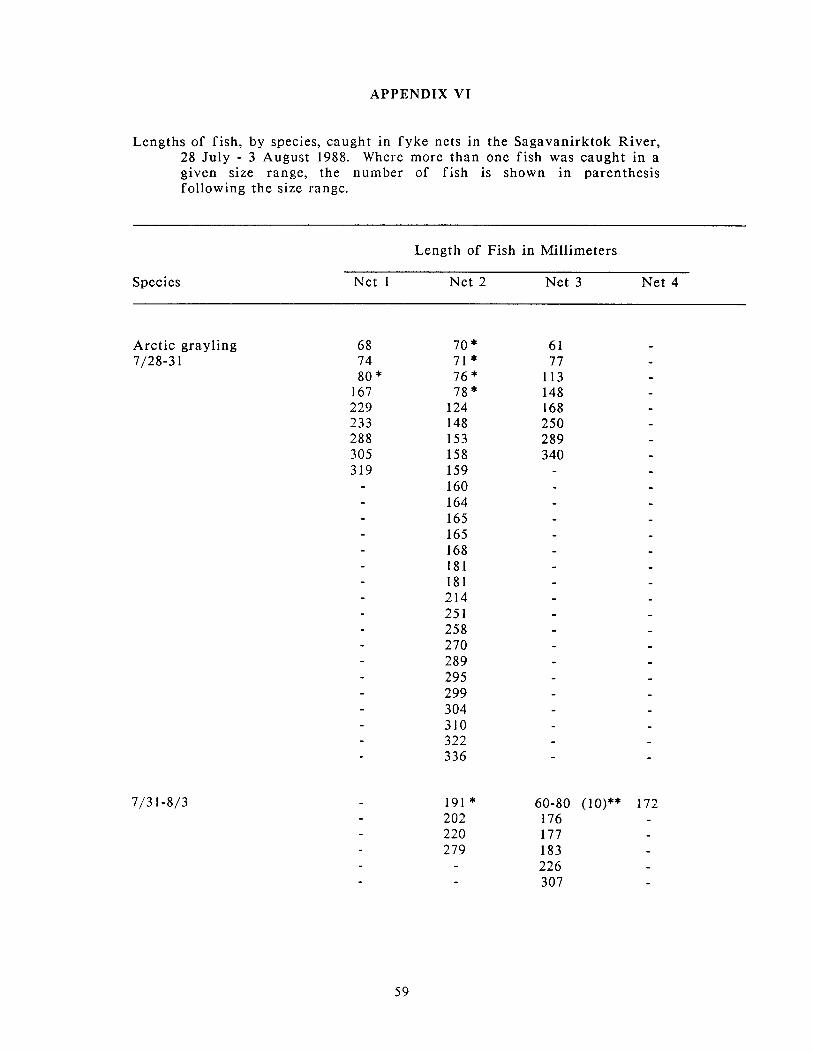
APPENDIX VI
Lengths of fish, by species, caught in fyke nets in the Sagavanirktok River, 28 July - 3 August 1988. Where more than one f i sh was caught in a given size range, the number of f ish is shown in parenthesis following the size range.
Species
Length of Fish in Millimeters
Net 1 Net 2 Net 3 Net 4
Arctic grayling 7/28-3 1
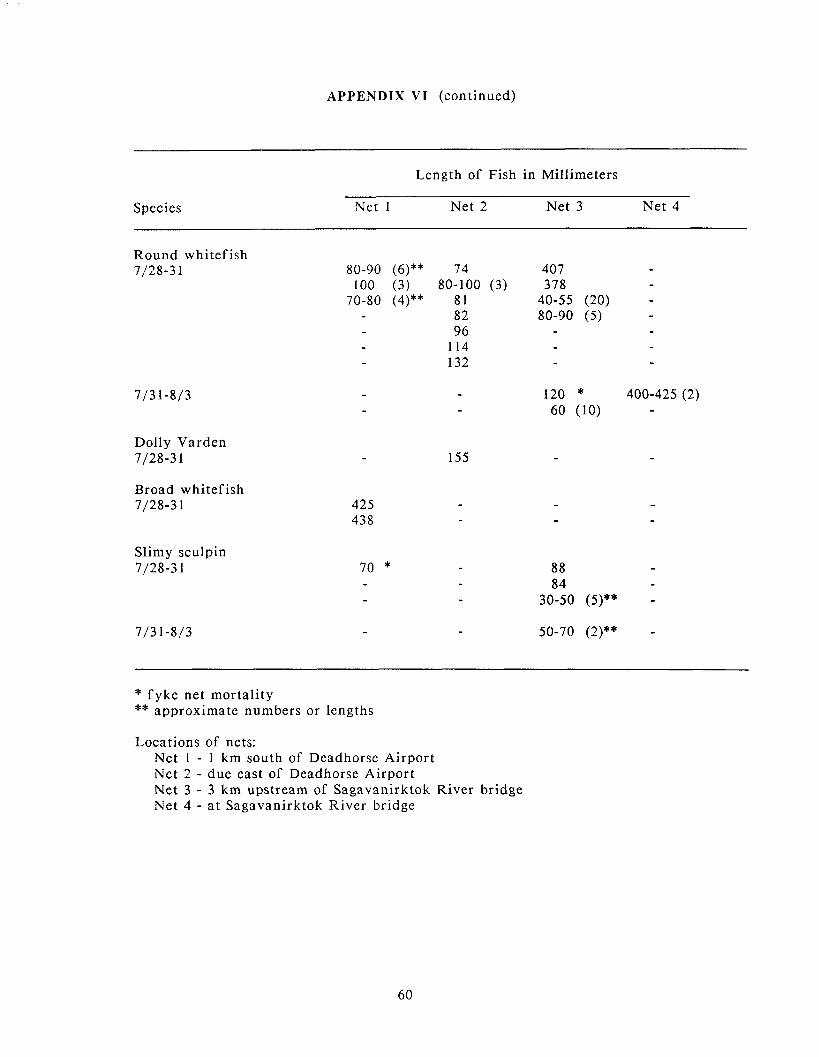
APPENDIX V I (continued)
Length of Fish in Millimeters
Species Net 1 Net 2 Net 3 Net 4
Round whitefish 7128-3 1
Dolly Varden 7128-3 1
Broad whitefish 7/28-31
Slimy sculpin 7/28-31
* fyke net mortality ** approximate numbers or lengths
Locations of nets: Net 1 - 1 km south of Deadhorse Airport Net 2 - due east of Dcadhorse Airport Net 3 - 3 km upstream of Sagavanirktok River bridge Net 4 - at Sagavanirktok River bridge