lightweight virtualization as enabling technology for ... virtualization as... · lightweight...
TRANSCRIPT
HAL Id: hal-01482721https://hal.inria.fr/hal-01482721
Submitted on 18 May 2017
HAL is a multi-disciplinary open accessarchive for the deposit and dissemination of sci-entific research documents, whether they are pub-lished or not. The documents may come fromteaching and research institutions in France orabroad, or from public or private research centers.
L’archive ouverte pluridisciplinaire HAL, estdestinée au dépôt et à la diffusion de documentsscientifiques de niveau recherche, publiés ou non,émanant des établissements d’enseignement et derecherche français ou étrangers, des laboratoirespublics ou privés.
Lightweight Virtualization as Enabling Technology forFuture Smart Cars
Roberto Morabito, Riccardo Petrolo, Valeria Loscri, Nathalie Mitton,Giuseppe Ruggeri, Antonella Molinaro
To cite this version:Roberto Morabito, Riccardo Petrolo, Valeria Loscri, Nathalie Mitton, Giuseppe Ruggeri, et al..Lightweight Virtualization as Enabling Technology for Future Smart Cars. International Symposiumon Integrated Network Management (IM), May 2017, Lisbonne, Portugal. �hal-01482721�
Lightweight Virtualization as Enabling Technologyfor Future Smart Cars
Roberto Morabito†, Riccardo Petrolo§, Valeria Loscrı∗, Nathalie Mitton∗, Giuseppe Ruggeri‡, and Antonella Molinaro‡†Ericsson Research, Jorvas, Finland§Rice University, Texas, USA
∗Inria Lille - Nord Europe, France‡DIIES, University Mediterranea of Reggio Calabria, Italy
Abstract—Modern vehicles are equipped with several in-terconnected sensors on board for monitoring and diagnosispurposes; their availability is a main driver for the developmentof novel applications in the smart vehicle domain. In thispaper, we propose a Docker container-based platform as solutionfor implementing customized smart car applications. Througha proof-of-concept prototype—developed on a Raspberry Pi3board—we show that a container-based virtualization approach isnot only viable but also effective and flexible in the managementof several parallel processes running on On Board Unit. Morespecifically, the platform can take priority-based decisions byhandling multiple inputs, e.g., data from the CANbus based onthe OBD II codes, video from the on-board webcam, and so on.Results are promising for the development of future in-vehiclevirtualized platforms.
Keywords—Internet of Things, Smart Vehicles, Internet ofVehicles, Virtualization Technologies, Container.
I. INTRODUCTION
Nowadays, modern vehicles are equipped with very sophis-ticated electronic systems and associated in-vehicle communi-cation infrastructures, aimed to provide different functionalitieswhich vary from engine control, predictive diagnostics, driv-ing assistance, and infotainment. Implementing new functionsrequires more and more computing and communication re-sources to be installed on board. As an example, the increasingdemand of safety boosted the trend to equip vehicles withsingle and multiple cameras that transfer recorded videoson the vehicle bus, to be processed by the On Board Unit(OBU) [1]. Furthermore, the recent development of SocialVehicular Networks [2] is another driver for the increase in theamount of generated data. By envisaging innovative real-timeapplications in next generation vehicles, we realize the greatimpact that an efficient and effective use of the bandwidth canplay for the always-increasing bandwidth demanding applica-tions.
The expectation for the near future is the above describedtrend to grow, fueled by the recent sales boom in the automo-tive market that has also revamped research funding on thistopic [3]. In spite of such favorable perspectives, there are stillmany open issues and challenges to be addressed. Nowadays,OBUs are embedded systems with limited resources and hardlymodifiable. Software updating of an OBU requires a longand cumbersome procedure to be carried out in a properlyequipped workshop. This hardness combined with the typicalsoftware lifetime, which is much shorter than the lifetime of
mechanical components, may result in a rapid obsolescenceof modern vehicles. It is therefore crucial to devise a suitablemechanism to make OBU programming (and re-programming)easier. Also, the limited resources of current OBUs may bethe cause of long latency in carrying out time-critical tasks.A clever way to manage resources and allocate them to morecritical tasks is necessary. In this context—which is continuallyevolving—an efficient OBU design has to meet a number ofrequirements that makes the OBU updating process easier,enable the deployment of new software, and efficiently manageparallel processes with real-time constraints.
In this work, we investigate the potentialities of lightweightvirtualization as enabling technology for the fulfillment ofthe aforementioned requirements. Docker1 is an open-sourcecontainer-based virtualization technique, easy to use and de-ploy, which represents a mandatory feature for applicationsdevelopment in modern smart vehicles. This feature alsobrings high flexibility, allowing flexible “activation” and “de-activation” of processes with a minimal impact in terms ofoverhead.
To achieve our objectives we follow a pragmatic approachand address two main points. First, we design a feasiblearchitecture for a virtualized OBU and we illustrate how com-mon vehicular applications can be implemented on it, whileoutlining the guidelines to extend our approach to a genericimplementation. Second, we evaluate the achievable perfor-mance to assess if virtualization has caused some detrimentaleffect and to which extent this natural decay in performanceremains within tolerable margins.
The main contributions of this paper can be summarizedas follows:
• we propose the use of Docker containers in orderto customize a smart car platform [4] and make itcompliant with different end user requirements;
• we show how efficiently using containers to instantiateand schedule dedicated applications according to thevehicle status and/or on-demand services;
• by means of an empirical evaluation, we demonstratethat the proposed lightweight virtualization techniquedeveloped on top of devices with limited computa-tional capability—such as a Raspberry Pi3—has an
1http://www.docker.com/
almost negligible adverse impact in terms of perfor-mance, also under heavy and heterogeneous workloadconditions, and it allows the end user to dynamicallyadd/eliminate running processes according to his/herneeds.
To the best of our knowledge, this is the very first contri-bution that shows the real implementation of a container-basedvirtualization technique in the context of smart cars.
The rest of the paper is organized as follows. In Section II,we overview the main contributions related to our work andhighlight the rationale behind our proposal. In Section III, wedescribe the architecture of the proposed container-based plat-form. Section IV describes the performance of our platform.Finally, Section V concludes the paper by also identifyingpotential extensions of our architecture to other interestingscenarios.
II. RELATED WORK AND MOTIVATIONS
Docker open-source “containerization” is gaining consen-sus in several research and industrial domains as a lightweightvirtualization technique alternative to more traditional VirtualMachine (VM) based approaches. In [5], the Docker perfor-mance is shown and interesting recommendations are givenon the use of different disk-intensive workloads on container-based clouds. In [6], the authors draw similar conclusionsclaiming that both VMs and containers are mature technolo-gies and introduce negligible overhead for memory and CPUperformances, with Docker generally achieving equal or betterperformance than Kernel VMs [7]. Analogous conclusionscan be found in [8] and [9], where traditional hypervisorsand container-based solutions are compared. Since VMs sharethe hardware resources while containers share the operatingsystem, this makes solutions like Docker easier to use andfaster to deploy. These features make Docker a suitable“containerization” solution for the creation of an embeddedversatile device able to manage smart car applications.
Container-based virtualization has been recently consideredin the vehicular domain. In [10], a container-based approachis considered for self-driving vehicle applications with hardsafety and timing requirements. Of course, given the real-time constraints of this application domain, any additionaloverhead could affect the system performance and introducemore latency, that could result in software malfunctioning. Adifferent perspective has been considered in [11], where theauthors present a network simulation method in the vehicularcontext. Their platform, exploiting both simulated and realnetwork data traffics with the use of lightweight containers,has been tested by considering two Ethernet topology—DoubleStart and Daisy Chain—in order to conclude that also in thecase of high workloads (i.e., 6 in-vehicle cameras broadcastingsimultaneously, along with control infotainment and othertypes of traffic) the delay requirements for safety-critical videoinformation may be violated.
Our approach differs from the previous ones under severalaspects. We design and implement an embedded all-in-oneCyber-Physical-Device for smart car applications and con-tribute with a real prototype based on a Raspberry Pi 3 thatis connected with the On Board Diagnostic (OBD) system ofa car. We show how we can make it coexisting with other
processes that span from infotainment applications to videodata delivery (e.g., from a webcam mounted on top of ourdevice), etc. To the best of our knowledge, this is the firstreal implementation of a Docker container-based prototypefor vehicular applications. The interest behind this type ofimplementation is demonstrated by projects like Carberry2,where a Raspberry Pi includes CAN bus, Gmlan, IR Led input,etc. The main and important difference of our approach withregard to these projects consists in the exploitation of Docker-based virtualization that, as we will show, gives very highflexibility to the final system that can be easily expanded withnovel processes and enriched with new features.
III. SYSTEM DESIGN AND IMPLEMENTATION
In this section, we first introduce the technologies usedin the implementation of our prototype. Then, the entire plat-form architecture will be described in detail. Finally, throughthe analysis of different examples, we show how the mainbenefits introduced by container technologies can boost thedevelopment of a versatile and flexible platform.
A. Enabling Technologies
Raspberry Pi (RPi) is a single-board computer that lever-ages the low-power low-cost ARM processor architecture [12]and became popular thanks to its flexible use in severalcontexts. Raspberry Pi has been already used in in the vehicularcontext in projects like CarBerry and in OBD-Pi3. For thedevelopment of our platform, we selected the last generationof the Raspberry Pi, which is the Raspberry Pi 3 (RPi3)model B3. The main hardware characteristics of the board aresummarized in Table I.
TABLE I. RASPBERRY PI 3 HARDWARE FEATURES.
Parameter DescriptionChipset Broadcom BCM2837
CPU Quad Core @900MHz ARMv7Cortex-A7
Memory 1GB LP-DDR2 900 MHzGPU Broadcom VideoCore IVEthernet 10/100 Mb/sFlash Storage MicroSDConnectivity USB 4 USB 2.0 HostOS Linux, Windows 10Price $35
Data coming directly from the vehicle can be read throughthe OBD-II standard [13] interface that provides two typesof data: real-time vehicle data and several Diagnostic TroubleCodes (DTCs). The entire subset of such data can be efficientlyused in order to monitor the current operating status of avehicle, and to identify malfunctioning in the vehicle itself.
B. Functional Modules
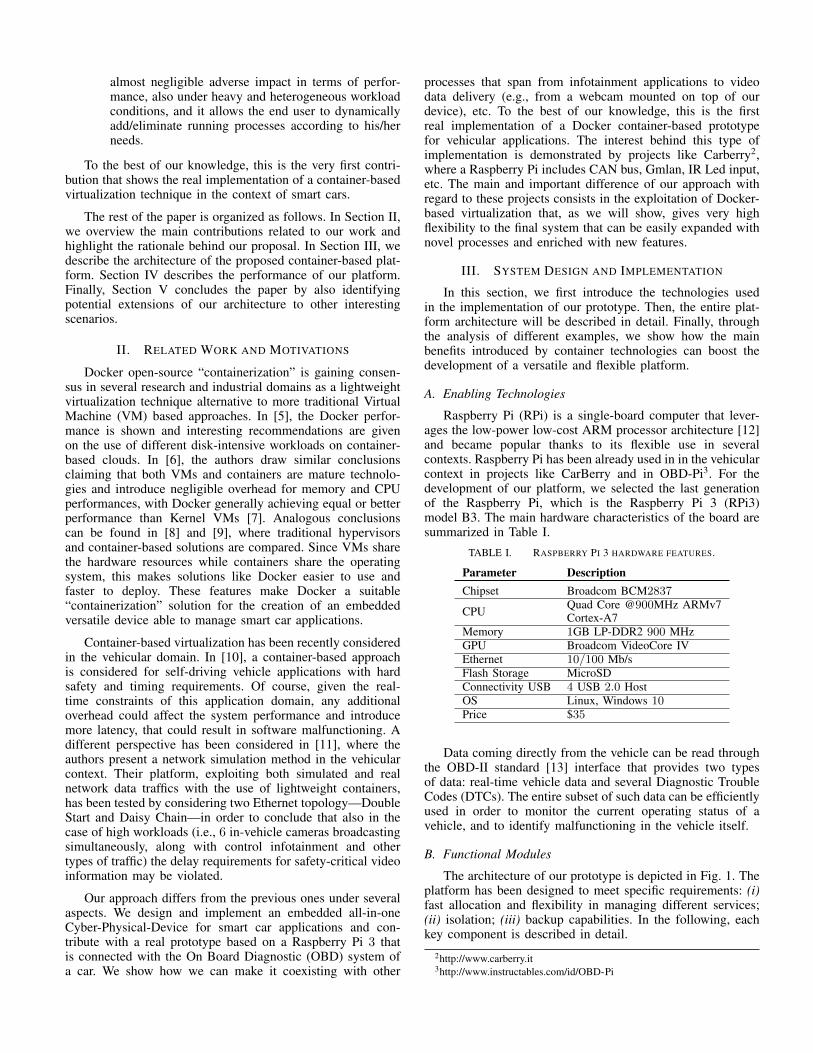
The architecture of our prototype is depicted in Fig. 1. Theplatform has been designed to meet specific requirements: (i)fast allocation and flexibility in managing different services;(ii) isolation; (iii) backup capabilities. In the following, eachkey component is described in detail.
2http://www.carberry.it3http://www.instructables.com/id/OBD-Pi
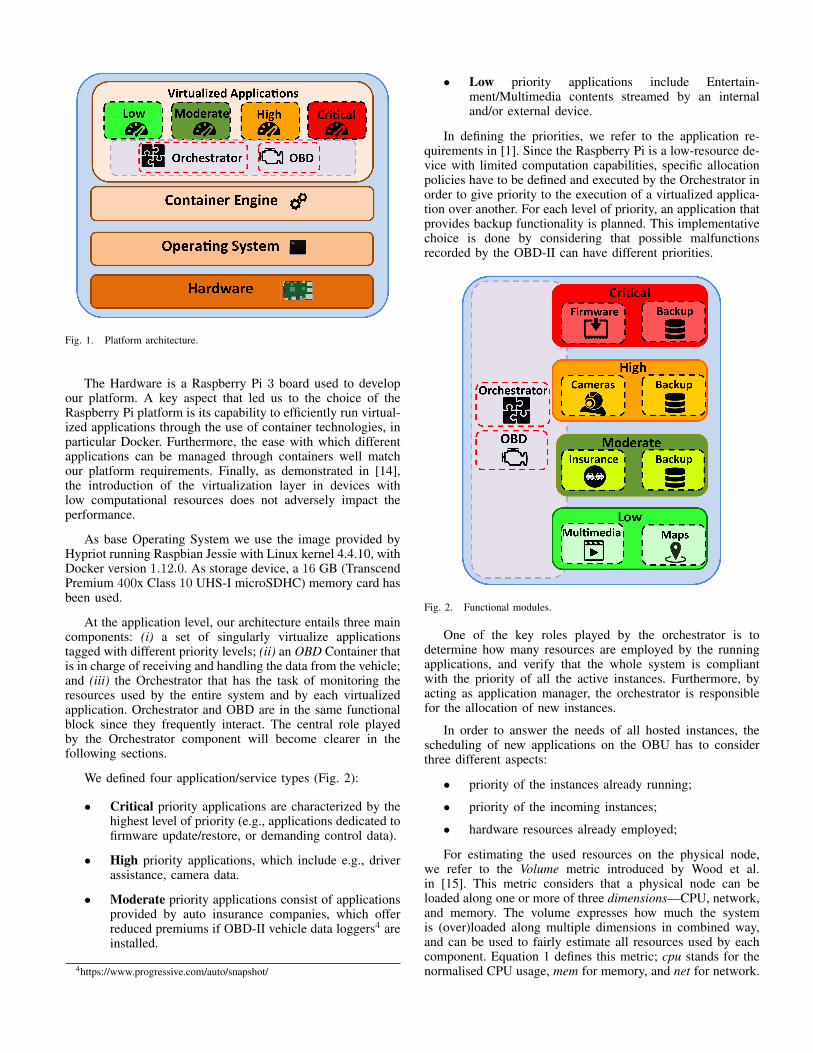
Fig. 1. Platform architecture.
The Hardware is a Raspberry Pi 3 board used to developour platform. A key aspect that led us to the choice of theRaspberry Pi platform is its capability to efficiently run virtual-ized applications through the use of container technologies, inparticular Docker. Furthermore, the ease with which differentapplications can be managed through containers well matchour platform requirements. Finally, as demonstrated in [14],the introduction of the virtualization layer in devices withlow computational resources does not adversely impact theperformance.
As base Operating System we use the image provided byHypriot running Raspbian Jessie with Linux kernel 4.4.10, withDocker version 1.12.0. As storage device, a 16 GB (TranscendPremium 400x Class 10 UHS-I microSDHC) memory card hasbeen used.
At the application level, our architecture entails three maincomponents: (i) a set of singularly virtualize applicationstagged with different priority levels; (ii) an OBD Container thatis in charge of receiving and handling the data from the vehicle;and (iii) the Orchestrator that has the task of monitoring theresources used by the entire system and by each virtualizedapplication. Orchestrator and OBD are in the same functionalblock since they frequently interact. The central role playedby the Orchestrator component will become clearer in thefollowing sections.
We defined four application/service types (Fig. 2):
• Critical priority applications are characterized by thehighest level of priority (e.g., applications dedicated tofirmware update/restore, or demanding control data).
• High priority applications, which include e.g., driverassistance, camera data.
• Moderate priority applications consist of applicationsprovided by auto insurance companies, which offerreduced premiums if OBD-II vehicle data loggers4 areinstalled.
4https://www.progressive.com/auto/snapshot/
• Low priority applications include Entertain-ment/Multimedia contents streamed by an internaland/or external device.
In defining the priorities, we refer to the application re-quirements in [1]. Since the Raspberry Pi is a low-resource de-vice with limited computation capabilities, specific allocationpolicies have to be defined and executed by the Orchestrator inorder to give priority to the execution of a virtualized applica-tion over another. For each level of priority, an application thatprovides backup functionality is planned. This implementativechoice is done by considering that possible malfunctionsrecorded by the OBD-II can have different priorities.
Fig. 2. Functional modules.
One of the key roles played by the orchestrator is todetermine how many resources are employed by the runningapplications, and verify that the whole system is compliantwith the priority of all the active instances. Furthermore, byacting as application manager, the orchestrator is responsiblefor the allocation of new instances.
In order to answer the needs of all hosted instances, thescheduling of new applications on the OBU has to considerthree different aspects:
• priority of the instances already running;
• priority of the incoming instances;
• hardware resources already employed;
For estimating the used resources on the physical node,we refer to the Volume metric introduced by Wood et al.in [15]. This metric considers that a physical node can beloaded along one or more of three dimensions—CPU, network,and memory. The volume expresses how much the systemis (over)loaded along multiple dimensions in combined way,and can be used to fairly estimate all resources used by eachcomponent. Equation 1 defines this metric; cpu stands for thenormalised CPU usage, mem for memory, and net for network.
The higher the utilization of a resource, the greater the volume.As a consequence, if multiple resources are heavily utilized,the above product results in a correspondingly higher volume.
V ol =1
1− cpu× 1
1−mem× 1
1− net(1)
Moreover, the Docker remote API allows us to quantify theinstant use of the three dimensions for each running container.Therefore, we are able to quantify the Volume generated byeach individual container (Eq. 2).
V olcontn =1
1− cpucontn
× 1
1−memcontn
×
× 1
1− netcontn
(2)
The overall Volume can be furthermore characterized byEquation. 3. Resources employed by each virtualized applica-tion are quantified, with the addition of the volume due to thebasic processes.
V ol =
n∑i=1
V olconti + V olbase (3)
Once outlined how to estimate the resources employed bythe whole system and by each virtual component, hereafter isdescribed how a new application is allocated in the system.
The orchestrator keeps memory of all the running appli-cations and their associated priority. As soon as the requestfor a new instance allocation arrives, the orchestrator hasto consider the priority associated to the incoming request,together with available resources on the physical node. If theavailable volume is greater than a certain threshold—which canbe set according to the number of applications that are expectedto be handled in total by the device—the new application isinstantiated on top of the device. Otherwise, the discriminatingfactor for the instantiation of the new application is given byits own priority. Indeed, if the priority of the incoming requestis set to critical, the orchestrator acts so as to guarantee thenecessary resources for the execution of the application. Ifthere are no available resources and the priority is not critical,the application request is entirely rejected. In the next sub-section, the dynamic service allocation is further explained.
C. Application Scenarios
The Orchestrator dynamically allocates applica-tions/services in the platform. This feature brings severalbenefits in terms of resource usage. Indeed, the containerinstances can be instantiated only when required or whenspecific events like a car operating anomaly occur.
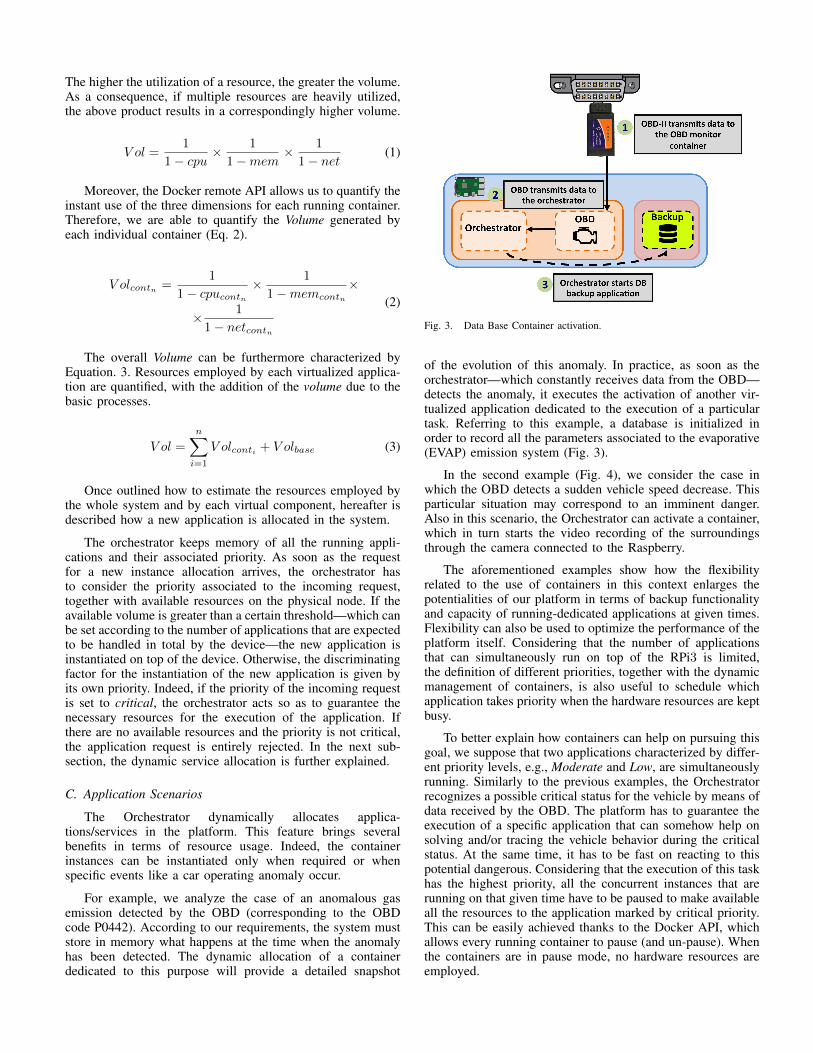
For example, we analyze the case of an anomalous gasemission detected by the OBD (corresponding to the OBDcode P0442). According to our requirements, the system muststore in memory what happens at the time when the anomalyhas been detected. The dynamic allocation of a containerdedicated to this purpose will provide a detailed snapshot
Fig. 3. Data Base Container activation.
of the evolution of this anomaly. In practice, as soon as theorchestrator—which constantly receives data from the OBD—detects the anomaly, it executes the activation of another vir-tualized application dedicated to the execution of a particulartask. Referring to this example, a database is initialized inorder to record all the parameters associated to the evaporative(EVAP) emission system (Fig. 3).
In the second example (Fig. 4), we consider the case inwhich the OBD detects a sudden vehicle speed decrease. Thisparticular situation may correspond to an imminent danger.Also in this scenario, the Orchestrator can activate a container,which in turn starts the video recording of the surroundingsthrough the camera connected to the Raspberry.
The aforementioned examples show how the flexibilityrelated to the use of containers in this context enlarges thepotentialities of our platform in terms of backup functionalityand capacity of running-dedicated applications at given times.Flexibility can also be used to optimize the performance of theplatform itself. Considering that the number of applicationsthat can simultaneously run on top of the RPi3 is limited,the definition of different priorities, together with the dynamicmanagement of containers, is also useful to schedule whichapplication takes priority when the hardware resources are keptbusy.
To better explain how containers can help on pursuing thisgoal, we suppose that two applications characterized by differ-ent priority levels, e.g., Moderate and Low, are simultaneouslyrunning. Similarly to the previous examples, the Orchestratorrecognizes a possible critical status for the vehicle by means ofdata received by the OBD. The platform has to guarantee theexecution of a specific application that can somehow help onsolving and/or tracing the vehicle behavior during the criticalstatus. At the same time, it has to be fast on reacting to thispotential dangerous. Considering that the execution of this taskhas the highest priority, all the concurrent instances that arerunning on that given time have to be paused to make availableall the resources to the application marked by critical priority.This can be easily achieved thanks to the Docker API, whichallows every running container to pause (and un-pause). Whenthe containers are in pause mode, no hardware resources areemployed.
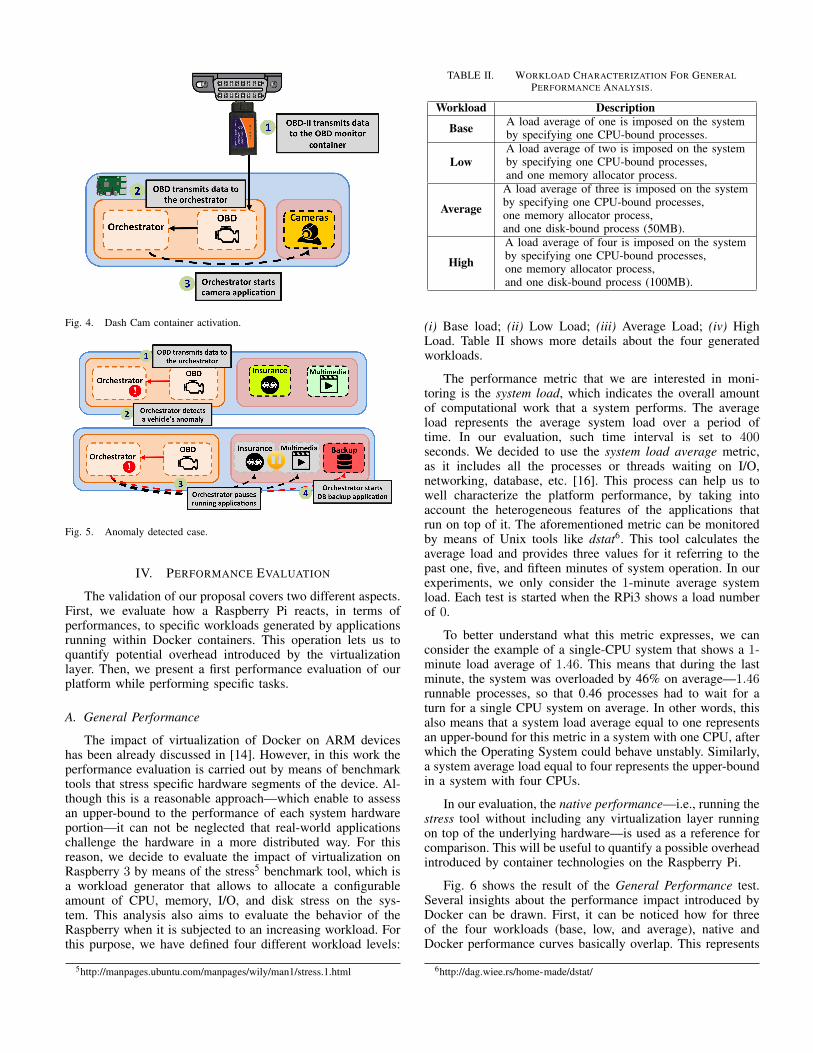
Fig. 4. Dash Cam container activation.
Fig. 5. Anomaly detected case.
IV. PERFORMANCE EVALUATION
The validation of our proposal covers two different aspects.First, we evaluate how a Raspberry Pi reacts, in terms ofperformances, to specific workloads generated by applicationsrunning within Docker containers. This operation lets us toquantify potential overhead introduced by the virtualizationlayer. Then, we present a first performance evaluation of ourplatform while performing specific tasks.
A. General Performance
The impact of virtualization of Docker on ARM deviceshas been already discussed in [14]. However, in this work theperformance evaluation is carried out by means of benchmarktools that stress specific hardware segments of the device. Al-though this is a reasonable approach—which enable to assessan upper-bound to the performance of each system hardwareportion—it can not be neglected that real-world applicationschallenge the hardware in a more distributed way. For thisreason, we decide to evaluate the impact of virtualization onRaspberry 3 by means of the stress5 benchmark tool, which isa workload generator that allows to allocate a configurableamount of CPU, memory, I/O, and disk stress on the sys-tem. This analysis also aims to evaluate the behavior of theRaspberry when it is subjected to an increasing workload. Forthis purpose, we have defined four different workload levels:
5http://manpages.ubuntu.com/manpages/wily/man1/stress.1.html
TABLE II. WORKLOAD CHARACTERIZATION FOR GENERALPERFORMANCE ANALYSIS.
Workload Description
Base A load average of one is imposed on the systemby specifying one CPU-bound processes.
LowA load average of two is imposed on the systemby specifying one CPU-bound processes,and one memory allocator process.
Average
A load average of three is imposed on the systemby specifying one CPU-bound processes,one memory allocator process,and one disk-bound process (50MB).
High
A load average of four is imposed on the systemby specifying one CPU-bound processes,one memory allocator process,and one disk-bound process (100MB).
(i) Base load; (ii) Low Load; (iii) Average Load; (iv) HighLoad. Table II shows more details about the four generatedworkloads.
The performance metric that we are interested in moni-toring is the system load, which indicates the overall amountof computational work that a system performs. The averageload represents the average system load over a period oftime. In our evaluation, such time interval is set to 400seconds. We decided to use the system load average metric,as it includes all the processes or threads waiting on I/O,networking, database, etc. [16]. This process can help us towell characterize the platform performance, by taking intoaccount the heterogeneous features of the applications thatrun on top of it. The aforementioned metric can be monitoredby means of Unix tools like dstat6. This tool calculates theaverage load and provides three values for it referring to thepast one, five, and fifteen minutes of system operation. In ourexperiments, we only consider the 1-minute average systemload. Each test is started when the RPi3 shows a load numberof 0.
To better understand what this metric expresses, we canconsider the example of a single-CPU system that shows a 1-minute load average of 1.46. This means that during the lastminute, the system was overloaded by 46% on average—1.46runnable processes, so that 0.46 processes had to wait for aturn for a single CPU system on average. In other words, thisalso means that a system load average equal to one representsan upper-bound for this metric in a system with one CPU, afterwhich the Operating System could behave unstably. Similarly,a system average load equal to four represents the upper-boundin a system with four CPUs.
In our evaluation, the native performance—i.e., running thestress tool without including any virtualization layer runningon top of the underlying hardware—is used as a reference forcomparison. This will be useful to quantify a possible overheadintroduced by container technologies on the Raspberry Pi.
Fig. 6 shows the result of the General Performance test.Several insights about the performance impact introduced byDocker can be drawn. First, it can be noticed how for threeof the four workloads (base, low, and average), native andDocker performance curves basically overlap. This represents
6http://dag.wiee.rs/home-made/dstat/

0
1
2
3
4
5
0 50 100 150 200 250 300 350 400
Sys
tem
Loa
d (1
-min
)
Time (Seconds)
Base Native Base Docker Low Native Low Docker Medium Native Medium Docker High Native High Docker
Fig. 6. General performance.
an important outcome since it confirms the lightweight char-acteristics of container technologies, even when the RPi3 hasto handle mixed workload.
The only case in which a tangible overhead between nativeand Docker performance can be observed is when a Highworkload is assigned to the Raspberry. By analyzing the Highworkload curve, we can notice that Docker reaches earlierthe system load upper-bound. The performance difference, be-tween native and Docker performance, can be quantified in theorder of the 15%. We can also observe the unstable behaviorof the system -both for the native and virtualized cases- whenthe upper-bound is exceeded. As previously explained, thisbehavior is attributable to the system overloading. However,it is worthy clarify that the High workload has been definedin such a way to heavily challenge the system. Indeed, whenmemory and disk-bound processes are imposed to the system,the CPU has extra tasks to be executed.
Furthermore, in the next subsection it can be observed howin correspondence of complex workloads, the system load doesnot reach the value for which there is a not negligible perfor-mance overhead between native and virtualized applications.
B. Platform Performance
After showing the efficiency of the RPi3 in handling mixedworkload running within Docker containers, we want to test theperformance of our platform when it has to manage dedicatedvirtualized applications. To this end, we have defined a set ofworkloads that are closely related to the application scenariosdescribed in Section III-C. A detailed explanation of fiveworkloads is provided in Table III. It can be observed howthose scenarios are characterized to deliver increasing load tothe system. To accomplish this evaluation, we assume that thefunctional block OBD+Orchestrator is receiving data from theOBD-II interface—which is directly connected through serialport at the Raspberry Pi—every 10 ms.
Fig. 7 shows the results for the platform performanceevaluation. The main outcome in the platform evaluation liesin the fact that, even when several virtualized instances aresimultaneously running, the average system load is lower thanthe upper bound. The result is the same also for the case of aworkload in which there are five containers running different
TABLE III. WORKLOAD CHARACTERIZATION FOR PLATFORMPERFORMANCE ANALYSIS.
Workload Description
Workload 1
This workload refers to the simplescenario in which the OBD/Orchestratorcontainer receives data from the OBD-IIinterface through the CAN bus, and forward thereceived data to a database in which theOBD logs are stored.
Workload 2
The second workload refers to the casein which the orchestrator has to activateand manage a single virtualized application.The application handles a video content froma camera directly connected to the Raspberry Pi.The video content is encoded in MPEG-4 format,and made available through to HTTP connection.
Workload 3 The third workload is a combinationof Workload 1 and Workload 2.
Workload 4 In the fourth case, we add the streamingof a multimedia content to the Workload 3.
Workload 5
The Workload 5 combines the previous case withthe activation of another container that interactswith the connected web-cam for recording andstoring (on the MicroSD card) the transmittedvideo content.
0
1
2
3
4
5
0 50 100 150 200 250 300 350 400
Syst
em L
oad
(1-m
in)
Seconds
Workload 1 Workload 2 Workload 3 Workload 4 Workload 5
Fig. 7. Platform performance characterization for different workloads.
services/applications, by enforcing the deployment feasibilityof an efficient platform also in terms of scalability.
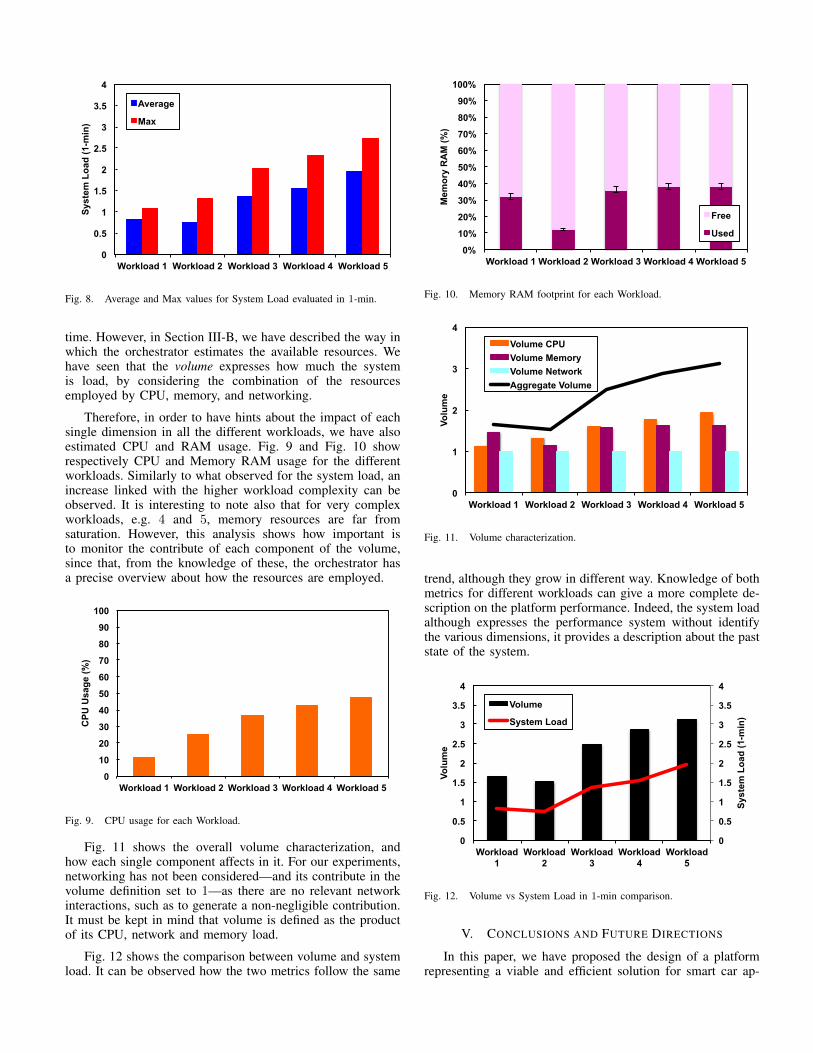
The only tangible difference between the behaviour in-troduced with the different workloads is that, when diskoperation—such as database writing—are included, the systemload average grows introducing a sort of oscillating character-istic. On the contrary, if disk operations are excluded—likein the Workload 2 case—the aforementioned behavior is notobservable. Fig. 8 shows the Average and the Maximum valuesfor the System Load. We can observe that the System Loadincreases with the complexity of the workloads. Taking intoaccount the average value, we are interested on quantify howthe increasing workload complexity affects the system load.As an example, there is an increase of approximately 13%between Workload 3 and Workload 4. The percentage increasebetween Workload 4 and Workload 5 is instead 25%.
As explained above, the system load is a metric that takesinto account also the average of the system in a given period of
0
0.5
1
1.5
2
2.5
3
3.5
4
Workload 1 Workload 2 Workload 3 Workload 4 Workload 5
Syst
em L
oad
(1-m
in)
Average
Max
Fig. 8. Average and Max values for System Load evaluated in 1-min.
time. However, in Section III-B, we have described the way inwhich the orchestrator estimates the available resources. Wehave seen that the volume expresses how much the systemis load, by considering the combination of the resourcesemployed by CPU, memory, and networking.
Therefore, in order to have hints about the impact of eachsingle dimension in all the different workloads, we have alsoestimated CPU and RAM usage. Fig. 9 and Fig. 10 showrespectively CPU and Memory RAM usage for the differentworkloads. Similarly to what observed for the system load, anincrease linked with the higher workload complexity can beobserved. It is interesting to note also that for very complexworkloads, e.g. 4 and 5, memory resources are far fromsaturation. However, this analysis shows how important isto monitor the contribute of each component of the volume,since that, from the knowledge of these, the orchestrator hasa precise overview about how the resources are employed.
0
10
20
30
40
50
60
70
80
90
100
Workload 1 Workload 2 Workload 3 Workload 4 Workload 5
CPU
Usa
ge (%
)
Fig. 9. CPU usage for each Workload.
Fig. 11 shows the overall volume characterization, andhow each single component affects in it. For our experiments,networking has not been considered—and its contribute in thevolume definition set to 1—as there are no relevant networkinteractions, such as to generate a non-negligible contribution.It must be kept in mind that volume is defined as the productof its CPU, network and memory load.
Fig. 12 shows the comparison between volume and systemload. It can be observed how the two metrics follow the same
0%
10%
20%
30%
40%
50%
60%
70%
80%
90%
100%
Workload 1 Workload 2 Workload 3 Workload 4 Workload 5
Mem
ory
RA
M (%
)
Free
Used
Fig. 10. Memory RAM footprint for each Workload.
0
1
2
3
4
Workload 1 Workload 2 Workload 3 Workload 4 Workload 5
Volu
me
Volume CPU Volume Memory Volume Network Aggregate Volume
Fig. 11. Volume characterization.
trend, although they grow in different way. Knowledge of bothmetrics for different workloads can give a more complete de-scription on the platform performance. Indeed, the system loadalthough expresses the performance system without identifythe various dimensions, it provides a description about the paststate of the system.
0
0.5
1
1.5
2
2.5
3
3.5
4
0
0.5
1
1.5
2
2.5
3
3.5
4
Workload 1
Workload 2
Workload 3
Workload 4
Workload 5
Syst
em L
oad
(1-m
in)
Volu
me
Volume
System Load
Fig. 12. Volume vs System Load in 1-min comparison.
V. CONCLUSIONS AND FUTURE DIRECTIONS
In this paper, we have proposed the design of a platformrepresenting a viable and efficient solution for smart car ap-
plications. In particular, the prototype that we have developedis based on Raspberry Pi3 and implements a container-basedvirtualization solution to manage different parallel processes,including the treatment of information generated by the CAN-bus. The different processes can be opportunistically sched-uled based on specific requirements (e.g., the managementof alert processes). Through a proof-of-concept testbed wehave demonstrated both the feasibility of a smart car designbased on Docker virtualization containers and its effectivenessin terms of responsiveness and reactivity of the system. Thederived system is customized and compliant with the final userrequirements.
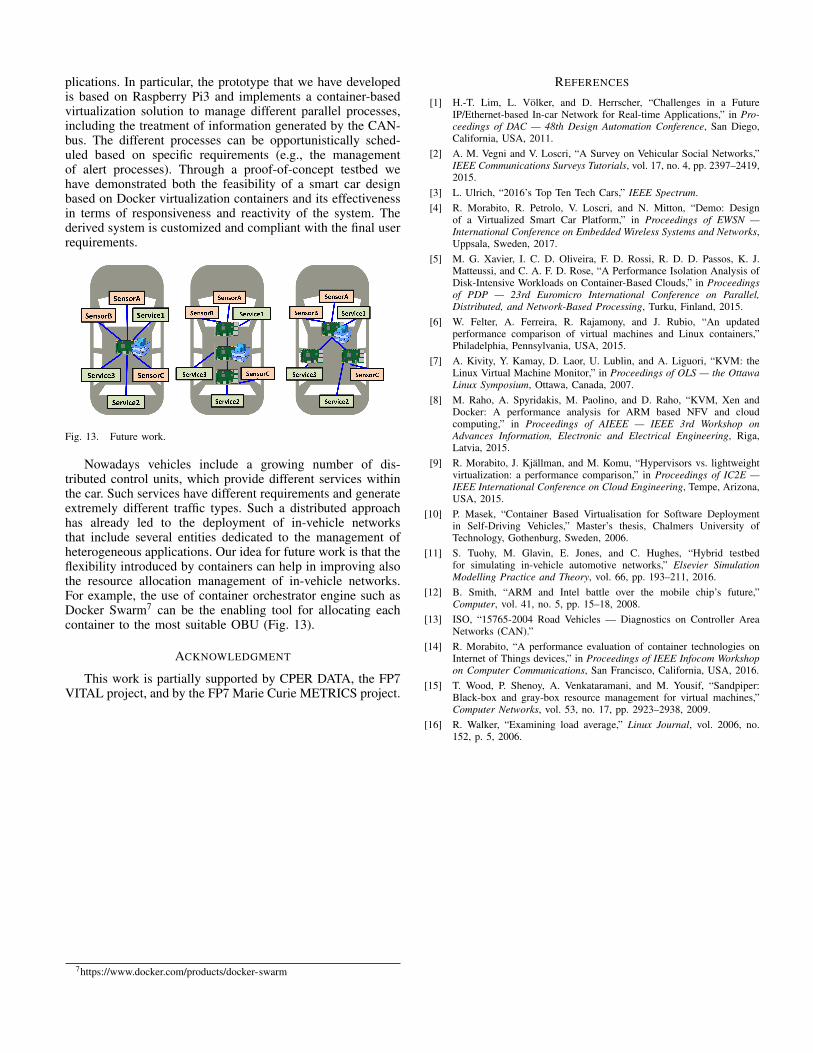
Fig. 13. Future work.
Nowadays vehicles include a growing number of dis-tributed control units, which provide different services withinthe car. Such services have different requirements and generateextremely different traffic types. Such a distributed approachhas already led to the deployment of in-vehicle networksthat include several entities dedicated to the management ofheterogeneous applications. Our idea for future work is that theflexibility introduced by containers can help in improving alsothe resource allocation management of in-vehicle networks.For example, the use of container orchestrator engine such asDocker Swarm7 can be the enabling tool for allocating eachcontainer to the most suitable OBU (Fig. 13).
ACKNOWLEDGMENT
This work is partially supported by CPER DATA, the FP7VITAL project, and by the FP7 Marie Curie METRICS project.
7https://www.docker.com/products/docker-swarm
REFERENCES
[1] H.-T. Lim, L. Volker, and D. Herrscher, “Challenges in a FutureIP/Ethernet-based In-car Network for Real-time Applications,” in Pro-ceedings of DAC — 48th Design Automation Conference, San Diego,California, USA, 2011.
[2] A. M. Vegni and V. Loscri, “A Survey on Vehicular Social Networks,”IEEE Communications Surveys Tutorials, vol. 17, no. 4, pp. 2397–2419,2015.
[3] L. Ulrich, “2016’s Top Ten Tech Cars,” IEEE Spectrum.[4] R. Morabito, R. Petrolo, V. Loscri, and N. Mitton, “Demo: Design
of a Virtualized Smart Car Platform,” in Proceedings of EWSN —International Conference on Embedded Wireless Systems and Networks,Uppsala, Sweden, 2017.
[5] M. G. Xavier, I. C. D. Oliveira, F. D. Rossi, R. D. D. Passos, K. J.Matteussi, and C. A. F. D. Rose, “A Performance Isolation Analysis ofDisk-Intensive Workloads on Container-Based Clouds,” in Proceedingsof PDP — 23rd Euromicro International Conference on Parallel,Distributed, and Network-Based Processing, Turku, Finland, 2015.
[6] W. Felter, A. Ferreira, R. Rajamony, and J. Rubio, “An updatedperformance comparison of virtual machines and Linux containers,”Philadelphia, Pennsylvania, USA, 2015.
[7] A. Kivity, Y. Kamay, D. Laor, U. Lublin, and A. Liguori, “KVM: theLinux Virtual Machine Monitor,” in Proceedings of OLS — the OttawaLinux Symposium, Ottawa, Canada, 2007.
[8] M. Raho, A. Spyridakis, M. Paolino, and D. Raho, “KVM, Xen andDocker: A performance analysis for ARM based NFV and cloudcomputing,” in Proceedings of AIEEE — IEEE 3rd Workshop onAdvances Information, Electronic and Electrical Engineering, Riga,Latvia, 2015.
[9] R. Morabito, J. Kjallman, and M. Komu, “Hypervisors vs. lightweightvirtualization: a performance comparison,” in Proceedings of IC2E —IEEE International Conference on Cloud Engineering, Tempe, Arizona,USA, 2015.
[10] P. Masek, “Container Based Virtualisation for Software Deploymentin Self-Driving Vehicles,” Master’s thesis, Chalmers University ofTechnology, Gothenburg, Sweden, 2006.
[11] S. Tuohy, M. Glavin, E. Jones, and C. Hughes, “Hybrid testbedfor simulating in-vehicle automotive networks,” Elsevier SimulationModelling Practice and Theory, vol. 66, pp. 193–211, 2016.
[12] B. Smith, “ARM and Intel battle over the mobile chip’s future,”Computer, vol. 41, no. 5, pp. 15–18, 2008.
[13] ISO, “15765-2004 Road Vehicles — Diagnostics on Controller AreaNetworks (CAN).”
[14] R. Morabito, “A performance evaluation of container technologies onInternet of Things devices,” in Proceedings of IEEE Infocom Workshopon Computer Communications, San Francisco, California, USA, 2016.
[15] T. Wood, P. Shenoy, A. Venkataramani, and M. Yousif, “Sandpiper:Black-box and gray-box resource management for virtual machines,”Computer Networks, vol. 53, no. 17, pp. 2923–2938, 2009.
[16] R. Walker, “Examining load average,” Linux Journal, vol. 2006, no.152, p. 5, 2006.