lifetime-risk of alcohol-attributable mortality based on ... · lifetime-risk of...
TRANSCRIPT
Lifetime-risk of alcohol-attributable mortality based on different
levels of alcohol consumption in seven European countries.
Implications for low-risk drinking guidelines
Jürgen Rehm 1-5, Gerrit Gmel 1,6,7, Charlotte Probst1,5, and Kevin D. Shield 1,4
1) Centre for Addiction and Mental Health, Toronto, Canada
2) Addiction Policy, Dalla Lana School of Public Health, University of Toronto (UofT), Toronto, Canada
3) Department of Psychiatry, Faculty of Medicine, UofT, Toronto, Canada
4) Institute of Medical Science, UofT, Toronto, Canada
5) Clinical Psychology and Psychotherapy, Technische Universität Dresden, Germany
6) School of Electrical Engineering and Telecommunications, The University of New South Wales, Sydney,
Australia
7) Implant Systems Group, National Information and Communications Technology Australia, Sydney,
Australia
2
This report was produced for the National Institute for Health and Welfare, Finland, and arises from
the Joint Action on Reducing Alcohol Related Harm (RARHA) which has received funding from the
European Union, in the framework of the Health Programme (2008-2013).
The content of this report represents the views of the authors and is their sole responsibility; it can in
no way be taken to reflect the views of the European Commission and/or the Consumers, Health and
Food Executive Agency or any other body of the European Union. The European Commission and/or
the Executive Agency do not accept responsibility for any use that may be made of the information it
contains.
Suggested citation: Rehm, J., Gmel, G., Probst, C., & Shield, K.D. (2015). Lifetime-risk of alcohol-attributable mortality based on different levels of alcohol consumption in seven European countries. Implications for low-risk drinking guidelines. Toronto, On, Canada: Centre for Addiction and Mental Health. Available from [email protected] or online at www.camh.ca. Toronto, January 1, 2015 ISBN (Digital) 978-1-7714-206-9 ISBN (Print) 978-1-77114-205-2
3
Table of Contents Lifetime-risk of alcohol-attributable mortality based on different levels of alcohol consumption in seven
European countries. Implications for low-risk drinking guidelines .............................................................. 2
Executive summary ................................................................................................................................... 7
Schematic procedure (simplified) to identify mortality associated with different drinking levels in a
country .................................................................................................................................................. 8
A bit of history on low-risk drinking guidelines .......................................................................................... 10
Absolute alcohol-attributable health risk as basis for low-risk drinking guidelines ................................... 11
Methods ...................................................................................................................................................... 12
General principles to derive lifetime mortality risks for different levels of alcohol use ........................ 12
Figure 1: Stepwise procedure to identify mortality associated with different drinking levels in a
country ................................................................................................................................................ 12
Risk for what? Is mortality the best outcome to base guidelines on? .................................................... 14
Selection of dimensions of alcohol use to be examined......................................................................... 15
Selection of countries ............................................................................................................................. 15
Causes of death causally impacted by different levels of alcohol consumption .................................... 16
Table 1: Categories of alcohol-attributable disease and the sources used for determining risk
relations .............................................................................................................................................. 16
Methodology for estimating alcohol-attributable mortality risk associated with various levels of
drinking ................................................................................................................................................... 18
Methodological differences between the current approach and the approach taken as basis of the
Australian guidelines ............................................................................................................................... 20
Selection of acceptable thresholds for lifetime risk caused by alcohol consumption............................ 21
Results ......................................................................................................................................................... 23
Lifetime risks for alcohol-attributable mortality..................................................................................... 23
Table 2: Lifetime risk to die from alcohol use for different levels of average daily consumption in
Europe in 2012 .................................................................................................................................... 25
4
Table 3: Lifetime risk to die from alcohol use for different levels of average daily consumption in
2012 for men (M) and women (W) – main scenario .......................................................................... 27
Figure 2: Lifetime risk for alcohol-attributable mortality for different levels of drinking pure alcohol
per day by sex (M=men, W=women) for Estonia (left) and Finland (right) (based on mortality data
for 2012) .............................................................................................................................................. 28
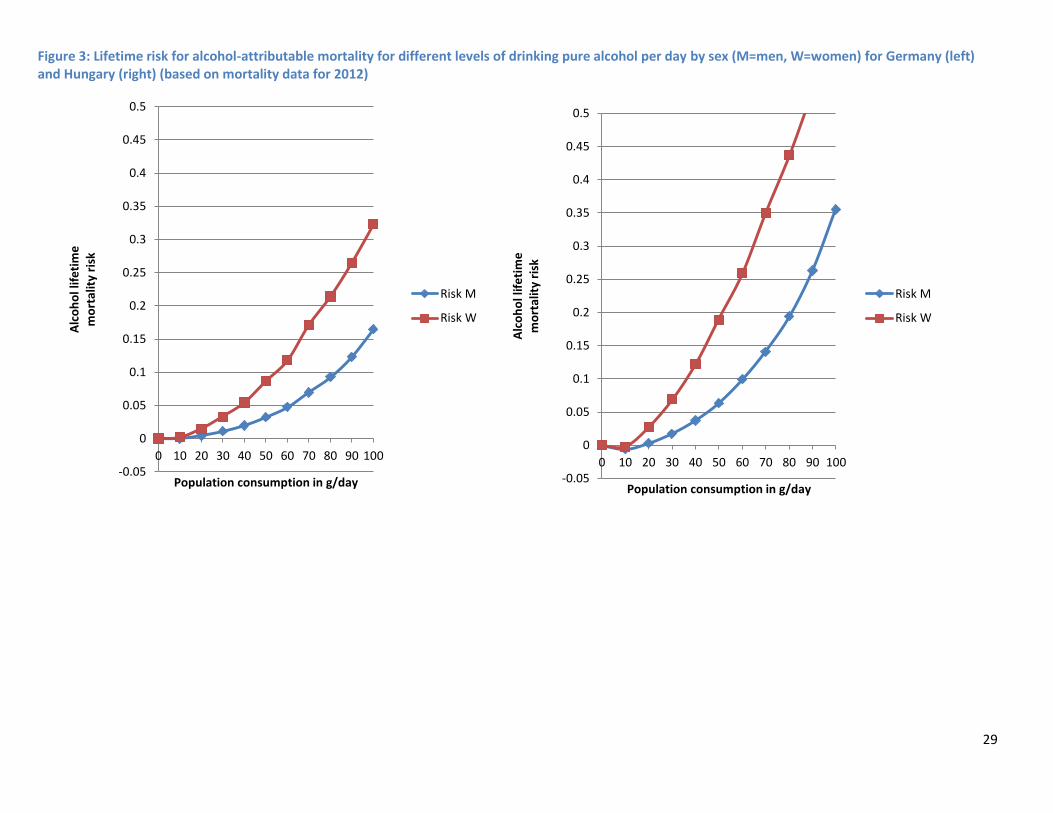
Figure 3: Lifetime risk for alcohol-attributable mortality for different levels of drinking pure alcohol
per day by sex (M=men, W=women) for Germany (left) and Hungary (right) (based on mortality
data for 2012) ..................................................................................................................................... 29
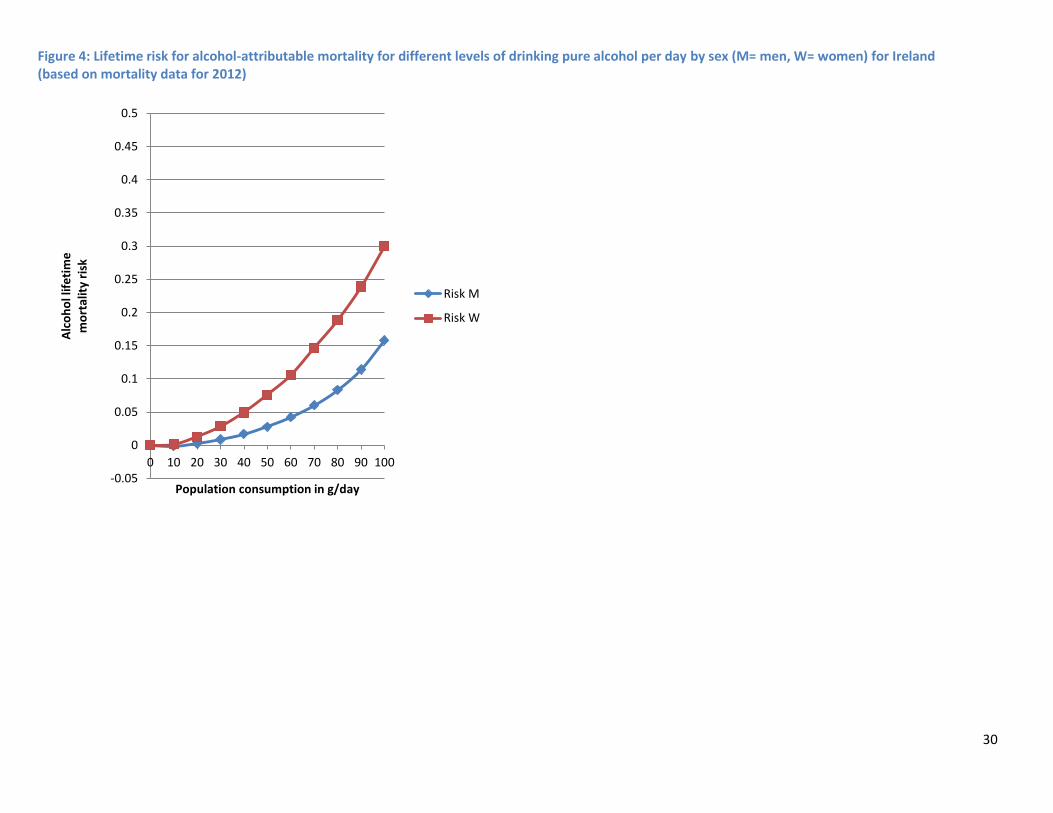
Figure 4: Lifetime risk for alcohol-attributable mortality for different levels of drinking pure alcohol
per day by sex (M= men, W= women) for Ireland (based on mortality data for 2012)..................... 30
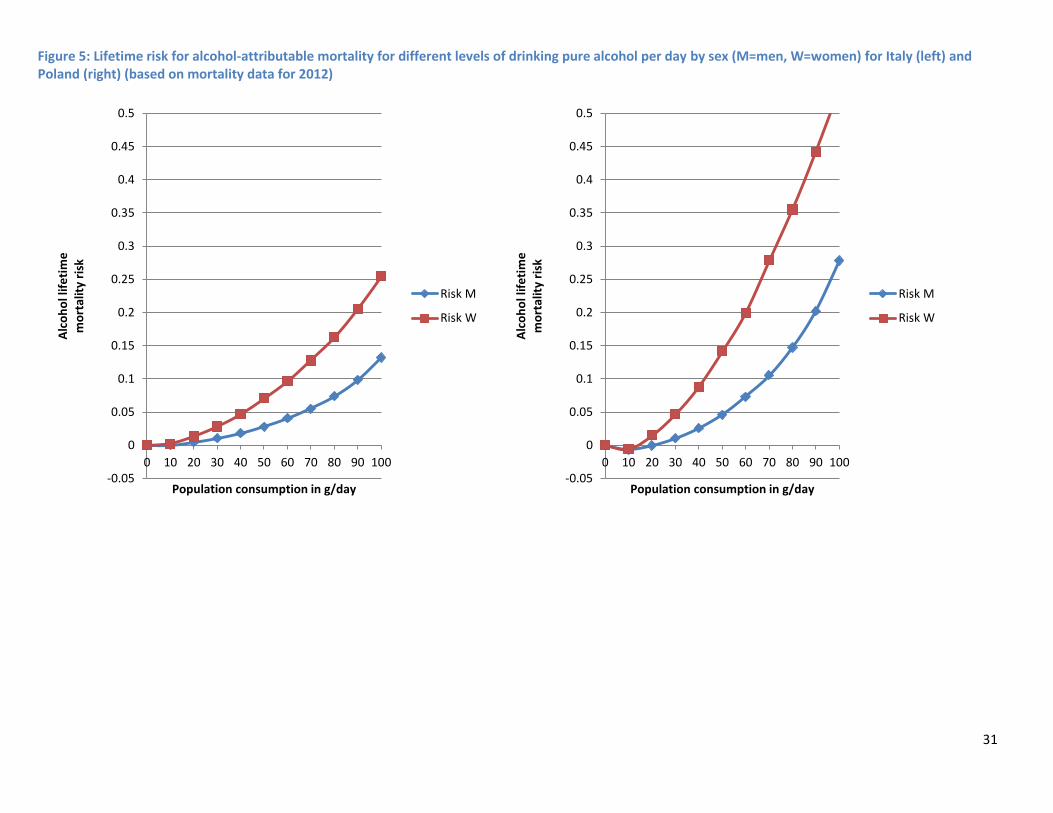
Figure 5: Lifetime risk for alcohol-attributable mortality for different levels of drinking pure alcohol
per day by sex (M=men, W=women) for Italy (left) and Poland (right) (based on mortality data for
2012) ................................................................................................................................................... 31
Results of the sensitivity analyses........................................................................................................... 32
Sensitivity analysis 1 using sex-specific mortality ............................................................................... 32
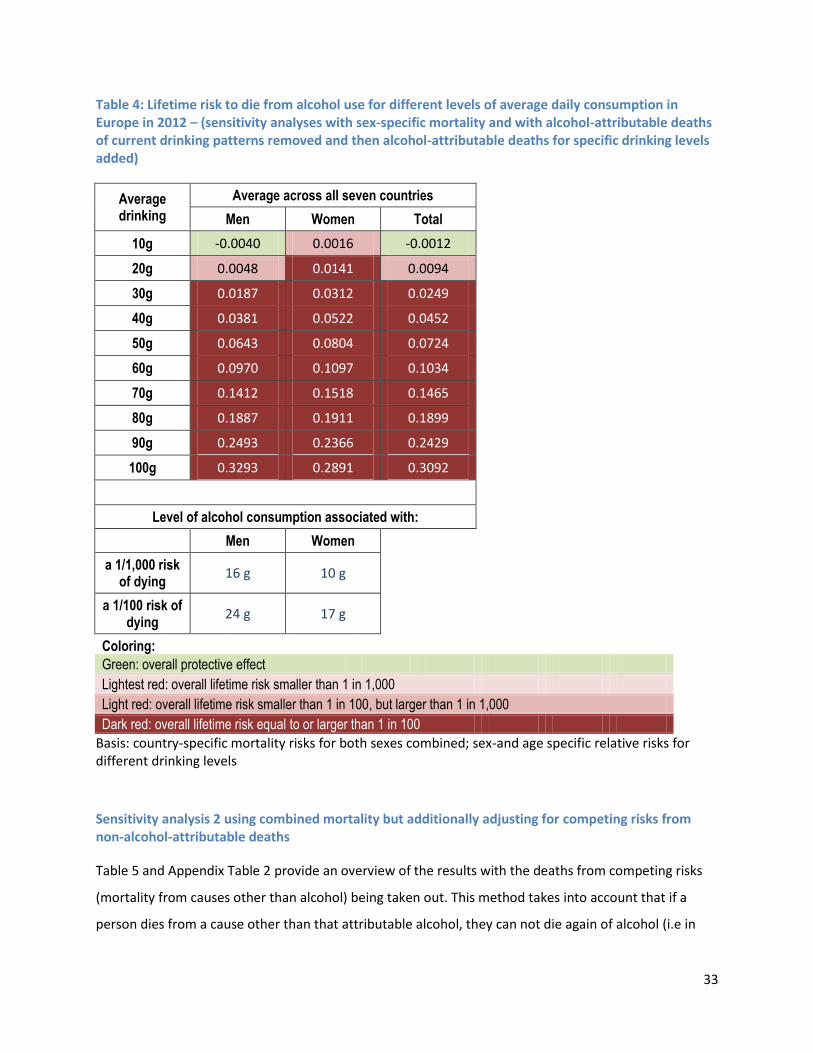
Table 4: Lifetime risk to die from alcohol use for different levels of average daily consumption in
Europe in 2012 – (sensitivity analyses with sex-specific mortality and with alcohol-attributable
deaths of current drinking patterns removed and then alcohol-attributable deaths for specific
drinking levels added) ......................................................................................................................... 33
Sensitivity analysis 2 using combined mortality but additionally adjusting for competing risks from
non-alcohol-attributable deaths ......................................................................................................... 33
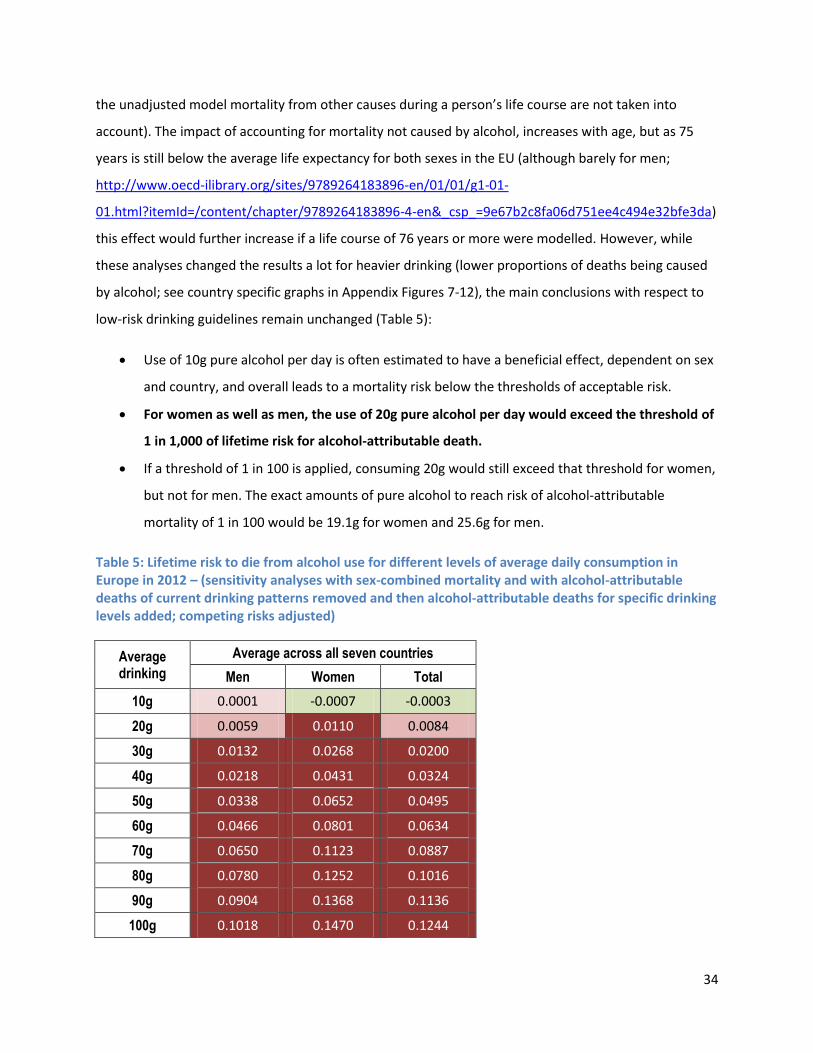
Table 5: Lifetime risk to die from alcohol use for different levels of average daily consumption in
Europe in 2012 – (sensitivity analyses with sex-combined mortality and with alcohol-attributable
deaths of current drinking patterns removed and then alcohol-attributable deaths for specific
drinking levels added; competing risks adjusted) ............................................................................... 34
Acute risks as a result of drinking per occasion ...................................................................................... 35
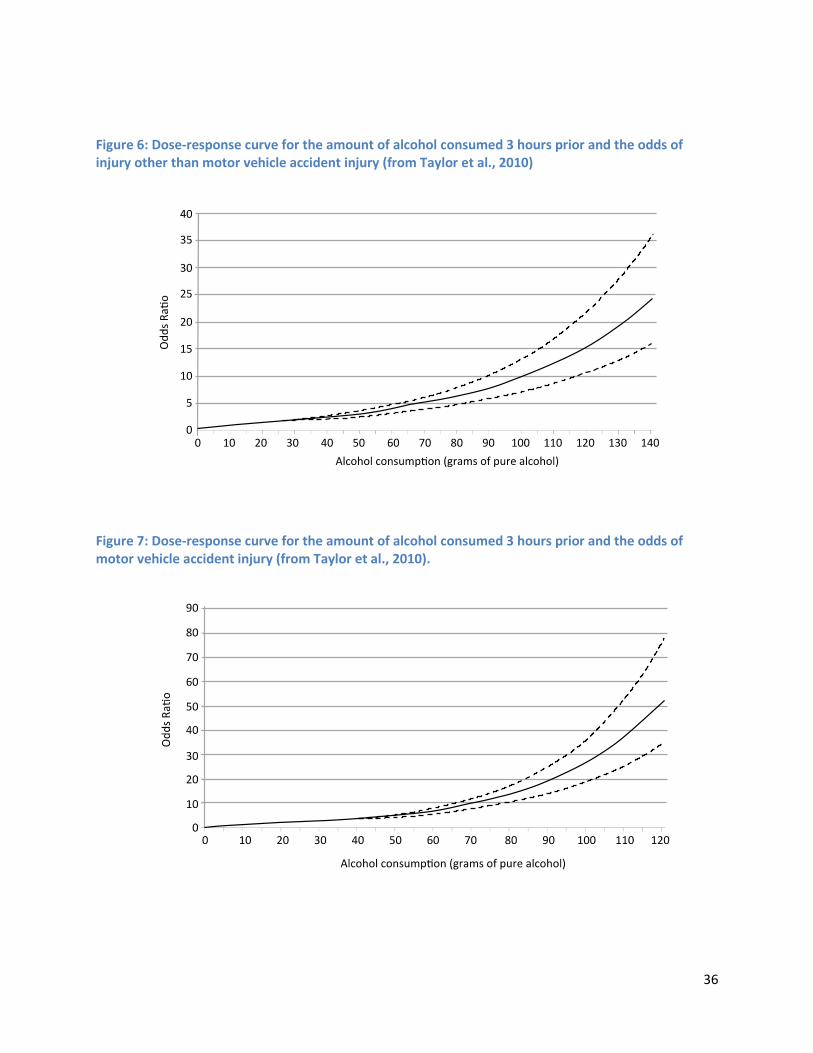
Figure 6: Dose-response curve for the amount of alcohol consumed 3 hours prior and the odds of
injury other than motor vehicle accident injury (from Taylor et al., 2010) ........................................ 36
5
Figure 7: Dose-response curve for the amount of alcohol consumed 3 hours prior and the odds of
motor vehicle accident injury (from Taylor et al., 2010). ................................................................... 36
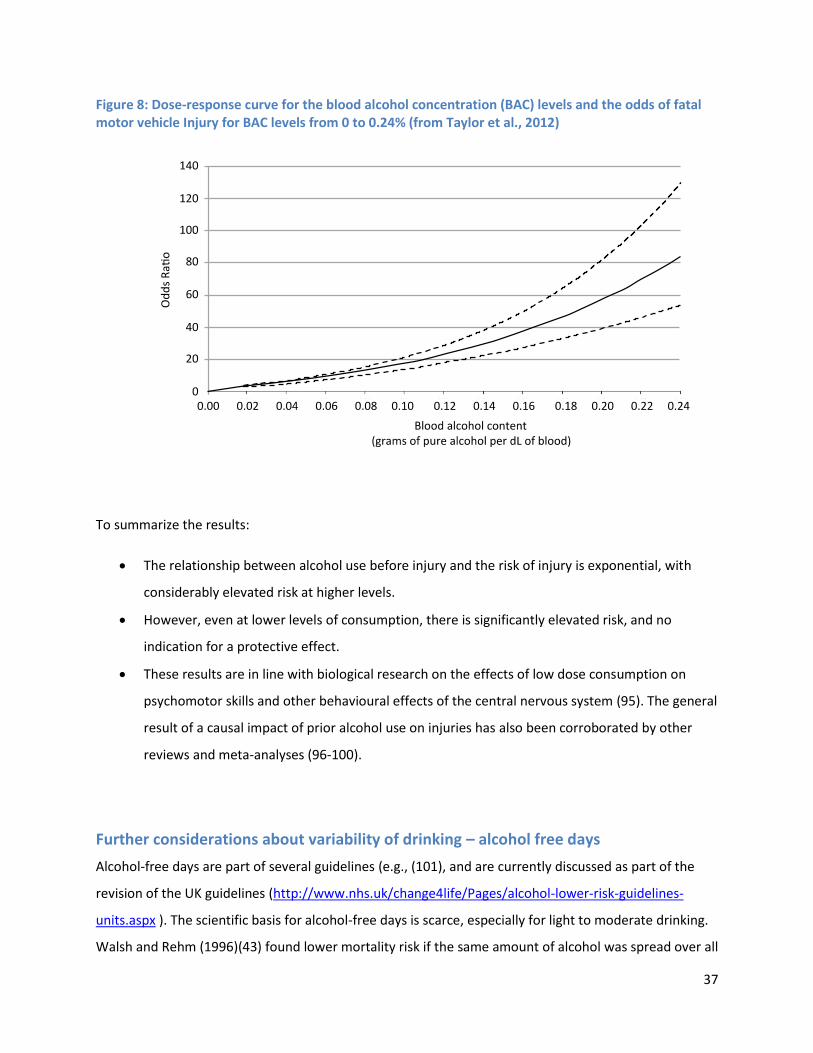
Figure 8: Dose-response curve for the blood alcohol concentration (BAC) levels and the odds of
fatal motor vehicle Injury for BAC levels from 0 to 0.24% (from Taylor et al., 2012) ......................... 37
Further considerations about variability of drinking – alcohol free days ............................................... 37
Considerations of heterogeneity between people, and consequences for low-risk drinking guidelines
................................................................................................................................................................ 38
Discussion.................................................................................................................................................... 40
Appendices .................................................................................................................................................. 43
Sensitivity analysis 1 and 2.......................................................................................................................... 43
Appendix Table 1: Lifetime risk to die from alcohol use for different levels of average daily
consumption in 2012 – (sensitivity analysis with sex-specific mortality and with alcohol-attributable
deaths of current drinking patterns removed and then alcohol-attributable deaths for specific drinking
levels added) ........................................................................................................................................... 43
Appendix Table 2: Lifetime risk to die from alcohol use for different levels of average daily
consumption in 2012 – (sensitivity analysis with combined mortality and with alcohol-attributable
deaths of current drinking patterns removed and then alcohol-attributable deaths for specific drinking
levels added; competing risks included) ................................................................................................. 45
Appendix Figures 1-7: Lifetime risk to die from alcohol use for different levels of average daily
consumption in 2012 – sensitivity analyses 1 with sex-specific mortality and with alcohol-attributable
deaths of current drinking patterns removed and then alcohol-attributable deaths for specific drinking
levels added ............................................................................................................................................ 46
Estonia ................................................................................................................................................. 46
Finland ................................................................................................................................................. 46
Germany .............................................................................................................................................. 47
Hungary ............................................................................................................................................... 47
Ireland ................................................................................................................................................. 48
Italy...................................................................................................................................................... 49
6
Poland ................................................................................................................................................. 49
Appendix Figures 8-14: Lifetime risk to die from alcohol use for different levels of average daily
consumption in 2012 – sensitivity analyses 2 with sex-specific mortality and with alcohol-attributable
deaths of current drinking patterns removed and then alcohol-attributable deaths for specific drinking
levels added; competing risks adjusted for ............................................................................................ 50
Estonia ................................................................................................................................................. 50
Finland ................................................................................................................................................. 50
Germany .............................................................................................................................................. 51
Hungary ............................................................................................................................................... 51
Ireland ................................................................................................................................................. 52
Italy...................................................................................................................................................... 52
Poland ................................................................................................................................................. 53
Relative risk by sex and level of consumption ........................................................................................ 54
Appendix Table 3. Relative risk for alcohol-related diseases given an average daily alcohol
consumption amount (as compared to lifetime abstainers) .............................................................. 54
7
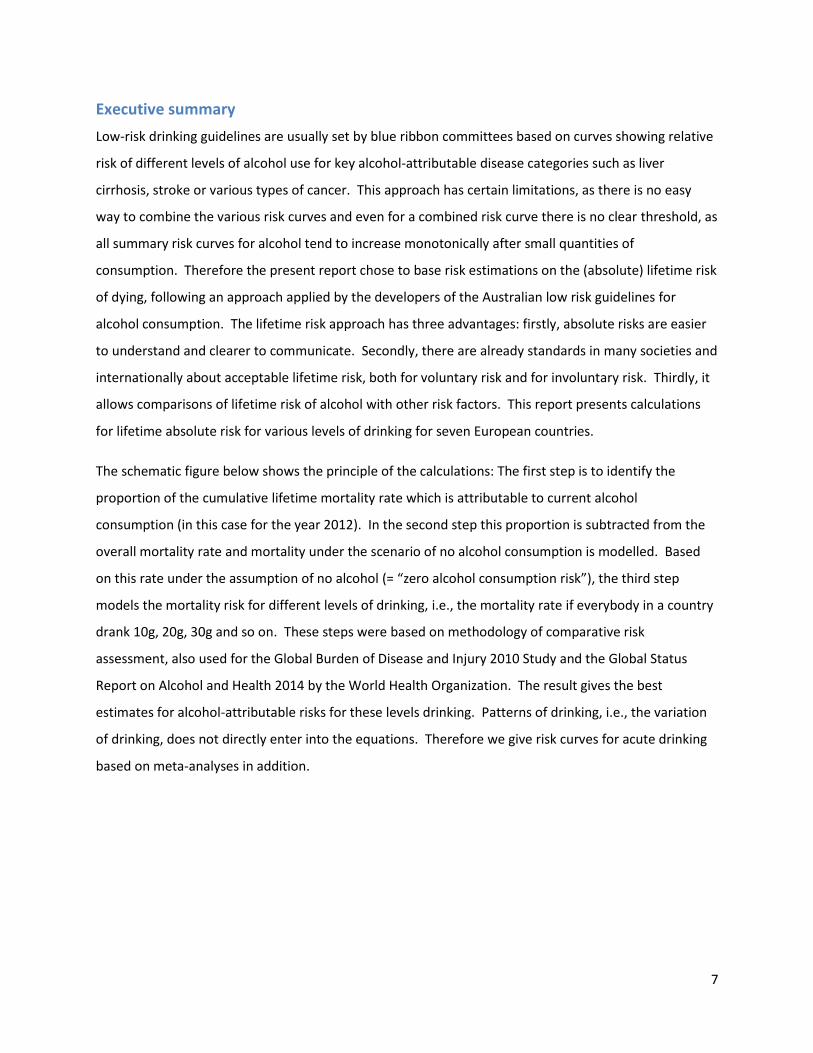
Executive summary
Low-risk drinking guidelines are usually set by blue ribbon committees based on curves showing relative
risk of different levels of alcohol use for key alcohol-attributable disease categories such as liver
cirrhosis, stroke or various types of cancer. This approach has certain limitations, as there is no easy
way to combine the various risk curves and even for a combined risk curve there is no clear threshold, as
all summary risk curves for alcohol tend to increase monotonically after small quantities of
consumption. Therefore the present report chose to base risk estimations on the (absolute) lifetime risk
of dying, following an approach applied by the developers of the Australian low risk guidelines for
alcohol consumption. The lifetime risk approach has three advantages: firstly, absolute risks are easier
to understand and clearer to communicate. Secondly, there are already standards in many societies and
internationally about acceptable lifetime risk, both for voluntary risk and for involuntary risk. Thirdly, it
allows comparisons of lifetime risk of alcohol with other risk factors. This report presents calculations
for lifetime absolute risk for various levels of drinking for seven European countries.
The schematic figure below shows the principle of the calculations: The first step is to identify the
proportion of the cumulative lifetime mortality rate which is attributable to current alcohol
consumption (in this case for the year 2012). In the second step this proportion is subtracted from the
overall mortality rate and mortality under the scenario of no alcohol consumption is modelled. Based
on this rate under the assumption of no alcohol (= “zero alcohol consumption risk”), the third step
models the mortality risk for different levels of drinking, i.e., the mortality rate if everybody in a country
drank 10g, 20g, 30g and so on. These steps were based on methodology of comparative risk
assessment, also used for the Global Burden of Disease and Injury 2010 Study and the Global Status
Report on Alcohol and Health 2014 by the World Health Organization. The result gives the best
estimates for alcohol-attributable risks for these levels drinking. Patterns of drinking, i.e., the variation
of drinking, does not directly enter into the equations. Therefore we give risk curves for acute drinking
based on meta-analyses in addition.
8
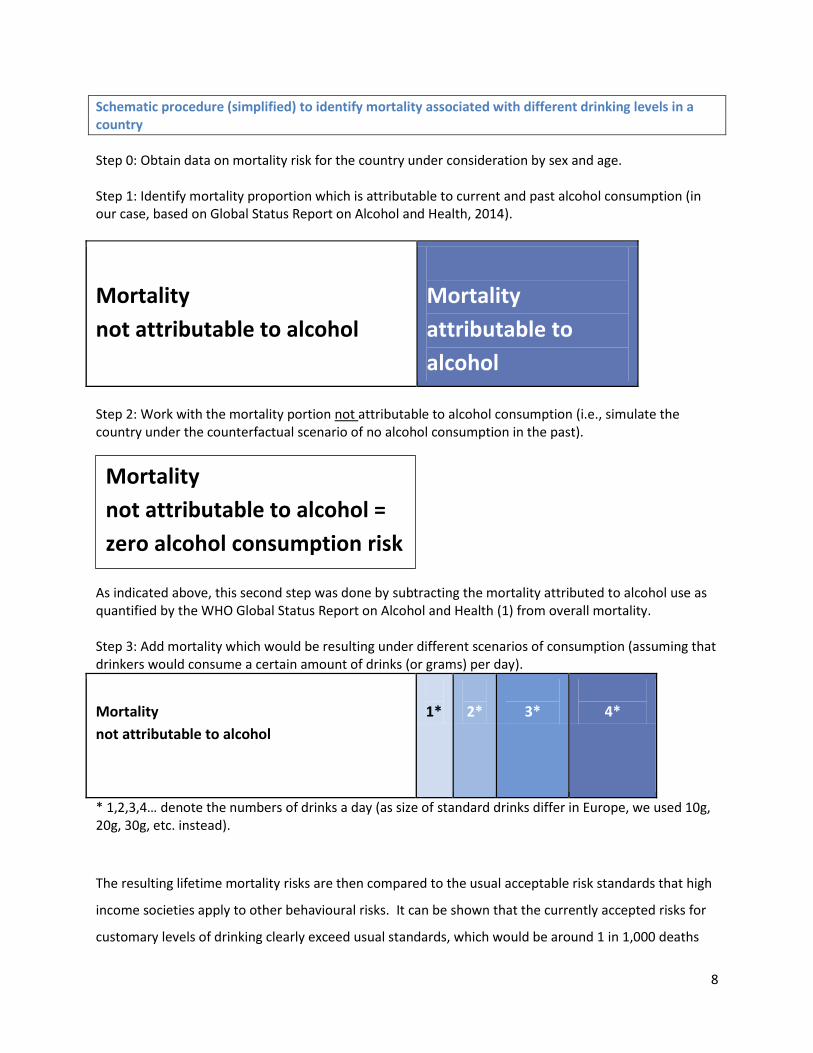
Schematic procedure (simplified) to identify mortality associated with different drinking levels in a country
Step 0: Obtain data on mortality risk for the country under consideration by sex and age. Step 1: Identify mortality proportion which is attributable to current and past alcohol consumption (in our case, based on Global Status Report on Alcohol and Health, 2014).
Mortality
not attributable to alcohol
Mortality
attributable to
alcohol
Step 2: Work with the mortality portion not attributable to alcohol consumption (i.e., simulate the country under the counterfactual scenario of no alcohol consumption in the past). As indicated above, this second step was done by subtracting the mortality attributed to alcohol use as quantified by the WHO Global Status Report on Alcohol and Health (1) from overall mortality. Step 3: Add mortality which would be resulting under different scenarios of consumption (assuming that drinkers would consume a certain amount of drinks (or grams) per day).
Mortality
not attributable to alcohol
1*
2*
3*
4*
* 1,2,3,4… denote the numbers of drinks a day (as size of standard drinks differ in Europe, we used 10g, 20g, 30g, etc. instead).
The resulting lifetime mortality risks are then compared to the usual acceptable risk standards that high
income societies apply to other behavioural risks. It can be shown that the currently accepted risks for
customary levels of drinking clearly exceed usual standards, which would be around 1 in 1,000 deaths
Mortality
not attributable to alcohol =
zero alcohol consumption risk
9
lifetime. Usual standards of acceptable risk and the ratio between voluntary and involuntary risks were
derived from the literature. For involuntary risks not controlled by the individual such as risks from
water, soil or air, nations and international organizations often set standards of 1 in a million (1 in
1,000,000) for lifetime mortality. For voluntary risks stemming from individual behaviours such as
hobbies, or lifestyle factors (skiing, smoking), about 1,000 times higher risk is accepted, resulting in an
acceptable risk threshold of 1 in 1,000.
Drinking 20 g pure alcohol (2 standard drinks) per day exceeds this threshold for lifetime mortality risk of
1 in 1,000 for both men and women in almost all European countries; and in many of the countries
examined, even the 10 times higher risk threshold of a 1 in 100 chance of alcohol-attributable death
would be exceeded by this consumption level of 2 standard drinks per day. In summary, if drinking
guidelines were to be based on the usual accepted lifetime mortality risk for voluntary behaviours,
the maximum alcohol consumption would be one drink a day (for European Union countries). In
addition, we considered the risk of dying from other people’s alcohol use with other involuntary risks in
society. Again, the risks accepted for alcohol use by far seem to exceed other involuntary risk thresholds
(e.g., lifetime risks from drinking water, soil or air pollution).
Overall, when it comes to alcohol, modern high-income societies seem to accept lifetime mortality risks
that are much higher than risks from other behaviours or in case of harm to others, higher than other
involuntary risks. The reasons for accepting high risks from alcohol consumption are not fully
understood.

10
A bit of history on low-risk drinking guidelines
Low-risk drinking guidelines, i.e., advice to drinkers on how much alcohol is relatively safe or
appropriate1 to drink, has been largely a concern of the last three decades (2), although earlier efforts
can be found—most famously ‘Anstie’s limit’ of 1870, specifying a limit of about three standard drinks
(i.e., 34g ethanol) per day for a middle-class man (3). The term “low-risk” guidelines is more and more
replacing the earlier terms of “safe” or “sensible” guidelines, as research has indicated that there is no
safe limit for the risk of alcohol use for a number of health outcomes such as cancer ((4-6); for risk
functions of other diseases see (7); or (8)). The introduction of low-risk drinking guidelines fits well with
the modern ideal of a consumer society, with well-informed consumers putatively conforming their
behaviour to consumer advice from official or professional sources (2).
In many countries drinking guidelines have been adopted (e.g. (9);
http://www.nhs.uk/Livewell/alcohol/Pages/Effectsofalcohol.aspx; http://www.alcool-info-
service.fr/alcool/evaluer-consommation-alcool/consommation-a-risque))2, but the bases for establishing
guidelines are not clear. Norfolk described the process of establishing the earlier guidelines in the UK:
“[they were] really plucked out of the air…. It was sort of an intelligent guess by a committee” (Norfolk,
2007, cited from (10)). Even the newer guidelines based on different disease specific risk curves (as e.g.
the Canadian guidelines (11, 12)) rely on expert judgements when attempting to combine those to one
single risk curve. Where to place the threshold (cut-off) to inacceptable risk on this continuous relative
risk curve (usually on its monotonically increasing part (see also (13)), is in most cases subject to expert
opinion, too. Thus, almost all low-risk drinking guidelines are made by blue ribbon committees3
determining a consensus based more or less on gut feelings and expected reactions of the public.
1 While committees are usually instructed to base their judgements solely on health considerations, inevitably
cultural norms about what is appropriate enter the discussion. This can be seen in any public discourse about draft guidelines (e.g., https://www.nhmrc.gov.au/your-health/alcohol-guidelines for Australia).
2 The current Joint Action on Reducing Alcohol Related Harm (RARHA) has the objective to collect and compare low
risk drinking guidelines for the countries of the EU. http://www.rarha.eu/About/BackgroundPurpose/Pages/default.aspx
3 From http://en.wikipedia.org/wiki/Blue-ribbon_panel (10.10.2014): “Blue-ribbon panel (sometimes called a blue
ribbon commission) is an informal term generally used to describe a group of exceptional persons appointed to investigate or study or analyze a given question. The term generally connotes a degree of independence from political influence or other authority, and such panels usually have no direct authority of their own. Their value
11
Absolute alcohol-attributable health risk as basis for low-risk drinking guidelines
The Australian low-risk drinking guidelines (https://www.nhmrc.gov.au/your-health/alcohol-guidelines )
took a different approach (see also (2); for a general discussion of various approaches see the different
contributions to (14)). They tried to identify absolute lifetime mortality risk associated with different
levels of drinking (i.e., the probability of dying if one drank at this level the whole adult life). This
absolute mortality risk was then compared to other behavioural lifetime mortality risks such as skiing or
smoking (see also (10), as background). This still requires some human decision making, to define which
lifetime mortality risk level is acceptable for behaviours people choose themselves (i.e., voluntary
exposure such as alcohol drinking, smoking, skiing, bungee jumping, etc.) compared to what lifetime
mortality risk is acceptable for risks people are involuntarily exposed to (e.g., radon exposure, living with
nuclear power; the latter risks are often set in guidelines; for background see (15-19)). We will discuss
acceptable risk literature below.
Despite the necessity to define acceptable risk thresholds, the lifetime mortality risk approach has
several advantages:
it explicitly states a criterion for decision making;
it is based on absolute risks, which are easier to communicate and understand (20, 21);
the risk analysis for different risk factors can be made comparative, so no sector is differentially
treated in policy making.
Based on these considerations, the present analyses will, like the Australian ones, adopt the lifetime
approach. In some other, more technical, respects the current approach differs from the Australian
approach, which will be explained below.
comes from their ability to use their expertise to issue findings or recommendations which can then be used by those with decision-making power to act.”
4 We actually modelled the cohort between 0 and 74 years of age, but before age 15, as modelled in the
Comparative Risk Analyses of the Global Burden of Disease studies and the Global Status Reports on Alcohol and
12
Methods
General principles to derive lifetime mortality risks for different levels of alcohol use
Constructing lifetime mortality risks attributable to different levels of alcohol use for European countries
requires first a methodology to quantify the risks of alcohol at different levels of drinking. The
succession of steps (Figure 1) below schematically outline such a procedure, the details of which are
explained and justified in the next sections.
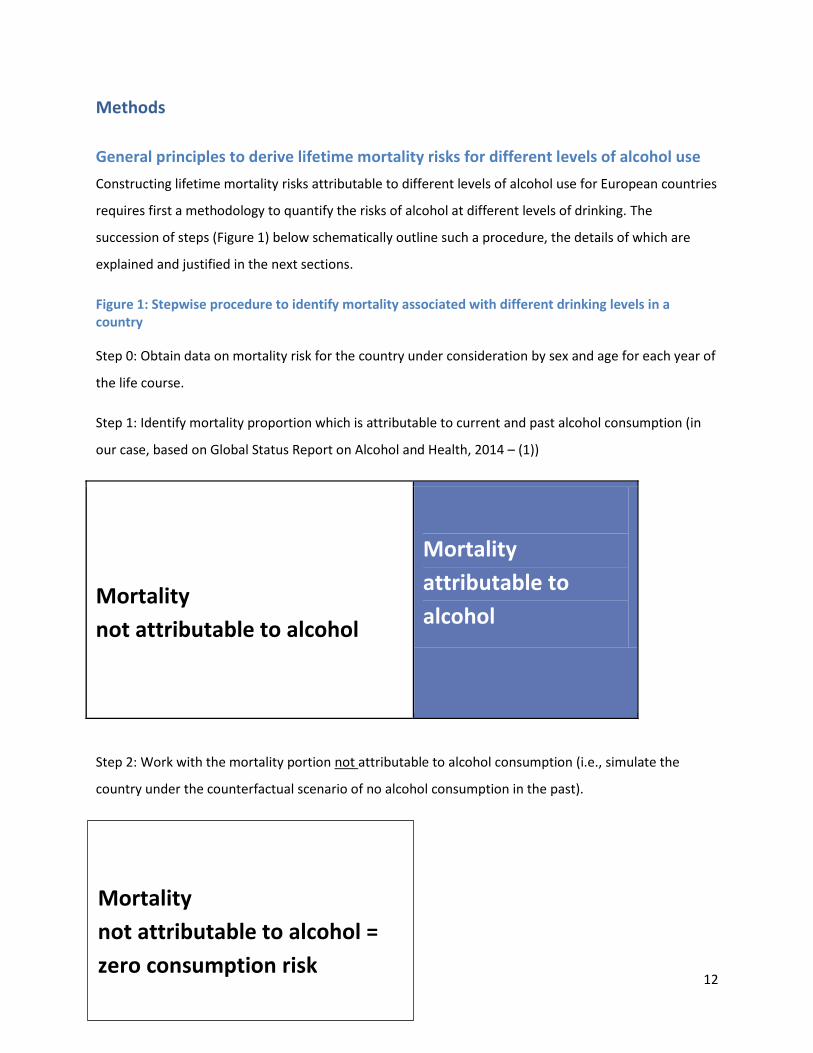
Figure 1: Stepwise procedure to identify mortality associated with different drinking levels in a country
Step 0: Obtain data on mortality risk for the country under consideration by sex and age for each year of
the life course.
Step 1: Identify mortality proportion which is attributable to current and past alcohol consumption (in
our case, based on Global Status Report on Alcohol and Health, 2014 – (1))
Mortality
not attributable to alcohol
Mortality
attributable to
alcohol
Step 2: Work with the mortality portion not attributable to alcohol consumption (i.e., simulate the
country under the counterfactual scenario of no alcohol consumption in the past).
Mortality
not attributable to alcohol =
zero consumption risk
13
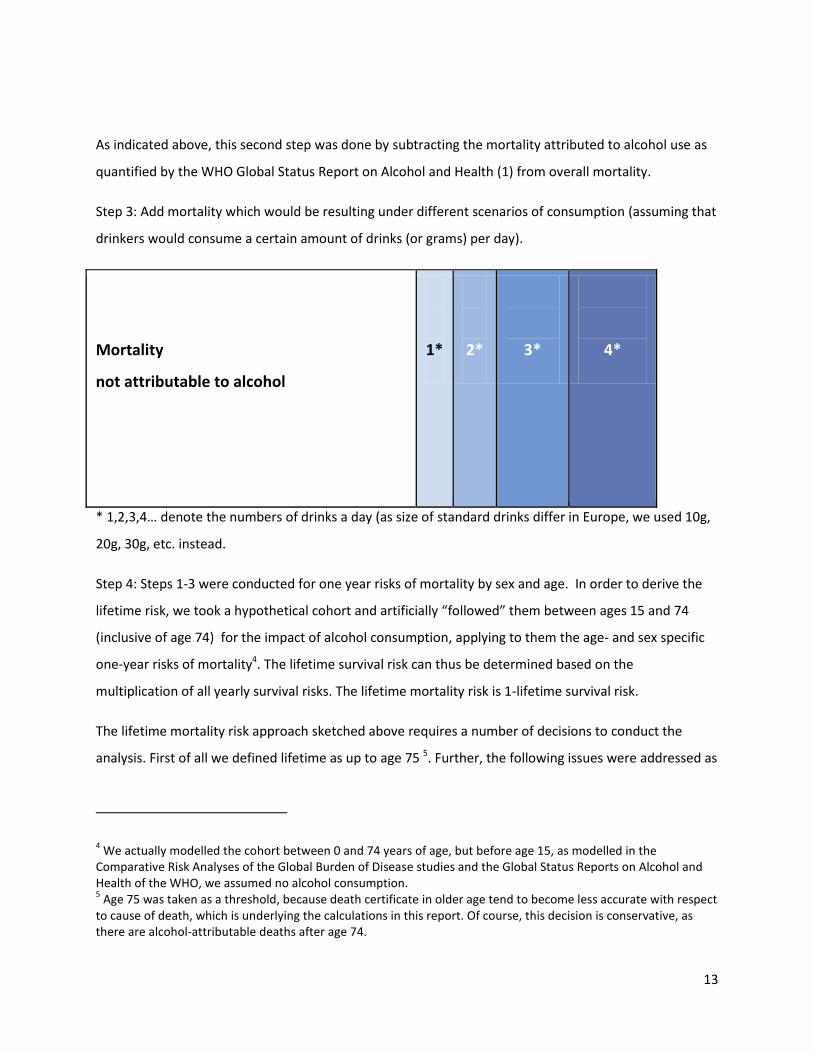
As indicated above, this second step was done by subtracting the mortality attributed to alcohol use as
quantified by the WHO Global Status Report on Alcohol and Health (1) from overall mortality.
Step 3: Add mortality which would be resulting under different scenarios of consumption (assuming that
drinkers would consume a certain amount of drinks (or grams) per day).
Mortality
not attributable to alcohol
1*
2*
3*
4*
* 1,2,3,4… denote the numbers of drinks a day (as size of standard drinks differ in Europe, we used 10g,
20g, 30g, etc. instead.
Step 4: Steps 1-3 were conducted for one year risks of mortality by sex and age. In order to derive the
lifetime risk, we took a hypothetical cohort and artificially “followed” them between ages 15 and 74
(inclusive of age 74) for the impact of alcohol consumption, applying to them the age- and sex specific
one-year risks of mortality4. The lifetime survival risk can thus be determined based on the
multiplication of all yearly survival risks. The lifetime mortality risk is 1-lifetime survival risk.
The lifetime mortality risk approach sketched above requires a number of decisions to conduct the
analysis. First of all we defined lifetime as up to age 75 5. Further, the following issues were addressed as
4 We actually modelled the cohort between 0 and 74 years of age, but before age 15, as modelled in the
Comparative Risk Analyses of the Global Burden of Disease studies and the Global Status Reports on Alcohol and Health of the WHO, we assumed no alcohol consumption. 5 Age 75 was taken as a threshold, because death certificate in older age tend to become less accurate with respect
to cause of death, which is underlying the calculations in this report. Of course, this decision is conservative, as there are alcohol-attributable deaths after age 74.
14
described in smaller print below (decisions in short in brackets for readers who would like to skip the
technical part):
- Risk for what? Is mortality the best outcome to base guidelines on?
(cause-specific mortality was taken as the basis of calculations)
- Selection of the dimension of alcohol use to be examined
(amount of alcohol per day was used)
- Selection of countries – focus on Europe
(Estonia, Finland, Germany, Hungary, Ireland, Italy, and Poland were chosen as exemplary
countries based on the diversity of their drinking cultures)
- Selection of the causes of death causally impacted by different levels of alcohol consumption
(with only a few small exceptions the same causes as used in the Global Status Report on
Alcohol and Health (1), and in the Global Burden of Disease Study (22) were used)
- Selection of operationalizations and methodology
(method of absolute mortality risk derived from scenarios assuming that all drinkers in a country
drink 1 drink, 2 drinks, etc., with different assumptions on mortality)
- Selection of acceptable thresholds for lifetime risk caused by alcohol consumption
(based on usual thresholds for voluntary risk, thresholds of 1 in 1,000 lifetime mortality risk and
a much less conservative risk of 1 in 100 were applied)
Risk for what? Is mortality the best outcome to base guidelines on?
All arguments stated above were based on lifetime mortality risk as the main endpoint for evaluating different levels and patterns of alcohol consumption, but this is not the only possible choice. Any outcome used should be able to summarize across different diseases and injury, without necessarily being a “summary health measure”
6
(24, 25). We decided to use mortality as there is much more literature on acceptable mortality risk compared to acceptable risks for other summary health measures such as disability-adjusted life years (26, 27); or hospitalizations (for some classical reviews on acceptable mortality risks from different disciplines: (17, 28-30)). In other words: only for lifetime mortality could we establish acceptable mortality risk thresholds, which had converged for different high-income countries. Other reasons for taking mortality as major outcome include that it is the most severe outcome, and that mortality data including cause of death information is readily available with reasonable validity and reliability, at least in high-income countries such as all European Union (EU) countries (for more details on these reasons see (31); for review of studies on the reliability of mortality (32)).
6 Summary measures of population health are measures that combine information on mortality and non-fatal
health outcomes to represent the health of a particular population as a single number (23).
15
This study adopted the methodology to calculate absolute lifetime risk underlying the Australian guidelines (10, 33, 34); for background see also: (31, 35) and https://www.nhmrc.gov.au/your-health/alcohol-guidelines) and refined it as described in the following. At this point we would like to stress, that the chosen methodology does not assume any expert judgements, once the acceptable risk thresholds are set. It is based solely on evidence.
We chose the weighted summation of disease-specific risks rather than using the overall risk function between alcohol use and mortality (e.g., (36-38)), as taking studies on all-cause mortality as the basis for low-risk drinking guidelines for any jurisdiction assumes, that the age- and cause of death distributions of the underlying cohort studies are similar to the respective distributions of the general populations for which the low-risk drinking guidelines should apply (31). This is not likely to be the case; in fact, typical cohort studies differ considerably from European general populations in their mortality mix. Cohorts for prospective studies are usually selected for ease of follow up (39), resulting in a bias favouring stable middle-class populations, unlikely to have the same characteristics as general populations. While this is usually irrelevant when causality between exposure and specific disease outcomes is studied, it does matter when looking at the impact of different levels of exposure on all-cause mortality. In general, cohorts from prospective studies have a much better health profile with higher life expectancies and different causes of death (i.e. fewer injuries, more cardiovascular and other chronic disease death) compared with general populations. Thus, such cohorts will overestimate the protective effect of alcohol use, based on its effects on ischemic diseases and on diabetes (40, 41), and underestimate the detrimental effects.
Selection of dimensions of alcohol use to be examined
From a health perspective it does make a difference if the same amount of alcohol per week (e.g. 14 standard drinks
7 per week) is consumed over a number of days (e.g. 7 days with 2 drinks each day) or concentrated on only
a few days (e.g., 5 abstinent days and one day with 8 drinks and one day with 6 drinks; for background see (42, 43)). To account for that, a second dimension of alcohol use often introduced into guidelines is maximal use on each occasion (often labelled as rules for patterns of drinking; for background see (44); for relations to disease see (7, 45)). It is difficult to input such a dimension into lifetime risk calculations, so we chose to indirectly model this via resulting mortality profiles in European countries (see discussion below), and in addition show results for injuries as a function of drinking per occasion.
Selection of countries
The fact that European countries differ considerably with respect to their drinking cultures makes country-specific analyses necessary. A drinking culture comprises preferences with respect to specific beverages, the public demonstration of states of intoxication as well as drinking habits such as drinking with meals. These features are in turn associated with harm (e.g., (46, 47) for the impact of drinking with meals on harm; (48, 49) for the impact of public drinking on harm). Drinking cultures are influenced by traditions, economics and the legal context of a country that both might change over time. Countries and regions were selected to include at least one region with each of the three prototypical drinking pattern traditions in Europe (50-52) as well as European extremes in drinking levels, prevalence of alcohol use disorders (AUD) and life expectancy:
7 As there are different definitions of standard drinks in European countries, our calculations will be based entirely
on grams pure alcohol per day. However, for illustrative examples we still use the term standard drinks, as it is easier understood. Of course, the statement above applies irrespective of how a standard drink is defined.
16
Wine‐drinking countries in the Mediterranean region, where wine is often consumed daily, usually with meals and avoiding drunkenness. The country selected for this drinking style was Italy.
Central‐West and Western regions with also a frequent drinking style, but with beer as the beverage of choice; and proportionally less drinking with meals. The countries selected for this drinking style were Germany and Ireland.
Nordic and Central‐East and Eastern regions, with a style of irregular heavy drinking, mostly outside meals. We selected four countries with this drinking style representing some variation between wealth and life expectancy
8: for the Nordic countries: Finland; for Central East and Eastern countries: Estonia as
representative of the Central East/Eastern European EU countries with lowest GDP-PPP and lowest life expectancy; Hungary as a medium country for that region; and Poland as a relative rich country with one of the longest life expectancies in this region).
In terms of level of drinking, Hungary is among the countries with highest overall use globally (and thus in Europe as well), and Italy one of the countries with lowest drinking level in Europe (1). In terms of prevalence of AUD and especially alcohol dependence, Estonia is among the highest in Europe and Italy among the lowest in Europe (54)
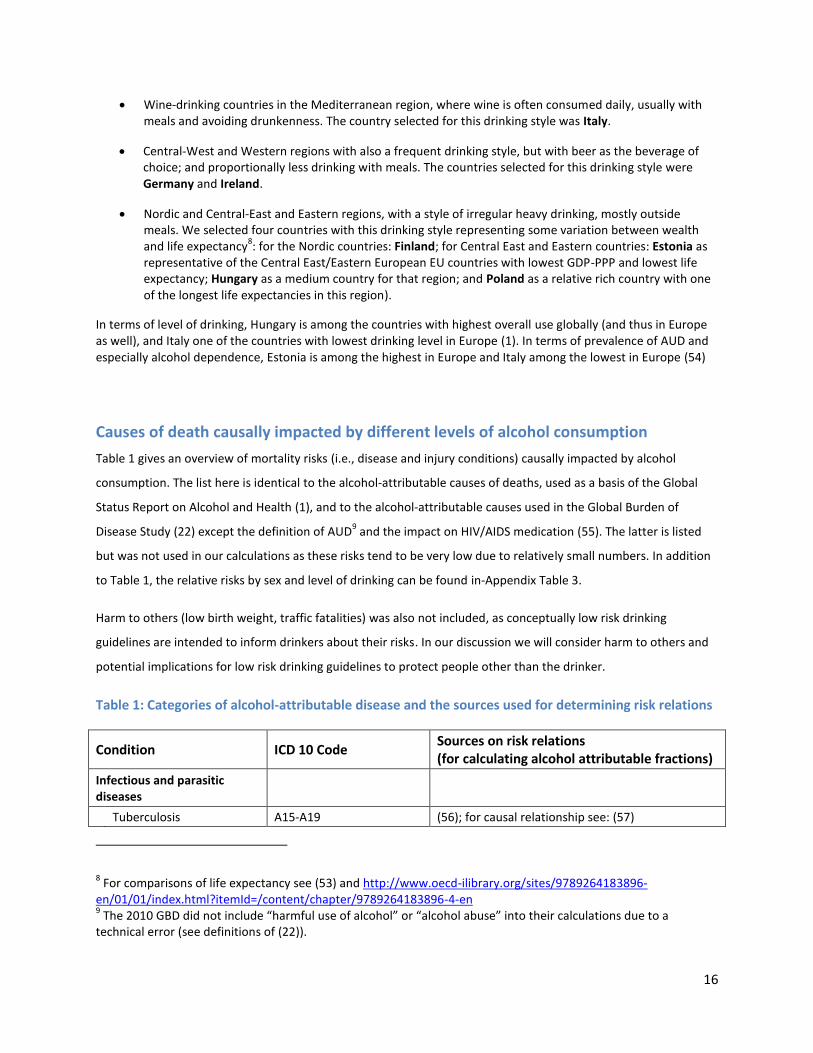
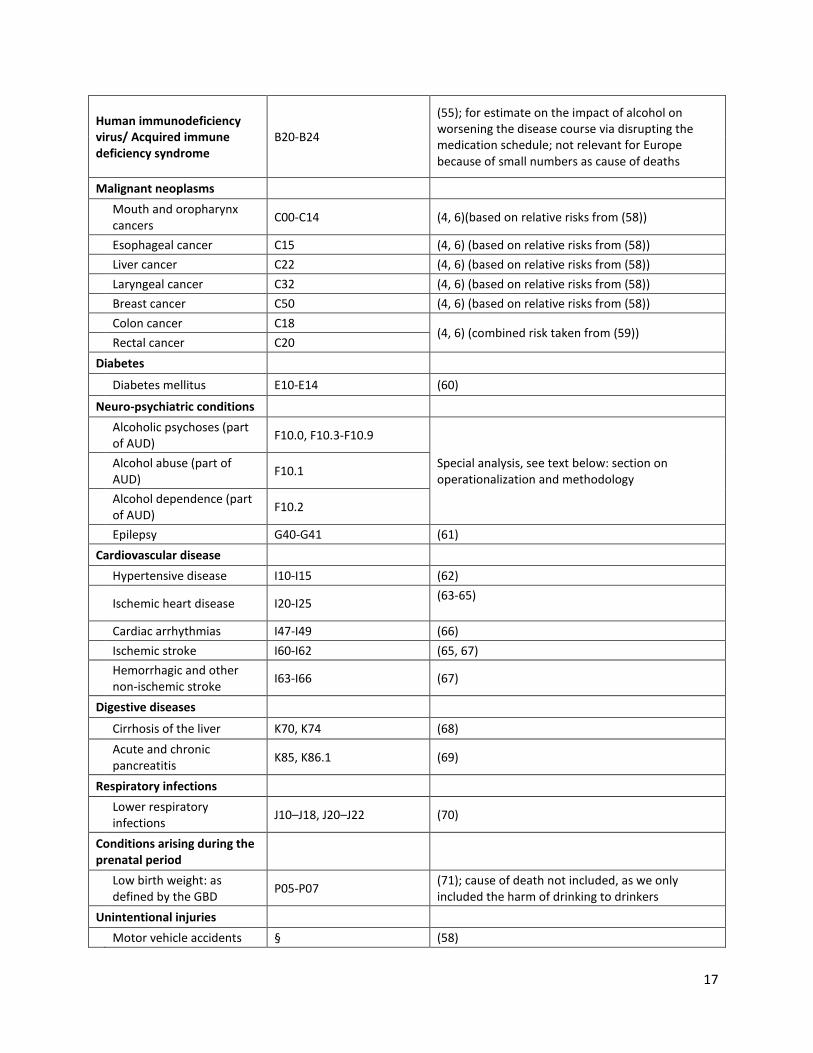
Causes of death causally impacted by different levels of alcohol consumption
Table 1 gives an overview of mortality risks (i.e., disease and injury conditions) causally impacted by alcohol
consumption. The list here is identical to the alcohol-attributable causes of deaths, used as a basis of the Global
Status Report on Alcohol and Health (1), and to the alcohol-attributable causes used in the Global Burden of
Disease Study (22) except the definition of AUD9 and the impact on HIV/AIDS medication (55). The latter is listed
but was not used in our calculations as these risks tend to be very low due to relatively small numbers. In addition
to Table 1, the relative risks by sex and level of drinking can be found in-Appendix Table 3.
Harm to others (low birth weight, traffic fatalities) was also not included, as conceptually low risk drinking
guidelines are intended to inform drinkers about their risks. In our discussion we will consider harm to others and
potential implications for low risk drinking guidelines to protect people other than the drinker.
Table 1: Categories of alcohol-attributable disease and the sources used for determining risk relations
Condition ICD 10 Code Sources on risk relations (for calculating alcohol attributable fractions)
Infectious and parasitic diseases
Tuberculosis A15-A19 (56); for causal relationship see: (57)
8 For comparisons of life expectancy see (53) and http://www.oecd-ilibrary.org/sites/9789264183896-
en/01/01/index.html?itemId=/content/chapter/9789264183896-4-en 9 The 2010 GBD did not include “harmful use of alcohol” or “alcohol abuse” into their calculations due to a
technical error (see definitions of (22)).
17
Human immunodeficiency virus/ Acquired immune deficiency syndrome
B20-B24
(55); for estimate on the impact of alcohol on worsening the disease course via disrupting the medication schedule; not relevant for Europe because of small numbers as cause of deaths
Malignant neoplasms
Mouth and oropharynx cancers
C00-C14 (4, 6)(based on relative risks from (58))
Esophageal cancer C15 (4, 6) (based on relative risks from (58))
Liver cancer C22 (4, 6) (based on relative risks from (58))
Laryngeal cancer C32 (4, 6) (based on relative risks from (58))
Breast cancer C50 (4, 6) (based on relative risks from (58))
Colon cancer C18
(4, 6) (combined risk taken from (59))
Rectal cancer C20
Diabetes
Diabetes mellitus E10-E14 (60)
Neuro-psychiatric conditions
Alcoholic psychoses (part of AUD)
F10.0, F10.3-F10.9
Special analysis, see text below: section on operationalization and methodology
Alcohol abuse (part of AUD)
F10.1
Alcohol dependence (part of AUD)
F10.2
Epilepsy G40-G41 (61)
Cardiovascular disease
Hypertensive disease I10-I15 (62)
Ischemic heart disease I20-I25
(63-65)
Cardiac arrhythmias I47-I49 (66)
Ischemic stroke I60-I62 (65, 67)
Hemorrhagic and other non-ischemic stroke
I63-I66 (67)
Digestive diseases
Cirrhosis of the liver K70, K74 (68)
Acute and chronic pancreatitis
K85, K86.1 (69)
Respiratory infections
Lower respiratory infections
J10–J18, J20–J22 (70)
Conditions arising during the prenatal period
Low birth weight: as defined by the GBD
P05-P07 (71); cause of death not included, as we only included the harm of drinking to drinkers
Unintentional injuries
Motor vehicle accidents § (58)
18
Poisonings X40-X49 (58)
Falls W00-W19 (58)
Fires X00-X09 (58)
Drowning W65-W74 (58)
Other Unintentional injuries
†Rest of V-series and W20-W64, W 75-W99, X10-X39, X50-X59, Y40-Y86, Y88, Y89
(58)
Intentional injuries
(58)
Self-inflicted injuries X60-X84, Y87.0 (58)
Homicide X85-Y09, Y87.1 (58)
§ V021–V029, V031–V039, V041–V049, V092, V093, V123–V129, V133–V139, V143–V149, V194–V196, V203–V209, V213–V219, V223–V229, V233–V239, V243–V249,V253–V259, V263–V269, V273– V279, V283–V289, V294–V299, V304–V309, V314–V319, V324–V329, V334–V339, V344–V349, V354–V359, V364–V369, V374–V379, V384–V389, V394–V399, V404–V409, V414–V419, V424–V429, V434–V439, V444–V449, V454–V459, V464– V469, V474–V479, V484–V489, V494–V499, V504–V509, V514–V519, V524–V529, V534–V539, V544–V549, V554–V559, V564–V569, V574–V579, V584–V589, V594–V599, V604–V609, V614–V619, V624–V629, V634–V639, V644–V649, V654– V659, V664–V669, V674–V679, V684–V689, V694–V699, V704–V709, V714–V719, V724–V729, V734–V739, V744–V749, V754–V759, V764–V769, V774–V779, V784–V789, V794–V799, V803–V805, V811, V821, V830–V833, V840–V843, V850– V853, V860–V863, V870–V878, V892.
†Rest of V = V-series MINUS §.
Methodology for estimating alcohol-attributable mortality risk associated with various levels of drinking
The proportions of alcohol attributable mortality by country, age, sex and cause of death were derived from the Global Status Report on Alcohol and Health ((1) steps 1-2 from Figure 1). Steps 3-4 involved the following calculations.
The risk of mortality was estimated for average level of daily alcohol use. The levels of alcohol use for which calculations were made were taken in steps of 10g of pure alcohol up to 100g, i.e., 10 categories of alcohol consumption starting at 10g and ending at 100g. For all disease categories causally related to alcohol consumption we obtained meta-analyses that evaluated the dose-response relationship between alcohol and the risk of disease mortality (i.e. alcohol mortality relative risk functions) (see Table 1). These relative risk functions (where lifetime abstainers were used as the reference category) were used to calculate the relative risk of mortality for each category of alcohol consumption (see appendix Table 1 for RRs). The following equivalent equation was used to derive the risk of death at each alcohol consumption level and in a given sex-age category. All analyses were conducted first subtracting the current impact of alcohol use to obtain a zero alcohol consumption number of deaths (Deaths_AA_Removediz), by removing the alcohol-attributable deaths (as obtained from the Global Status Report on Alcohol and Health (1)) from all deaths in that cause of death category i (where i is the index of causes of death (disease and injuries) that are causally impacted by alcohol (except AUD)) for a given sex-age group (z). The absolute risk of dying from an alcohol-attributable death in 2012 for any given sex-age group (z), at alcohol consumption level q, was then calculated as follows:
∑
19
Where RRi(q) is the relative risk for mortality at the drinking level q for disease i, DeathsAUD_z is the number of AUD deaths for sex-age group (z), Prev_ADCounterfactual(q) is the prevalence of alcohol dependence (AD) under the counterfactual scenario linked to the alcohol level indexed by q, and Prev_ADCurrent is the current actual prevalence of AD.
Data on the prevalence of AD for countries under current conditions were obtained from (52) and data for counterfactual scenarios were based on alcohol use data among people with AD from the recent APC-Study (not yet published). From this distribution of alcohol consumption among people with alcohol dependence we were able to estimate the distribution of alcohol consumption among people with AD in Europe (as obtained form (52)). Based on this distribution we were able to estimate the probability of a European having AD given an average daily alcohol consumption amount (q). This prevalence of AD was used as the Prev_ADCounterfactual(q).
Age groups were split into five-year intervals starting at 15 years of age. Population data and mortality data were obtained from the World Health Organization [(1) based on Global Health Estimates: http://www.who.int/healthinfo/global_burden_disease/en/ ). All calculations were performed by age group and separately for all countries of interest. Furthermore all calculations were calculated for men and women separately in each country.
There are various potential problems with this approach, which have been dealt with by sensitivity analyses using different assumptions. First, if we used the sex-specific mortality, women would be given too high thresholds. This is because women have, in comparison to men, much higher life-expectancies, i.e. much lower lifetime mortality risk, in all European countries (see (53) and http://www.oecd-
ilibrary.org/sites/9789264183896-en/01/01/index.html?itemId=/content/chapter/9789264183896-4-en). Consequently the analyses would be driven more by their overall mortality risk rather than by their alcohol-attributable relative risk, which increases more quickly with increasing consumption than men’s relative risk. We included an analysis with sex-specific overall mortality risk (sensitivity analysis 1), but for the main analyses we used the same absolute country and age specific zero consumption mortality risk for both sexes combined derived from the mortality and population data of the WHO for the year 2012 (for methodology used see also above).
Second, the mortality risks for alcohol-attributable diseases other than AUD are based on alcohol-attributable fractions, i.e., on the proportion which is caused by alcohol and which would disappear under the assumption of no alcohol use (for explaining the methodology and background see (72-74); for alcohol see (75)). This model could not be employed for AUD, as these are 100% alcohol attributable by definition (see above). So a different methodology had to be applied, essentially multiplying the probability of alcohol dependence, given different levels of drinking (see above). However, there are additional problems with the mortality from AUD: while AUD are associated with a high level of mortality (76-78), they usually do not appear as a major underlying cause of death in European or global statistics for many reasons including insurance and stigmatization (i.e., insurance in some European countries will not pay, if death is “self-afflicted” by alcoholism; about the stigmatization associated with AUD see (79)).
Third, while the procedure of first removing deaths estimated to be alcohol-attributable successfully removes some of the impact by patterns of drinking (e.g., some of the impact on injury (80) and ischemic heart disease (81)), we suspect that other impacts of patterns of drinking can be found in the country-specific overall mortality even in the zero consumption mortality model, i.e., the . An example here would be the high proportion of misclassified alcohol poisoning deaths in Estonia (82, 83). In other
20
words: the country differences in overall mortality risk allow us to check on the stability of results from different perspectives.
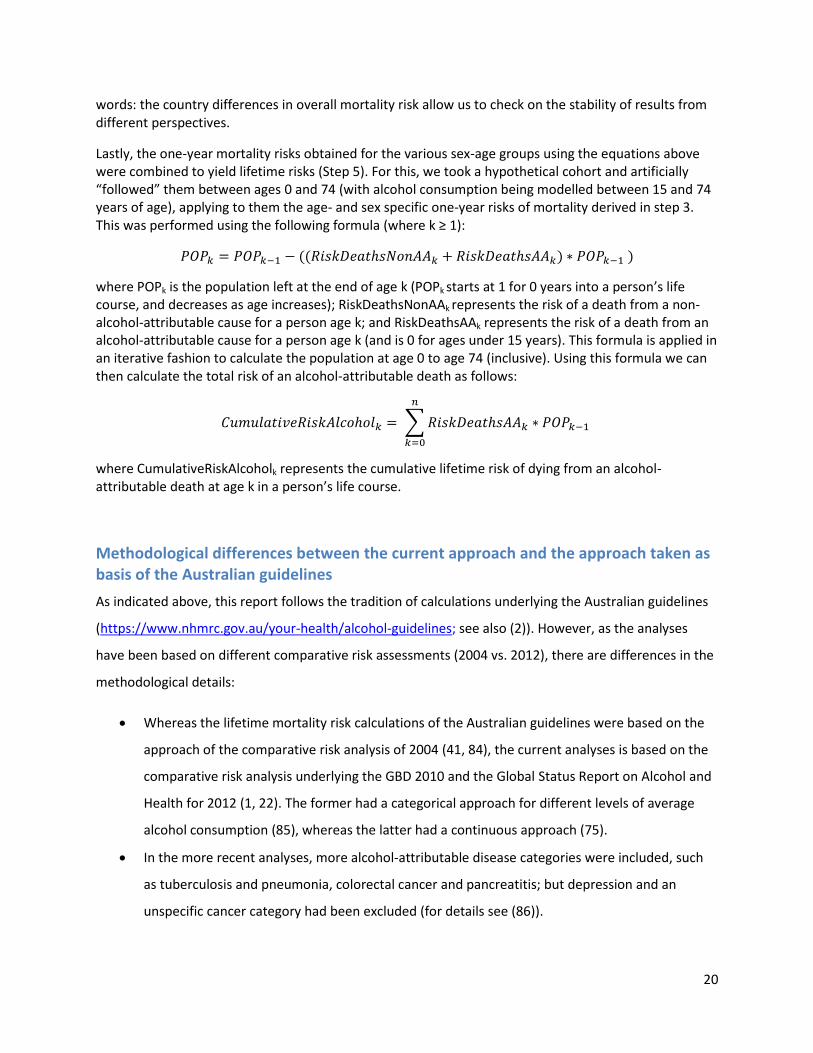
Lastly, the one-year mortality risks obtained for the various sex-age groups using the equations above were combined to yield lifetime risks (Step 5). For this, we took a hypothetical cohort and artificially “followed” them between ages 0 and 74 (with alcohol consumption being modelled between 15 and 74 years of age), applying to them the age- and sex specific one-year risks of mortality derived in step 3. This was performed using the following formula (where k ≥ 1):
where POPk is the population left at the end of age k (POPk starts at 1 for 0 years into a person’s life course, and decreases as age increases); RiskDeathsNonAAk represents the risk of a death from a non-alcohol-attributable cause for a person age k; and RiskDeathsAAk represents the risk of a death from an alcohol-attributable cause for a person age k (and is 0 for ages under 15 years). This formula is applied in an iterative fashion to calculate the population at age 0 to age 74 (inclusive). Using this formula we can then calculate the total risk of an alcohol-attributable death as follows:
∑
where CumulativeRiskAlcoholk represents the cumulative lifetime risk of dying from an alcohol-attributable death at age k in a person’s life course.
Methodological differences between the current approach and the approach taken as basis of the Australian guidelines
As indicated above, this report follows the tradition of calculations underlying the Australian guidelines
(https://www.nhmrc.gov.au/your-health/alcohol-guidelines; see also (2)). However, as the analyses
have been based on different comparative risk assessments (2004 vs. 2012), there are differences in the
methodological details:
Whereas the lifetime mortality risk calculations of the Australian guidelines were based on the
approach of the comparative risk analysis of 2004 (41, 84), the current analyses is based on the
comparative risk analysis underlying the GBD 2010 and the Global Status Report on Alcohol and
Health for 2012 (1, 22). The former had a categorical approach for different levels of average
alcohol consumption (85), whereas the latter had a continuous approach (75).
In the more recent analyses, more alcohol-attributable disease categories were included, such
as tuberculosis and pneumonia, colorectal cancer and pancreatitis; but depression and an
unspecific cancer category had been excluded (for details see (86)).
21
In the present report, the method to include injury was based on the relationship between daily
average level of alcohol consumption in the lifetime mortality risks, and reported acute
relationships separately on an event basis (see below), whereas calculations conducted for the
Australian guidelines were based on acute risks for the lifetime risks of injuries as well resulting
in two different sets of lifetime risks (https://www.nhmrc.gov.au/your-health/alcohol-
guidelines; see also (2, 10, 33, 34)).
Selection of acceptable thresholds for lifetime risk caused by alcohol consumption
The following conclusions are taken from the classic 1969 paper of Starr ((17); p. 1237):
(i) The indications are that the public is willing to accept "voluntary" risks roughly 1,000 times
greater than "in-voluntary" risks.
(ii) The statistical risk of death from disease appears to be a psychological yardstick for
establishing the level of acceptability of other risks.
(iii) The acceptability of risk appears to be crudely proportional to the third power of the
benefits (real or imagined).
(iv) The social acceptance of risk is directly influenced by public awareness of the benefits of an
activity, as determined by advertising, usefulness, and the number of people participating.
These conclusions are highly relevant for guidelines for alcohol consumption. Many of the fully
involuntary risks such as unsafe water provided to a household have acceptable risk thresholds of 1 in
one million (or 1 : 1,000,000; or 1 : 106; see also (19)). Indeed, the 1 in one million lifetime mortality risk
has become something like a gold standard of acceptable risk for involuntary exposure and has been
used in different areas such as water safety in Australia or the US (87, 88) or for increases of exposure to
carcinogens in air, sediment or soil (89). It should be noted that other standards have been used, and
sometimes we see ranges such as 1 in a million to as 1 in 100,000 (see also
http://www.safedriver.gr/studies/KINDYNOS/THE%20MYTH%20OF%2010-
6%20AS%20A%20DEFINITION%20OF%20ACCEPTABLE%20RISK.pdf ).
Applying the above to determine a threshold for voluntary lifetime mortality risks experienced by the
drinker themselves, a threshold of 1 in 1,000 lifetime mortality risk would result. We will additionally
apply a much less conservative risk of 1 in 100 in the below, and discuss these numbers in light of
empirical evidence of acceptable risk. For involuntary risks to others than the drinkers (90, 91), we will

22
apply a risk of 1 in a million to 1 in 100,000, analogously to the risks used by US Environmental
Protection Agency (see (89)).
23
Results
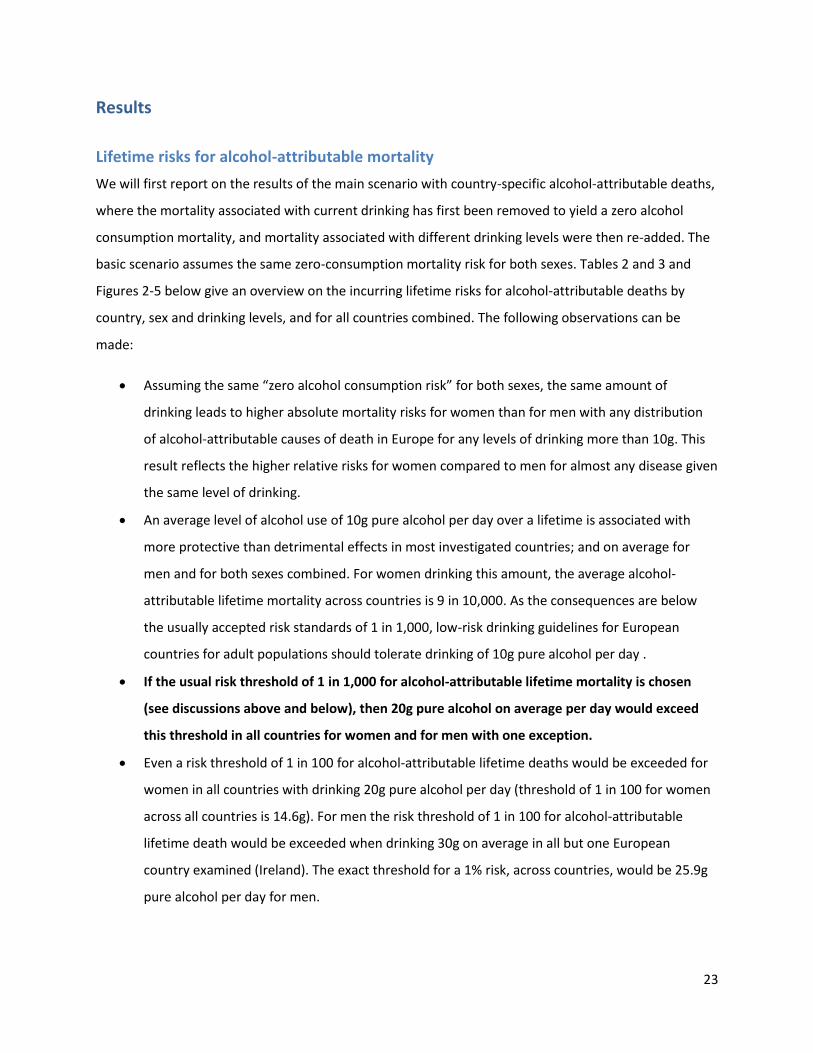
Lifetime risks for alcohol-attributable mortality
We will first report on the results of the main scenario with country-specific alcohol-attributable deaths,
where the mortality associated with current drinking has first been removed to yield a zero alcohol
consumption mortality, and mortality associated with different drinking levels were then re-added. The
basic scenario assumes the same zero-consumption mortality risk for both sexes. Tables 2 and 3 and
Figures 2-5 below give an overview on the incurring lifetime risks for alcohol-attributable deaths by
country, sex and drinking levels, and for all countries combined. The following observations can be
made:
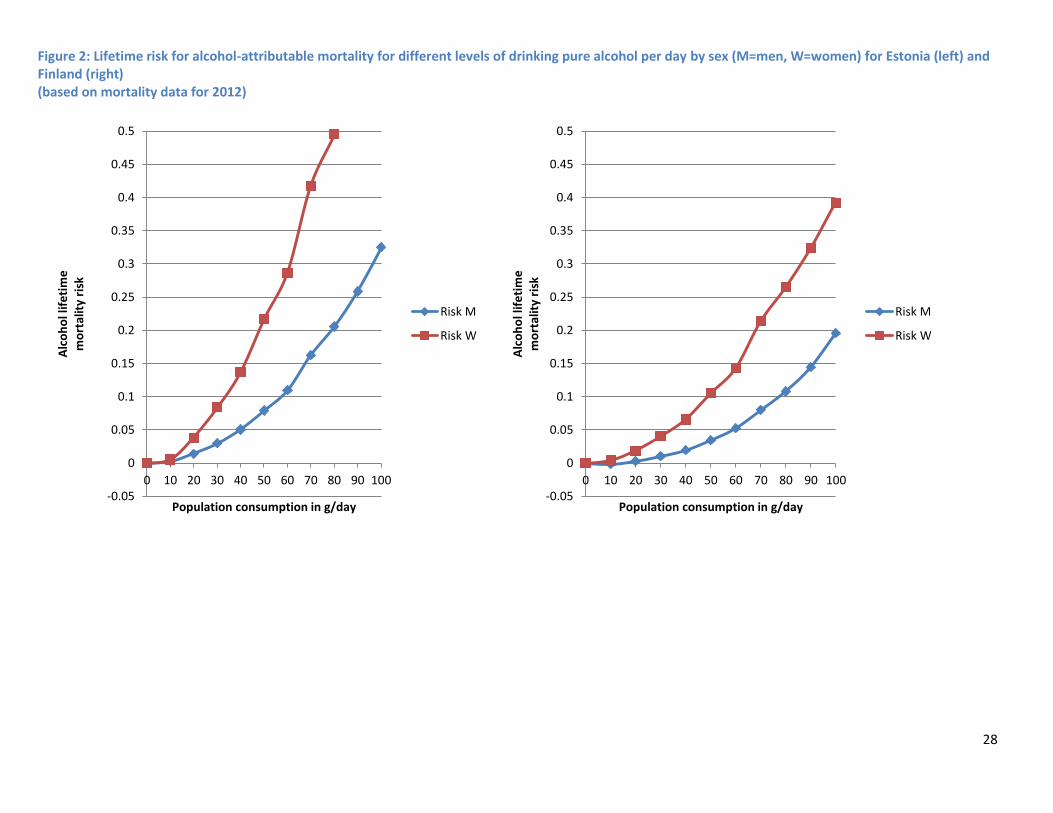
Assuming the same “zero alcohol consumption risk” for both sexes, the same amount of
drinking leads to higher absolute mortality risks for women than for men with any distribution
of alcohol-attributable causes of death in Europe for any levels of drinking more than 10g. This
result reflects the higher relative risks for women compared to men for almost any disease given
the same level of drinking.
An average level of alcohol use of 10g pure alcohol per day over a lifetime is associated with
more protective than detrimental effects in most investigated countries; and on average for
men and for both sexes combined. For women drinking this amount, the average alcohol-
attributable lifetime mortality across countries is 9 in 10,000. As the consequences are below
the usually accepted risk standards of 1 in 1,000, low-risk drinking guidelines for European
countries for adult populations should tolerate drinking of 10g pure alcohol per day .
If the usual risk threshold of 1 in 1,000 for alcohol-attributable lifetime mortality is chosen
(see discussions above and below), then 20g pure alcohol on average per day would exceed
this threshold in all countries for women and for men with one exception.
Even a risk threshold of 1 in 100 for alcohol-attributable lifetime deaths would be exceeded for
women in all countries with drinking 20g pure alcohol per day (threshold of 1 in 100 for women
across all countries is 14.6g). For men the risk threshold of 1 in 100 for alcohol-attributable
lifetime death would be exceeded when drinking 30g on average in all but one European
country examined (Ireland). The exact threshold for a 1% risk, across countries, would be 25.9g
pure alcohol per day for men.

24
As indicated above, the results of Table 2 reflect the main scenario of our modelling, where the same
country specific non-alcohol-attributable mortality rates were applied to both sexes, and the risk
associated with different levels of drinking were added on top of this.
25
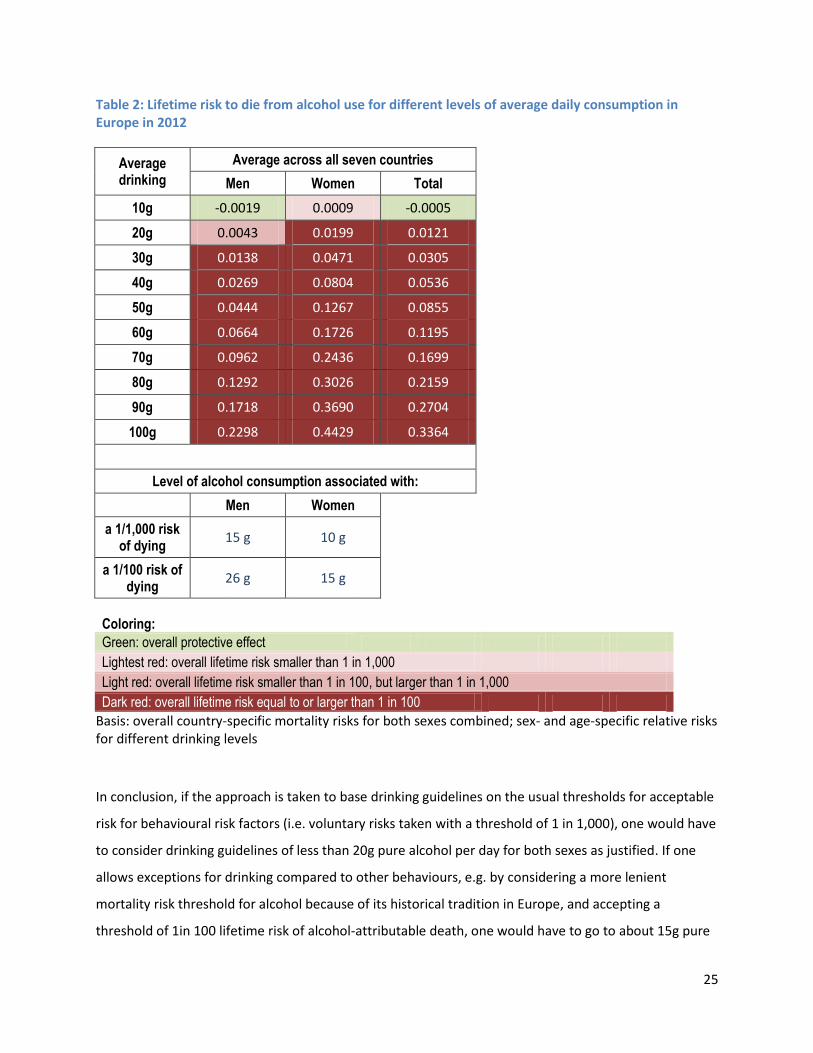
Table 2: Lifetime risk to die from alcohol use for different levels of average daily consumption in Europe in 2012
Average drinking
Average across all seven countries
Men Women Total
10g -0.0019 0.0009 -0.0005
20g 0.0043 0.0199 0.0121
30g 0.0138 0.0471 0.0305
40g 0.0269 0.0804 0.0536
50g 0.0444 0.1267 0.0855
60g 0.0664 0.1726 0.1195
70g 0.0962 0.2436 0.1699
80g 0.1292 0.3026 0.2159
90g 0.1718 0.3690 0.2704
100g 0.2298 0.4429 0.3364
Level of alcohol consumption associated with:
Men Women
a 1/1,000 risk of dying
15 g 10 g
a 1/100 risk of dying
26 g 15 g
Coloring:
Green: overall protective effect
Lightest red: overall lifetime risk smaller than 1 in 1,000
Light red: overall lifetime risk smaller than 1 in 100, but larger than 1 in 1,000
Dark red: overall lifetime risk equal to or larger than 1 in 100 Basis: overall country-specific mortality risks for both sexes combined; sex- and age-specific relative risks for different drinking levels
In conclusion, if the approach is taken to base drinking guidelines on the usual thresholds for acceptable
risk for behavioural risk factors (i.e. voluntary risks taken with a threshold of 1 in 1,000), one would have
to consider drinking guidelines of less than 20g pure alcohol per day for both sexes as justified. If one
allows exceptions for drinking compared to other behaviours, e.g. by considering a more lenient
mortality risk threshold for alcohol because of its historical tradition in Europe, and accepting a
threshold of 1in 100 lifetime risk of alcohol-attributable death, one would have to go to about 15g pure

26
alcohol per day as a threshold for women, and to 26g as threshold for men. However, modern high-
income societies do usually not accept any risks that high for voluntary behaviour not considered
necessary for survival.
27
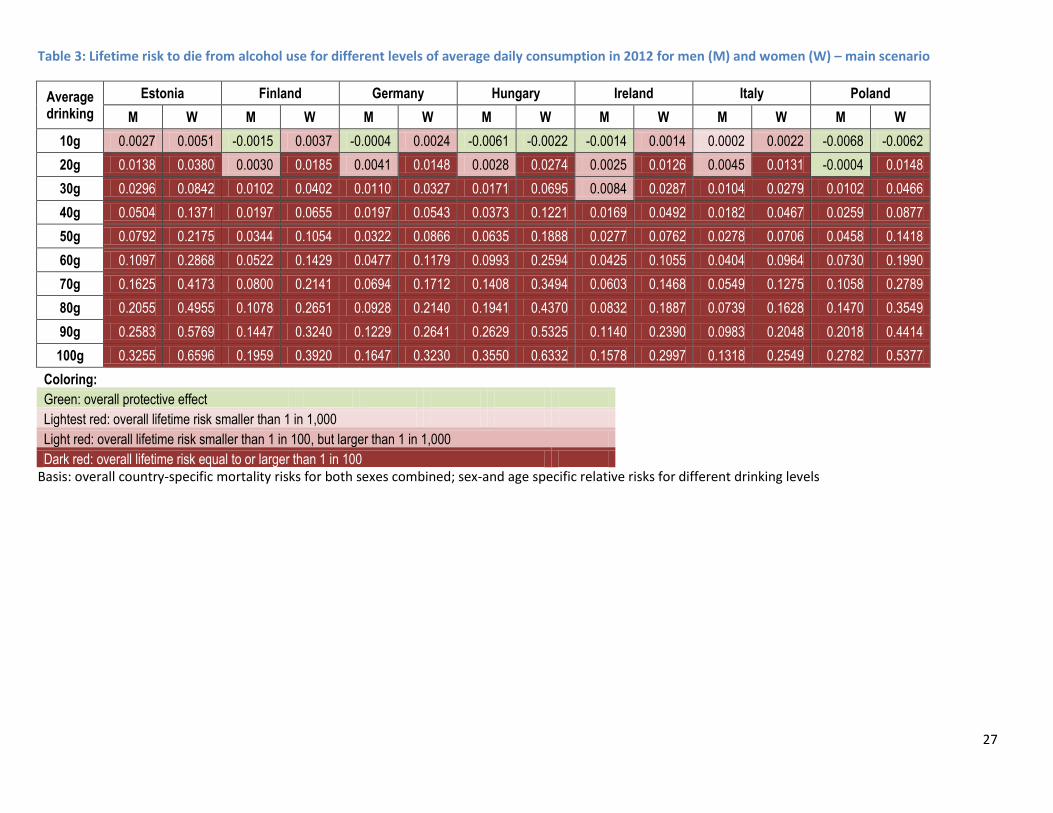
Table 3: Lifetime risk to die from alcohol use for different levels of average daily consumption in 2012 for men (M) and women (W) – main scenario
Average drinking
Estonia Finland Germany Hungary Ireland Italy Poland
M W M W M W M W M W M W M W
10g 0.0027 0.0051 -0.0015 0.0037 -0.0004 0.0024 -0.0061 -0.0022 -0.0014 0.0014 0.0002 0.0022 -0.0068 -0.0062
20g 0.0138 0.0380 0.0030 0.0185 0.0041 0.0148 0.0028 0.0274 0.0025 0.0126 0.0045 0.0131 -0.0004 0.0148
30g 0.0296 0.0842 0.0102 0.0402 0.0110 0.0327 0.0171 0.0695 0.0084 0.0287 0.0104 0.0279 0.0102 0.0466
40g 0.0504 0.1371 0.0197 0.0655 0.0197 0.0543 0.0373 0.1221 0.0169 0.0492 0.0182 0.0467 0.0259 0.0877
50g 0.0792 0.2175 0.0344 0.1054 0.0322 0.0866 0.0635 0.1888 0.0277 0.0762 0.0278 0.0706 0.0458 0.1418
60g 0.1097 0.2868 0.0522 0.1429 0.0477 0.1179 0.0993 0.2594 0.0425 0.1055 0.0404 0.0964 0.0730 0.1990
70g 0.1625 0.4173 0.0800 0.2141 0.0694 0.1712 0.1408 0.3494 0.0603 0.1468 0.0549 0.1275 0.1058 0.2789
80g 0.2055 0.4955 0.1078 0.2651 0.0928 0.2140 0.1941 0.4370 0.0832 0.1887 0.0739 0.1628 0.1470 0.3549
90g 0.2583 0.5769 0.1447 0.3240 0.1229 0.2641 0.2629 0.5325 0.1140 0.2390 0.0983 0.2048 0.2018 0.4414
100g 0.3255 0.6596 0.1959 0.3920 0.1647 0.3230 0.3550 0.6332 0.1578 0.2997 0.1318 0.2549 0.2782 0.5377
Coloring: Green: overall protective effect
Lightest red: overall lifetime risk smaller than 1 in 1,000
Light red: overall lifetime risk smaller than 1 in 100, but larger than 1 in 1,000
Dark red: overall lifetime risk equal to or larger than 1 in 100 Basis: overall country-specific mortality risks for both sexes combined; sex-and age specific relative risks for different drinking levels
28
Figure 2: Lifetime risk for alcohol-attributable mortality for different levels of drinking pure alcohol per day by sex (M=men, W=women) for Estonia (left) and Finland (right) (based on mortality data for 2012)
-0.05
0
0.05
0.1
0.15
0.2
0.25
0.3
0.35
0.4
0.45
0.5
0 10 20 30 40 50 60 70 80 90 100
Alc
oh
ol l
ife
tim
e
mo
rtal
ity
risk
Population consumption in g/day
Risk M
Risk W
-0.05
0
0.05
0.1
0.15
0.2
0.25
0.3
0.35
0.4
0.45
0.5
0 10 20 30 40 50 60 70 80 90 100
Alc
oh
ol l
ife
tim
e
mo
rtal
ity
risk
Population consumption in g/day
Risk M
Risk W
29
Figure 3: Lifetime risk for alcohol-attributable mortality for different levels of drinking pure alcohol per day by sex (M=men, W=women) for Germany (left) and Hungary (right) (based on mortality data for 2012)
-0.05
0
0.05
0.1
0.15
0.2
0.25
0.3
0.35
0.4
0.45
0.5
0 10 20 30 40 50 60 70 80 90 100
Alc
oh
ol l
ife
tim
e
mo
rtal
ity
risk
Population consumption in g/day
Risk M
Risk W
-0.05
0
0.05
0.1
0.15
0.2
0.25
0.3
0.35
0.4
0.45
0.5
0 10 20 30 40 50 60 70 80 90 100
Alc
oh
ol l
ife
tim
e
mo
rtal
ity
risk
Population consumption in g/day
Risk M
Risk W
30
Figure 4: Lifetime risk for alcohol-attributable mortality for different levels of drinking pure alcohol per day by sex (M= men, W= women) for Ireland (based on mortality data for 2012)
-0.05
0
0.05
0.1
0.15
0.2
0.25
0.3
0.35
0.4
0.45
0.5
0 10 20 30 40 50 60 70 80 90 100
Alc
oh
ol l
ife
tim
e
mo
rtal
ity
risk
Population consumption in g/day
Risk M
Risk W
31
Figure 5: Lifetime risk for alcohol-attributable mortality for different levels of drinking pure alcohol per day by sex (M=men, W=women) for Italy (left) and Poland (right) (based on mortality data for 2012)
-0.05
0
0.05
0.1
0.15
0.2
0.25
0.3
0.35
0.4
0.45
0.5
0 10 20 30 40 50 60 70 80 90 100
Alc
oh
ol l
ife
tim
e
mo
rtal
ity
risk
Population consumption in g/day
Risk M
Risk W
-0.05
0
0.05
0.1
0.15
0.2
0.25
0.3
0.35
0.4
0.45
0.5
0 10 20 30 40 50 60 70 80 90 100
Alc
oh
ol l
ife
tim
e
mo
rtal
ity
risk
Population consumption in g/day
Risk M
Risk W
32
Results of the sensitivity analyses
Sensitivity analysis 1 using sex-specific mortality
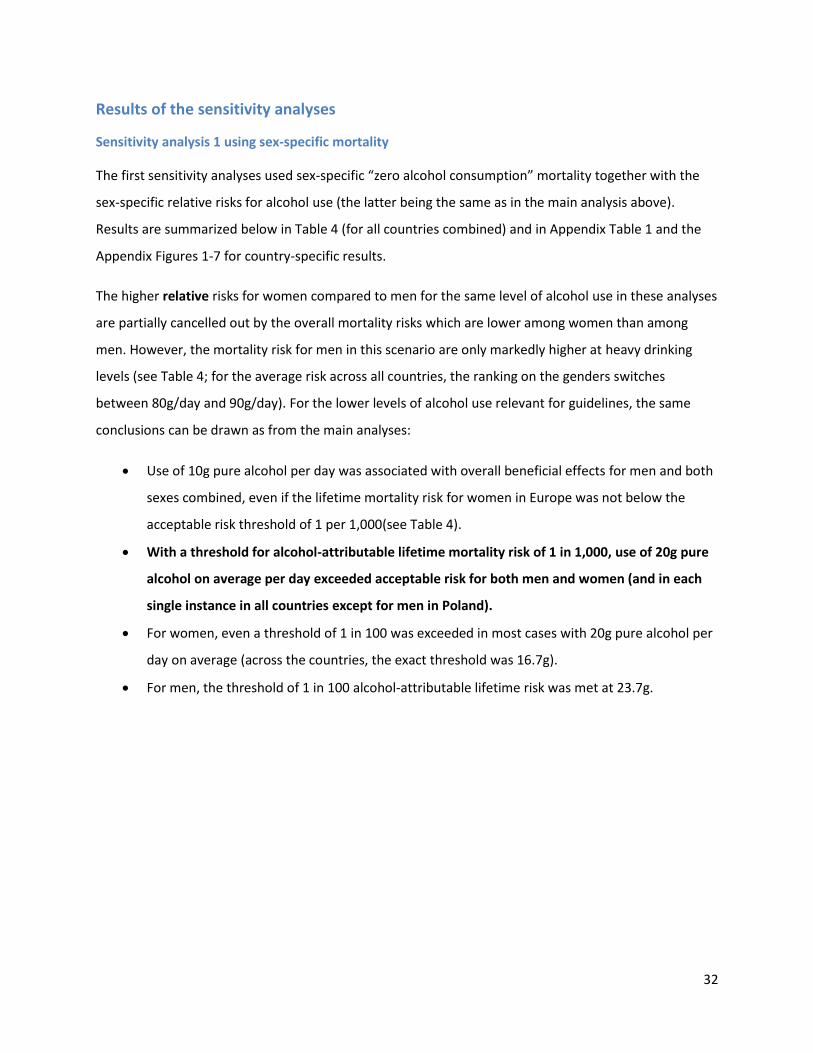
The first sensitivity analyses used sex-specific “zero alcohol consumption” mortality together with the
sex-specific relative risks for alcohol use (the latter being the same as in the main analysis above).
Results are summarized below in Table 4 (for all countries combined) and in Appendix Table 1 and the
Appendix Figures 1-7 for country-specific results.
The higher relative risks for women compared to men for the same level of alcohol use in these analyses
are partially cancelled out by the overall mortality risks which are lower among women than among
men. However, the mortality risk for men in this scenario are only markedly higher at heavy drinking
levels (see Table 4; for the average risk across all countries, the ranking on the genders switches
between 80g/day and 90g/day). For the lower levels of alcohol use relevant for guidelines, the same
conclusions can be drawn as from the main analyses:
Use of 10g pure alcohol per day was associated with overall beneficial effects for men and both
sexes combined, even if the lifetime mortality risk for women in Europe was not below the
acceptable risk threshold of 1 per 1,000(see Table 4).
With a threshold for alcohol-attributable lifetime mortality risk of 1 in 1,000, use of 20g pure
alcohol on average per day exceeded acceptable risk for both men and women (and in each
single instance in all countries except for men in Poland).
For women, even a threshold of 1 in 100 was exceeded in most cases with 20g pure alcohol per
day on average (across the countries, the exact threshold was 16.7g).
For men, the threshold of 1 in 100 alcohol-attributable lifetime risk was met at 23.7g.
33
Table 4: Lifetime risk to die from alcohol use for different levels of average daily consumption in Europe in 2012 – (sensitivity analyses with sex-specific mortality and with alcohol-attributable deaths of current drinking patterns removed and then alcohol-attributable deaths for specific drinking levels added)
Average drinking
Average across all seven countries
Men Women Total
10g -0.0040 0.0016 -0.0012
20g 0.0048 0.0141 0.0094
30g 0.0187 0.0312 0.0249
40g 0.0381 0.0522 0.0452
50g 0.0643 0.0804 0.0724
60g 0.0970 0.1097 0.1034
70g 0.1412 0.1518 0.1465
80g 0.1887 0.1911 0.1899
90g 0.2493 0.2366 0.2429
100g 0.3293 0.2891 0.3092
Level of alcohol consumption associated with:
Men Women
a 1/1,000 risk of dying
16 g 10 g
a 1/100 risk of dying
24 g 17 g
Coloring: Green: overall protective effect
Lightest red: overall lifetime risk smaller than 1 in 1,000
Light red: overall lifetime risk smaller than 1 in 100, but larger than 1 in 1,000
Dark red: overall lifetime risk equal to or larger than 1 in 100
Basis: country-specific mortality risks for both sexes combined; sex-and age specific relative risks for different drinking levels
Sensitivity analysis 2 using combined mortality but additionally adjusting for competing risks from non-alcohol-attributable deaths
Table 5 and Appendix Table 2 provide an overview of the results with the deaths from competing risks
(mortality from causes other than alcohol) being taken out. This method takes into account that if a
person dies from a cause other than that attributable alcohol, they can not die again of alcohol (i.e in
34
the unadjusted model mortality from other causes during a person’s life course are not taken into
account). The impact of accounting for mortality not caused by alcohol, increases with age, but as 75
years is still below the average life expectancy for both sexes in the EU (although barely for men;
http://www.oecd-ilibrary.org/sites/9789264183896-en/01/01/g1-01-
01.html?itemId=/content/chapter/9789264183896-4-en&_csp_=9e67b2c8fa06d751ee4c494e32bfe3da)
this effect would further increase if a life course of 76 years or more were modelled. However, while
these analyses changed the results a lot for heavier drinking (lower proportions of deaths being caused
by alcohol; see country specific graphs in Appendix Figures 7-12), the main conclusions with respect to
low-risk drinking guidelines remain unchanged (Table 5):
Use of 10g pure alcohol per day is often estimated to have a beneficial effect, dependent on sex
and country, and overall leads to a mortality risk below the thresholds of acceptable risk.
For women as well as men, the use of 20g pure alcohol per day would exceed the threshold of
1 in 1,000 of lifetime risk for alcohol-attributable death.
If a threshold of 1 in 100 is applied, consuming 20g would still exceed that threshold for women,
but not for men. The exact amounts of pure alcohol to reach risk of alcohol-attributable
mortality of 1 in 100 would be 19.1g for women and 25.6g for men.
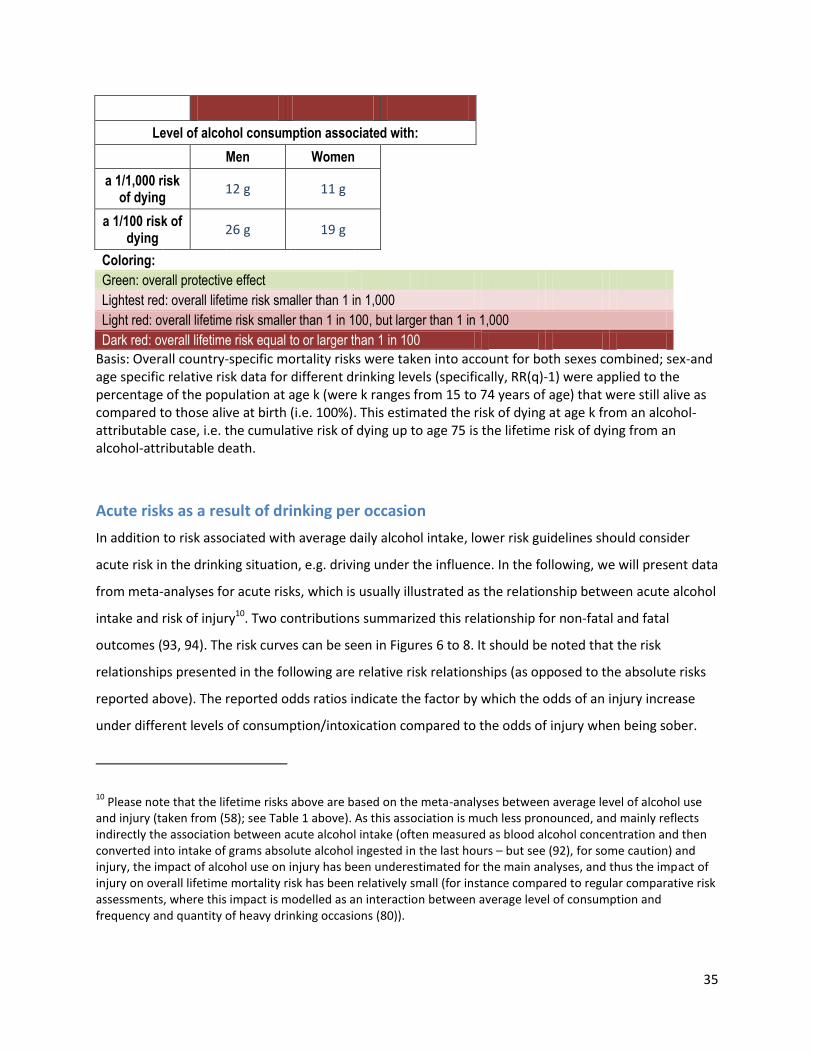
Table 5: Lifetime risk to die from alcohol use for different levels of average daily consumption in Europe in 2012 – (sensitivity analyses with sex-combined mortality and with alcohol-attributable deaths of current drinking patterns removed and then alcohol-attributable deaths for specific drinking levels added; competing risks adjusted)
Average drinking
Average across all seven countries
Men Women Total
10g 0.0001 -0.0007 -0.0003
20g 0.0059 0.0110 0.0084
30g 0.0132 0.0268 0.0200
40g 0.0218 0.0431 0.0324
50g 0.0338 0.0652 0.0495
60g 0.0466 0.0801 0.0634
70g 0.0650 0.1123 0.0887
80g 0.0780 0.1252 0.1016
90g 0.0904 0.1368 0.1136
100g 0.1018 0.1470 0.1244
35
Level of alcohol consumption associated with:
Men Women
a 1/1,000 risk of dying
12 g 11 g
a 1/100 risk of dying
26 g 19 g
Coloring:
Green: overall protective effect
Lightest red: overall lifetime risk smaller than 1 in 1,000
Light red: overall lifetime risk smaller than 1 in 100, but larger than 1 in 1,000
Dark red: overall lifetime risk equal to or larger than 1 in 100 Basis: Overall country-specific mortality risks were taken into account for both sexes combined; sex-and age specific relative risk data for different drinking levels (specifically, RR(q)-1) were applied to the percentage of the population at age k (were k ranges from 15 to 74 years of age) that were still alive as compared to those alive at birth (i.e. 100%). This estimated the risk of dying at age k from an alcohol-attributable case, i.e. the cumulative risk of dying up to age 75 is the lifetime risk of dying from an alcohol-attributable death.
Acute risks as a result of drinking per occasion
In addition to risk associated with average daily alcohol intake, lower risk guidelines should consider
acute risk in the drinking situation, e.g. driving under the influence. In the following, we will present data
from meta-analyses for acute risks, which is usually illustrated as the relationship between acute alcohol
intake and risk of injury10. Two contributions summarized this relationship for non-fatal and fatal
outcomes (93, 94). The risk curves can be seen in Figures 6 to 8. It should be noted that the risk
relationships presented in the following are relative risk relationships (as opposed to the absolute risks
reported above). The reported odds ratios indicate the factor by which the odds of an injury increase
under different levels of consumption/intoxication compared to the odds of injury when being sober.
10 Please note that the lifetime risks above are based on the meta-analyses between average level of alcohol use
and injury (taken from (58); see Table 1 above). As this association is much less pronounced, and mainly reflects indirectly the association between acute alcohol intake (often measured as blood alcohol concentration and then converted into intake of grams absolute alcohol ingested in the last hours – but see (92), for some caution) and injury, the impact of alcohol use on injury has been underestimated for the main analyses, and thus the impact of injury on overall lifetime mortality risk has been relatively small (for instance compared to regular comparative risk assessments, where this impact is modelled as an interaction between average level of consumption and frequency and quantity of heavy drinking occasions (80)).
36
Figure 6: Dose-response curve for the amount of alcohol consumed 3 hours prior and the odds of injury other than motor vehicle accident injury (from Taylor et al., 2010)
Figure 7: Dose-response curve for the amount of alcohol consumed 3 hours prior and the odds of motor vehicle accident injury (from Taylor et al., 2010).
37
Figure 8: Dose-response curve for the blood alcohol concentration (BAC) levels and the odds of fatal motor vehicle Injury for BAC levels from 0 to 0.24% (from Taylor et al., 2012)
To summarize the results:
The relationship between alcohol use before injury and the risk of injury is exponential, with
considerably elevated risk at higher levels.
However, even at lower levels of consumption, there is significantly elevated risk, and no
indication for a protective effect.
These results are in line with biological research on the effects of low dose consumption on
psychomotor skills and other behavioural effects of the central nervous system (95). The general
result of a causal impact of prior alcohol use on injuries has also been corroborated by other
reviews and meta-analyses (96-100).
Further considerations about variability of drinking – alcohol free days
Alcohol-free days are part of several guidelines (e.g., (101), and are currently discussed as part of the
revision of the UK guidelines (http://www.nhs.uk/change4life/Pages/alcohol-lower-risk-guidelines-
units.aspx ). The scientific basis for alcohol-free days is scarce, especially for light to moderate drinking.
Walsh and Rehm (1996)(43) found lower mortality risk if the same amount of alcohol was spread over all
38
days compared to fewer days. However, daily drinking has long been considered a risk for AUD (for
instance, (102). Also, there are good indications that for heavier drinking, alcohol-free days result in less
mortality, in part due to relieving liver functions (103).
Considerations of heterogeneity between people, and consequences for low-risk drinking guidelines
So far, we have concentrated exclusively on population numbers derived on the basis of meta-analyses.
This approach is valid as a basis for low-risk guidelines for populations, and we have already pointed to
potential differences by sex, which did mainly play a role for higher levels of consumption, but not for
the general conclusion that usual acceptable lifetime mortality risks are exceeded with 20g pure alcohol
per day for both sexes, which is less than two standard drinks for many European countries (most
notable exception UK; for standard drinks size see (104, 105)), and probably less than two poured
standard drinks in almost all European countries.
What other characteristics impact on consequences of drinking and what role do they play for
considerations of low risk drinking guidelines:
The country-specific alcohol consumption risks were based on alcohol relative risks that did not take into
account genetic differences. For example, some individuals have a certain type of a gene that causes a
flushing response (i.e. their face turns red) when they consume alcohol. This flushing response is due to
a reduced breakdown of acetaldehyde after alcohol consumption (106). The genetic difference that
leads to the flushing response may also lead to differences in how much alcohol people consume (107),
and subsequent differences in risk for alcohol-attributable diseases (107, 108). However, the proportion
of the total population with the type of gene that leads to the flushing response is low in Europe (109),
and thus the limitation of the relative risks not accounting for this genetic difference will likely have a
negligible effect on the country level risks. Other genetic constellations impacting systematically on
relative risks of drinking relevant for the population level in Europe are not known.
The detrimental effects of alcohol do not only depend on the amount of pure alcohol consumed but on
the resulting blood alcohol concentration and thereby the degree to which organs and tissues are
exposed to alcohol. The blood alcohol concentration resulting from a certain alcohol intake is associated
with body size. Would it therefore be useful to include body size stratifications in lower risk guidelines?
In fact, blood alcohol concentration is also determined by body water content, body weight, body fat,
the pace of metabolism and many other factors (110-112). Gender differences in the effects of alcohol
39
consumption partially go back to systematic differences in those parameters (112). Beyond that, the
blood alcohol concentration may be determined by the specific beverage, over and above its alcohol
content (113), again differing by gender. Beyond those individual factors blood alcohol concentration
and toxicity of alcohol depend on situational factors as being ‘fed or fasted’ (114). Overall the effects of
alcohol on each individual are determined by many other factors than just the pure alcohol consumed.
However, in order to be useful, guidelines should be concise, clear and easy to remember. Therefore we
do not recommend including measures as body size or weight into new lower risk guidelines.
40
Discussion
If the threshold for alcohol-attributable lifetime mortality risk is chosen to be 1 in 1,000, which seems to
be the standard for other voluntary risks in modern high-income societies, then drinking 20g pure
alcohol per day exceeds this threshold for both sexes. This result is consistent for the different European
countries examined in the main analysis and both sensitivity analyses. Even if a considerably more
lenient lifetime mortality threshold of 1 per 100 was introduced, the guidelines for women would
recommend values lower than 20g of pure alcohol per day and those for men less than 30g per day.
However, there does not seem to be a good justification for such high thresholds, since alcohol use is a
voluntary behaviour, i.e., neither necessary as part of diet nor as part of any needs to survive. The
present results corroborate the finding, that overall modern high-income societies accept higher
thresholds for mortality risks from alcohol use compared to other voluntary risk factors (19), which is
also reflected in current lower risk drinking guidelines in Europe.
As indicated above, two different sensitivity analyses were carried out. The first was based on sex-
specific mortality risks, and the second took into consideration competing risks in a more conservative
way. Both of these scenarios to test the stability of our finding arrived at similar conclusions for the
average levels of drinking to reach predetermined acceptable thresholds, while for higher use levels, the
differences between scenarios grew. It should be stressed, that lifetime mortality risk associated with
drinking at higher levels (e.g., 50g pure alcohol per day and above) would be similar or exceed the
lifetime risk of smoking (115, 116)11.
It would be an interesting exercise to base low risk drinking guidelines on involuntary risk. From the
sparse research on mortality and morbidity caused by others’ drinking from Australia, it seems that even
the yearly risks of current drinking patterns in this country would exceed lifetime acceptable risk
thresholds for involuntary behaviour. Thus, for the year 2008, an Australian study (117) found a yearly
burden of 367 deaths and almost 14,000 hospitalizations due to drinking by others, indicating a yearly
risk of higher than 1 in 100,000 for mortality, and about 0.5 per 1,000 for hospitalizations, clearly much
higher than the usually accepted involuntary risk thresholds stated above (i.e., 1 in 1,000,000 lifetime;
11 This does not mean that the deaths of current drinking in Europe exceed the deaths of smoking for two reasons:
1) A smaller proportion of the population drinks 50g or above compared to the prevalence of smoking. 2) The analyses here are restricted to 75 years of age. Many of the smoking attributable deaths occur later than this age.
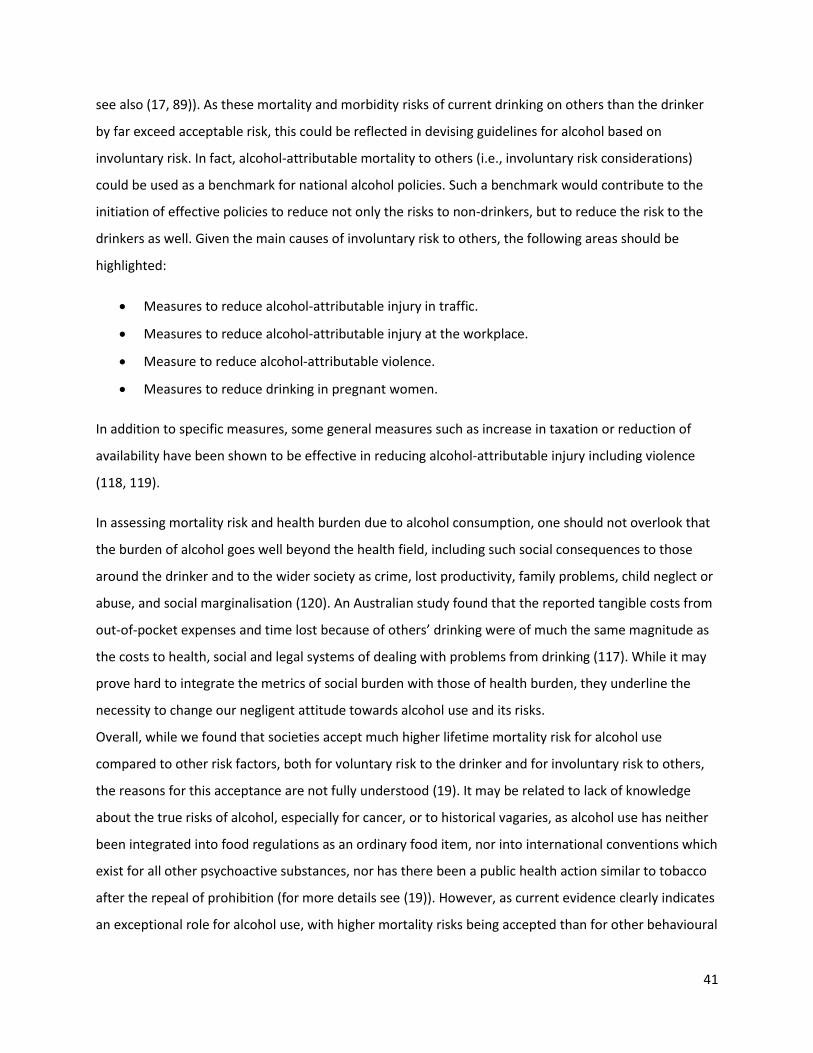
41
see also (17, 89)). As these mortality and morbidity risks of current drinking on others than the drinker
by far exceed acceptable risk, this could be reflected in devising guidelines for alcohol based on
involuntary risk. In fact, alcohol-attributable mortality to others (i.e., involuntary risk considerations)
could be used as a benchmark for national alcohol policies. Such a benchmark would contribute to the
initiation of effective policies to reduce not only the risks to non-drinkers, but to reduce the risk to the
drinkers as well. Given the main causes of involuntary risk to others, the following areas should be
highlighted:
Measures to reduce alcohol-attributable injury in traffic.
Measures to reduce alcohol-attributable injury at the workplace.
Measure to reduce alcohol-attributable violence.
Measures to reduce drinking in pregnant women.
In addition to specific measures, some general measures such as increase in taxation or reduction of
availability have been shown to be effective in reducing alcohol-attributable injury including violence
(118, 119).
In assessing mortality risk and health burden due to alcohol consumption, one should not overlook that
the burden of alcohol goes well beyond the health field, including such social consequences to those
around the drinker and to the wider society as crime, lost productivity, family problems, child neglect or
abuse, and social marginalisation (120). An Australian study found that the reported tangible costs from
out-of-pocket expenses and time lost because of others’ drinking were of much the same magnitude as
the costs to health, social and legal systems of dealing with problems from drinking (117). While it may
prove hard to integrate the metrics of social burden with those of health burden, they underline the
necessity to change our negligent attitude towards alcohol use and its risks.
Overall, while we found that societies accept much higher lifetime mortality risk for alcohol use
compared to other risk factors, both for voluntary risk to the drinker and for involuntary risk to others,
the reasons for this acceptance are not fully understood (19). It may be related to lack of knowledge
about the true risks of alcohol, especially for cancer, or to historical vagaries, as alcohol use has neither
been integrated into food regulations as an ordinary food item, nor into international conventions which
exist for all other psychoactive substances, nor has there been a public health action similar to tobacco
after the repeal of prohibition (for more details see (19)). However, as current evidence clearly indicates
an exceptional role for alcohol use, with higher mortality risks being accepted than for other behavioural

42
and non-behavioural risk factors, we may well rethink acceptable risk for alcohol, and this rethinking
could be reflected in new low-risk guidelines.
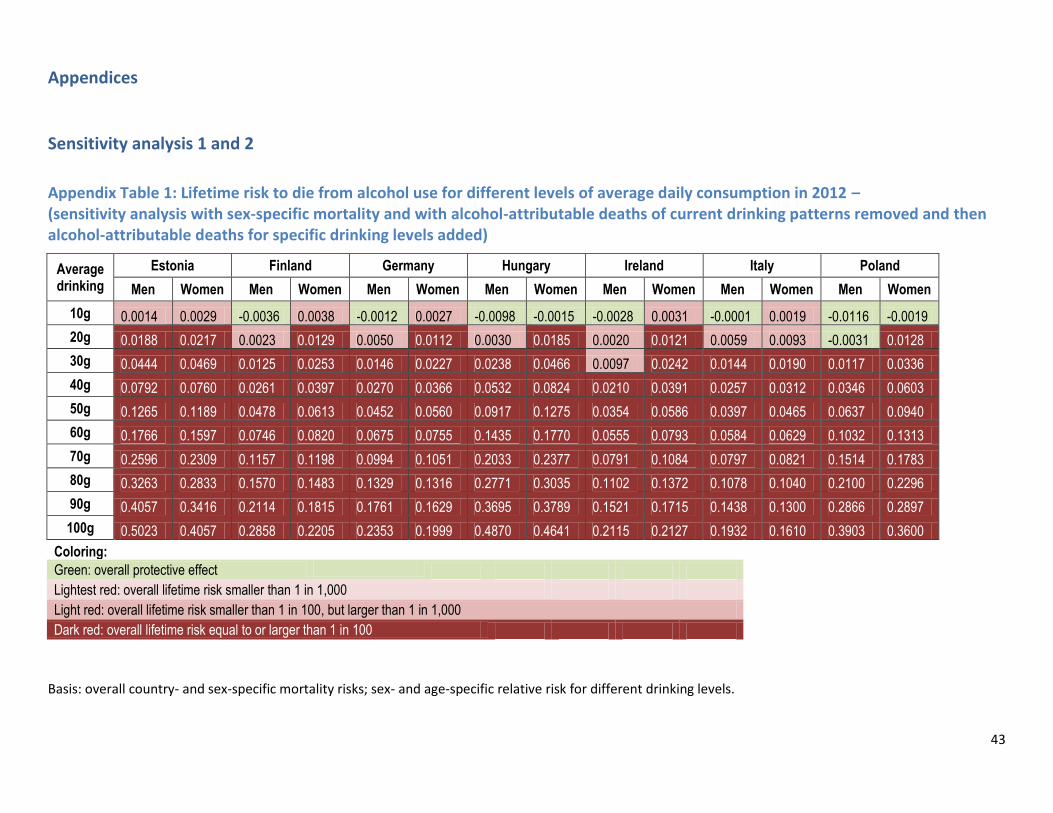
43
Appendices
Sensitivity analysis 1 and 2
Appendix Table 1: Lifetime risk to die from alcohol use for different levels of average daily consumption in 2012 – (sensitivity analysis with sex-specific mortality and with alcohol-attributable deaths of current drinking patterns removed and then alcohol-attributable deaths for specific drinking levels added)
Average drinking
Estonia Finland Germany Hungary Ireland Italy Poland
Men Women Men Women Men Women Men Women Men Women Men Women Men Women
10g 0.0014 0.0029 -0.0036 0.0038 -0.0012 0.0027 -0.0098 -0.0015 -0.0028 0.0031 -0.0001 0.0019 -0.0116 -0.0019
20g 0.0188 0.0217 0.0023 0.0129 0.0050 0.0112 0.0030 0.0185 0.0020 0.0121 0.0059 0.0093 -0.0031 0.0128
30g 0.0444 0.0469 0.0125 0.0253 0.0146 0.0227 0.0238 0.0466 0.0097 0.0242 0.0144 0.0190 0.0117 0.0336
40g 0.0792 0.0760 0.0261 0.0397 0.0270 0.0366 0.0532 0.0824 0.0210 0.0391 0.0257 0.0312 0.0346 0.0603
50g 0.1265 0.1189 0.0478 0.0613 0.0452 0.0560 0.0917 0.1275 0.0354 0.0586 0.0397 0.0465 0.0637 0.0940
60g 0.1766 0.1597 0.0746 0.0820 0.0675 0.0755 0.1435 0.1770 0.0555 0.0793 0.0584 0.0629 0.1032 0.1313
70g 0.2596 0.2309 0.1157 0.1198 0.0994 0.1051 0.2033 0.2377 0.0791 0.1084 0.0797 0.0821 0.1514 0.1783
80g 0.3263 0.2833 0.1570 0.1483 0.1329 0.1316 0.2771 0.3035 0.1102 0.1372 0.1078 0.1040 0.2100 0.2296
90g 0.4057 0.3416 0.2114 0.1815 0.1761 0.1629 0.3695 0.3789 0.1521 0.1715 0.1438 0.1300 0.2866 0.2897
100g 0.5023 0.4057 0.2858 0.2205 0.2353 0.1999 0.4870 0.4641 0.2115 0.2127 0.1932 0.1610 0.3903 0.3600
Coloring:
Green: overall protective effect
Lightest red: overall lifetime risk smaller than 1 in 1,000
Light red: overall lifetime risk smaller than 1 in 100, but larger than 1 in 1,000
Dark red: overall lifetime risk equal to or larger than 1 in 100
Basis: overall country- and sex-specific mortality risks; sex- and age-specific relative risk for different drinking levels.

44
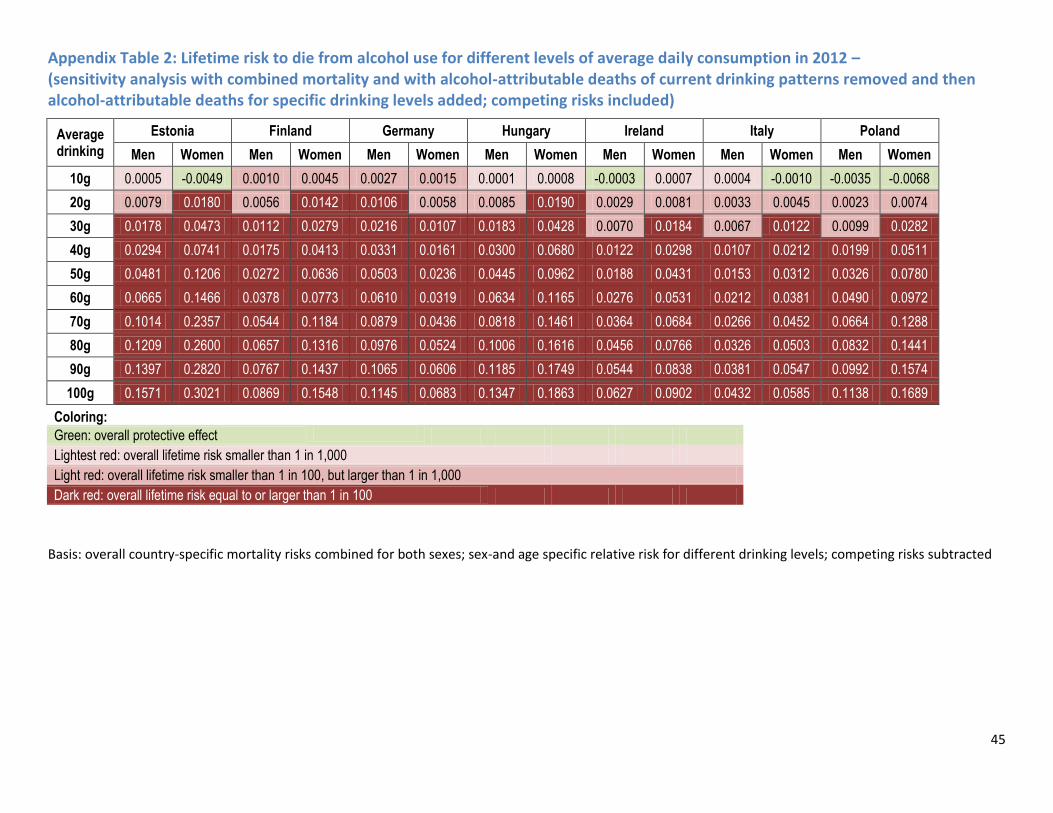
45
Appendix Table 2: Lifetime risk to die from alcohol use for different levels of average daily consumption in 2012 – (sensitivity analysis with combined mortality and with alcohol-attributable deaths of current drinking patterns removed and then alcohol-attributable deaths for specific drinking levels added; competing risks included)
Average drinking
Estonia Finland Germany Hungary Ireland Italy Poland
Men Women Men Women Men Women Men Women Men Women Men Women Men Women
10g 0.0005 -0.0049 0.0010 0.0045 0.0027 0.0015 0.0001 0.0008 -0.0003 0.0007 0.0004 -0.0010 -0.0035 -0.0068
20g 0.0079 0.0180 0.0056 0.0142 0.0106 0.0058 0.0085 0.0190 0.0029 0.0081 0.0033 0.0045 0.0023 0.0074
30g 0.0178 0.0473 0.0112 0.0279 0.0216 0.0107 0.0183 0.0428 0.0070 0.0184 0.0067 0.0122 0.0099 0.0282
40g 0.0294 0.0741 0.0175 0.0413 0.0331 0.0161 0.0300 0.0680 0.0122 0.0298 0.0107 0.0212 0.0199 0.0511
50g 0.0481 0.1206 0.0272 0.0636 0.0503 0.0236 0.0445 0.0962 0.0188 0.0431 0.0153 0.0312 0.0326 0.0780
60g 0.0665 0.1466 0.0378 0.0773 0.0610 0.0319 0.0634 0.1165 0.0276 0.0531 0.0212 0.0381 0.0490 0.0972
70g 0.1014 0.2357 0.0544 0.1184 0.0879 0.0436 0.0818 0.1461 0.0364 0.0684 0.0266 0.0452 0.0664 0.1288
80g 0.1209 0.2600 0.0657 0.1316 0.0976 0.0524 0.1006 0.1616 0.0456 0.0766 0.0326 0.0503 0.0832 0.1441
90g 0.1397 0.2820 0.0767 0.1437 0.1065 0.0606 0.1185 0.1749 0.0544 0.0838 0.0381 0.0547 0.0992 0.1574
100g 0.1571 0.3021 0.0869 0.1548 0.1145 0.0683 0.1347 0.1863 0.0627 0.0902 0.0432 0.0585 0.1138 0.1689
Coloring:
Green: overall protective effect
Lightest red: overall lifetime risk smaller than 1 in 1,000
Light red: overall lifetime risk smaller than 1 in 100, but larger than 1 in 1,000
Dark red: overall lifetime risk equal to or larger than 1 in 100
Basis: overall country-specific mortality risks combined for both sexes; sex-and age specific relative risk for different drinking levels; competing risks subtracted
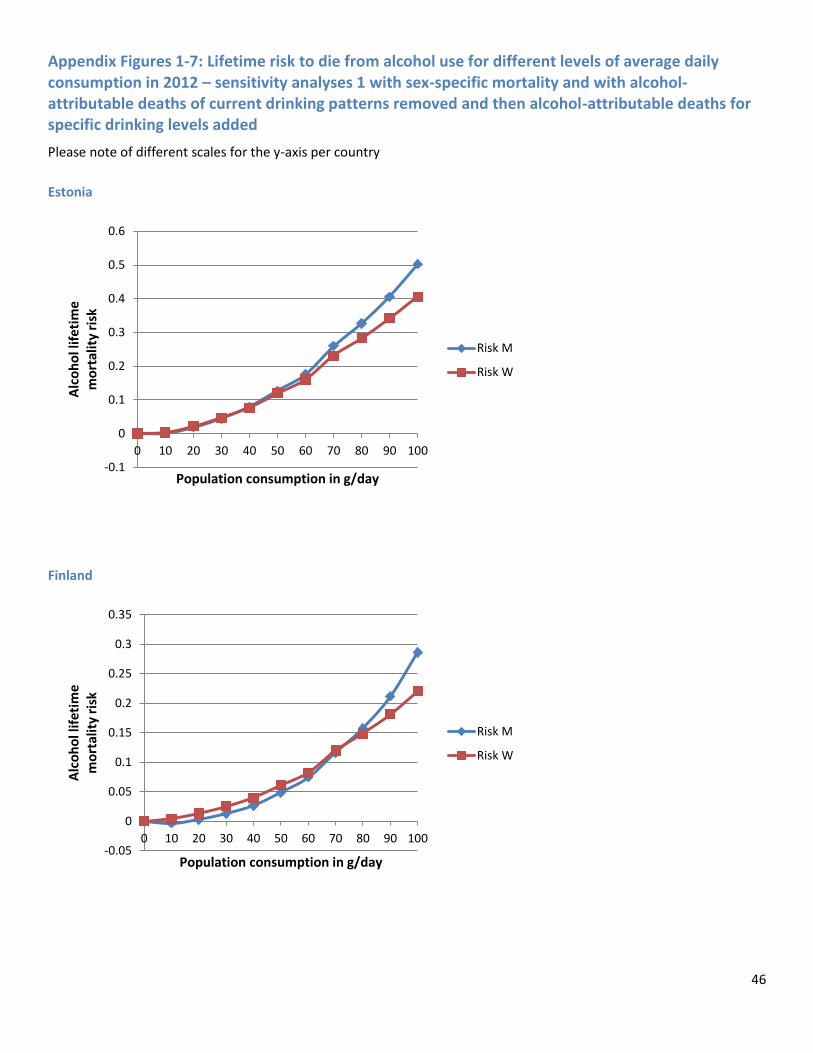
46
Appendix Figures 1-7: Lifetime risk to die from alcohol use for different levels of average daily consumption in 2012 – sensitivity analyses 1 with sex-specific mortality and with alcohol-attributable deaths of current drinking patterns removed and then alcohol-attributable deaths for specific drinking levels added
Please note of different scales for the y-axis per country
Estonia
Finland
-0.1
0
0.1
0.2
0.3
0.4
0.5
0.6
0 10 20 30 40 50 60 70 80 90 100
Alc
oh
ol l
ifet
ime
m
ort
alit
y ri
sk
Population consumption in g/day
Risk M
Risk W
-0.05
0
0.05
0.1
0.15
0.2
0.25
0.3
0.35
0 10 20 30 40 50 60 70 80 90 100
Alc
oh
ol l
ifet
ime
m
ort
alit
y ri
sk
Population consumption in g/day
Risk M
Risk W

47
Germany
Hungary
-0.05
0
0.05
0.1
0.15
0.2
0.25
0 20 40 60 80 100
Alc
oh
ol l
ifet
ime
m
ort
alit
y ri
sk
Population consumption in g/day
Risk M
Risk W
-0.1
0
0.1
0.2
0.3
0.4
0.5
0.6
0 10 20 30 40 50 60 70 80 90 100
Alc
oh
ol l
ifet
ime
m
ort
alit
y ri
sk
Population consumption in g/day
Risk M
Risk W
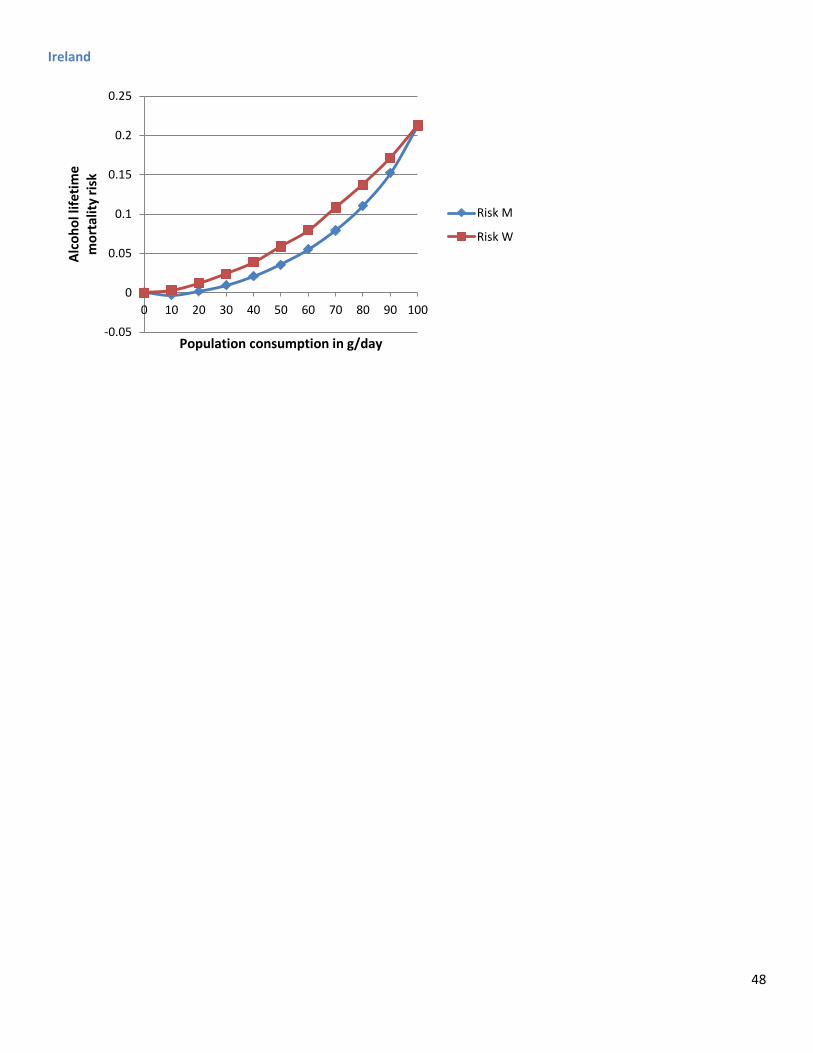
48
Ireland
-0.05
0
0.05
0.1
0.15
0.2
0.25
0 10 20 30 40 50 60 70 80 90 100
Alc
oh
ol l
ifet
ime
m
ort
alit
y ri
sk
Population consumption in g/day
Risk M
Risk W
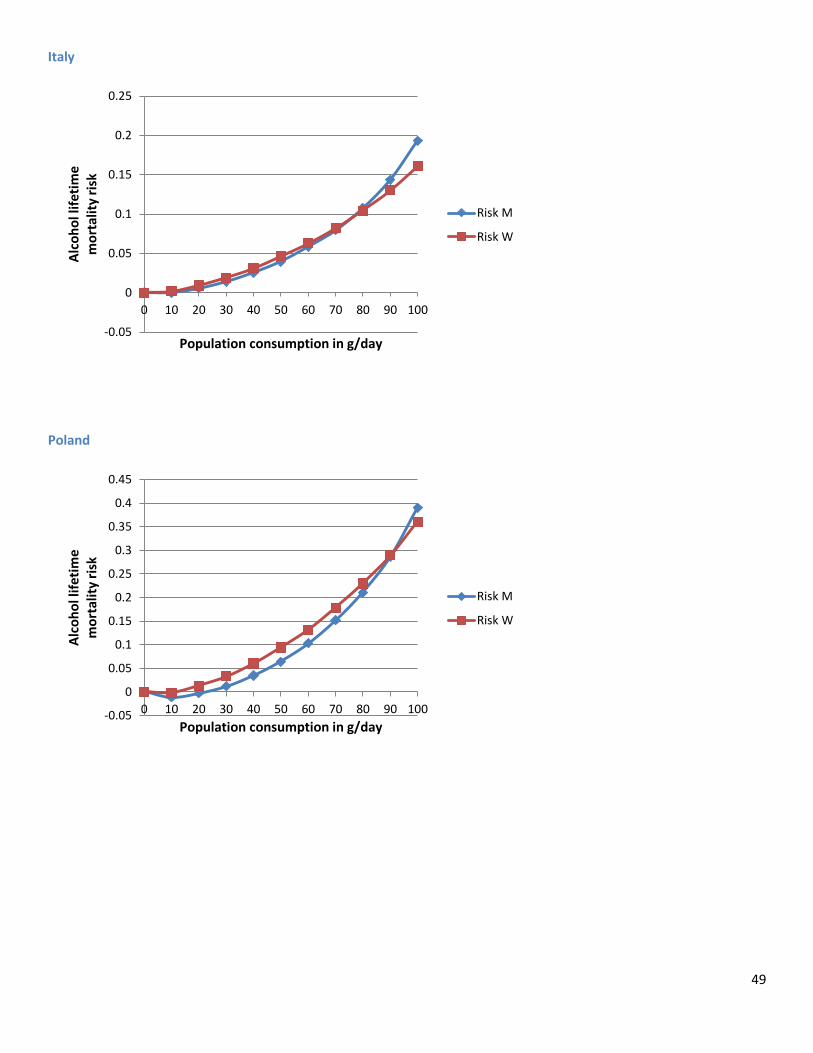
49
Italy
Poland
-0.05
0
0.05
0.1
0.15
0.2
0.25
0 10 20 30 40 50 60 70 80 90 100
Alc
oh
ol l
ifet
ime
m
ort
alit
y ri
sk
Population consumption in g/day
Risk M
Risk W
-0.05
0
0.05
0.1
0.15
0.2
0.25
0.3
0.35
0.4
0.45
0 10 20 30 40 50 60 70 80 90 100
Alc
oh
ol l
ifet
ime
m
ort
alit
y ri
sk
Population consumption in g/day
Risk M
Risk W
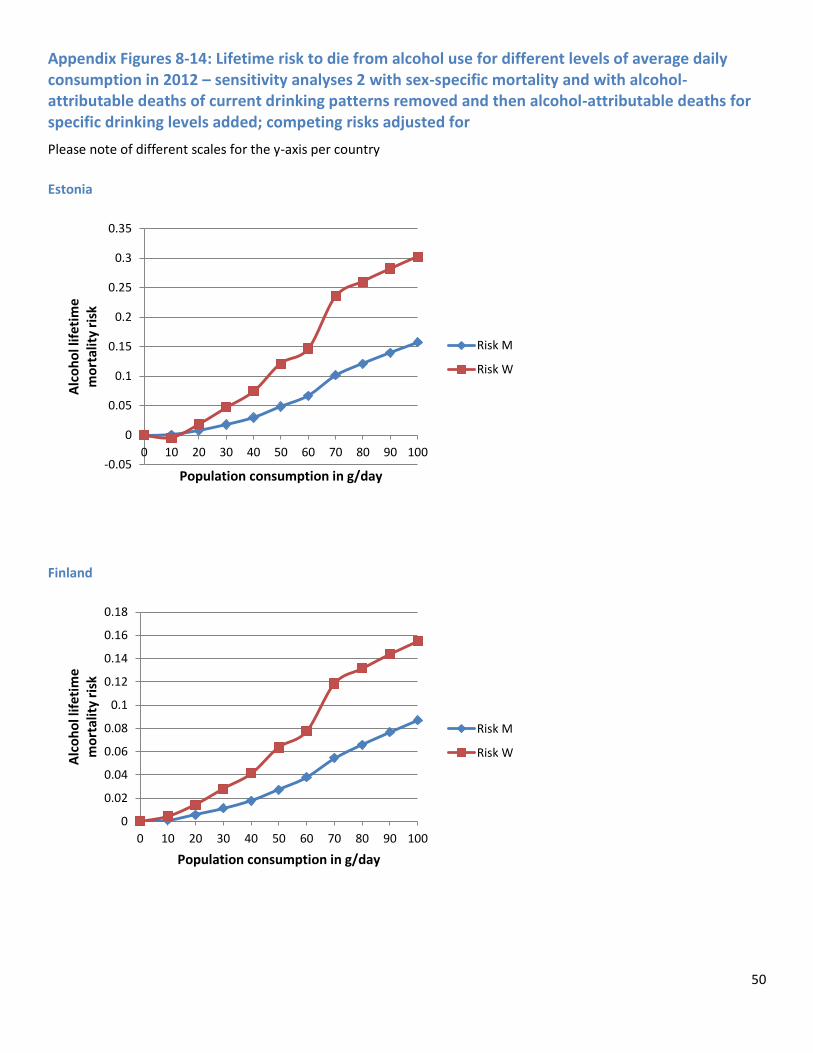
50
Appendix Figures 8-14: Lifetime risk to die from alcohol use for different levels of average daily consumption in 2012 – sensitivity analyses 2 with sex-specific mortality and with alcohol-attributable deaths of current drinking patterns removed and then alcohol-attributable deaths for specific drinking levels added; competing risks adjusted for
Please note of different scales for the y-axis per country
Estonia
Finland
-0.05
0
0.05
0.1
0.15
0.2
0.25
0.3
0.35
0 10 20 30 40 50 60 70 80 90 100
Alc
oh
ol l
ifet
ime
m
ort
alit
y ri
sk
Population consumption in g/day
Risk M
Risk W
0
0.02
0.04
0.06
0.08
0.1
0.12
0.14
0.16
0.18
0 10 20 30 40 50 60 70 80 90 100
Alc
oh
ol l
ifet
ime
m
ort
alit
y ri
sk
Population consumption in g/day
Risk M
Risk W
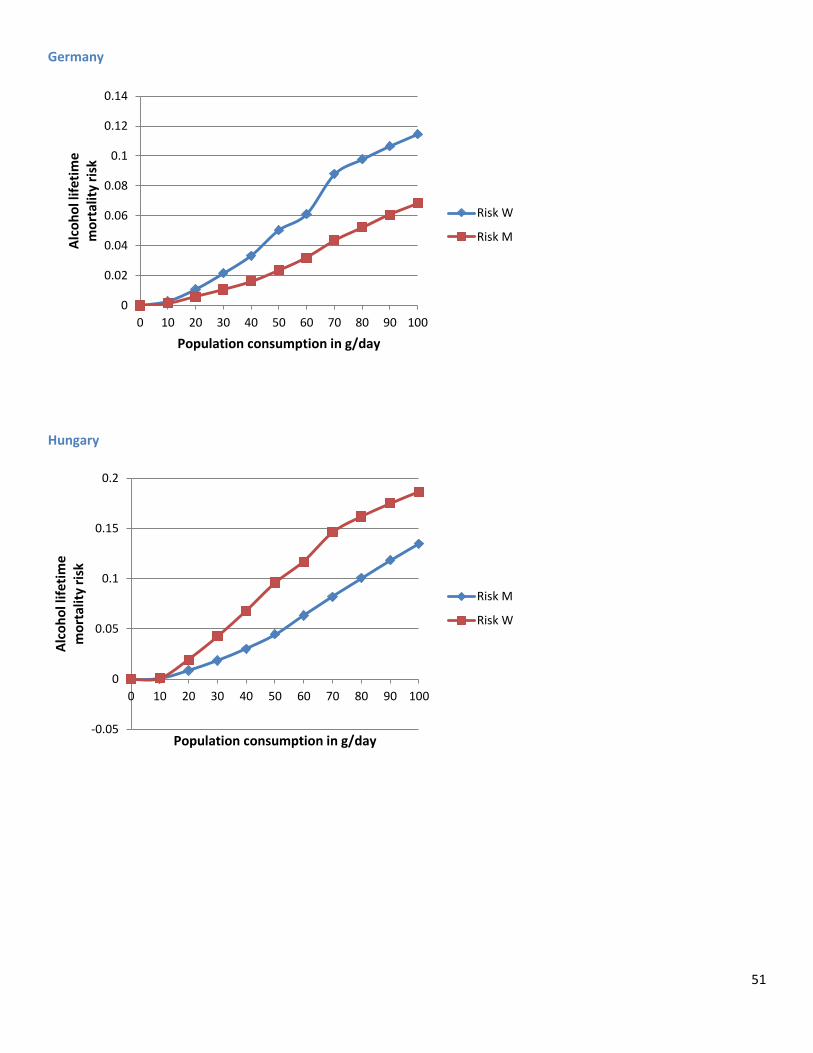
51
Germany
Hungary
0
0.02
0.04
0.06
0.08
0.1
0.12
0.14
0 10 20 30 40 50 60 70 80 90 100
Alc
oh
ol l
ifet
ime
m
ort
alit
y ri
sk
Population consumption in g/day
Risk W
Risk M
-0.05
0
0.05
0.1
0.15
0.2
0 10 20 30 40 50 60 70 80 90 100
Alc
oh
ol l
ifet
ime
m
ort
alit
y ri
sk
Population consumption in g/day
Risk M
Risk W
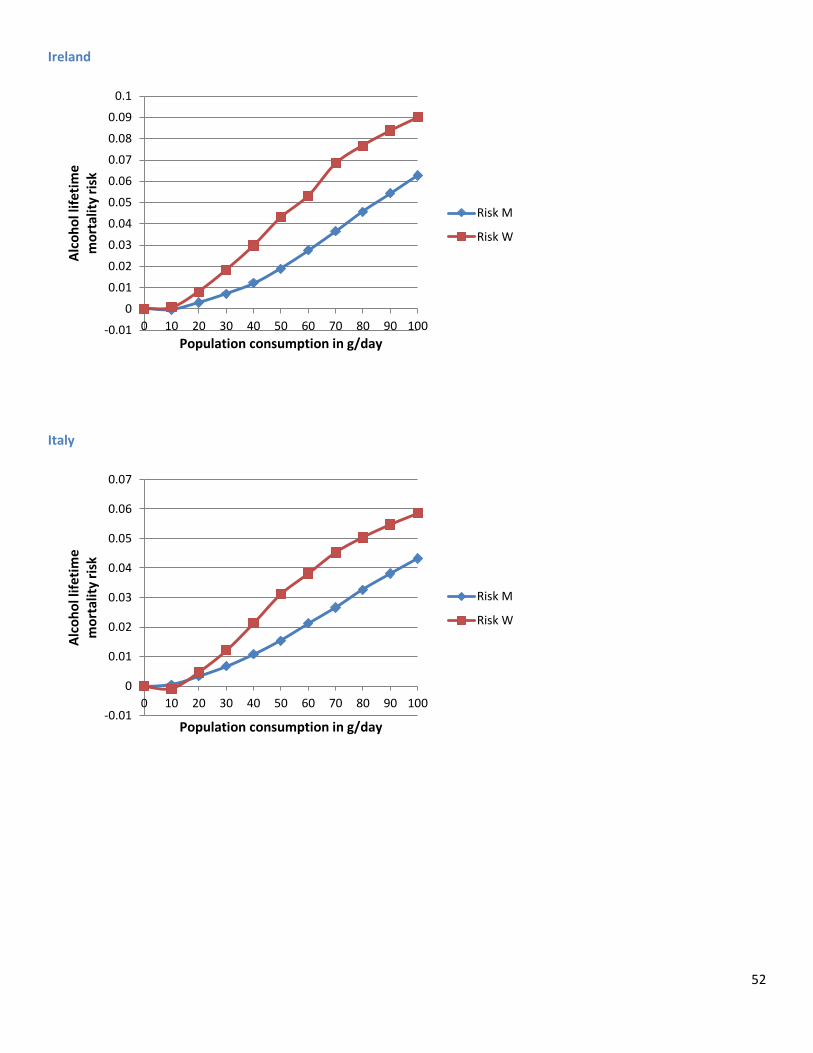
52
Ireland
Italy
-0.01
0
0.01
0.02
0.03
0.04
0.05
0.06
0.07
0.08
0.09
0.1
0 10 20 30 40 50 60 70 80 90 100
Alc
oh
ol l
ifet
ime
m
ort
alit
y ri
sk
Population consumption in g/day
Risk M
Risk W
-0.01
0
0.01
0.02
0.03
0.04
0.05
0.06
0.07
0 10 20 30 40 50 60 70 80 90 100
Alc
oh
ol l
ifet
ime
m
ort
alit
y ri
sk
Population consumption in g/day
Risk M
Risk W
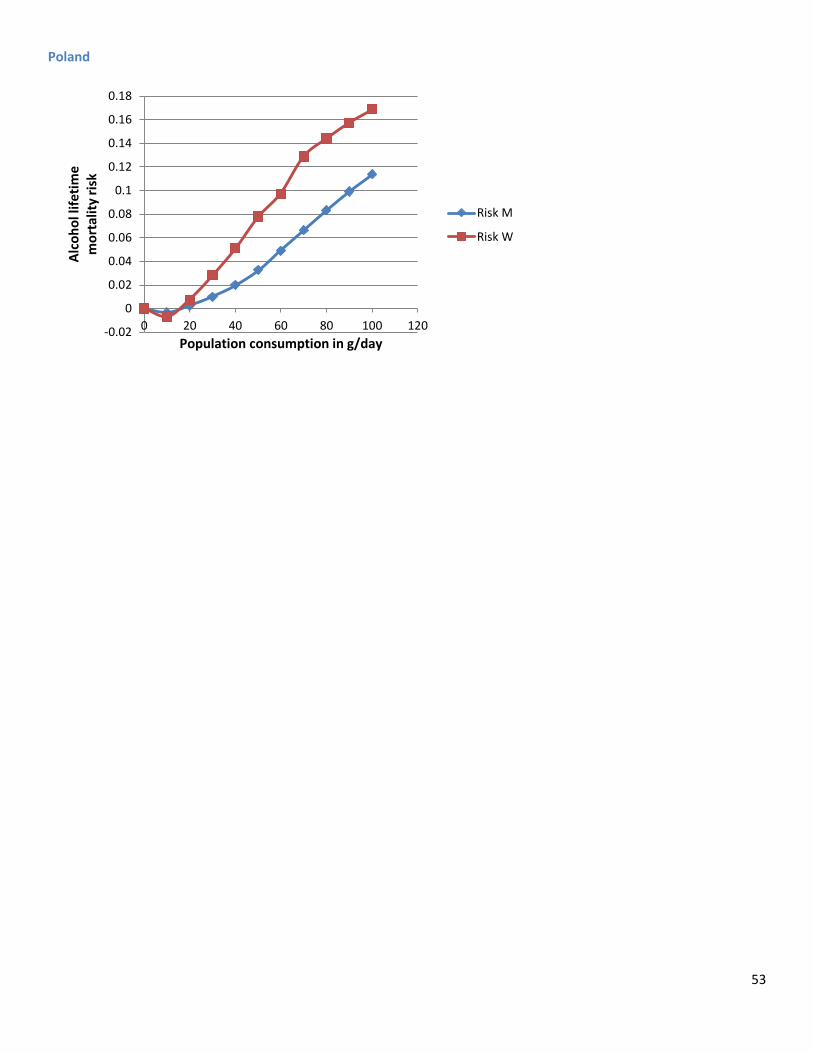
53
Poland
-0.02
0
0.02
0.04
0.06
0.08
0.1
0.12
0.14
0.16
0.18
0 20 40 60 80 100 120
Alc
oh
ol l
ifet
ime
m
ort
alit
y ri
sk
Population consumption in g/day
Risk M
Risk W
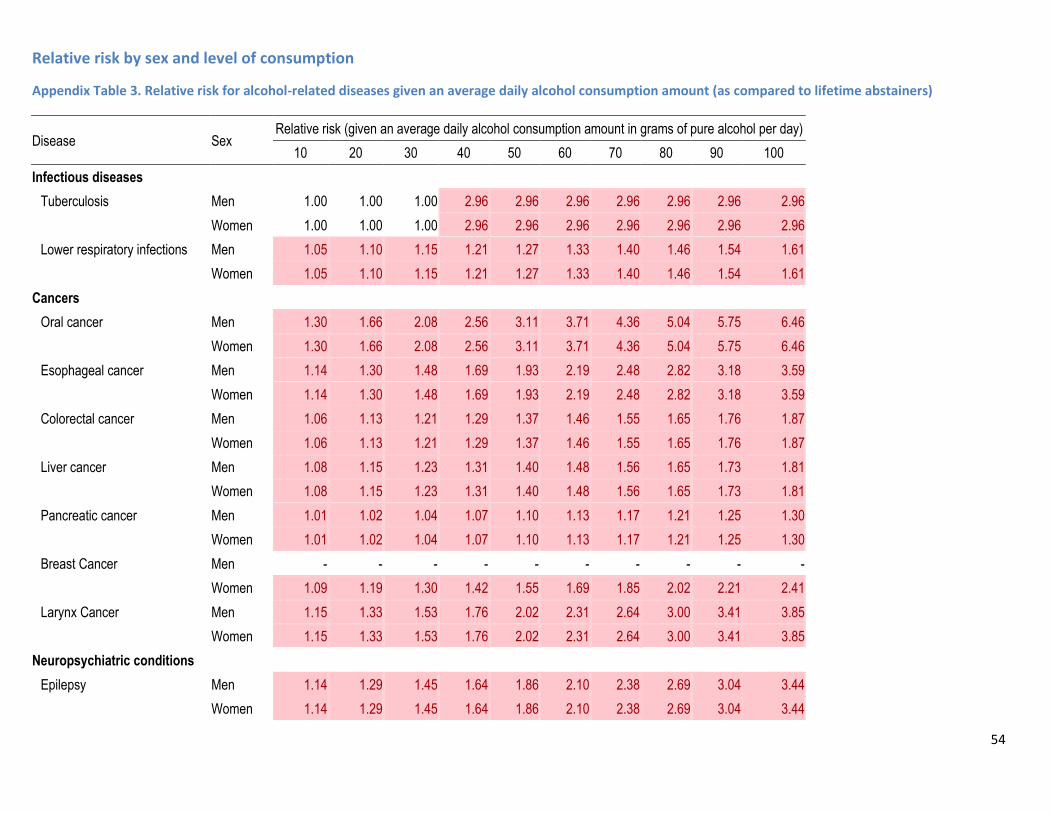
54
Relative risk by sex and level of consumption
Appendix Table 3. Relative risk for alcohol-related diseases given an average daily alcohol consumption amount (as compared to lifetime abstainers)
Disease Sex Relative risk (given an average daily alcohol consumption amount in grams of pure alcohol per day)
10 20 30 40 50 60 70 80 90 100
Infectious diseases
Tuberculosis Men 1.00 1.00 1.00 2.96 2.96 2.96 2.96 2.96 2.96 2.96
Women 1.00 1.00 1.00 2.96 2.96 2.96 2.96 2.96 2.96 2.96
Lower respiratory infections Men 1.05 1.10 1.15 1.21 1.27 1.33 1.40 1.46 1.54 1.61
Women 1.05 1.10 1.15 1.21 1.27 1.33 1.40 1.46 1.54 1.61
Cancers
Oral cancer Men 1.30 1.66 2.08 2.56 3.11 3.71 4.36 5.04 5.75 6.46
Women 1.30 1.66 2.08 2.56 3.11 3.71 4.36 5.04 5.75 6.46
Esophageal cancer Men 1.14 1.30 1.48 1.69 1.93 2.19 2.48 2.82 3.18 3.59
Women 1.14 1.30 1.48 1.69 1.93 2.19 2.48 2.82 3.18 3.59
Colorectal cancer Men 1.06 1.13 1.21 1.29 1.37 1.46 1.55 1.65 1.76 1.87
Women 1.06 1.13 1.21 1.29 1.37 1.46 1.55 1.65 1.76 1.87
Liver cancer Men 1.08 1.15 1.23 1.31 1.40 1.48 1.56 1.65 1.73 1.81
Women 1.08 1.15 1.23 1.31 1.40 1.48 1.56 1.65 1.73 1.81
Pancreatic cancer Men 1.01 1.02 1.04 1.07 1.10 1.13 1.17 1.21 1.25 1.30
Women 1.01 1.02 1.04 1.07 1.10 1.13 1.17 1.21 1.25 1.30
Breast Cancer Men - - - - - - - - - -
Women 1.09 1.19 1.30 1.42 1.55 1.69 1.85 2.02 2.21 2.41
Larynx Cancer Men 1.15 1.33 1.53 1.76 2.02 2.31 2.64 3.00 3.41 3.85
Women 1.15 1.33 1.53 1.76 2.02 2.31 2.64 3.00 3.41 3.85
Neuropsychiatric conditions
Epilepsy Men 1.14 1.29 1.45 1.64 1.86 2.10 2.38 2.69 3.04 3.44
Women 1.14 1.29 1.45 1.64 1.86 2.10 2.38 2.69 3.04 3.44
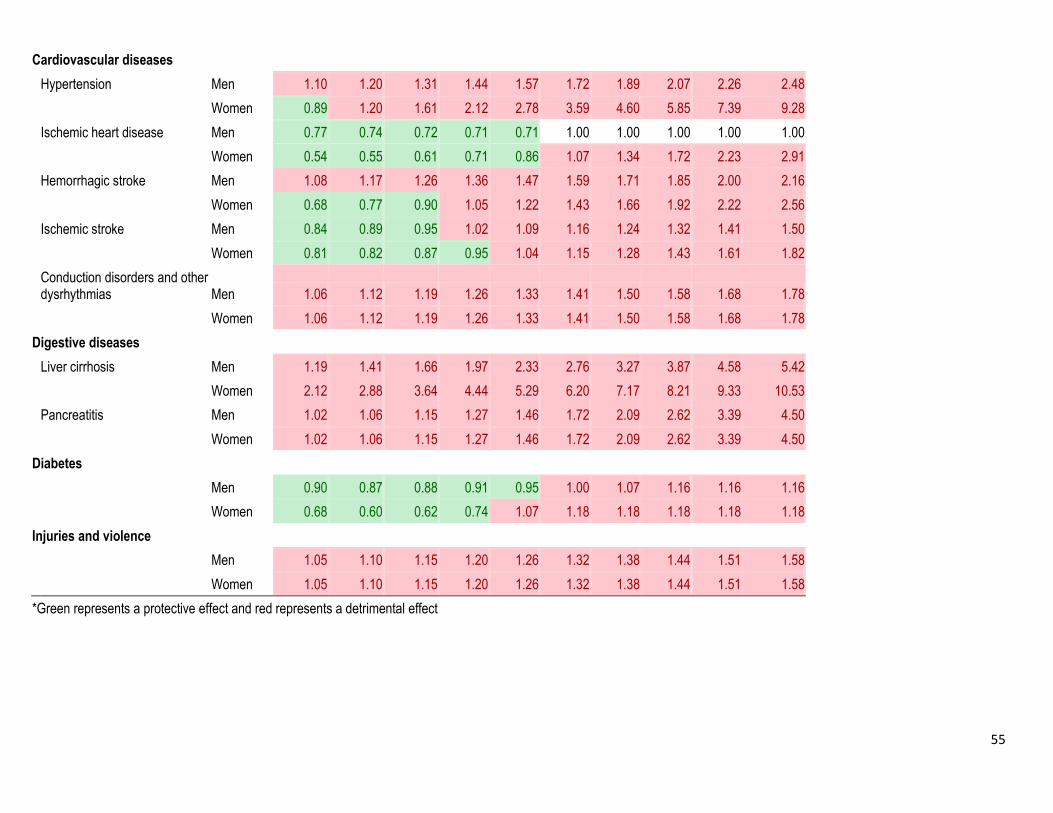
55
Cardiovascular diseases
Hypertension Men 1.10 1.20 1.31 1.44 1.57 1.72 1.89 2.07 2.26 2.48
Women 0.89 1.20 1.61 2.12 2.78 3.59 4.60 5.85 7.39 9.28
Ischemic heart disease Men 0.77 0.74 0.72 0.71 0.71 1.00 1.00 1.00 1.00 1.00
Women 0.54 0.55 0.61 0.71 0.86 1.07 1.34 1.72 2.23 2.91
Hemorrhagic stroke Men 1.08 1.17 1.26 1.36 1.47 1.59 1.71 1.85 2.00 2.16
Women 0.68 0.77 0.90 1.05 1.22 1.43 1.66 1.92 2.22 2.56
Ischemic stroke Men 0.84 0.89 0.95 1.02 1.09 1.16 1.24 1.32 1.41 1.50
Women 0.81 0.82 0.87 0.95 1.04 1.15 1.28 1.43 1.61 1.82
Conduction disorders and other dysrhythmias Men 1.06 1.12 1.19 1.26 1.33 1.41 1.50 1.58 1.68 1.78
Women 1.06 1.12 1.19 1.26 1.33 1.41 1.50 1.58 1.68 1.78
Digestive diseases
Liver cirrhosis Men 1.19 1.41 1.66 1.97 2.33 2.76 3.27 3.87 4.58 5.42
Women 2.12 2.88 3.64 4.44 5.29 6.20 7.17 8.21 9.33 10.53
Pancreatitis Men 1.02 1.06 1.15 1.27 1.46 1.72 2.09 2.62 3.39 4.50
Women 1.02 1.06 1.15 1.27 1.46 1.72 2.09 2.62 3.39 4.50
Diabetes
Men 0.90 0.87 0.88 0.91 0.95 1.00 1.07 1.16 1.16 1.16
Women 0.68 0.60 0.62 0.74 1.07 1.18 1.18 1.18 1.18 1.18
Injuries and violence
Men 1.05 1.10 1.15 1.20 1.26 1.32 1.38 1.44 1.51 1.58
Women 1.05 1.10 1.15 1.20 1.26 1.32 1.38 1.44 1.51 1.58
*Green represents a protective effect and red represents a detrimental effect
56
Reference List
1. World Health Organization. Global status report on alcohol and health. Geneva, Switzerland: World Health Organization; 2014.
2. Room R, Rehm J. (2012) Clear criteria based on absolute risk: reforming the basis of guidelines on low-risk drinking. Drug and Alcohol Review. 31(2):135-40.
3. Babor TF, Kranzler HR, Lauerman RJ. Social drinking as a health and psychological risk factor: Anstie’s limit revisited. In: Galanter M, editor. Recent developments in alcoholism. 5. New York: Plenum; 1987. p. 373-97.
4. Baan R, Straif K, Grosse Y, Secretan B, El Ghissassi F, Bouvard V, et al. (2007) Carcinogenicity of alcoholic beverages. Lancet Oncology. 8(4):292-3.
5. International Agency for Research on Cancer. (2012) Personal Habits and Indoor Combustions. Lyon, France: International Agency for Research on Cancer.
6. International Agency for Research on Cancer. (2010) IARC Monograph 96 on the Evaluation of Carcinogenic Risks to Humans. Alcoholic beverage consumption and ethyl carbamate (urethane). Lyon, France: International Agency for Research on Cancer (IARC).
7. Rehm J, Baliunas D, Borges GLG, Graham K, Irving HM, Kehoe T, et al. (2010) The relation between different dimensions of alcohol consumption and burden of disease - An overview. Addiction. 105(5):817-43.
8. National Institute on Alcohol Abuse & Alcoholism. (2010) Rethinking Drinking: Alcohol and your health. National Institutes on Alcohol Abuse & Alcoholism.
9. Stockley CS. (2007) Recommendations on alcohol consumption: an international comparison. Contemporary Drug Problems. 34:681-714.
10. Rehm J, Room R, Taylor B. (2008) Method for moderation: measuring lifetime risk of alcohol-attributable mortality as a basis for drinking guidelines. International Journal of Methods in Psychiatric Research. 17(3):141-51.
11. Stockwell T, Butt P, Beirness D, Gliksman L, Paradis C. (2012) The basis for Canada's new low-risk drinking guidelines: a relative risk approach to estimating hazardous levels and patterns of alcohol use. Drug and Alcohol Review. 31(2):126-34.
12. Butt P, Beirness D, Cesa F, Gliksman L, Paradis C, Stockwell T. (2011) Alcohol and health in Canada: a summary of evidence and guidelines for low-risk drinking. Ottawa, ON: Canadian Centre on Substance Abuse.
13. Jackson R, Beaglehole R. (1995) Alcohol consumption guidelines: relative safety vs absolute risks and benefits. Lancet. 346:716.

57
14. Room R, Stockwell T. (2012) Special Issue: Low Risk Drinking Guidelines. Drug and Alcohol Review. 31(2):121-247.
15. Kahneman D. Thinking Fast and Slow. New York: Farrar, Straus and Giroux; 2011.
16. Fischhoff B, Lichtenstein S, Slovic P, Derby SL, Keeney RL. Acceptable risk. Cambridge, UK: Cambridge University Press; 1981.
17. Starr C. (1969) Social benefit versus technological risk. Science. 165(3899):1232-8.
18. Slovic P. (1987) Perception of Risk. Science. 236(4799):280-5.
19. Rehm J, Lachenmeier DW, Room R. (2014) Why does society accept a higher risk for alcohol than for other voluntary or involuntary risks? . BMC Medicine. 12:189.
20. Gigerenzer G. How to know when numbers deceive you: Calculated Risks. New York, NY: Simon & Schuster; 2002.
21. Gigerenzer G. Risk Savvy: How to Make Good Decisions. New York: Penguin; 2013.
22. Lim SS, Vos T, Flaxman AD, Danaei G, Shibuya K, Adair-Rohani H, et al. (2012) A comparative risk assessment of burden of disease and injury attributable to 67 risk factors and risk factor clusters in 21 regions, 1990–2010: a systematic analysis for the Global Burden of Disease Study 2010 Lancet. 380:2224-60.
23. Field MJ, Gold GM. Summarizing population health: directions for the development and application of population metrics. Washington, DC: National Academy Press; 1998.
24. Murray CJL, Salomon J, Mathers C. (2000) A critical examination of summary measures for population health. Bulletin of the World Health Organization. 78(8):981-94.
25. Murray CJL, Salomon J, Mathers C, Lopez A. (2002) Summary measures of population health: Concepts, ethics, measurement and applications. Geneva, Switzerland: World Health Organization.
26. Murray CJL. (1994) Quantifying the burden of disease: the technical basis for disability-adjusted life years. Bulletin of the World Health Organization. 72(3):429-45.
27. Lopez AD, Mathers CD, Ezzati M, Jamison DT, Murray CJL. Global Burden of Disease and Risk Factors. New York & Washington: The World Bank and Oxford University Press; 2006.
28. Otway HJ, Erdman RC. (1970) Reactor siting and design from a risk standpoint. Nuclear Engineering Design. 13:365-7.
29. Dinman BD. (1980) The Reality and Acceptance of Risk. The Journal of the American Medical Association 244(11):1226-8.
30. Travis CC, Crouch EAC, Milson R, Klema ED. (1987) Cancer risk management: A review of 132 regulatory decisions. Environmental Science and Technology. 21(5):415-20.
58
31. Rehm J, Patra J. (2012) Different guidelines for different countries? On the scientific basis of low-risk drinking guidelines and their implications. Drug and Alcohol Review. 31(2):156-61.
32. Laurenti R, de Mello Jorge MH, Gotlieb SL. (2008) Underlying cause-of-death mortality statistics: considering the reliability of data [Article in Portuguese]. Revista Panamericana de Salud Pública. 23(5):349-56.
33. Taylor B, Rehm J, Room R, Patra J, Bondy S. (2008) Determination of lifetime injury mortality risk in Canada in 2002 by drinking amount per occasion and number of occasions. American Journal of Epidemiology. 168(10):1119-25.
34. Taylor B, Rehm J, Room R, Patra J, Bondy S. (2008) Taylor et al. respond to "Alcohol and Trauma and Chronic Disease Mortality". American Journal of Epidemiology. 168(10):1130-1.
35. Rehm J, Zatonski W, Taylor B, Anderson P. (2011) Epidemiology and alcohol policy in Europe. Addiction. 106(Suppl.1):11-9.
36. Holman CD, English DR, Milne E, Winter MG. (1996) Meta-analysis of alcohol and all-cause mortality: a validation of NHMRC recommendations. Medical Journal of Australia. 164(3):141-5.
37. Di Castelnuovo A, Costanzo S, Bagnardi V, Donati MB, Iacoviello L, de Gaetano G. (2006) Alcohol dosing and total mortality in men and women: an updated meta-analysis of 34 prospective studies. Archives of Internal Medicine. 166(22):2437-45.
38. Gmel G, Gutjahr E, Rehm J. (2003) How stable is the risk curve between alcohol and all-cause mortality and what factors influence the shape? A precision-weighted hierarchical meta-analysis. European Journal of Epidemiology. 18(7):631-42.
39. Rothman KJ, Greenland S, Lash TL. Modern Epidemiology, 3rd ed. Philadelphia, PA: Lippincott Williams & Wilkins; 2008.
40. Ashley M, Rehm J, Bondy S, Single E, Rankin J. (2000) Beyond ischemic heart disease: are there other health benefits from drinking alcohol? Contemporary Drug Problems. 27:735-77.
41. Rehm J, Mathers C, Popova S, Thavorncharoensap M, Teerawattananon Y, Patra J. (2009) Global burden of disease and injury and economic cost attributable to alcohol use and alcohol use disorders. Lancet. 373(9682):2223-33.
42. Bondy S, Rehm J, Ashley M, Walsh G, Single E, Room R. (1999) Low-risk drinking guidelines: The scientific evidence. Canadian Journal of Public Health. 90(4):264-70.
43. Walsh G, Rehm J. (1996) Daily drinking and harm. Contemporary Drug Problems. 23:465-78.
44. Rehm J, Ashley MJ, Room R, Single E, Bondy S, Ferrence R, et al. (1996) On the emerging paradigm of drinking patterns and their social and health consequences. Addiction. 91:1615-21.
45. Rehm J, Room R, Graham K, Monteiro M, Gmel G, Sempos C. (2003) The relationship of average volume of alcohol consumption and patterns of drinking to burden of disease - An overview. Addiction. 98(10):1209-28.
59
46. Rehm J, Sempos C, Trevisan M. (2003) Average volume of alcohol consumption, patterns of drinking and risk of coronary heart disease - a review. Journal of Cardiovascular Risk. 10(1):15-20.
47. Trevisan MT, Schisterman E, Mennotti A, Farchi G, Conti S. (2001) Drinking pattern and mortality: The Italian risk factor and life expectancy pooling project. Annals of Epidemiology. 11:312-9.
48. Rehm J, Monteiro M, Room R, Gmel G, Jernigan D, Frick U, et al. (2001) Steps towards constructing a global comparative risk analysis for alcohol consumption: Determining indicators and empirical weights for patterns of drinking, deciding about theoretical minimum, and dealing with different consequences. European Addiction Research. 7(3):138-47.
49. Rehm J, Room R, Monteiro M, Gmel G, Graham K, Rehn N, et al. Alcohol Use. In: Ezzati M, Lopez AD, Rodgers A, Murray CJL, editors. Comparative quantification of health risks: global and regional burden of disease attributable to selected major risk factors. Geneva, Switzerland: World Health Organization; 2004. p. 959-1109.
50. Iontchev A. Central and Eastern Europe. In: Grant M, editor. Alcohol and Emerging Markets: Patterns, Problems, and Responses. Washington, DC: International Center for Alcohol Policies; 1998. p. 177-201.
51. Popova S, Rehm J, Patra J, Zatonski W. (2007) Comparing alcohol consumption in central and eastern Europe to other European countries. Alcohol and Alcoholism. 42(5):465-73.
52. Rehm J, Shield KD, Rehm MX, Gmel G, Jr., Frick U. (2012) Alcohol consumption, alcohol dependence, and attributable burden of disease in Europe: potential gains from effective interventions for alcohol dependence. Toronto, Canada: Centre for Addiction and Mental Health.
53. Zatonski W, Manczuk M, Sulkowska U, H. E. M. Project Team. Closing the health gap in European Union. Warsaw, Poland: Cancer Epidemiology and Prevention Division, the Maria Sklodowska-Curie Memorial Cancer Centre and Institute of Oncology; 2008.
54. Rehm J, Anderson P, Barry J, Dimitrov P, Elekes Z, Feijão F, et al. (2015) Prevalence of and potential influencing factors for alcohol dependence in Europe. European Addiction Research. 21(1):6-18.
55. Gmel G, Shield K, Rehm J. (2011) Developing a methodology to derive alcohol-attributable fractions for HIV/AIDS mortality based on alcohol's impact on adherence to antiretroviral medication. Population Health Metrics. 9(1):5.
56. Lönnroth K, Williams B, Stadlin S, Jaramillo E, Dye C. (2008) Alcohol use as a risk factor for tuberculosis - a systematic review. BMC Public Health. 8:289.
57. Rehm J, Samokhvalov AV, Neuman MG, Room R, Parry CD, Lönnroth K, et al. (2009) The association between alcohol use, alcohol use disorders and tuberculosis (TB). A systematic review. BMC Public Health. 9(1):450.
58. Corrao G, Bagnardi V, Zambon A, La Vecchia C. (2004) A meta-analysis of alcohol consumption and the risk of 15 diseases. Preventive Medicine. 38:613-9.
60
59. Bagnardi V, Rota M, Botteri E, Tramacere I, Islami F, Scotti L, et al. (in press) Alcohol consumption and site-specific cancer risk: a comprehensive dose-response meta-analysis. Annals of Oncology.
60. Baliunas D, Taylor B, Irving H, Roerecke M, Patra J, Mohapatra S, et al. (2009) Alcohol as a risk factor for type 2 diabetes - A systematic review and meta-analysis. Diabetes Care. 32(11):2123-32.
61. Samokhvalov AV, Irving H, Mohapatra S, Rehm J. (2010) Alcohol consumption, unprovoked seizures and epilepsy: a systematic review and meta-analysis. Epilepsia. 51(7):1177-84.
62. Taylor B, Irving HM, Baliunas D, Roerecke M, Patra J, Mohapatra S, et al. (2009) Alcohol and hypertension: gender differences in dose-response relationships determined through systematic review and meta-analysis. Addiction. 104(12):1981-90.
63. Roerecke M, Rehm J. (2012) The cardioprotective association of average alcohol consumption and ischaemic heart disease: a systematic review and meta-analysis. Addiction. 107(7):1246-60.
64. Roerecke M, Rehm J. (2010) Irregular heavy drinking occasions and risk of ischemic heart disease: a systematic review and meta-analysis. American Journal of Epidemiology. 171(6):633-44.
65. Rehm J, Shield KD, Roerecke M, Gmel G. (Manuscript in submission) Modelling the impact of alcohol consumption on cardiovascular disease mortality for comparative risk assessments: an overview.
66. Samokhvalov AV, Irving HM, Rehm J. (2010) Alcohol as a risk factor for atrial fibrillation: a systematic review and meta-analysis. European Journal of Cardiovascular Prevention & Rehabilitation. 17(6):706-12.
67. Patra J, Taylor B, Irving H, Roerecke M, Baliunas D, Mohapatra S, et al. (2010) Alcohol consumption and the risk of morbidity and mortality from different stroke types - a systematic review and meta-analysis. BMC Public Health. 10(1):258.
68. Rehm J, Taylor B, Mohapatra S, Irving H, Baliunas D, Patra J, et al. (2010) Alcohol as a risk factor for liver cirrhosis - a systematic review and meta-analysis. Drug and Alcohol Review. 29(4):437-45.
69. Irving HM, Samokhvalov A, Rehm J. (2009) Alcohol as a risk factor for pancreatitis. A systematic review and meta-analysis. Journal of the Pancreas. 10(4):387-92.
70. Samokhvalov AV, Irving HM, Rehm J. (2010) Alcohol consumption as a risk factor for pneumonia: systematic review and meta-analysis. Epidemiology and Infection. 138(12):1789-95.
71. Patra J, Bakker R, Irving H, Jaddoe VWV, Malini S, Rehm J. (2011) Dose-response relationship between alcohol consumption before and during pregnancy and the risks of low birthweight, preterm birth and small for gestational age (SGA)-a systematic review and meta-analyses. BJOG: International Journal of Obstetrics and Gynaecology. 118(12):1411-21.
72. Walter SD. (1976) The estimation and interpretation of attributable risk in health research. Biometrics. 32:829-49.
61
73. Rockhill B, Newman B. (1998) Use and misuse of population attributable fractions. American Journal of Public Health. 88:15-9.
74. Ezzati M, Lopez A, Rodgers A, Murray CJL. Comparative quantification of health risks. Global and regional burden of disease attributable to selected major risk factors. Geneva, Switzerland: World Health Organization; 2004.
75. Rehm J, Kehoe T, Gmel G, Stinson F, Grant B, Gmel G. (2010) Statistical modeling of volume of alcohol exposure for epidemiological studies of population health: the example of the US. Population Health Metrics. 8:3.
76. Roerecke M, Rehm J. (2013) Alcohol use disorders and mortality - A systematic review and meta-analysis. Addiction. 108(9):1562-78.
77. Roerecke M, Rehm J. (2014) Cause-specific mortality risk in alcohol use disorder treatment patients: a systematic review and meta-analysis. International Journal of Epidemiology. 43(3):906-19.
78. Rehm J, Dawson D, Frick U, Gmel G, Roerecke M, Shield KD, et al. (2014) Burden of disease associated with alcohol use disorders in the United States Alcoholism: Clinical & Experimental Research. 38(4):1068-77.
79. Schomerus G, Lucht M, Holzinger A, Matschinger H, Carta MG, Angermeyer MC. (2011) The stigma of alcohol dependence compared with other mental disorders: a review of population studies. Alcohol and Alcoholism. 46(2):105-12.
80. Shield KD, Gmel G, Jr., Patra J, Rehm J. (2012) Global burden of injuries attributable to alcohol consumption in 2004: a novel way of calculating the burden of injuries attributable to alcohol consumption. Population Health Metrics. 10:9.
81. Shield KD, Parry C, Rehm J. (2013) Chronic diseases and conditions related to alcohol use Alcohol Research: Current Reviews. 35(2):155-71.
82. Ringmets I, Tuusov J, Lang K, Väli M, Pärna K, Tõnisson M, et al. (2012) Alcohol and premature death in Estonian men: a study of forensic autopsies using novel biomarkers and proxy informants. BMC Public Health. 12:146.
83. Rahu K, Palo E, Rahu M. (2011) Diminishing trend in alcohol poisoning mortality in Estonia: reality or coding peculiarity? Alcohol and Alcoholism. 46(4):485-9.
84. World Health Organization. (2009) Global Health Risks. Mortality and burden of disease attributable to selected major risks. Geneva, Switzerland: World Health Organization.
85. Rehm J, Klotsche J, Patra J. (2007) Comparative quantification of alcohol exposure as risk factor for global burden of disease. International Journal of Methods in Psychiatric Research. 16(2):66-76.
86. Rehm J, G. B, Gmel G, Graham K, Grant B, Parry C, et al. (2013) The comparative risk assessment for alcohol as part of the Global Burden of Disease 2010 study: What changed from the last study? . International Journal of Alcohol and Drug Research. 2(1):1-5.
62
87. National Health Medical Research Council. (2004) Australian drinking water guidelines. Canberra: National Health and Medical Research Council (NHMRC).
88. Hunter PR, Fewtrell L. Acceptable risk. In: Fewtrel L, Bartram J, editors. Water quality: guidelines, standards and health. London, UK: IWA Publishing; 2001. p. 207-27.
89. Rifkin E, Bouwer E. The Illusion of Certainty: Health Benefits and Risks. New York: Springer; 2007.
90. Laslett AM, Room R, Ferris J, Wilkinson C, Livingston M, Mugavin J. (2011) Surveying the range and magnitude of alcohol's harm to others in Australia. Addiction. 106(9):1603-11.
91. Hope A. (2014) Alcohol's harm to others in Ireland. Dublin, Ireland: Health Service Executive.
92. Bond J, Ye Y, Cherpitel CJ, Room R, Rehm J, Borges G, et al. (2010) The relationship between self-reported drinking and BAC level in emergency room injury cases: is it a straight line? Alcoholism: Clinical & Experimental Research. 34(6):1118-25.
93. Taylor B, Rehm J. (2012) The relationship between alcohol consumption and fatal motor vehicle injury: high risk at low alcohol levels. Alcoholism: Clinical and Experimental Research. 36(10):1827-34.
94. Taylor B, Irving HM, Kanteres F, Room R, Borges G, Cherpitel C, et al. (2010) The more you drink, the harder you fall: a systematic review and meta-analysis of how acute alcohol consumption and injury or collision risk increase together. Drug and Alcohol Dependence. 110(1-2):108-16.
95. Eckardt M, File S, Gessa G, Grant K, Guerri C, Hoffman P, et al. (1998) Effects of moderate alcohol consumption on the central nervous system. Alcoholism: Clinical and Experimental Research. 22:998-1040.
96. Cherpitel CJ. (2013) Focus On: The Burden of Alcohol Use—Trauma and Emergency Outcomes. Alcohol Research: Current Reviews. 35(2):150-4.
97. Cherpitel C. (2007) Alcohol and injuries: a review of international emergency room studies since 1995. Drug and Alcohol Review. 26(2):201-14.
98. Gmel G, Rehm J. (2003) Harmful alcohol use. Alcohol Research & Health. 27(1):52-62.
99. Zeisser C, Stockwell TR, Chikritzhs T, Cherpitel C, Ye Y, Gardner C. (2013) A systematic review and meta-analysis of alcohol consumption and injury risk as a function of study design and recall period. Alcoholism: Clinical & Experimental Research. 37 Suppl 1:E1-8.
100. Cherpitel C, Bond J, Yu Y, Borges G, Macdonald S. (2003) Alcohol-related injury in the ER: A cross national meta-analysis from the emergency room collaborative alcohol analysis. Journal of Studies on Alcohol. 64(5):641-9.
101. Nutt DJ, Rehm J. (2014) Doing it by numbers: a simple approach to reducing the harms of alcohol. Journal of Psychopharmacology. 28(1):3-7.
102. Dawson DA, Li TK, Grant BF. (2008) A prospective study of risk drinking: At risk for what? Drug and Alcohol Dependence. 95:62-72.
63
103. Marugame T, Yamamoto S, Yoshimi I, Sobue T, Inoue M, Tsugane S. (2007) Patterns of alcohol drinking and all-cause mortality: results from a large-scale population-based cohort study in Japan. American Journal of Epidemiology. 165(9):1039-46.
104. Turner C. (1990) How much alcohol is in a 'standard drink'? An analysis of 125 studies. British Journal of Addiction. 85(9):1171-5.
105. Kerr WC, Stockwell T. (2012) Understanding standard drinks and drinking guidelines. Drug and Alcohol Review. 31(2):200-5.
106. Seitz HK, Stickel F. (2007) Molecular mechanisms of alcohol-mediated carcinogenesis. Nature Reviews -Cancer. 7(8):599-612.
107. Holmes MV, Dale CE, Zuccolo L, Silverwood RJ, Guo Y, Ye Z, et al. (2014) Association between alcohol and cardiovascular disease: Mendelian randomisation analysis based on individual participant data. BMJ. 349:g4164.
108. Brooks PJ, Enoch MA, Goldman D, Li TK, Yokoyama A. (2009) The alcohol flushing response: an unrecognized risk factor for esophageal cancer from alcohol consumption. PLoS Medicine. 6(3):258-63.
109. Goedde HW, Agarwal DP, Fritze G, Meier-Tackmann D, Singh S, Beckmann G, et al. (1992) Distribution of ADH2 and ALDH2 genotypes in different populations. Human Genetics. 88:344-6.
110. Holford NH. (1987) Clinical pharmacokinetics of ethanol. Clinical Pharmacokinetics. 13(5):273-92.
111. Kalant H. (2000) Effects of food and body composition on blood alcohol curves. Alcoholism: Clinical & Experimental Research. 24(4):413-4.
112. Ramchandani VA, Bosron WF, Li TK. (2001) Research advances in ethanol metabolism. Pathologie Biologie. 49(9):676-82.
113. Nogueira LC, Couri S, Trugo NF, Lollo PC. (2014) The effect of different alcoholic beverages on blood alcohol levels, plasma insulin and plasma glucose in humans. Food Chemistry. 158:527-33.
114. Horikoshi M, Funakoshi A, Miyasaka K, Sekime A. (2013) Sex difference in the effects of alcohol on gastric emptying in healthy volunteers: a study using the (13)C breath test. Biomedical Research. 34(6):275-80.
115. Mattson ME, Pollack ES, Cullen JW. (1987) What are the odds that smoking will kill you? American Journal of Public Health. 77(4):425-31.
116. Woloshin S, Schwartz LM, Welch HG. (2008) The risk of death by age, sex, and smoking status in the United States: putting health risks in context. Journal of the National Cancer Institute. 100(12):845-53.
117. Laslett AM, Catalano P, Chikritzhs T, Dale C, Doran C, Ferris J, et al. The range and magnitude of alcohol's harm to others. Fitzroy, AU: Turning Point Alcohol & Drug Centre; 2010.

64
118. Babor T, Caetano R, Casswell S, Edwards G, Giesbrecht N, Graham K, et al. Alcohol: No ordinary commodity. Research and public policy. 2nd edition. Oxford and London: Oxford University Press; 2010.
119. Anderson P, Chisholm D, Fuhr D. (2009) Effectiveness and cost-effectiveness of policies and programmes to reduce the harm caused by alcohol. Lancet. 373(9682):2234-46.
120. Klingemann H, Gmel G. Mapping social consequences of alcohol consumption. Dordrecht, Netherlands: Kluwer Academic Publishers; 2001.