life’s simple 7 and worksite wellnesswcm/@mwa/documents/... · life’s simple 7 and worksite...
TRANSCRIPT
Life’s Simple 7 and
Worksite Wellness
Donald M. Lloyd-Jones, MD ScM
Senior Associate Dean
Director, NUCATS Institute
Chair, Dept. of Preventive Medicine
Eileen M. Foell Professor
Northwestern Feinberg School of Medicine
President, AHA Chicago Metro Board
President-Elect, AHA Midwest Affiliate Board
From Cardiovascular Disease
to “Cardiovascular Health”A Quiet Revolution
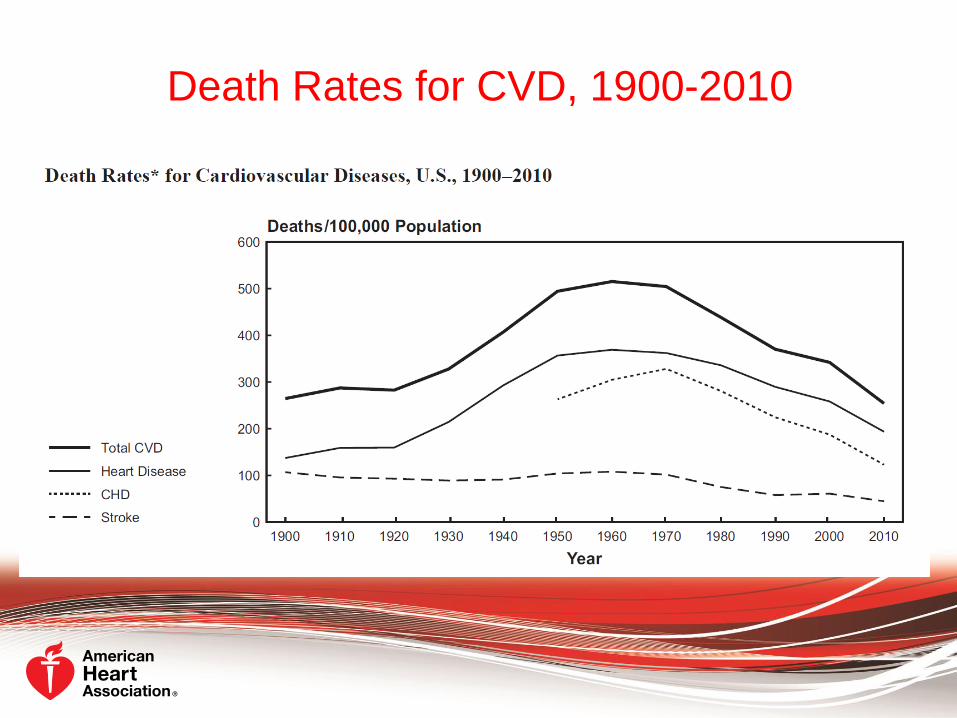
Death Rates for CVD, 1900-2010
4Heidenreich et al. Circulation 2011;123:933-944
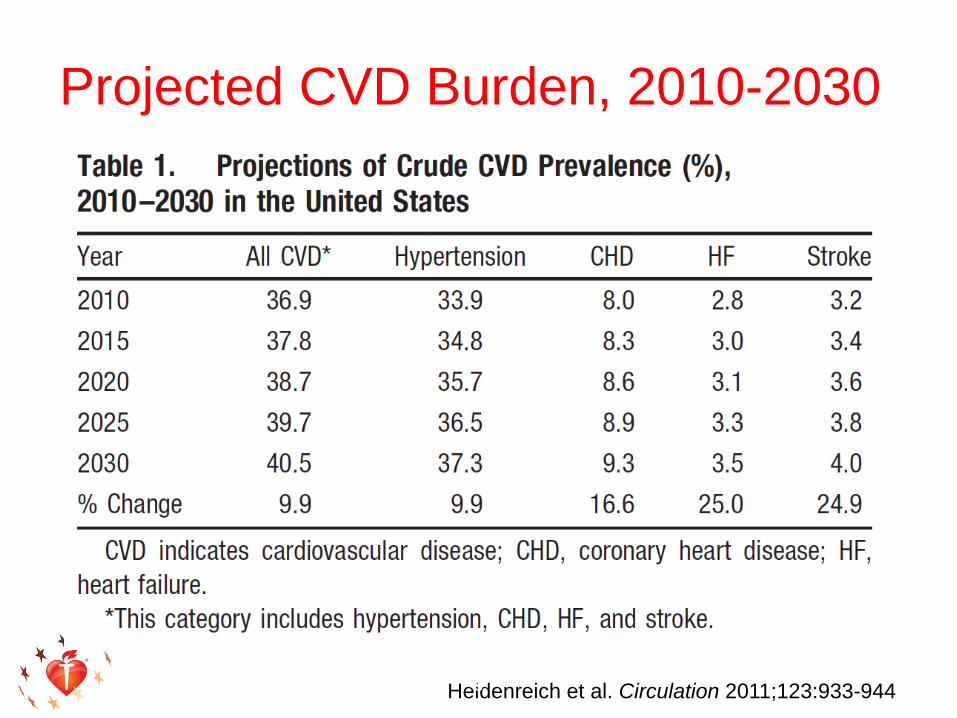
Projected CVD Burden, 2010-2030
Heidenreich et al. Circulation 2011;123:933-9445
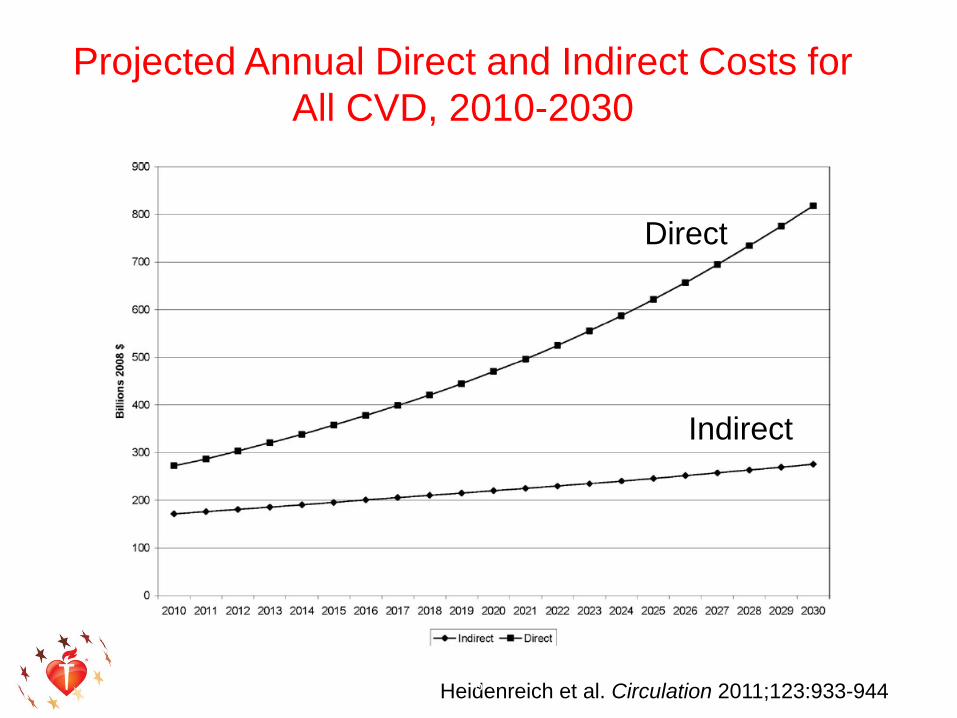
Projected Annual Direct and Indirect Costs for
All CVD, 2010-2030
Heidenreich et al. Circulation 2011;123:933-9446
Direct
Indirect
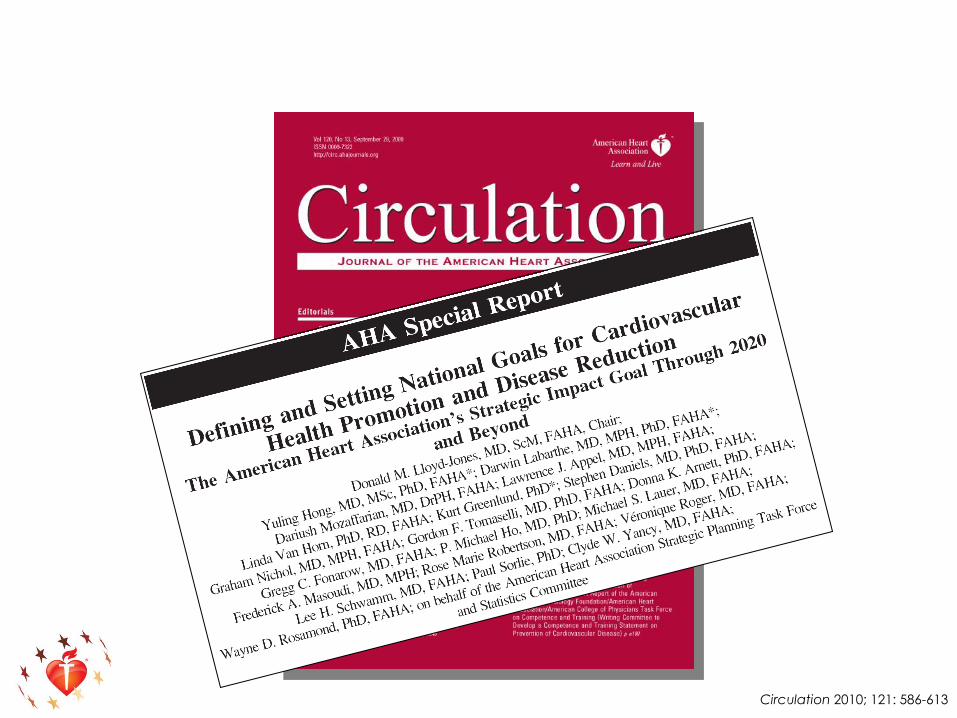
Circulation 2010; 121: 586-613

Considerations in Defining CV Health
• Health is a broader, more positive construct than
just the absence of disease
• Need for evidence base linked to CVD-free survival,
healthy longevity, and QOL
• Simple and accessible to providers, payers and
consumers Allowing all subsets of the population to improve
• Actionable items for individuals, practitioners and
policy-makers
• Measurable and can be monitored over time
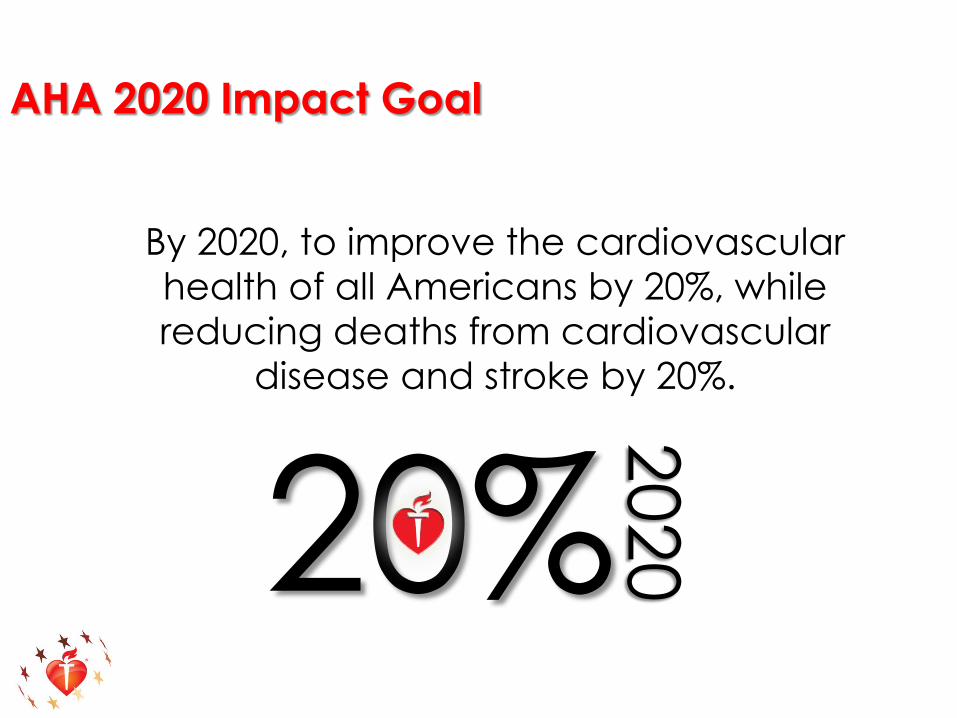
202020%
By 2020, to improve the cardiovascular
health of all Americans by 20%, while
reducing deaths from cardiovascular
disease and stroke by 20%.
AHA 2020 Impact Goal
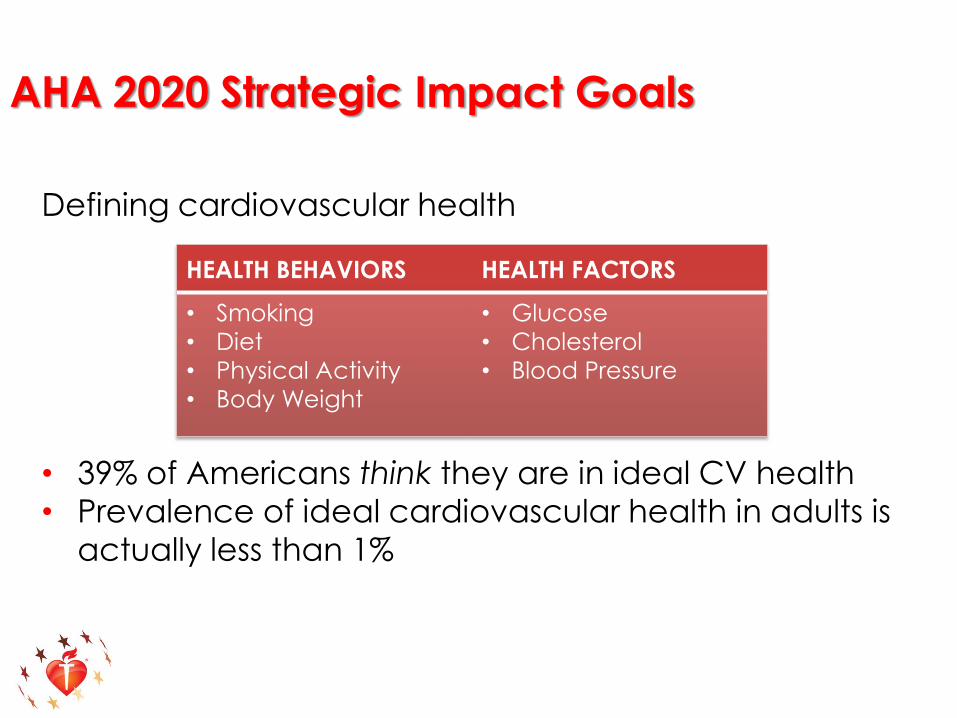
Defining cardiovascular health
• 39% of Americans think they are in ideal CV health
• Prevalence of ideal cardiovascular health in adults is
actually less than 1%
AHA 2020 Strategic Impact Goals
HEALTH BEHAVIORS HEALTH FACTORS
• Smoking
• Diet
• Physical Activity
• Body Weight
• Glucose
• Cholesterol
• Blood Pressure
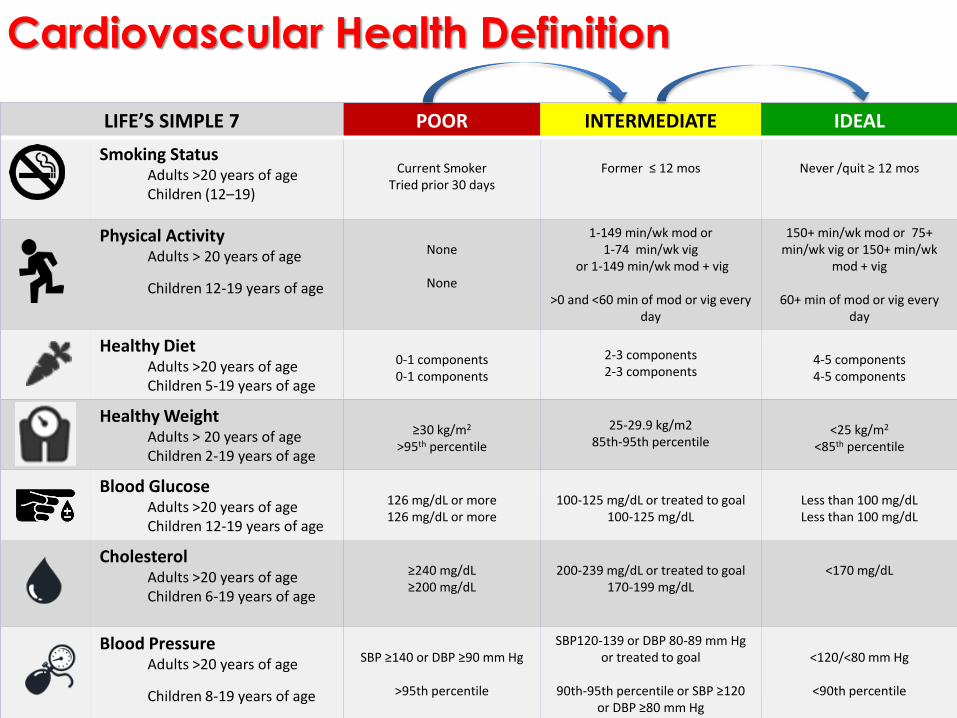
LIFE’S SIMPLE 7 POOR INTERMEDIATE IDEAL
Smoking StatusAdults >20 years of ageChildren (12–19)
Current SmokerTried prior 30 days
Former ≤ 12 mos Never /quit ≥ 12 mos
Physical ActivityAdults > 20 years of age
Children 12-19 years of age
None
None
1-149 min/wk mod or1-74 min/wk vig
or 1-149 min/wk mod + vig
>0 and <60 min of mod or vig every day
150+ min/wk mod or 75+ min/wk vig or 150+ min/wk
mod + vig
60+ min of mod or vig every day
Healthy DietAdults >20 years of ageChildren 5-19 years of age
0-1 components0-1 components
2-3 components2-3 components
4-5 components4-5 components
Healthy Weight Adults > 20 years of ageChildren 2-19 years of age
≥30 kg/m2
>95th percentile
25-29.9 kg/m285th-95th percentile
<25 kg/m2
<85th percentile
Blood GlucoseAdults >20 years of ageChildren 12-19 years of age
126 mg/dL or more126 mg/dL or more
100-125 mg/dL or treated to goal100-125 mg/dL
Less than 100 mg/dLLess than 100 mg/dL
CholesterolAdults >20 years of ageChildren 6-19 years of age
≥240 mg/dL≥200 mg/dL
200-239 mg/dL or treated to goal170-199 mg/dL
<170 mg/dL
Blood PressureAdults >20 years of age
Children 8-19 years of age
SBP ≥140 or DBP ≥90 mm Hg
>95th percentile
SBP120-139 or DBP 80-89 mm Hg or treated to goal
90th-95th percentile or SBP ≥120 or DBP ≥80 mm Hg
<120/<80 mm Hg
<90th percentile
Cardiovascular Health DefinitionsCardiovascular Health Definition
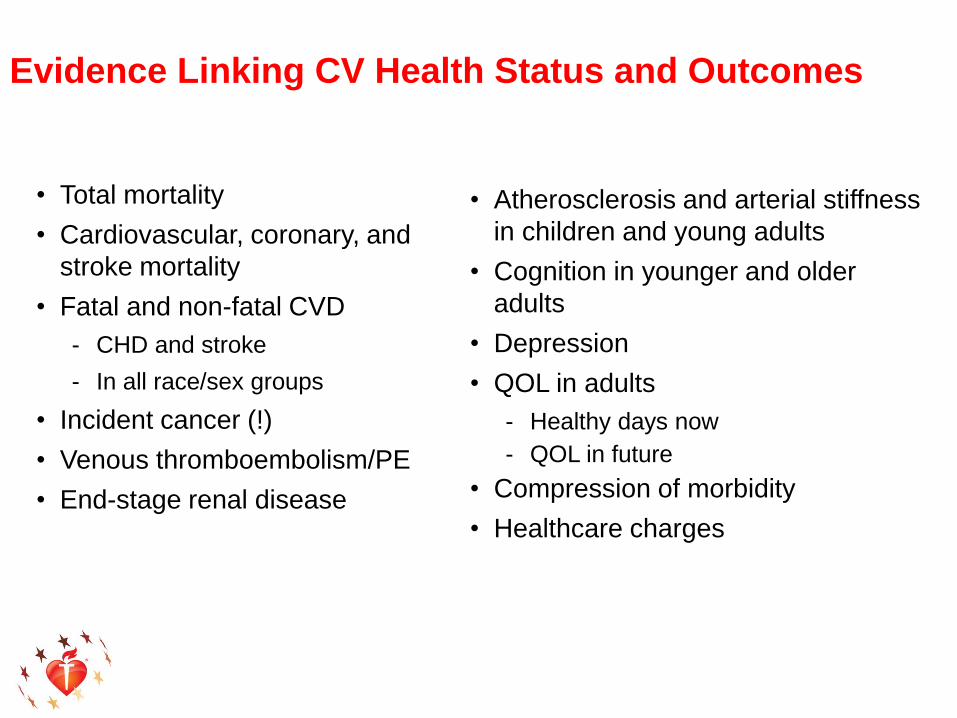
Evidence Linking CV Health Status and Outcomes
• Total mortality
• Cardiovascular, coronary, and
stroke mortality
• Fatal and non-fatal CVD
- CHD and stroke
- In all race/sex groups
• Incident cancer (!)
• Venous thromboembolism/PE
• End-stage renal disease
• Atherosclerosis and arterial stiffness
in children and young adults
• Cognition in younger and older
adults
• Depression
• QOL in adults
- Healthy days now
- QOL in future
• Compression of morbidity
• Healthcare charges
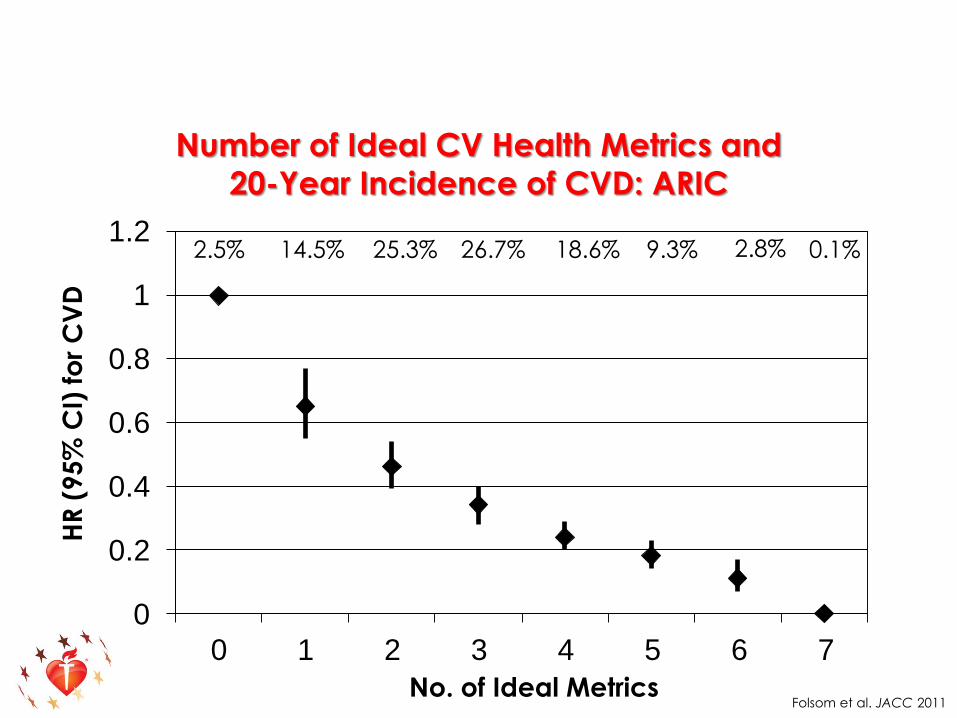
Number of Ideal CV Health Metrics and
20-Year Incidence of CVD: ARIC
0
0.2
0.4
0.6
0.8
1
1.2
0 1 2 3 4 5 6 7
No. of Ideal Metrics
HR
(9
5%
CI)
fo
r C
VD
Folsom et al. JACC 2011
0.1%2.8%9.3%18.6%26.7%25.3%14.5%2.5%
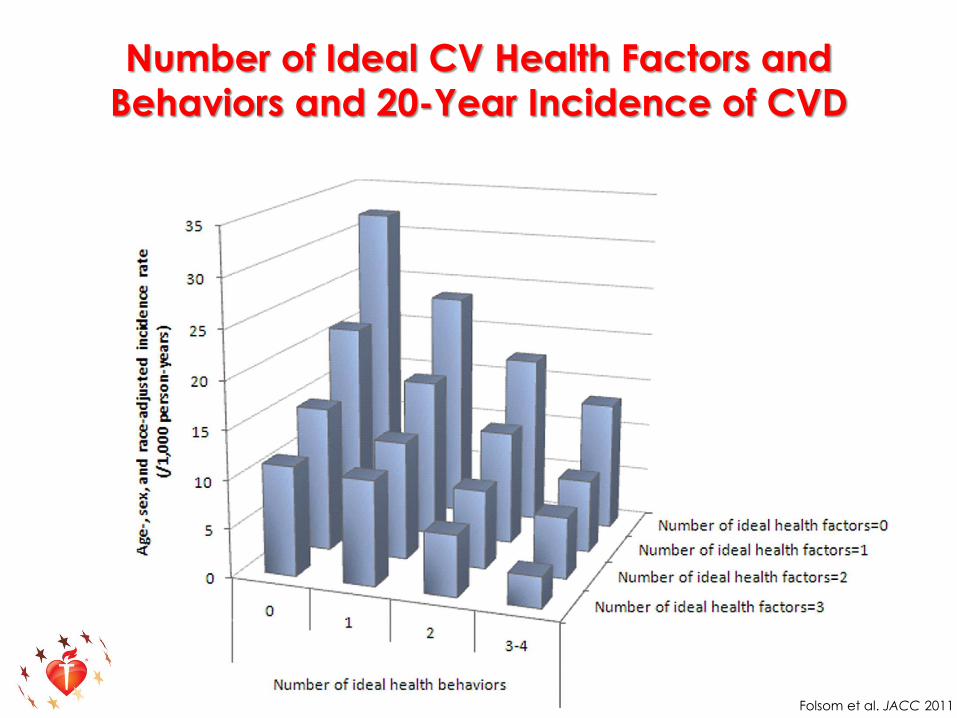
Number of Ideal CV Health Factors and
Behaviors and 20-Year Incidence of CVD
Folsom et al. JACC 2011
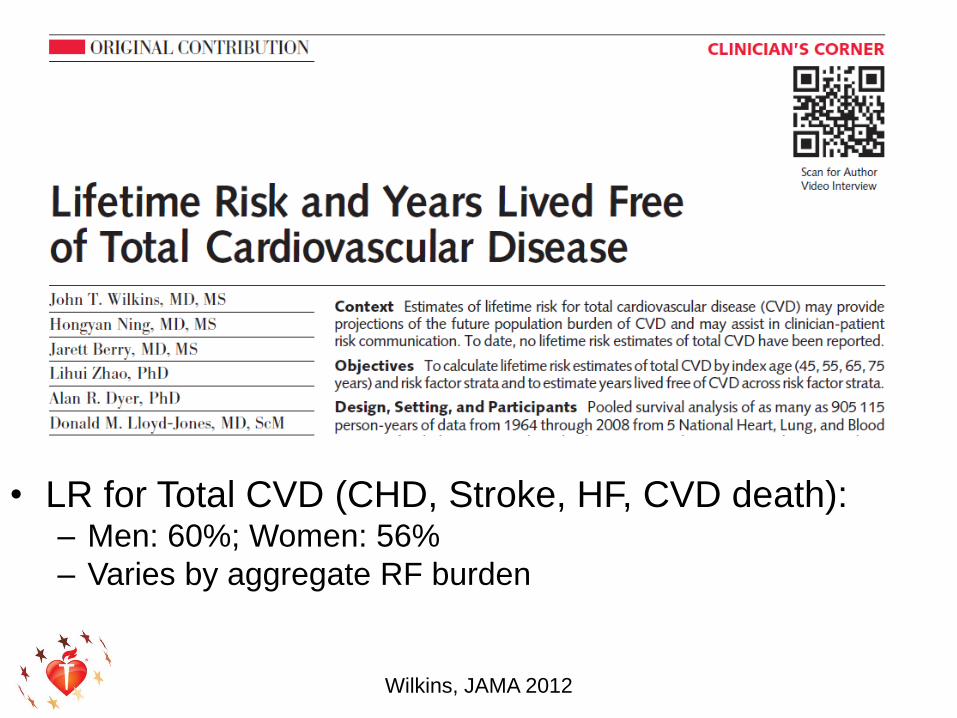
Wilkins, JAMA 2012
• LR for Total CVD (CHD, Stroke, HF, CVD death):– Men: 60%; Women: 56%
– Varies by aggregate RF burden
Wilkins, JAMA 2012 16
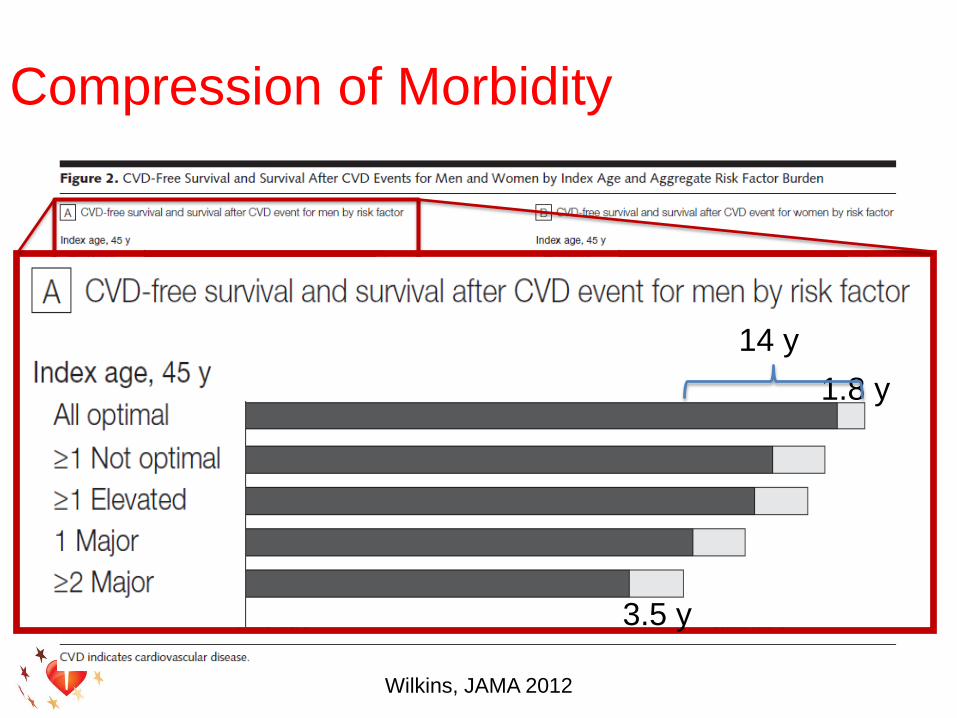
Compression of Morbidity
1.8 y
3.5 y
14 y
17 Rasmussen-Torvik et al., Circulation. 2013;127:1270-1275
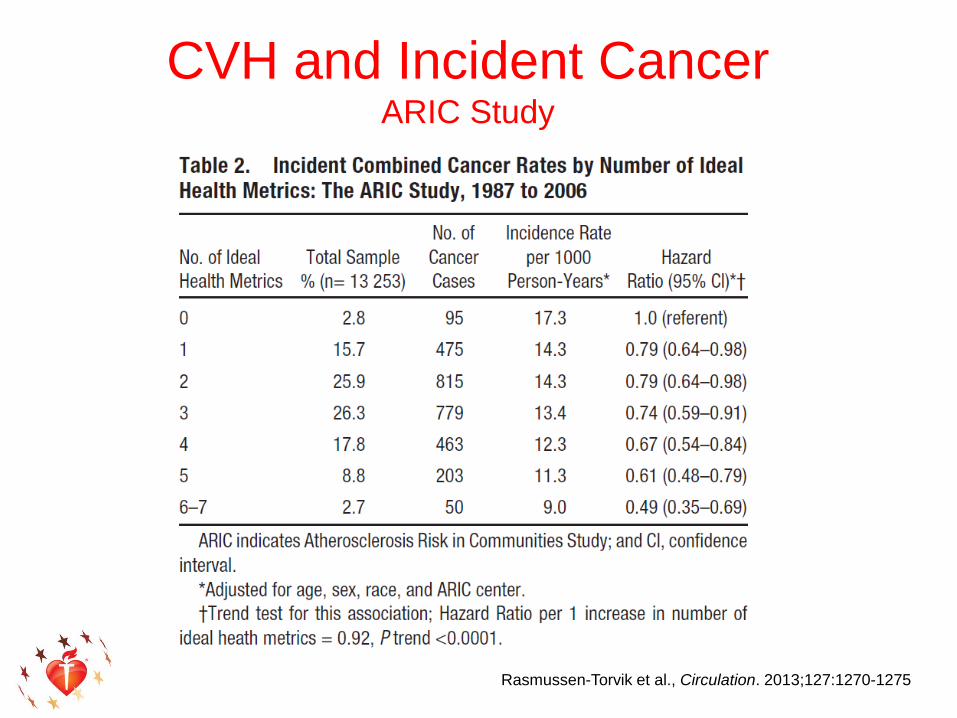
CVH and Incident CancerARIC Study
18 Rasmussen-Torvik et al., Circulation. 2013;127:1270-1275

Unhealthy Days in Men and Women by
CV Health Status: NHANES
Allen, Lloyd-Jones, Unpublished data

CV Health and Healthy DaysNHANES 2007-2010; N~7000
In the last 30 days… Poor CVH Intermediate
CVH
Ideal CVH
Odds Ratio (95% CI)
Excellent general health 1.0 2.6 (2.1, 3.3) 6.4 (4.8, 8.4)
Physical health not good ≥14 days 1.0 0.6 (0.5, 0.8) 0.4 (0.3, 0.6)
Mental health not good ≥14 days 1.0 0.7 (0.6, 0.8) 0.4 (0.3, 0.5)
Inactive ≥14 days 1.0 0.6 (0.5, 0.9) 0.3 (0.2, 0.5)
Mean Difference (Days)
Unhealthy days - -1.5 (-2.1, -1.0) -3.2 (-4.0, -2.4)
Days of poor physical health - -1.2 (-1.7, -0.6) -1.7 (-2.3, -1.0)
Days of poor mental health - -1.0 (-1.4, -0.5) -2.2 (-2.8, -1.7)
Unable to perform usual activities - -0.6 (-1.0, -0.2) -0.8 (-1.2, -0.4)
Allen, Lloyd-Jones, Unpublished dataLarger effects in women; similar across R/E groups
21
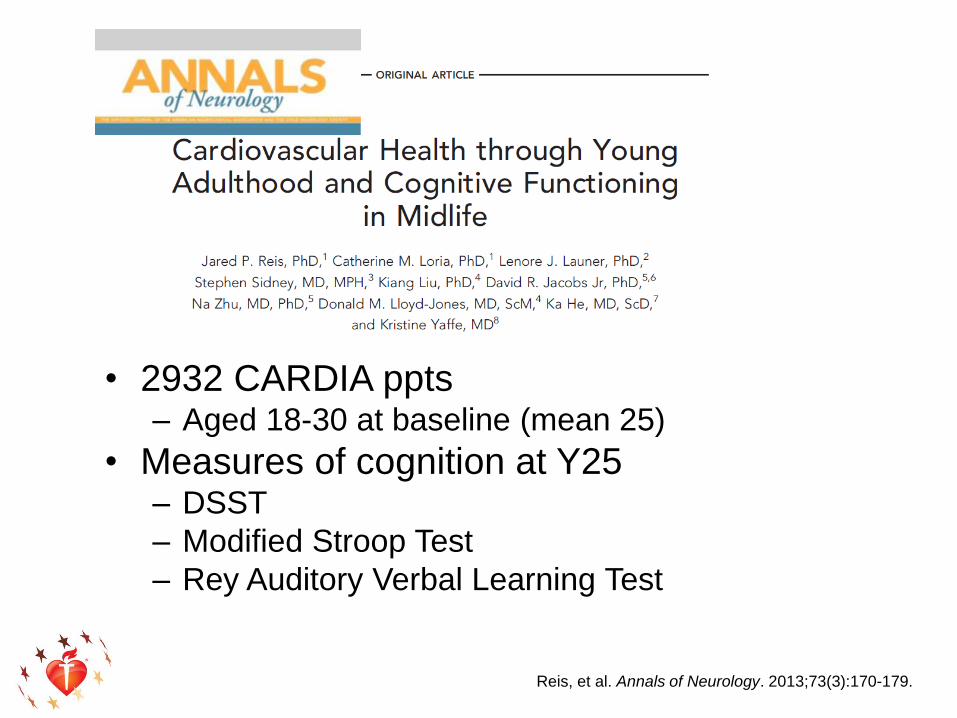
• 2932 CARDIA ppts– Aged 18-30 at baseline (mean 25)
• Measures of cognition at Y25– DSST
– Modified Stroop Test
– Rey Auditory Verbal Learning Test
Reis, et al. Annals of Neurology. 2013;73(3):170-179.
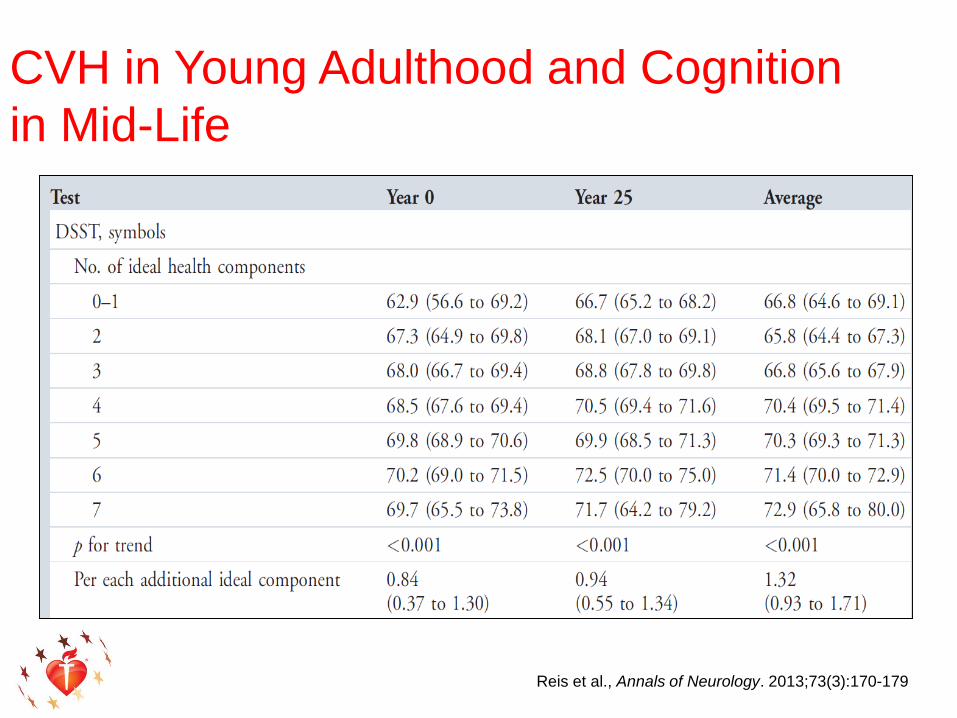
CVH in Young Adulthood and Cognition
in Mid-Life
Reis et al., Annals of Neurology. 2013;73(3):170-179
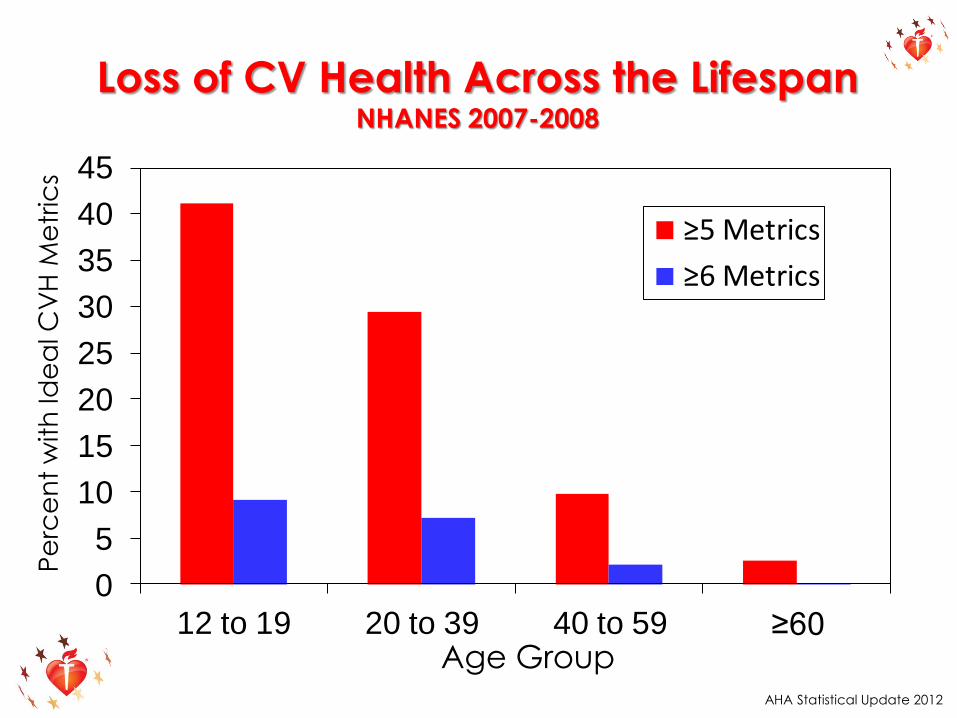
AHA Statistical Update 2012
Loss of CV Health Across the LifespanNHANES 2007-2008
41.2
29.4
9.7
2.5
9.17.2
2.10.1
0
5
10
15
20
25
30
35
40
45
12 to 19 20 to 39 40 to 59 ≥60
≥5 Metrics
≥6 Metrics
Age Group
Pe
rce
nt
with
Id
ea
l CV
H M
etr
ics
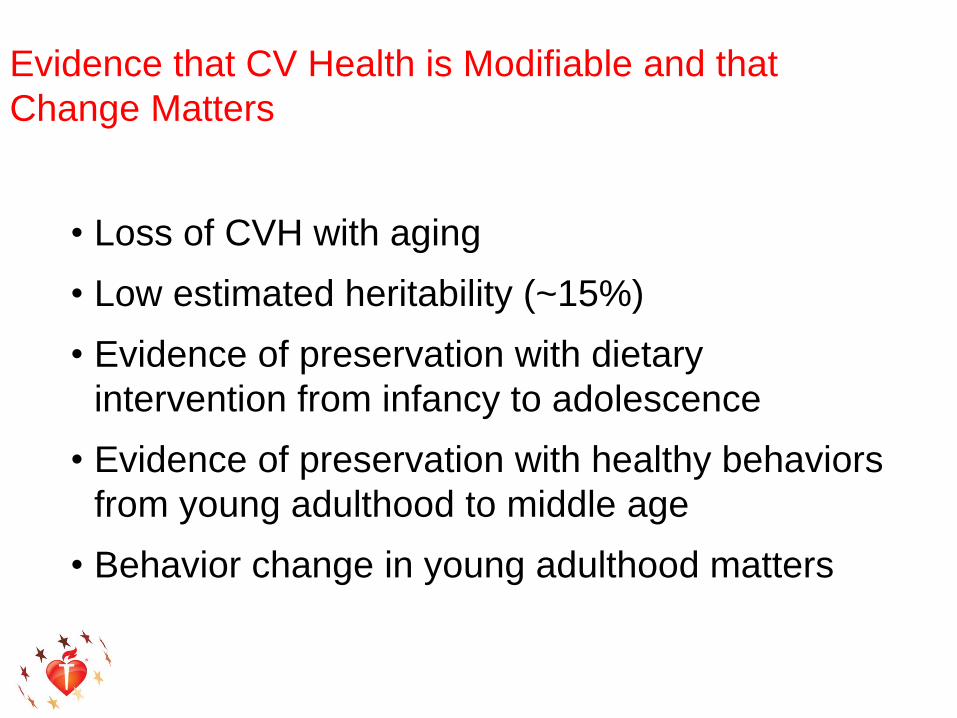
Evidence that CV Health is Modifiable and that
Change Matters
• Loss of CVH with aging
• Low estimated heritability (~15%)
• Evidence of preservation with dietary
intervention from infancy to adolescence
• Evidence of preservation with healthy behaviors
from young adulthood to middle age
• Behavior change in young adulthood matters
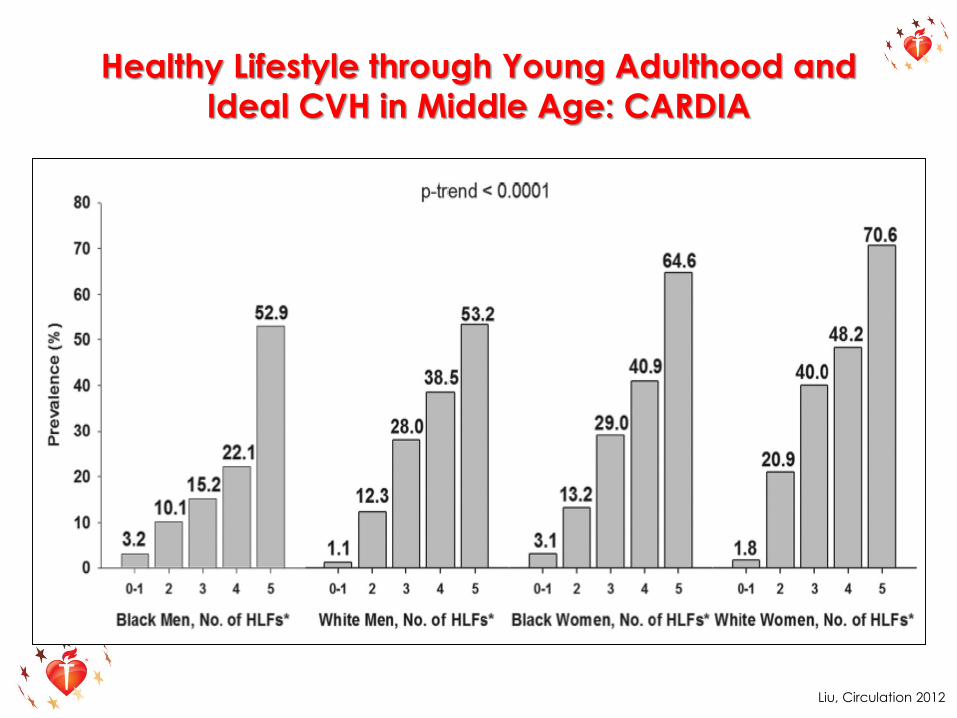
Liu, Circulation 2012
Healthy Lifestyle through Young Adulthood and
Ideal CVH in Middle Age: CARDIA
0 10 20 30 40
BL +3 or 4
+ 2
+ 1
No change
- 1
- 2
BL -3 or 4
Prevalence (%) of Coronary Calcium at Year 20
He
alth
y Li
fest
yle
Fac
tor
Ch
ange
Y0
to
Y2
0
Healthy Lifestyles
• Lean body mass
• Low alcohol
• Healthy diet
• Phys. activity
• Nonsmoker
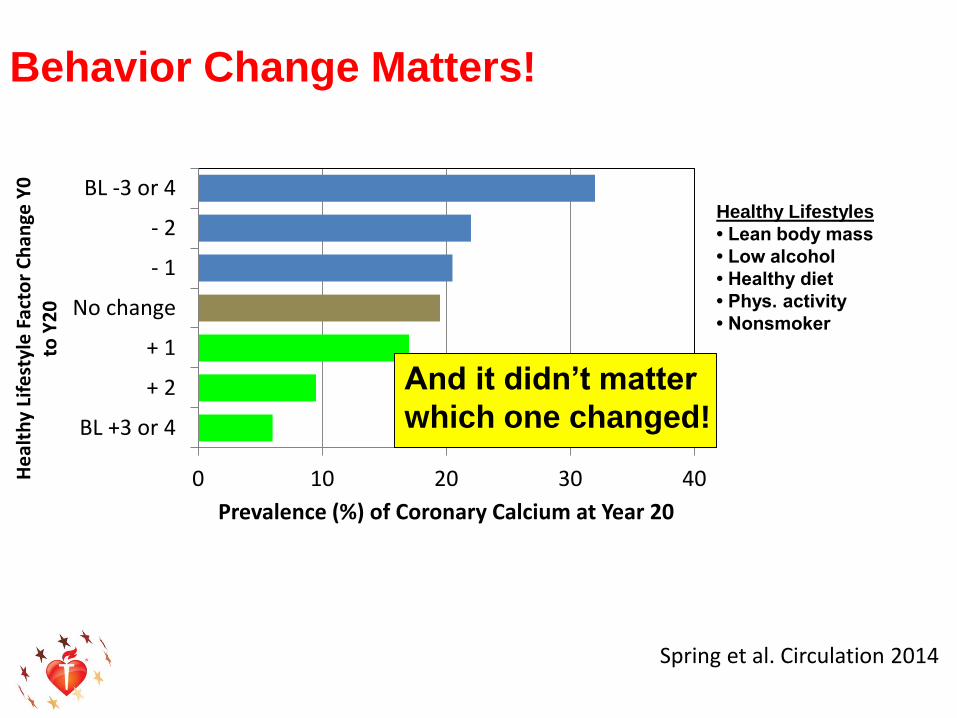
Spring et al. Circulation 2014
And it didn’t matter
which one changed!
Behavior Change Matters!
27 Fonarow et al. Circulation 2015
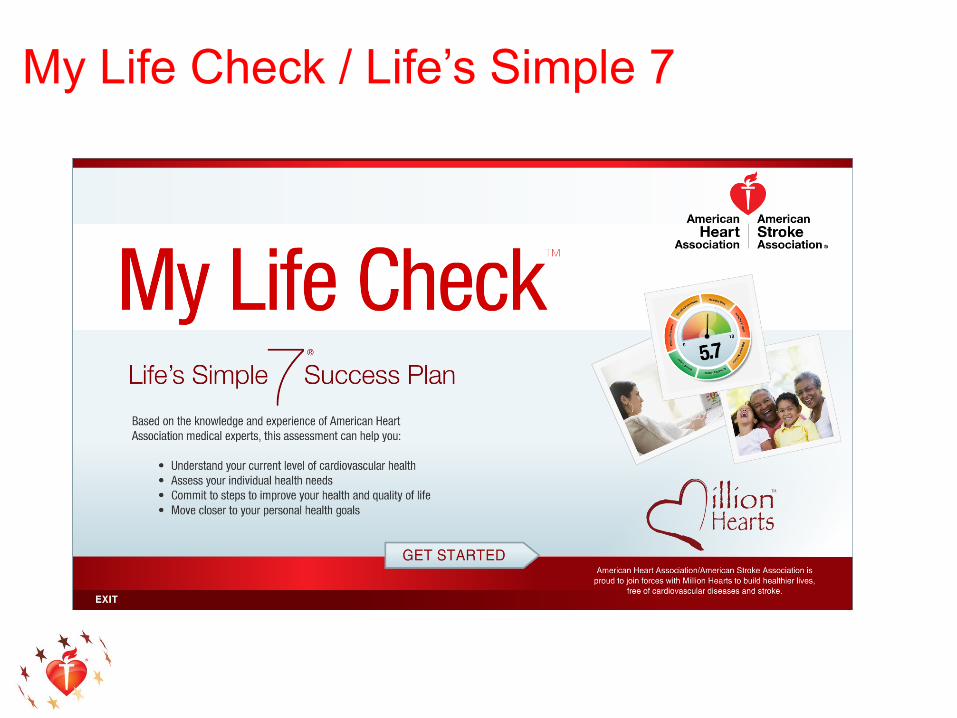
My Life Check / Life’s Simple 7
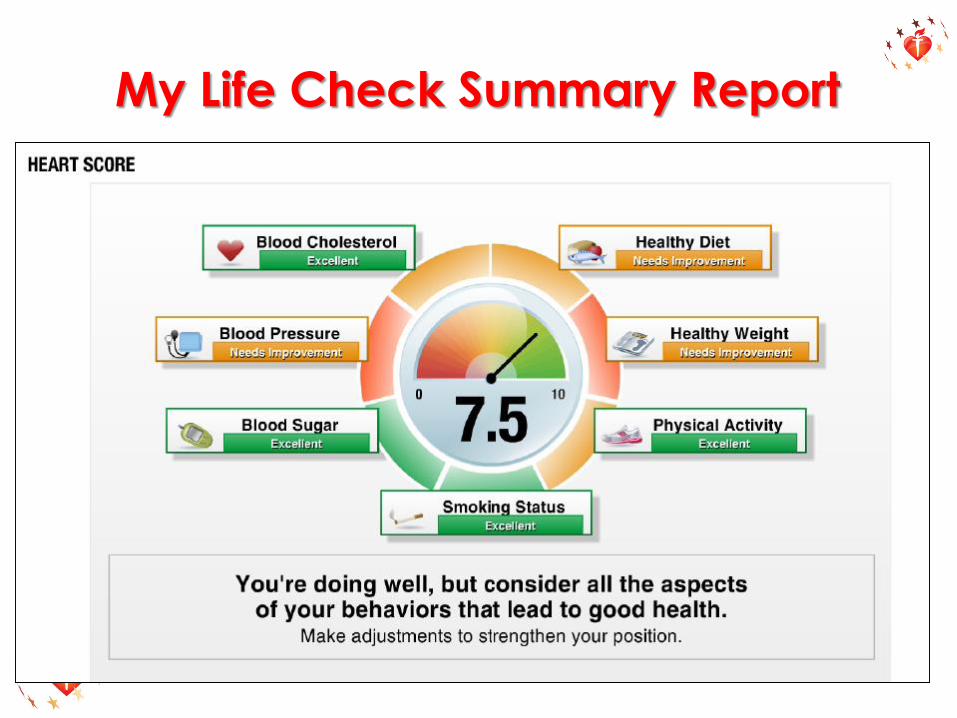
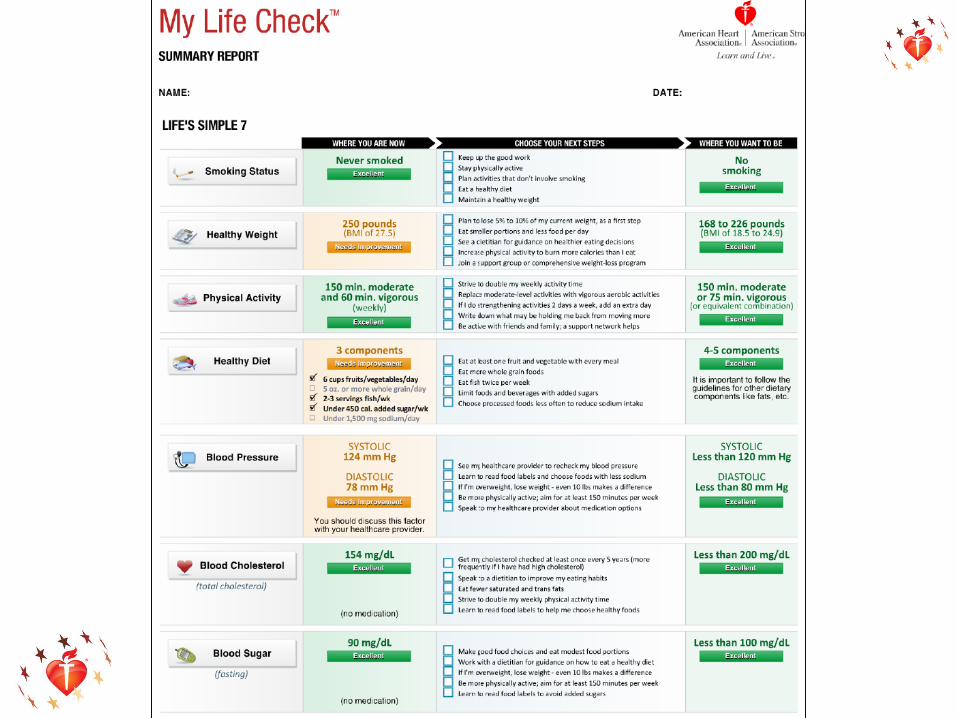
My Life Check Summary Report
Thank You!
Questions?