life cycle assessment of polymers in an automotive assist … · life cycle assessment of polymers...
TRANSCRIPT

Life Cycle Assessment of Polymers in an Automotive Assist Step
for
American Chemistry Council
by
PE INTERNATIONAL, Inc.
April 23, 2012

ACC Automotive Part LCA
Contact:
Christoph Koffler
Margaret Zahller
PE INTERNATIONAL, Inc.
344 Boylston Street
Boston, MA 02116, USA
Phone +1 [617] 247-4477
Fax +1 [617] 236-2033
E-mail [email protected]
Internet www.pe-international.com

ACC Automotive Part LCA page i April 23, 2012
TABLE OF CONTENTS
LIST OF FIGURES ........................................................................................................................................... III
LIST OF TABLES ............................................................................................................................................. IV
ABBREVIATIONS.............................................................................................................................................. V
1 EXECUTIVE SUMMARY......................................................................................................................... 6
2 GOAL OF THE STUDY ............................................................................................................................ 9
3 SCOPE OF THE STUDY ......................................................................................................................... 10
3.1 SYSTEM DESCRIPTION ............................................................................................................................. 10 3.2 FUNCTIONAL UNIT .................................................................................................................................. 10 3.3 STUDY BOUNDARIES ............................................................................................................................... 11
3.3.1 Technology Coverage ................................................................................................................... 11 3.3.2 Geographic Coverage ................................................................................................................... 12 3.3.3 Time Coverage .............................................................................................................................. 12
3.4 SELECTION OF IMPACT ASSESSMENT CATEGORIES ................................................................................. 12 3.5 DATA COLLECTION ................................................................................................................................. 13
3.5.1 Fuels and Energy .......................................................................................................................... 13 3.5.2 Raw and Process Materials .......................................................................................................... 13 3.5.3 Co-product and By-product Allocation ........................................................................................ 13 3.5.4 End-of-Life Disposition ................................................................................................................ 13 3.5.5 Cut-off Criteria ............................................................................................................................. 13 3.5.6 Data Quality ................................................................................................................................. 14 3.5.7 Exceptions ..................................................................................................................................... 14
3.6 SOFTWARE AND DATABASE .................................................................................................................... 14 3.7 INTERPRETATION .................................................................................................................................... 15 3.8 CRITICAL REVIEW ................................................................................................................................... 15 3.9 QUALITY ASSURANCE ............................................................................................................................. 16 3.10 DELIVERABLES ................................................................................................................................... 16
4 LIFE CYCLE INVENTORY ................................................................................................................... 17
4.1 CRADLE-TO-GATE PRODUCTION ............................................................................................................. 17 4.1.1 Chevrolet Trailblazer / GMC Envoy Metal Assist Step Material Composition (Baseline) ........... 17 4.1.2 Chevrolet Trailblazer / GMC Envoy Plastic Assist Step Material Composition .......................... 17 4.1.3 Production .................................................................................................................................... 17
4.2 CALCULATION OF USE PHASE FUEL SAVINGS ......................................................................................... 21 4.3 END-OF-LIFE TREATMENT ...................................................................................................................... 24
5 RESULTS .................................................................................................................................................. 25
6 SCENARIO AND SENSITIVITY ANALYSIS ...................................................................................... 30
6.1 POWER TRAIN ADAPTATION SCENARIO .................................................................................................. 30 6.2 CALCULATION OF USE PHASE FUEL SAVINGS UNCERTAINTY ................................................................. 31 6.3 CUT-OFF APPROACH ............................................................................................................................... 34 6.4 REPLACEMENT OF METAL ASSIST STEP SCENARIO ................................................................................. 36 6.5 PLASTIC DATASET COMPARISON ............................................................................................................ 37
7 INTERPRETATION ................................................................................................................................ 39
7.1 COMPLETENESS, SENSITIVITY, AND CONSISTENCY ................................................................................. 39 7.1.1 Completeness ................................................................................................................................ 39 7.1.2 Sensitivity and Scenario Analysis ................................................................................................. 39 7.1.3 Consistency ................................................................................................................................... 39

ACC Automotive Part LCA page ii April 23, 2012
7.2 LIMITATIONS, CONCLUSIONS, AND RECOMMENDATIONS ........................................................................ 39 7.2.1 Limitations .................................................................................................................................... 39 7.2.2 Conclusions and Recommendations ............................................................................................. 40
APPENDIX A: LIFE CYCLE IMPACT ASSESSMENT CATEGORIES ................................................... 42
APPENDIX B: CRITICAL REVIEW REPORT ............................................................................................ 44
APPENDIX C: DETAILED MANUFACTURING RESULTS ...................................................................... 47
APPENDIX D: RESULTS FOR EUTROPHICATION AND SMOG POTENTIAL................................... 52
ABOUT PE INTERNATIONAL ....................................................................................................................... 54

ACC Automotive Part LCA page iii April 23, 2012
LIST OF FIGURES FIGURE 1: LIFE CYCLE FLOW DIAGRAM FOR SYSTEM OF STUDY .......................................................................... 10 FIGURE 2: CRADLE-TO-GATE PRODUCTION OF STEEL PART .................................................................................. 19 FIGURE 3: CRADLE-TO-GATE PRODUCTION OF PLASTIC PART ............................................................................... 20 FIGURE 4: WILLANS LINES OF A 1.4 L TURBO-CHARGED GASOLINE ENGINE (90 KW) FOR LOW OUTPUT AND LOW
RPM .............................................................................................................................................................. 22 FIGURE 5: ASSIST STEP NORMALIZED TRACI ENVIRONMENTAL INDICATORS – ALTERNATIVE MINUS BASELINE
.................................................................................................................................................................... 26 FIGURE 6: ASSIST STEP PRIMARY ENERGY DEMAND – ALTERNATIVE MINUS BASELINE ...................................... 27 FIGURE 7: ASSIST STEP GLOBAL WARMING POTENTIAL – ALTERNATIVE MINUS BASELINE ................................ 28 FIGURE 8: ASSIST STEP ACIDIFICATION POTENTIAL – ALTERNATIVE MINUS BASELINE ....................................... 29 FIGURE 9: ASSIST STEP ADAPTATION PRIMARY ENERGY DEMAND – ALTERNATIVE MINUS BASELINE ................ 30 FIGURE 10: ASSIST STEP ADAPTATION GLOBAL WARMING POTENTIAL – ALTERNATIVE MINUS BASELINE ......... 30 FIGURE 11: ASSIST STEP ADAPTATION ACIDIFICATION POTENTIAL – ALTERNATIVE MINUS BASELINE ............... 31 FIGURE 12: FUEL REDUCTION POTENTIAL - MONTE CARLO SIMULATION RESULTS WITHOUT DRIVE TRAIN
ADAPTATION ................................................................................................................................................ 33 FIGURE 13: FUEL REDUCTION POTENTIAL - MONTE CARLO SIMULATION RESULTS WITH DRIVE TRAIN ADAPTATION
.................................................................................................................................................................... 34 FIGURE 14: ASSIST STEP CUT-OFF PRIMARY ENERGY DEMAND – ALTERNATIVE MINUS BASELINE ..................... 35 FIGURE 15: ASSIST STEP CUT-OFF GLOBAL WARMING POTENTIAL – ALTERNATIVE MINUS BASELINE ................ 35 FIGURE 16: ASSIST STEP CUT-OFF ACIDIFICATION POTENTIAL – ALTERNATIVE MINUS BASELINE ...................... 36 FIGURE 17: ASSIST STEP REPLACEMENT PRIMARY ENERGY DEMAND – ALTERNATIVE MINUS BASELINE ........... 37 FIGURE 18: ASSIST STEP REPLACEMENT GLOBAL WARMING POTENTIAL – ALTERNATIVE MINUS BASELINE ...... 37 FIGURE 19: ASSIST STEP REPLACEMENT ACIDIFICATION POTENTIAL – ALTERNATIVE MINUS BASELINE ............. 37 FIGURE 20: POLYPROPYLENE DATASET COMPARISON .......................................................................................... 38 FIGURE 21: ASSIST STEP MANUFACTURING PRIMARY ENERGY DEMAND – BY COMPONENT ................................ 47 FIGURE 22: ASSIST STEP MANUFACTURING PRIMARY ENERGY DEMAND – BY MATERIAL/PROCESS .................... 48 FIGURE 23: ASSIST STEP MANUFACTURING GLOBAL WARMING POTENTIAL – BY COMPONENT ........................... 48 FIGURE 24: ASSIST STEP MANUFACTURING GLOBAL WARMING POTENTIAL – BY MATERIAL/PROCESS............... 49 FIGURE 25: ASSIST STEP MANUFACTURING ACIDIFICATION POTENTIAL – BY COMPONENT ................................. 50 FIGURE 26: ASSIST STEP MANUFACTURING ACIDIFICATION POTENTIAL – BY MATERIAL/PROCESS ..................... 50 FIGURE 27: ASSIST STEP EUTROPHICATION POTENTIAL – ALTERNATIVE MINUS BASELINE ................................. 52 FIGURE 28: ASSIST STEP SMOG POTENTIAL – ALTERNATIVE MINUS BASELINE .................................................... 53

ACC Automotive Part LCA page iv April 23, 2012
LIST OF TABLES TABLE 1: SYSTEM BOUNDARIES ............................................................................................................................ 11 TABLE 2: METAL ASSIST STEP MATERIAL COMPOSITION ..................................................................................... 17 TABLE 3: PLASTIC ASSIST STEP MATERIAL COMPOSITION .................................................................................... 17 TABLE 4: DATASETS USED FOR PRODUCTION OF STEEL PARTS............................................................................. 19 TABLE 5: DATASETS USED FOR PRODUCTION OF PLASTIC PARTS ......................................................................... 21 TABLE 6: DATASET USED FOR STEEL FASTENERS ................................................................................................. 21 TABLE 7: TRACI NORMALIZATION FACTORS ....................................................................................................... 26 TABLE 8: ASSIST STEP PRIMARY ENERGY DEMAND ............................................................................................. 27 TABLE 9: ASSIST STEP GLOBAL WARMING POTENTIAL ........................................................................................ 28 TABLE 10: ASSIST STEP ACIDIFICATION POTENTIAL ............................................................................................. 28 TABLE 11: ASSIST STEP WITH ADAPTATION – ALTERNATIVE MINUS BASELINE ................................................... 30 TABLE 12: INTERVALS IN USE PHASE MONTE CARLO SIMULATION (10,000 RUNS, UNIFORM DISTRIBUTION) ....... 32 TABLE 13: CRADLE-TO-GRAVE BASE AND MONTE CARLO SCENARIOS – ALTERNATIVE MINUS BASELINE .......... 34 TABLE 14: ASSIST STEP RESULTS – CUT-OFF APPROACH ...................................................................................... 35 TABLE 15: REPLACEMENT OF METAL ASSIST STEP SCENARIO – ALTERNATIVE MINUS BASELINE ....................... 36 TABLE 16: ASSIST STEP MANUFACTURING PRIMARY ENERGY DEMAND – BY COMPONENT ................................. 47 TABLE 17: ASSIST STEP MANUFACTURING PRIMARY ENERGY DEMAND – BY MATERIAL/PROCESS ..................... 47 TABLE 18: ASSIST STEP MANUFACTURING GLOBAL WARMING POTENTIAL – BY COMPONENT ............................ 48 TABLE 19: ASSIST STEP MANUFACTURING GLOBAL WARMING POTENTIAL – BY MATERIAL/PROCESS ................ 49 TABLE 20: ASSIST STEP MANUFACTURING ACIDIFICATION POTENTIAL – BY COMPONENT .................................. 49 TABLE 21: ASSIST STEP MANUFACTURING ACIDIFICATION POTENTIAL – BY MATERIAL/PROCESS ...................... 50 TABLE 22: ASSIST STEP EUTROPHICATION POTENTIAL ......................................................................................... 52 TABLE 23: ASSIST STEP SMOG POTENTIAL............................................................................................................ 53

ACC Automotive Part LCA page v April 23, 2012
ABBREVIATIONS
ACC American Chemistry Council CML Centre of Environmental Science at Leiden CO2 Carbon dioxide DE Germany dataset country code EoL End-of-Life EPA Environmental Protection Agency GaBi Ganzheitliche Bilanzierung (German for holistic balancing). The GaBi 4 software for
life cycle engineering, developed by PE INTERNATIONAL AG, is a market-leading software package for LCA modeling. PE INTERNATIONAL’s GaBi database contains life cycle inventory data.
GHG Greenhouse gas GLO Global dataset country code GWP Global Warming Potential H+ Hydron (hydrogen cation) IPCC Intergovernmental Panel on Climate Change ISO International Organization for Standardization LCA Life Cycle Assessment LCI Life Cycle Inventory LCIA Life Cycle Impact Assessment MJ Megajoule N Nitrogen NOx Nitrogen oxides NREL National Renewable Energy Laboratory, Golden, CO P Phosphorous PED Primary Energy Demand POCP Photochemical Ozone Creation Potential RNA North America dataset country code TRACI US EPA’s Tool for the Reduction and Assessment of Chemical and Other
Environmental Impacts US United States dataset country code VOC Volatile Organic Compound

ACC Automotive Part LCA page 6 April 23, 2012
1 EXECUTIVE SUMMARY
This life cycle assessment study carried out on behalf of the American Chemistry Council (ACC)
assesses the life cycle performance of polymers in comparison to metals for an automotive assist step
(also known as a running board). ACC plans on using this case study to:
Understand the potential life cycle impact of using polymers in an automotive application where metals are more commonly used
Encourage the use of life cycle thinking in the choice of materials when designing auto parts
Identify whether the use of polymers shows environmental benefits in this application
Inform design for environment efforts in the automotive industry with quantitative potential life cycle impact information.
The cradle-to-grave LCA considers a total service life of 150,000 miles for a Chevrolet Trailblazer /
GMC Envoy metal assist step (baseline product) compared to its replacement product, a one-piece
plastic assist step. The plastic assist step is 51% lighter than the metal assist step.
This report describes the environmental impacts by life cycle stage, as well as the total difference in
impact between the two assist steps. The life cycle stages included in this LCA study address the
production of upstream materials and energy, product manufacturing, use, and the end-of-life
treatment for all materials used throughout the life cycle. The report and the underlying methodologies
and approaches have undergone external, independent critical review and fully comply with the
requirements of the ISO 14040/14044 standards. The inventory and impact categories assessed are
non-renewable primary energy demand, global warming potential, acidification potential,
eutrophication potential, and smog potential. For detailed descriptions see Appendix A: Life Cycle
Impact Assessment Categories.
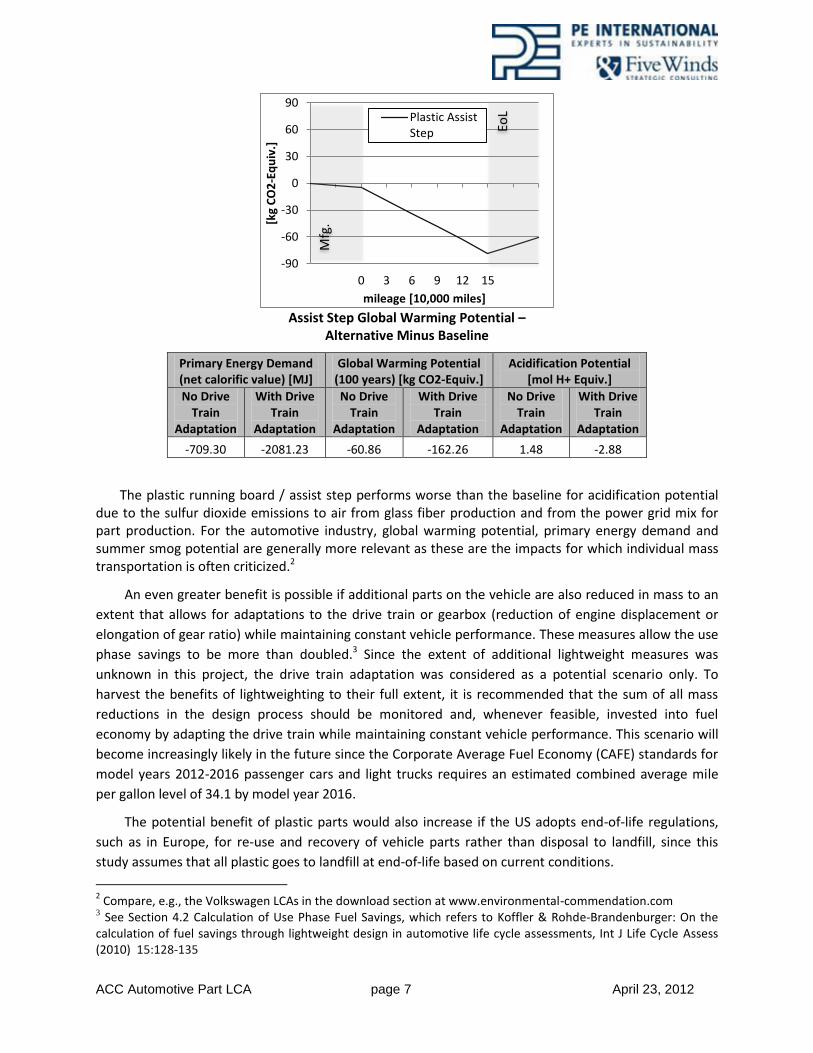
The results show that the lightweight plastic product outperforms the metal product for global warming potential and primary energy demand, meaning that the net impact indicator over the full life cycle is lower (see figure and table below). This is expressed by a net negative value, since the performance is shown as the difference from the baseline (plastic assist step results minus metal assist step results).
Applying US EPA’s TRACI normalization factors1 demonstrated that summer smog and
eutrophication potential only make minor contributions to the environmental profile compared to the
other impact categories in this study. These results are provided in Appendix D: Results for
Eutrophication and Smog Potential.
1 Bare et al: Development of the Method and U.S. Normalization Database for Life Cycle Impact Assessment and
Sustainability Metrics, Environmental Science & Technology (2006) 40:5108-5115
ACC Automotive Part LCA page 7 April 23, 2012
Assist Step Global Warming Potential –
Alternative Minus Baseline
Primary Energy Demand (net calorific value) [MJ]
Global Warming Potential (100 years) [kg CO2-Equiv.]
Acidification Potential [mol H+ Equiv.]
No Drive Train
Adaptation
With Drive Train
Adaptation
No Drive Train
Adaptation
With Drive Train
Adaptation
No Drive Train
Adaptation
With Drive Train
Adaptation
-709.30 -2081.23 -60.86 -162.26 1.48 -2.88
The plastic running board / assist step performs worse than the baseline for acidification potential due to the sulfur dioxide emissions to air from glass fiber production and from the power grid mix for part production. For the automotive industry, global warming potential, primary energy demand and summer smog potential are generally more relevant as these are the impacts for which individual mass transportation is often criticized.2
An even greater benefit is possible if additional parts on the vehicle are also reduced in mass to an
extent that allows for adaptations to the drive train or gearbox (reduction of engine displacement or
elongation of gear ratio) while maintaining constant vehicle performance. These measures allow the use
phase savings to be more than doubled.3 Since the extent of additional lightweight measures was
unknown in this project, the drive train adaptation was considered as a potential scenario only. To
harvest the benefits of lightweighting to their full extent, it is recommended that the sum of all mass
reductions in the design process should be monitored and, whenever feasible, invested into fuel
economy by adapting the drive train while maintaining constant vehicle performance. This scenario will
become increasingly likely in the future since the Corporate Average Fuel Economy (CAFE) standards for
model years 2012-2016 passenger cars and light trucks requires an estimated combined average mile
per gallon level of 34.1 by model year 2016.
The potential benefit of plastic parts would also increase if the US adopts end-of-life regulations,
such as in Europe, for re-use and recovery of vehicle parts rather than disposal to landfill, since this
study assumes that all plastic goes to landfill at end-of-life based on current conditions.
2 Compare, e.g., the Volkswagen LCAs in the download section at www.environmental-commendation.com
3 See Section 4.2 Calculation of Use Phase Fuel Savings, which refers to Koffler & Rohde-Brandenburger: On the
calculation of fuel savings through lightweight design in automotive life cycle assessments, Int J Life Cycle Assess (2010) 15:128-135
-90
-60
-30
0
30
60
90
0 3 6 9 12 15[k
g C
O2
-Eq
uiv
.]
mileage [10,000 miles]
Plastic AssistStep Eo
L
Mfg
.

ACC Automotive Part LCA page 8 April 23, 2012
Concluding, it appears reasonable to state that while the lighter plastic part shows only small
differences to the metal assist step with regard to summer smog, eutrophication, and acidification
potential, it has the potential to lower the global warming potential and primary energy demand of its
metal counterpart over the full life cycle. Future conditions such as more stringent fuel economy and
end-of-life regulations will likely increase this potential benefit across all impact categories. These
conclusions are drawn for the specific part examined in this study and shall not be generalized to
encompass all plastic vs. metal part comparisons. Specific design options should always be assessed on a
case-by-case basis whether for environmental, cost, or performance purposes as different materials or
combinations of materials may render different results.

ACC Automotive Part LCA page 9 April 23, 2012
2 GOAL OF THE STUDY
The comparative life cycle assessment (LCA) project outlined in this document was carried out on
behalf of the American Chemistry Council (ACC), and considers the potential life cycle environmental
impacts of using polymers as an alternative to metals in the design of an automotive assist step (also
known as a running board). ACC plans on using this case study to:
Understand the potential life cycle impact potential of using polymers in an automotive application
Encourage the use of life cycle thinking in the choice of materials when designing auto parts
Identify whether the use of polymers shows environmental benefits in this application
Inform design for environment efforts in the automotive industry with quantitative potential life cycle impact information.
The goal of this study is to assess the life cycle environmental performance of engineering polymers
in comparison to metals which are more commonly used in the considered automotive application. A
general review of the relative performance attributes and potential life cycle impacts / benefits of these
materials were considered, as well as detailed examination of the case study in which polymers were
used to replace metal parts in a high-volume automotive application.
This study provides ACC with a quantitative point of reference of the environmental life cycle
performance of polymer use in automotive applications, and will aid product development and decision-
making amongst member companies and stakeholders. This study is intended to be an ISO 14040-series
compliant life cycle assessment (LCA).
Potential stakeholders for this project include:
The ACC automotive group
The ACC member companies
Automotive designers and manufacturers
Automotive supply chain managers
Automotive part suppliers
Polymer manufacturers
The results of this comparative study were critically reviewed for communication and distribution to
external stakeholders.

ACC Automotive Part LCA page 10 April 23, 2012
3 SCOPE OF THE STUDY
The following section describes the general scope of the project to achieve the stated goals. This
includes the identification of specific products assessed, the supporting product systems, the system
boundary, allocation procedures, and cut-off criteria. See Chapter 4 for a detailed description of data
collection, modeling assumptions, and background data.
3.1 SYSTEM DESCRIPTION
The life cycle stages for the system being considered are shown in Figure 1. This study assesses the
full life cycle – from cradle to grave – of the conventional and polymer part designs being considered.
The system boundaries are consistent between the two designs.
Figure 1: Life Cycle Flow Diagram for System of Study
Material production refers to the extraction and preparation of the materials used. Part production
refers to the manufacture of materials into vehicle parts. The use phase includes the impact potential
associated with all fuel savings (combustion and upstream production) caused by the lower weight of
the plastic part during the vehicle’s lifetime, as well as any parts or consumables expected to be
required for the upkeep, maintenance, or repair of the part during the vehicle’s lifetime. The products’
end-of-life includes a mix of landfilling and recycling.
3.2 FUNCTIONAL UNIT
A running board / assist step designed for the 2007 Chevrolet Trailblazer / GMC Envoy model lines
replaced a steel and plastic assembly with a one-piece injection molded long glass fiber / polypropylene
part. Both designs meet the GM specification GMW 15951 (Assist Step Loading and Dependability
Deflection Test). This specification requires that vertical deflection is no greater than 7.5 mm during
static load testing.

ACC Automotive Part LCA page 11 April 23, 2012
The service of the part is therefore to provide only allowable deflection for a certain load within a
certain design footprint over a certain lifetime. Accordingly, the functional unit for this part is set to be
“providing a stiffness satisfying specification GMW 15951 within an area of 1.761 m by 0.1275 m over a
vehicle lifetime of 150,000 miles.” The plastic assist step is slightly larger than the metal one (0.27 m2 or
+21 %). The plastic assist step size was not reduced for analysis in order to ensure that it fulfills the
deflection requirement.
A service life of 150,000 miles is selected as an estimate of vehicle design life, and is not intended
to represent the actual average lifetime of the vehicle. It expresses the authors’ belief that lightweight
measures should break-even within a reasonable mileage and is less than the typical lifetime mileage of
152,137 miles for passenger cars and 179,954 miles for light trucks.4
Maintenance is excluded as an assist step does not require general maintenance. A one-time
replacement of the metal step due to corrosion is included in scenario analysis.
3.3 STUDY BOUNDARIES
This study assesses the complete life cycle of the functional unit as shown in Figure 1 and described
in Section 3.2. This includes all of the relevant upstream production of materials and energies, part
production, use, and end-of-life disposition. A summary of what is included and excluded in this study is
shown in Table 1.
Table 1: System Boundaries Included Excluded
Upstream raw material production Upstream energy production Mechanical part production Transportation of all materials up to the
assembly point and finished product distribution to regional distribution sites
Use Service (repair and replacement) End-of-life disposition Transportation of raw materials, finished
product and parts, as required for service activities
Capital equipment and maintenance Overhead (heating, lighting) of
manufacturing facilities if separable Part assembly In-plant transportation Human labor
3.3.1 Technology Coverage
Design data for the part production at the time of the technology changeover were collected and
analyzed wherever possible. For all upstream parts and materials, average industry profiles from the
GaBi 4 databases were utilized.
4 U.S. Department of Transportation, National Highway Traffic Safety Administration, Vehicle Survivability and
Travel Mileage Schedules, January 2006.
ACC Automotive Part LCA page 12 April 23, 2012
3.3.2 Geographic Coverage
The geographic region considered is limited to the North American auto market, with focus on the
US. Accordingly, data were chosen to be representative for the US or North American markets whenever
possible. For datasets used including geographic coverage, see Section 4.1.3.
3.3.3 Time Coverage
Design data is based on production at the time of changeover from metal to plastic parts.
Additional data necessary to model material production and energy use were obtained from the GaBi
Databases 2006 and are representative of years 2002 to present. For datasets used including reference
years, see Section 4.1.3.
3.4 SELECTION OF IMPACT ASSESSMENT CATEGORIES
The following inventory flows and environmental categories considered to be of high relevance to
the goals of the project were investigated:
Non-renewable Primary Energy Demand
Global Warming Potential
Acidification Potential
Eutrophication Potential
Smog Potential
For detailed descriptions, see Appendix A: Life Cycle Impact Assessment Categories.
For the purposes of this project, it is expected that results will be primarily used in the USA, and so
the TRACI impact categorization methodology5 has been used for Eutrophication, Acidification, and
Smog. A recent update of the IPCC factors for climate change6 is not reflected in the TRACI
characterization factors, so CML factors7 (which were updated with IPCC data in November 2009) have
been used to evaluate Global Warming Potential.
In addition to the environmental impact categories noted above, the study includes an evaluation
of human toxicity and ecotoxicity using the USEtox characterization model. The precision of the current
USEtox characterization factors is within a factor of 100–1,000 for human health and 10–100 for
freshwater ecotoxicity.8 This is a substantial improvement over previously available toxicity
characterization models, but still higher than for the other impacts noted above.
5 Bare et al., TRACI: the Tool for the Reduction and Assessment of Chemical and Other Environmental Impacts JIE,
MIT Press, 2002. 6 Intergovernmental Panel on Climate Change (IPCC). Climate Change 2007: The Physical Science Basis.
Contribution of Working Group I to the Fourth Assessment. Report of the Intergovernmental Panel on Climate Change. 2007. 7 http://cml.leiden.edu/software/data-cmlia.html
8 Rosenbaum et al (2008): USEtox—the UNEP-SETAC toxicity model: recommended characterisation factors for
human toxicity and freshwater ecotoxicity in life cycle impact assessment, Int J Life Cycle Assess (2008) 13:532–546

ACC Automotive Part LCA page 13 April 23, 2012
Therefore, the USEtox characterization factors are used within this study to identify key
contributors within product life cycles which influence that product’s toxicity potential. The life cycle
results would indicate which materials show up as substances of high concern, but shall not be used to
make any comparative assertions.
3.5 DATA COLLECTION
Supply of primary data on the design of the parts, including the bill of materials and types of
processes employed for part production, were coordinated by ACC through contacts with the auto and
auto part manufacturers. No site-specific manufacturing inventory data (e.g., energy consumption and
emissions) were collected.
Data for energy consumption during the use phase were calculated, as described in Section 4.2.
In addition to primary process data, each model utilized GaBi background data (i.e., for upstream
raw materials and energies, part production, transportation, and end-of-life).
3.5.1 Fuels and Energy
Average fuels and energy inputs were obtained from the GaBi 4 Software database. See Section
4.1.3 for datasets used.
3.5.2 Raw and Process Materials
Inventory data for all upstream raw materials and mechanical components were obtained from the
GaBi 4 Software database. USLCI data for plastics9 and worldsteel data for steel were utilized when
available; otherwise PE data were used. See Section 4.1.3 for datasets used.
3.5.3 Co-product and By-product Allocation
No allocation was necessary to co- or by-products in the current scope of the study besides the
allocation inherent to the upstream datasets (e.g., allocation between refinery products).
3.5.4 End-of-Life Disposition
The products’ end-of-life includes a mix of landfilling and recycling. Recycling of manufacturing
scrap and at end-of-life was modeled using the “avoided burden” approach, giving credits for potential
material recovery. See Section 4.1.3 and Section 4.3 for more details. Alternatively, results using the
“cut-off” approach are provided in Section 6.3.
3.5.5 Cut-off Criteria
The cut-off criteria for the study include or exclude materials, energy and emissions data as follows:
Mass – If a flow is less than 2% of the cumulative mass of the intermediate input flows of the model it may be excluded, providing its environmental relevance is not a concern.
9 Data in the USLCI database were critically reviewed according to the USLCI data review protocol; see
http://www.nrel.gov/lci/database/. Results using plastics data from USLCI were compared with results using other plastics data sources.

ACC Automotive Part LCA page 14 April 23, 2012
Energy – If a flow is less than 2% of the cumulative energy of the intermediate input flows of the model it may be excluded, providing its environmental relevance is not a concern.
Environmental relevance – If a flow meets the above criteria for exclusion, yet is thought to potentially have a significant environmental impact, it is included. Elementary output flows (emissions) which have an environmental impact that is greater than 2% of the whole impact of an impact category that has been considered in the assessment must be covered. This judgment was done based on experience and documented as necessary.
3.5.6 Data Quality
Under the guidance of PE INTERNATIONAL, ACC technical experts and personnel collected the data
for the processes associated with production, service, use, and logistics. PE INTERNATIONAL gathered
the remaining data representative of the full product system utilizing the GaBi database in its current
version. This modeling approach ensures that all materials are modeled according to the same boundary
conditions, the analysis does not compare different background systems, and that the results represent
current technology and up to date background data.
Chapter 4 describes the primary and background data utilized in the life cycle model as well as any
assumptions.
Auto part production was modeled based on:
Primary data for the material composition (measured), scrap generation (calculated), and which type of manufacturing processes are used (e.g., stamping, deep drawing).
GaBi upstream data
Use phase was modeled based on:
Calculated reduction of fuel consumption and CO2 and SO2 emissions from lightweight design
GaBi upstream data
End-of-life disposition was modeled based on:
End-of-life scenarios (e.g., percent to landfill)
GaBi upstream data
Because the model is based on direct measurement of the product design, the data quality is
expected to be high.
3.5.7 Exceptions
There were no exceptions to the aforementioned data collection scope.
3.6 SOFTWARE AND DATABASE
The LCA model was created using the GaBi 4 Software system for life cycle engineering, developed
by PE INTERNATIONAL AG. The GaBi database provides the life cycle inventory data for several of the
raw and process materials obtained from the background system.

ACC Automotive Part LCA page 15 April 23, 2012
3.7 INTERPRETATION
The results of the LCI/LCIA are interpreted according to the Goal and Scope. The interpretation
addresses the following topics:
Identification of significant findings, such as the main materials contributing to the overall results, the contribution of the main energy carriers used in the process and the potential contribution of emissions for main impact categories in the context of the whole life cycle.
Evaluation of completeness, sensitivity and consistency, to justify the inclusion or exclusion of data from the system boundaries as well as the cut-off criteria and data quality checks.
Conclusions, limitations and recommendations, should state the appropriateness of the definitions of the system functions, the functional unit and system boundary.
3.8 CRITICAL REVIEW
Because the study is comparative and is intended to support external communications, a critical
review was conducted. The critical review panel consisted of the following members:
Dr. Roland Geyer, Associate Professor, Bren School of Environmental Science & Management, University of California, Santa Barbara (Chair)
Dr. Allan Murray, President, Ecoplexus Inc., and CTO, Allied Composite Technologies LLC
Dr. John L. Sullivan, Sustainable Development Strategies, LLC
The critical review process was completed in three stages:
Stage 1: Review of the Study Purpose, Boundaries, and Data Categories
o Ensure purpose and goal of study is clearly defined
o Ensure that all necessary data categories (inventory and impact) are covered to meet
goal
o Understand how results will be used
o Ensure that the study meets quality requirements
Stage 2: Mid-project review at point of LCI completion
o Ensure recommendations of Stage 1 were addressed
o Verify adequacy of data collection and model
o Ensure that data quality meets quality requirements
Stage 3: Review of the Draft Final Report
o Ensure feedback of Stage 2 was addressed
o Confirm that the observations and conclusions from the study are consistent with the
stated purpose
o Ensure overall study quality and how the study meets the data quality specifications
that are relevant to the stated purpose

ACC Automotive Part LCA page 16 April 23, 2012
After incorporation of the Review Panel’s comments into the final report, the Chair of the panel
issued a Critical Review Report. A copy can be found in Appendix B: Critical Review Report.
3.9 QUALITY ASSURANCE
In addition to the full ISO-compliant critical review conducted over the course of the study, an
internal quality assurance review was performed by PE INTERNATIONAL in-house experts that have not
conducted the analytical work contained within this study.
3.10 DELIVERABLES
This project results in an ISO 14040/14044 compliant report describing the potential life cycle
environmental impacts associated with a case study in which polymer parts replaced metal parts with
the same function.
This report was critically reviewed, and the final report integrates feedback from the reviewers as
well as reviewer comments. This critically reviewed report is appropriate for both internal and external
communication.

ACC Automotive Part LCA page 17 April 23, 2012
4 LIFE CYCLE INVENTORY
This chapter describes the LCI datasets and gate-to-gate processes used to model each life cycle
step.
4.1 CRADLE-TO-GATE PRODUCTION
Sections 4.1.1 to 4.1.2 provide the material composition for each product and the inputs required
(includes scrap generation) as provided by ACC through its contacts in the auto industry. The material
composition was measured and the scrap generation was calculated. Section 4.1.3 describes the
modeling of part production including the background material and energy datasets used and the
manufacturing of materials into parts.
4.1.1 Chevrolet Trailblazer / GMC Envoy Metal Assist Step Material Composition (Baseline)
Table 2 provides the material composition of the 12.907 kg metal running board / assist step. The
difference between the input materials and the finished part is production scrap. Steel scrap is sent to a
recycler and TPO scrap is used for regrind within the plant.
Table 2: Metal Assist Step Material Composition
Material Input [kg] Finished Part [kg]
Finished Part [%]
Steel e-coated frame 7.826 5.528 43%
Steel e-coated brackets (3) 11.568 5.935 46%
Thermoplastic Olefin (TPO) top cover 1.665 1.180 9%
Steel fasteners 0.264 0.264 2%
Total 21.323 12.907 100%
4.1.2 Chevrolet Trailblazer / GMC Envoy Plastic Assist Step Material Composition
Table 3 provides the material composition of the 6.301 kg plastic running board / assist step. The
difference between the input materials and the finished part is the production scrap, which is sent to a
recycler.
Table 3: Plastic Assist Step Material Composition
Material Input [kg] Finished Part [kg]
Finished Part [%]
Step 7.106 6.253 99% Polypropylene 4.264 3.752 60% Glass fiber 2.843 2.501 40%
Steel fasteners 0.048 0.048 1%
Total 7.154 6.301 100%
4.1.3 Production
Production of steel components (excluding fasteners) consists of cradle-to-gate production of the
hot rolled steel coil, part production, and e-coat, as shown in Figure 2.

ACC Automotive Part LCA page 18 April 23, 2012
The 2010 Worldsteel Association (worldsteel) LCI dataset for ungalvanized, hot rolled coil was used
to represent the hot rolled steel sheet used in the manufacturing of the steel components. This dataset
is the most recent global average production of hot rolled steel coil. worldsteel has taken an avoided
burden approach and allocated a portion of the environmental impacts associated with primary steel
production to steel scrap. In accordance with worldsteel’s chosen methodology, the model applies the
worldsteel “global value of scrap” as an upstream burden for the use of steel scrap, and likewise as an
environmental credit for the production of available scrap for recycling (inverted “global value of
scrap”). The value of scrap is calculated as the difference between producing a given amount of material
by (hypothetical) 100 % primary production (blast oxygen furnace route) and the same amount of
material through secondary production means.
An alternative to the avoided burden approach (aka end-of-life recycling) that is also ISO-compliant
and frequently used in LCA studies is the cut-off approach (aka recycled content).10 These two
approaches represent two very different scenarios for end-of-life modeling since the avoided burden
approach assumes that all the scrap generated (minus losses from collection and recycling) will actually
displace primary steel production at some point in time, while the cut-off approach disregards any
assumptions about possible future benefits and simply incentivizes the use of recycled content today.
Section 6.3 presents the results using the cut-off approach, which has the scrap input undergo a
recycling process (“DE: car shredder PE” dataset), but does not attribute any environmental burden
from the primary production of the scrap. Likewise, there is no burden and no credit applied for
recycling of steel scrap.
Steel part production is modeled using the PE dataset for steel sheet deep drawing, which is a
multi-stage process, and requires inputs of power, thermal energy, and lubricants. The deep drawing
dataset is adjusted to account for the reported scrap amounts in Section 4.1.1 above. E-coating (i.e.,
painting) is modeled using a PE dataset and requires inputs of dip coat, power, thermal energy, and
deionized water, as well as wastewater treatment. The energy and other inputs required are calculated
(scaled) according to the input material flows in Table 2. The datasets used for steel part production are
shown in Table 4.
10
For a discussion of these two approaches and their implications see Frischknecht, R. (2010): LCI modelling approaches applied on recycling of materials in view of environmental sustainability, risk perception and eco-efficiency, Int J Life Cycle Assess (2010) 15:666-671.

ACC Automotive Part LCA page 19 April 23, 2012
Figure 2: Cradle-to-gate Production of Steel Part
Table 4: Datasets Used for Production of Steel Parts
Category Dataset Nation/ Region Source
Reference Year
Materials
Car shredder (for cut-off approach) DE PE 2005
Dip coat mix DE PE 2005
Lubricants at refinery US PE 2003
Steel hot rolled coil GLO worldsteel 2007
Value of scrap (for avoided burden approach) GLO worldsteel 2007
Water deionized US PE 2005
Part production Application dip coat (EC; automobile) DE PE 2005
Steel sheet deep drawing DE PE 2005
Energy Power grid mix US PE 2002
Thermal energy from natural gas US PE 2002
Disposal Municipal sewage plant US PE 2006
Production of plastic parts consists of production of the materials, compounding, and part
production, as shown for example in Figure 3. The datasets used for plastic part production are shown in
Table 5.
As noted in Section 3.5.2, ACC plastics data as available in the NREL USLCI database were used to
represent the plastics materials used in manufacturing. The ACC dataset used in this study was for

ACC Automotive Part LCA page 20 April 23, 2012
polypropylene resin. This dataset is compared to the PE dataset for US polypropylene granulate in
Section 6.5.
Part production is modeled using the PE dataset for injection molding, and adjusted to account for
the reported scrap amounts in Sections 4.1.1 to 4.1.2 above. Injection molding requires power input,
and landfilling of waste material. Compounding requires power and water inputs, and wastewater
treatment. The energy and other inputs required are calculated (scaled) according to the input material
flows in Table 2 and Table 3.
For the TPO top cover component of the metal step only, processing scrap is reground (“DE:
granulator PE” dataset) and used as an input to compounding, displacing some of the virgin
polypropylene input.
For the plastic step, the scrap is sent to a recycler and modeled using the avoided burden approach,
by applying a recycling process (“US: Plastic granulate secondary” dataset) and a credit for plastic scrap
(inverse of the appropriate plastic dataset).
No scrap input is required as the parts are comprised of primary plastic material. Additionally,
Section 6.3 presents the results using the cut-off approach, which does not apply credits for scrap.
Figure 3: Cradle-to-gate Production of Plastic Part

ACC Automotive Part LCA page 21 April 23, 2012
Table 5: Datasets Used for Production of Plastic Parts
Category Dataset Nation/ Region Source
Reference Year
Materials
Glass fibres US PE 2005
Plastic granulate secondary (nonspecific) (for avoided burden approach) US PE 2005
Polypropylene (PP) virgin resin RNA USLCI 2011
Part production
Compounding (plastics) GLO PE 2005 Granulator (for TPO support of metal assist step) DE PE 2005
Plastic injection moulding part DE PE 2005
Energy Power grid mix US PE 2002
Disposal Landfill for inert matter (Construction waste) DE PE 2005
Municipal sewage plant US PE 2006
Additionally, the dataset used for the fasteners is shown in Table 6.
Table 6: Dataset Used for Steel Fasteners
Dataset Nation/ Region Source
Reference Year
Fixing material screws galvanized DE PE 2005
Although no transportation data were collected, transportation of raw materials and transportation
of final product were modeled assuming a distance of 300 miles by truck using the GaBi 4 database.
4.2 CALCULATION OF USE PHASE FUEL SAVINGS
For the use phase, fuel savings due to lightweight design over the assumed vehicle lifetime mileage
of 150,000 miles is calculated based on the EPA city and highway standard driving cycles and the
differential efficiency of gasoline engines, using the methodology described in Koffler & Rohde-
Brandenburger (2010).11 The method is based on the amount of work necessary to move a certain
weight through a certain driving cycle, and the differential efficiency of the internal combustion engine.
The differential efficiency expresses the increase in an engine’s fuel consumption for providing an
additional power output while it is running. It can be visualized using the so-called Willans lines, which
plot the fuel consumption in [liters/hour] over the respective power output [kW] for different rpm
levels.
As can be seen in Figure 4, the differential efficiencies (i.e., the slopes of the Willans lines) are
virtually the same for low power outputs and low rpms (< 4000 rpm), which are typical for most fuel
economy driving cycles. It has been shown that the differential efficiency of engines with the same
11
Koffler C, Rohde-Brandenburger K (2010): On the calculation of fuel savings through lightweight design in automotive life cycle assessments, Int J Life Cycle Assess (2010) 15:128-135

ACC Automotive Part LCA page 22 April 23, 2012
working process is, in contrast to their overall efficiency, very similar.12 For naturally aspirated gasoline
engines, the ascertained average is 0.264 (l/h)/kW or 0.073 l/MJ. By combining these values with the
respective mass-induced energy demand for moving a certain weight through a certain driving cycle, the
mass-induced fuel consumption can be calculated.
Figure 4: Willans lines of a 1.4 l turbo-charged gasoline engine (90 kW) for low output and low rpm13
In order to do so, first the mass induced energy demand needs to be calculated using the following
formula:
Wsum = m * ((1 - d) * g * fR * CWR + CWa)
with
Wsum: energy demand [MJ]
m: mass [kg]
d: share of deceleration phases in driving cycle [%]
g: gravitational constant [m/s2]
12
Rohde-Brandenburger K (1996): Verfahren zur einfachen und sicheren Abschätzung von Kraftstoffverbrauchs-potentialen, Einfluss von Gesamtfahrzeugparametern auf Fahrzeugverhalten/Fahrleistung und Kraftstoffverbrauch. Haus der Technik, Essen 13
Koffler C, Rohde-Brandenburger K (2010): On the calculation of fuel savings through lightweight design in automotive life cycle assessments, Int J Life Cycle Assess (2010) 15:128-135

ACC Automotive Part LCA page 23 April 23, 2012
fR: rolling resistance coefficient (dimensionless)
CWR: constant for rolling resistance [m]; specific to driving cycle
CWa: constant for acceleration resistance [m2/s2]; specific to driving cycle
The mass induced energy demand for the US combined fuel economy driving cycle14 for 100 km
and 100 kg therefore is:
Wsum(100 kg, 100 km) = (100 km / 17.2 km) * m * ((1 - d) * g * fR * CWR + CWa)
= (100 km / 17.2 km) * 100 kg * (0.83 * 9.81 m/s2 * 0.01 * 17,198 m + 2,221 m
2/s
2)
= 2.1 MJ
with 17.2 kilometers being the combined distance of the EPA city and highway driving cycle (55% *
11.04 miles + 45% * 10.26 miles) and 17% being the combined deceleration phases of both (55% * 25% +
45% * 8%).15
Assuming a conservative 5% losses in the automatic gearbox,16 the mass-induced fuel consumption
for naturally aspirated gasoline engines for the US EPA combined driving cycle for 100 kg is:
V100 kg = 2.1 MJ * 1.05 * 0.073 l/MJ = 0.161 l/(100 km*100 kg) = 0.031 gal/(100 mi*100 lb)
The above calculations assume that no constructive changes are made to the vehicle itself. They
correspond to the amount of mass-induced fuel consumption in a given driving cycle, and vice versa to
the reduction in fuel consumption when that weight is removed from the vehicle, e.g. empty trunk vs.
full trunk. The latter fuel reduction value (i.e., the fuel saving in comparison to a given reference) is
significantly increased when one considers unchanged vehicle performance as an objective to preserve
functional equivalence on the system level before and after the lightweighting measure.
In theory, each mass reduction improves the vehicle’s acceleration and dynamic performance. An
adaptation of the drive train (i.e., the reduction of engine capacity or the elongation of the gear ratio)
may therefore further increase the fuel economy while preserving the vehicle dynamics. A multitude of
simulations of drive train adaptations rendered fuel reduction values that are a factor 1.9 to 3.0 higher
than the values without additional drive train adaptations (avg: 2.37).17
Assuming the ratio between no drive train adaptation and adapted drive train is about the same for
the US combined driving cycle as for the New European Driving Cycle, the potential decrease in fuel
consumption with adaptation for naturally aspirated gasoline engines amounts to:
14
55% city /45% highway 15
Assumption: decelerations are strong enough to allow engine to enter throttle cutoff mode. 16
Schlegel et al (2009): Detailed Loss Modelling of Vehicle Gearboxes, Proceedings 7th Modelica Conference, Como, Italy, Sep. 20-22, 2009. Available at http://www.ep.liu.se/ecp/043/048/ecp09430059.pdf 17
Koffler C, Rohde-Brandenburger K (2010): On the calculation of fuel savings through lightweight design in automotive life cycle assessments, Int J Life Cycle Assess (2010) 15:128-135

ACC Automotive Part LCA page 24 April 23, 2012
V*100 kg = 0.031*2.37 = 0.07 gal/(100 mi*100 lb)
Carbon dioxide emissions from fuel combustion are then calculated using the average emission
factor provided by the US EPA of 19.4 pounds per gallon of gasoline.18 Sulfur dioxide emissions are
calculated based on the fuel’s sulfur content (30 ppm).19
Due to the fact that there is not sufficient evidence that
a) the sum of all lightweight design measures in the car (which are unknown) would actually
allow for a drivetrain adaptation in real life, and
b) that the involved car manufacturers actually prefer fuel economy over performance within
the design process,
the adapted fuel reduction value is only considered in a what-if scenario in this study. Chapter 5
therefore presents the results with no adaptation to the drive train, while Section 6.1 presents the
results for an adapted drive train. In addition, the following key assumptions are tested in a subsequent
sensitivity analysis in Section 6.2: share of deceleration phases (17%), rolling resistance (0.01), automatic
gearbox loss (5%), and the ratio of savings with an adapted drive train to no adaptation (2.37).
4.3 END-OF-LIFE TREATMENT
It is assumed that 98% of the steel material is recovered for recycling at end-of-life. The recycled
steel is awarded a recycling credit defined by the worldsteel “global value of scrap” dataset. In addition,
Section 6.3 provides the results using the cut-off approach, which does not apply a steel recycling credit
or any primary upstream burden for scrap inputs in manufacturing.
It is assumed that all plastic material is landfilled, as represented by the PE dataset “RER: Landfill for
inert matter (Construction waste).”
18
U.S. Environmental Protection Agency (2005): Average Carbon Dioxide Emissions Resulting from Gasoline and Diesel Fuel, available at: http://www.epa.gov/oms/climate/420f05001.htm#calculating 19
U.S. Environmental Protection Agency (2009): Gasoline Sulfur Standards, available at: http://www.epa.gov/oms/standards/fuels/gas-sulfur.htm U.S. Environmental Protection Agency (2009): Highway, Nonroad, Locomotive, and Marine Diesel Fuel Sulfur Standards, available at: http://www.epa.gov/oms/standards/fuels/diesel-sulfur.htm

ACC Automotive Part LCA page 25 April 23, 2012
5 RESULTS
This chapter presents the potential environmental impacts for a vehicle lifetime of 150,000 miles.
See Chapter 6 for scenario and sensitivity analyses.
The US EPA’s TRACI impact categorization methodology was used for Eutrophication Potential,
Acidification Potential, and Smog Potential. A recent update of the IPCC factors for climate change is not
reflected in the TRACI characterization factors, so CML factors (which were updated with IPCC data in
November 2009) were used to evaluate Global Warming Potential. The recently released USEtox
methodology was used to calculate human toxicity and ecotoxicity potential. Primary energy demand
from non-renewable resources was also included. Each of these impact categories is further described in
Appendix A: Life Cycle Impact Assessment Categories.
The potential environmental impacts for each product are broken down into 3 life cycle stages:
Manufacturing:
o Cradle-to-gate materials and part production including transport
o Credit for scrap generation
Use:
o Cradle-to-gate fuel production (pre-combustion)
o Fuel combustion emissions
End-of-life:
o Landfill
o Credit for scrap generation
The difference between the impact of the metal assist step (baseline product) and the plastic assist
step is calculated as the plastic assist step results minus the metal assist step results. The use phase
emissions are only calculated as a difference from the baseline. Thus the use phase impact is zero for
the baseline product and carries a negative sign for the plastic product; the plastic product weighs less
than the baseline product, resulting in less fuel consumption and combustion emissions.
The values for scrap generation carry a negative sign because the model provides a “credit” for the
avoided production of primary steel and plastic (avoided burden approach). These are only potential
credits, as there is no certainty that the material will be recycled at the end of its life. Additionally,
Section 6.3 provides the results using the cut-off approach.
Appendix C: Detailed Manufacturing Results shows the manufacturing results not including
transport by component (credits included) and by material or process (credits shown separately).
Normalization is an optional step within LCA used to help interpret the relative significance of the
multiple environmental indicators. The latest TRACI normalization factors20 are applied in order to
convert the various units of each individual environmental indicator into a common, dimensionless
20
Bare et al: Development of the Method and U.S. Normalization Database for Life Cycle Impact Assessment and Sustainability Metrics, Environmental Science & Technology (2006) 40:5108-5115

ACC Automotive Part LCA page 26 April 23, 2012
scale. The normalization factors are based upon the 1999 annual total US emissions contributing to each
of the TRACI environmental indicators. The 1999 total non-renewable energy consumption available
from the Energy Information Administration21 is applied to normalize non-renewable primary energy
demand. Table 7 provides the normalization factors.
Table 7: TRACI Normalization Factors
Impact Category Normalization Factor
Primary Energy Demand (net calorific value) [MJ] 9.50E+13
Global Warming Potential (100 years) [kg CO2-Equiv.] 6.85E+12
Acidification Potential [mol H+ Equiv.] 2.08E+12
Eutrophication Potential [kg N-Equiv.] 5.02E+09
Smog Potential [kg NOx-Equiv.] 3.38E+10
Figure 5 shows that when comparing to the baseline metal assist step for the selected
environmental indicators, smog, eutrophication, and acidification potential show only marginal
differences, and acidification is the only impact category that shows a net impact in burden. Therefore
the following sections focus on primary energy demand, global warming potential, and acidification
potential. The results for smog and eutrophication potential are provided in Appendix D: Results for
Eutrophication and Smog Potential.
Figure 5: Assist Step Normalized TRACI Environmental Indicators – Alternative Minus Baseline
Table 8 through Table 10 show the life cycle performance of the metal running board / assist step
(baseline product) and the plastic running board / assist step (alternative product) and the difference
between them (plastic results minus metal results) for non-renewable primary energy demand, global
warming potential, and acidification potential. Figure 6 through Figure 8 show the difference from the
baseline throughout the life cycle of the vehicle and whether there is a “break-even” mileage where the
fuel savings effectively offset any additional burden from manufacturing.
21
U.S. Energy Information Administration (2011): Monthly Energy Review. Available at: http://www.eia.gov/emeu/mer/pdf/pages/sec1_3.pdf
-1.0E-11 -8.0E-12 -6.0E-12 -4.0E-12 -2.0E-12 0.0E+0 2.0E-12
Primary EnergyDemand
Global WarmingPotential
AcidificationPotential
EutrophicationPotential
SmogPotential

ACC Automotive Part LCA page 27 April 23, 2012
Table 8: Assist Step Primary Energy Demand
Primary Energy Demand (net calorific value) [MJ]
Absolute Results
Alternative Minus
Baseline
Metal Assist Step
Plastic Assist Step
Plastic Assist Step
Manufacturing 542.72 671.14 128.42
Materials/Part Production 655.58 707.26 51.68
Scrap Credit -112.85 -36.11 76.74
Use n/a n/a -1001.41
Fuel Production (Pre-combustion)22
n/a n/a -1001.41
Fuel Combustion Emissions n/a n/a 0
EoL -163.56 0.12 163.69
Landfill 0.22 1.00 0.78
Scrap Credit -163.79 -0.88 162.91
Total n/a n/a -709.30
Figure 6: Assist Step Primary Energy Demand – Alternative Minus Baseline
22
The “alternative minus baseline” energy content of the gasoline used by the vehicle is 83% of the primary energy demand. The remainder of the primary energy demand is from the processing required to produce the fuel.
-1000-800-600-400-200
0200400600800
1000
0 1 2 3 4 5 6 7 8 9 10 11 12 13 14 15
[MJ]
(n
et
calo
rifi
c va
lue
)
mileage [10,000 miles]
Plastic Assist Step EoL
Mfg
.

ACC Automotive Part LCA page 28 April 23, 2012
Table 9: Assist Step Global Warming Potential
Global Warming Potential (GWP 100 years) [kg CO2-Equiv.]
Absolute Results
Alternative Minus
Baseline
Metal Assist Step
Plastic Assist Step
Plastic Assist Step
Manufacturing 40.78 36.52 -4.26
Materials/Part Production 52.77 37.92 -14.85
Scrap Credit -11.99 -1.40 10.59
Use n/a n/a -74.01
Fuel Production (Pre-combustion) n/a n/a -14.29
Fuel Combustion Emissions n/a n/a -59.73
EoL -17.37 0.03 17.41
Landfill 0.03 0.13 0.10
Scrap Credit -17.40 -0.09 17.31
Total n/a n/a -60.86
Figure 7: Assist Step Global Warming Potential – Alternative Minus Baseline
Table 10: Assist Step Acidification Potential
Acidification Air [mol H+ Equiv.]
Absolute Results
Alternative Minus
Baseline
Metal Assist Step
Plastic Assist Step
Plastic Assist Step
Manufacturing 6.18 9.10 2.93
Materials/Part Production 7.36 9.43 2.07
Scrap Credit -1.19 -0.32 0.86
Use n/a n/a -3.18
Fuel Production (Pre-combustion) n/a n/a -3.13
Fuel Combustion Emissions n/a n/a -0.06
EoL -1.72 0.02 1.73
Landfill 0.01 0.03 0.02
Scrap Credit -1.72 -0.01 1.71
Total n/a n/a 1.48
-90
-70
-50
-30
-10
10
30
50
70
90
0 1 2 3 4 5 6 7 8 9 10 11 12 13 14 15
[kg
CO
2-Eq
uiv
.]
mileage [10,000 miles]
Plastic Assist Step EoL
Mfg
.
ACC Automotive Part LCA page 29 April 23, 2012
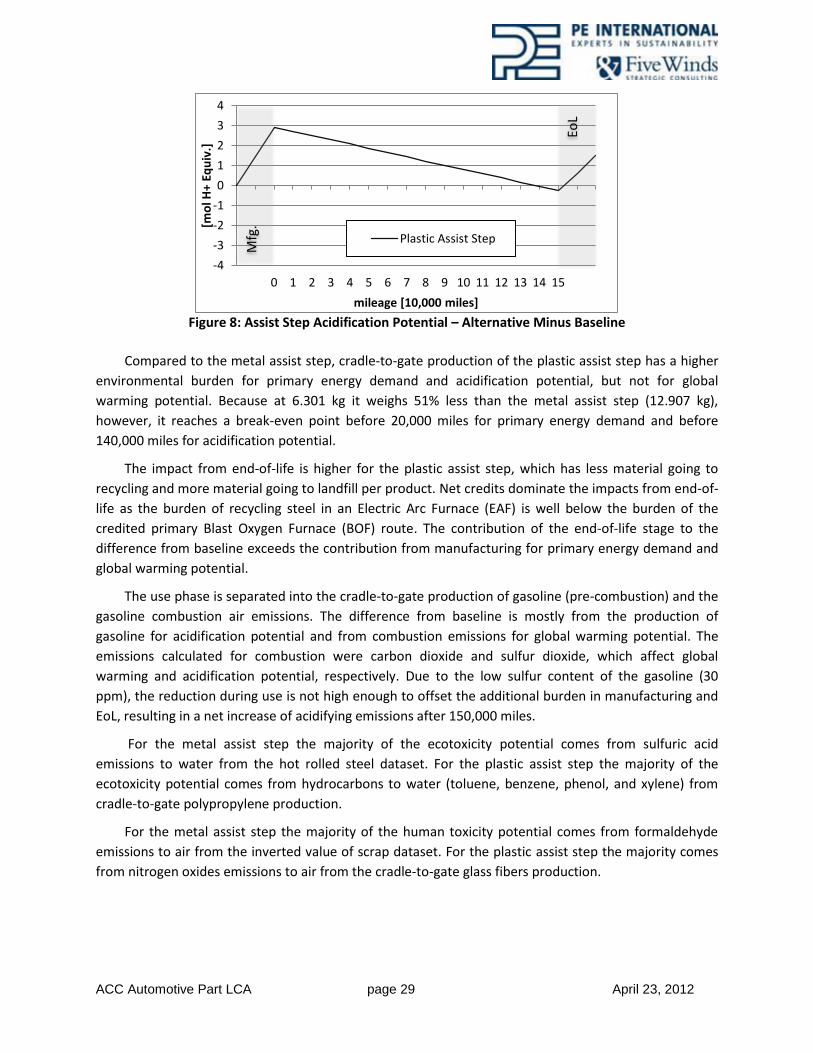
Figure 8: Assist Step Acidification Potential – Alternative Minus Baseline
Compared to the metal assist step, cradle-to-gate production of the plastic assist step has a higher
environmental burden for primary energy demand and acidification potential, but not for global
warming potential. Because at 6.301 kg it weighs 51% less than the metal assist step (12.907 kg),
however, it reaches a break-even point before 20,000 miles for primary energy demand and before
140,000 miles for acidification potential.
The impact from end-of-life is higher for the plastic assist step, which has less material going to
recycling and more material going to landfill per product. Net credits dominate the impacts from end-of-
life as the burden of recycling steel in an Electric Arc Furnace (EAF) is well below the burden of the
credited primary Blast Oxygen Furnace (BOF) route. The contribution of the end-of-life stage to the
difference from baseline exceeds the contribution from manufacturing for primary energy demand and
global warming potential.
The use phase is separated into the cradle-to-gate production of gasoline (pre-combustion) and the
gasoline combustion air emissions. The difference from baseline is mostly from the production of
gasoline for acidification potential and from combustion emissions for global warming potential. The
emissions calculated for combustion were carbon dioxide and sulfur dioxide, which affect global
warming and acidification potential, respectively. Due to the low sulfur content of the gasoline (30
ppm), the reduction during use is not high enough to offset the additional burden in manufacturing and
EoL, resulting in a net increase of acidifying emissions after 150,000 miles.
For the metal assist step the majority of the ecotoxicity potential comes from sulfuric acid
emissions to water from the hot rolled steel dataset. For the plastic assist step the majority of the
ecotoxicity potential comes from hydrocarbons to water (toluene, benzene, phenol, and xylene) from
cradle-to-gate polypropylene production.
For the metal assist step the majority of the human toxicity potential comes from formaldehyde
emissions to air from the inverted value of scrap dataset. For the plastic assist step the majority comes
from nitrogen oxides emissions to air from the cradle-to-gate glass fibers production.
-4
-3
-2
-1
0
1
2
3
4
0 1 2 3 4 5 6 7 8 9 10 11 12 13 14 15
[mo
l H+
Equ
iv.]
mileage [10,000 miles]
Plastic Assist Step
EoL
Mfg
.

ACC Automotive Part LCA page 30 April 23, 2012
6 SCENARIO AND SENSITIVITY ANALYSIS
6.1 POWER TRAIN ADAPTATION SCENARIO This section presents the life cycle performance of the plastic assist step compared to the baseline
product (plastic assist step results minus metal assist step results) if adjustments are made to the engine
or gearbox due to the reduction in vehicle weight. It assumes that reduction of fuel consumption with
drive train adaptation is 2.37 times higher for gasoline engines than without adaptation, causing a
greater difference in impact from the baseline product (see Section 4.2).
Table 11 reports the total life cycle potential impact difference from baseline (metal running
board / assist step) with drive train adaptation for the plastic running board / assist step. Figure 9
through Figure 11 show the difference from baseline without adaptation and with adaptation. As
expected, the lighter-than-baseline plastic assist step results in better environmental performance when
drive train adaptation is taken into account. In contrast to the no adaptation results, the plastic assist
step performs better than the metal assist step for acidification potential when adaptation is taken into
account.
Table 11: Assist Step with Adaptation – Alternative Minus Baseline
Assist Step with Adaptation – Alternative Minus Baseline
Primary Energy Demand (net calorific value) [MJ] -2081.23
Global Warming Potential (100 years) [kg CO2-Equiv.] -162.26
Acidification Potential [mol H+ Equiv.] -2.88
Figure 9: Assist Step Adaptation Primary Energy
Demand – Alternative Minus Baseline Figure 10: Assist Step Adaptation Global Warming
Potential – Alternative Minus Baseline
-2500
-1500
-500
500
1500
2500
0 3 6 9
12
15
[MJ]
(n
et
calo
rifi
c va
lue
)
mileage [10,000 miles]
No Adaptation
With Adaptation EoL
Mfg
.
-200
-150
-100
-50
0
50
100
150
2000 3 6 9
12
15
[kg
CO
2-E
qu
iv.]
mileage [10,000 miles]
No AdaptationWith Adaptation Eo
L
Mfg
.

ACC Automotive Part LCA page 31 April 23, 2012
Figure 11: Assist Step Adaptation Acidification
Potential – Alternative Minus Baseline
6.2 CALCULATION OF USE PHASE FUEL SAVINGS UNCERTAINTY The calculation of the potential use phase reductions in fuel consumption is based on a variety of
uncertain input parameters, as described in Section 4.2. Monte Carlo analysis is a technique that
propagates known parameter uncertainties through a calculation to give an uncertainty distribution of
the output variables. It is based on random sampling from defined distributions around each uncertain
input parameter. These distributions can either be determined based on empirical data or estimated
based on expert judgment. Consequently, Monte Carlo analysis is an ideal method for quantifying the
combined effect of parameter uncertainty in LCA studies, and is widely recognized and used in the LCA
community.23,24,25
The least sophisticated form of a Monte Carlo simulation is the definition of upper and lower
bounds via literature research or expert judgment for each parameter and the assumption of a uniform
distribution between these boundaries. This allows for the approximation of the combined effect of
uncertainties around parameters that have the potential to either add up or cancel each other out (i.e.,
they display different forms of proportional or inverse proportional relationships with the end result).
This type of Monte Carlo simulation can therefore be seen as a kind of parameter variation, but
with random variation of multiple parameters instead of a step-wise variation of a single parameter. It
renders more information than simple best case / worst case calculations as it provides an indication of
where between these two extremes the results are to be expected.26
23
Huijbregts MAJ, Gilijamse W, Ragas AMJ, Reijnders L (2003): Evaluating Uncertainty in Environmental Life-Cycle Assessment; Environmental Science and Technology 37, pp 2600 – 2608. 24
Peters GP (2007): Efficient Algorithms for Life Cycle Assessment, Input-Output Analysis, and Monte-Carlo Analysis; International Journal of Life Cycle Assessment 12 (6), pp 373 - 380 25
Lloyd SM, Ries R (2007): Characterizing, Propagating, and Analyzing Uncertainty in Life-Cycle Assessment; Journal of Industrial Ecology, Vol. 11, No. 1, pp 161 - 179 26
In layman’s terms, it means shooting at a large enough target with a shotgun, and then establishing the marksman’s accuracy based on the average distance to the bull’s eye across all bullet holes along with its standard deviation, instead of just calculating the minimum and maximum distance to be expected.
-8
-6
-4
-2
0
2
4
6
8
0 3 6 9
12
15
[mo
l H+
Equ
iv.]
mileage [10,000 miles]
No AdaptationWith Adaptation Eo
L
Mfg
.

ACC Automotive Part LCA page 32 April 23, 2012
Table 12 shows the key parameters of the fuel savings calculation that were varied in the Monte
Carlo simulations to assess the combined effect of their respective uncertainties on the final results:
The assumption that the deceleration phases in the EPA combined cycle are strong enough to allow the engine to enter throttle cutoff mode (zero fuel consumption), which poses a conservative assumption in favor of the metal parts, was varied to be valid for values between 0% of the driving cycle and the base case value.
The rolling resistance coefficient of 0.01 from Koffler & Rohde-Brandenburger (2010) was varied from 0.007 to 0.014 according to the typical range of available tires.27
The 5% base case for automatic transmission losses is also a conservative assumption in favor of the metal parts since it represents the lower end of the range of gearbox losses for automatic transmissions.28
The upper boundary of 10% was therefore also included in the Monte Carlo simulation.
The uncertainty intervals around the fuel savings ratios (i.e., the ratio of FRV with adaptation to FRV without adaptation) were calculated using the maximum deviation between the average FRV values reported in Koffler & Rohde-Brandenburger (2010) and the likewise reported minimum and maximum FRVs from simulations. The largest ratio found was 29%; the interval used in the Monte Carlo simulation was therefore set to +/- 30% around the base scenario setting.
Table 12: Intervals in Use Phase Monte Carlo Simulation (10,000 runs, uniform distribution) Parameter Lower
Limit Base
Scenario Upper Limit
Deceleration in city driving cycle (no fuel consumption) [%] 0b 25 25
w
Deceleration in highway driving cycle (no fuel consumption) [%] 0b
8 8w
fR, rolling resistance coefficient 0.007w
0.01 0.014b
Automatic gearbox losses [%] 5w
5 10b
Ratio of fuel savings with adaptation to no adaptation (gasoline) 1.66w
2.37 3.08b
w: worst-case specification;
b: best-case specification
Since there are no data indicating that any value from the above intervals is more likely than any
other value from the same interval, a uniform distribution is assumed for each of them. The assessment
of the combined uncertainties is nevertheless indicated as (a) some of the parameters have an inverse
proportional relationship with the results, meaning that the effect of an increase of one parameter may
be cancelled out by an increase of another parameter, and (b) not all base scenario parameter settings
are situated in the center of the ascertained uncertainty intervals.
By propagating these uncertainties simultaneously a multitude of times using random sampling
(here: 10,000 runs), the Monte Carlo simulation provides a better estimate of the uncertainty of the fuel
27
Transportation Research Board (2006): Tires and Passenger Vehicle Fuel Economy; Special Report 286, Washington DC. Available at http://onlinepubs.trb.org/onlinepubs/sr/sr286.pdf 28
Schlegel C, Hoesl A, Diel S (2009): Detailed Loss Modeling of Vehicle Gearboxes, Proceedings of the 7th Modelica Conference, Como, Italy, Sep. 20-22, 2009. Available at http://www.ep.liu.se/ecp/043/048/ecp09430059.pdf

ACC Automotive Part LCA page 33 April 23, 2012
reduction potential.29 The according standard deviations will also give a better indication of the more
likely range of results than simple best case / worst case calculations.
As displayed in Figure 12 and Figure 13, the resulting mean fuel reduction potential was 9% higher
than for the base scenario (red line) across all 10,000 runs, both without and with drive train adaptation.
Without drive train adaptation, the standard deviation around the ascertained mean was +/- 9%; with
inclusion of drive train adaptation, it increased to +/- 19%. Thus the base scenario results shown in
Chapter 5 appear to be conservative approximations to the mass-induced fuel savings.
Figure 12 and Figure 13 also display the best and worst case results according to the parameter
specifications indicated in Table 12. Accordingly, the worst possible fuel reduction would be 12 % lower
than the base case (38 % lower if drive train adaptations are considered), while the best possible fuel
reduction would be 33 % higher than the base case (73 % higher if drive train adaptations are
considered).
This comparison again illustrates the benefit of the Monte Carlo simulation over a simple worst-
case / best-case scenario: instead of quantifying only the upper and lower limit of the uncertainty
interval, its probability distribution, mean value and standard deviation are established based on
random sampling. This provides the practitioner with a deeper understanding of the uncertainty.
Figure 12: Fuel reduction potential - Monte Carlo simulation results without drive train adaptation
29
Ciroth A, Fleischer G, Steinbach J (2004): Uncertainty Calculations in Life Cycle Assessments, International Journal of Life Cycle Assessment 9 (4), pp 216 - 226
Bas
e sc
enar
io
Mea
n v
alu
e
Mea
n +
std
ev
Mea
n -
std
ev
Wo
rst
case
Bes
t ca
se

ACC Automotive Part LCA page 34 April 23, 2012
Figure 13: Fuel reduction potential - Monte Carlo simulation results with drive train adaptation
Table 13 presents the difference from baseline results (plastic assist step minus metal assist step)
over the entire life cycle for the base scenario (Chapter 5) next to the results using the Monte Carlo
mean value for the use phase. With an increase in fuel reduction potential the lightweight product
performs better than it did in the base scenario.
Table 13: Cradle-to-grave Base and Monte Carlo Scenarios – Alternative Minus Baseline
Impact Category No adaptation With adaptation
Base Scenario
Monte Carlo
Base Scenario
Monte Carlo
Primary Energy Demand (net calorific value) [MJ] -709.30 -799.43 -2081.23 -2294.83
Global Warming Potential (100 years) [kg CO2-Equiv.] -60.86 -67.53 -162.26 -178.05
Acidification Potential [mol H+ Equiv.] 1.48 1.19 -2.88 -3.56
6.3 CUT-OFF APPROACH Table 14 shows the life cycle performance of the metal running board / assist step (baseline
product) and the plastic running board / assist step (alternative product) using the cut-off approach, and
the difference from baseline (alternative product results minus baseline product results). Figure 14
through Figure 16 show the avoided burden and cut-off difference from baseline results throughout the
lifetime of the vehicle. The plastic assist step performed better using cut-off approach than avoided
Bas
e s
cen
ario
Mea
n v
alu
e
Mea
n +
std
ev
Mea
n -
std
ev
Wo
rst
case
Be
st c
ase

ACC Automotive Part LCA page 35 April 23, 2012
burden approach when comparing to the baseline for all impact categories. Therefore the avoided
burden results are conservative for comparing the plastic assist step to the metal assist step.
Table 14: Assist Step Results – Cut-off Approach
Impact Category Life Cycle
Stage Absolute Results
Alternative Minus
Baseline
Metal Assist Step
Plastic Assist Step
Plastic Assist Step
Primary Energy Demand (net calorific value) [MJ]
Manufacturing 624.36 707.26 82.90
Use n/a n/a -1001.41
EoL 0.22 1.00 0.78
Total n/a n/a -917.73
Global Warming Potential (100 years)
[kg CO2-Equiv.]
Manufacturing 49.36 37.92 -11.44
Use n/a n/a -74.01
EoL 0.03 0.13 0.10
Total n/a n/a -85.35
Acidification Potential [mol H+ Equiv.]
Manufacturing 7.02 9.43 2.40
Use n/a n/a -3.18
EoL 0.01 0.03 0.02
Total n/a n/a -0.76
Figure 14: Assist Step Cut-off Primary Energy Demand – Alternative Minus Baseline
Figure 15: Assist Step Cut-off Global Warming Potential – Alternative Minus Baseline
-1000
-500
0
500
1000
0 3 6 9 12 15
[MJ]
(n
et
calo
rifi
c va
lue
)
mileage [10,000 miles]
Avoided Burden
Cut-off
EoL
Mfg
.
-100
-75
-50
-25
0
25
50
75
100
0 3 6 9 12 15
[kg
CO
2-E
qu
iv.]
mileage [10,000 miles]
Avoided BurdenCut-off Eo
L

ACC Automotive Part LCA page 36 April 23, 2012
Figure 16: Assist Step Cut-off Acidification Potential – Alternative Minus Baseline
6.4 REPLACEMENT OF METAL ASSIST STEP SCENARIO The metal assist step sometimes rusts out and needs replacement. Table 15 shows the
performance of the plastic step product compared to the baseline product (plastic step results minus
metal step results) if the metal assist step is replaced once during its lifetime. Figure 17 through Figure
19 show the without replacement and with replacement difference from baseline results throughout the
vehicle lifetime. Doubling the manufacturing impact of the metal assist step causes the plastic assist step
to perform even better in comparison. In contrast to the no replacement results, the plastic assist step
performs better than the metal assist step for acidification potential when replacement is taken into
account.
Table 15: Replacement of Metal Assist Step Scenario – Alternative Minus Baseline
Replacement of Metal Assist Step Scenario - Alternative Minus Baseline
Primary Energy Demand (net calorific value) [MJ] -1088.46
Global Warming Potential (100 years) [kg CO2-Equiv.] -84.27
Acidification Potential [mol H+ Equiv.] -2.98
-4
-3
-2
-1
0
1
2
3
4
0 3 6 9 12 15[m
ol H
+ Eq
uiv
.]
mileage [10,000 miles]
Avoided Burden
Cut-off
EoL
Mfg
.

ACC Automotive Part LCA page 37 April 23, 2012
Figure 17: Assist Step Replacement Primary
Energy Demand – Alternative Minus Baseline Figure 18: Assist Step Replacement Global
Warming Potential – Alternative Minus Baseline
Figure 19: Assist Step Replacement Acidification
Potential – Alternative Minus Baseline
6.5 PLASTIC DATASET COMPARISON This study used ACC data for polypropylene resin as available in the NREL USLCI database. The
primary energy demand and acidification potential of the USLCI dataset is very similar to the PE dataset
“US: polypropylene granulate,” as shown in Figure 20. Though the global warming potential of the PE
dataset is 19% higher, using this dataset would not change whether the plastic assist step has a net
benefit or net burden compared to the baseline; see Appendix C: Detailed Manufacturing Results for the
contribution of polypropylene to global warming potential.
-1600
-1200
-800
-400
0
400
800
1200
1600
0 3 6 9 12 15
[MJ]
(n
et
calo
rifi
c va
lue
)
mileage [10,000 miles]
No ReplacementWith Replacement Eo
L
Mfg
.
-150
-100
-50
0
50
100
150
0 3 6 9 12 15
[kg
CO
2-E
qu
iv.]
mileage [10,000 miles]
No ReplacementWith Replacement Eo
L
Mfg
.
-10
-5
0
5
10
0 3 6 9 12 15
[mo
l H+
Equ
iv.]
mileage [10,000 miles]
No Replacement
With Replacement EoL
Mfg
.

ACC Automotive Part LCA page 38 April 23, 2012
Figure 20: Polypropylene Dataset Comparison
102%119%
101%
0%
25%
50%
75%
100%
125%
150%
Primary EnergyDemand
Global WarmingPotential
AcidificationPotential
USLCI
PE

ACC Automotive Part LCA page 39 April 23, 2012
7 INTERPRETATION
7.1 COMPLETENESS, SENSITIVITY, AND CONSISTENCY 7.1.1 Completeness
Completeness checks were carried out at gate-to-gate level, analyzing the completeness of process
steps considered to describe the part production and the coverage of material inputs and outputs of
relevance for the individual part production steps. Furthermore, the completeness was checked at
cradle-to-gate level with focus on the coverage of all significant upstream data. All relevant, specific
processes for the different options are considered and modeled to represent each specific situation.
7.1.2 Sensitivity and Scenario Analysis
The following scenarios were analyzed, as presented in Chapter 6:
Adaptation to the power train, resulting in a higher fuel reduction due to lightweighting during use phase
Cut-off approach instead of avoided burden approach for modeling scrap generation and product end-of-life
Replacing the metal step once during lifetime to assess the impact of the product failure due to rusting
Additionally, a comparison the USLCI and PE/GaBi polypropylene datasets is provided.
A Monte Carlo analysis was performed for the key assumptions in the use phase fuel reduction calculation, and is also presented in Chapter 6.
7.1.3 Consistency To ensure consistency only primary data of the same level of detail and the same background data
from the GaBi databases are used. The material input and output (product and scrap) data provided by ACC were checked on a mass balance basis. While building up the model cross-checks concerning the plausibility of mass and energy flows were conducted.
7.2 LIMITATIONS, CONCLUSIONS, AND RECOMMENDATIONS 7.2.1 Limitations
The following limitations to the study have been identified:
Results are specific to the selected parts for this study and are not to be generalized, e.g., the average metal and plastic assist step, or to the comparison of plastic and metal parts in general.
This study assumes the primary function of the compared parts is the same. It does not examine other potential benefits of using polymers or metal materials, such as differences in performance during crash testing, aesthetics, longevity beyond the considered 150,000 miles, etc.
Results are specific to US boundary conditions. Different geographical regions may have different conclusions.
This study did not collect primary energy and emissions data at the part manufacturing facilities; it used average GaBi background data for part production. It does not claim a particular potential environmental impact at a specific facility.

ACC Automotive Part LCA page 40 April 23, 2012
The calculation of the difference in fuel consumption during use phase depends on the assumptions described in Section 4.2 and included in the Monte Carlo analysis presented in Section 6.2.
The end-of-life stage assumes that all plastic goes to landfill and 98% of metal goes to recycling, and uses average GaBi background data to model end-of-life. It does not examine regional or local variation, where the recycling rate may differ or waste materials may be incinerated.
7.2.2 Conclusions and Recommendations When comparing the plastic assist step to the metal assist step:
Applying US EPA’s TRACI normalization factors demonstrates that summer smog and
eutrophication potential only make a minor contribution to the environmental profile compared
to the other impact categories in this study.
The lighter plastic running board / assist step performs better for primary energy demand and global warming potential, where the use phase is dominant, and worse for acidification potential, where the manufacturing stage dominant.
Scenario and sensitivity analysis show that the results are conservative estimates. A greater divergence from the baseline is possible, i.e., higher savings for the lightweight product, in the scenarios with adaptation to the power train and if the metal step is replaced during its lifetime. The cut-off approach and the mean values in the Monte Carlo analysis of the use phase savings also result in a greater divergence from the baseline.
The plastic running board / assist step performs worse than the baseline for acidification potential
due to the sulfur dioxide emissions to air from glass fibers and from the power grid mix for part
production. Due to the low sulfur content of the fuel (30 ppm), these additional burdens are not offset
by use phase savings in fuel consumption. For the automotive industry, global warming potential,
primary energy demand and summer smog potential are generally more relevant as these are the
impacts for which individual mass transportation is often criticized.30
An even greater benefit is possible if additional parts on the vehicle are also reduced in mass to an
extent that allows for adaptations to the drive train or gearbox (reduction of engine displacement or
elongation of gear ratio) while maintaining constant vehicle performance. These measures allow the use
phase savings to be more than doubled. Since the extent of additional lightweight measures was
unknown in this project, the drive train adaptation was considered as a potential scenario only. To
harvest the benefits of lightweighting to their full extent, it is recommended that the sum of all mass
reductions in the design process should be monitored and, whenever feasible, invested into fuel
economy by adapting the drive train while maintaining constant vehicle performance. Investing
lightweight measures into fuel economy will become more likely in the future since the Corporate
Average Fuel Economy (CAFE) standards for model years 2012-2016 passenger cars and light trucks
requires an estimated combined average mile per gallon level of 34.1 by model year 2016.
The potential benefit of plastic parts would also increase if the US adopts end-of-life regulations,
such as in Europe, for re-use and recovery of vehicle parts rather than disposal to landfill, since this
study assumes that all plastic goes to landfill at end-of-life based on current conditions.
30
Compare, e.g., the Volkswagen LCAs in the download section at www.environmental-commendation.com

ACC Automotive Part LCA page 41 April 23, 2012
Concluding, it appears reasonable to state that while the lighter plastic part shows only small
differences to the metal assist step with regard to summer smog, eutrophication, and acidification
potential, it has the potential to lower the global warming potential and primary energy demand of its
metal counterpart over the full life cycle. Future conditions such as more stringent fuel economy and
end-of-life regulations will likely increase this potential benefit across all impact categories. These
conclusions are drawn for the specific parts examined in this study and shall not be generalized to
encompass all plastic vs. metal part comparisons. Specific design options should always be assessed on a
case-by-case basis as different materials or combinations of materials may render different results.

ACC Automotive Part LCA page 42 April 23, 2012
APPENDIX A: LIFE CYCLE IMPACT ASSESSMENT CATEGORIES
Impact Category
(issue) Indicator Description Unit Reference
Energy Use Non-renewable Primary Energy Demand (PED)
A measure of the total amount of primary energy extracted from the earth. PED is expressed in energy demand from non-renewable resources (e.g. petroleum, natural gas, etc.).
MJ
(net calorific value)
An operational guide to the ISO-standards (Guinée et al.) Centre for Milieukunde (CML), Leiden 2001.
Climate Change Global Warming Potential (GWP)
(100 years)
A measure of greenhouse gas emissions, such as CO2 and methane. These emissions are causing an increase in the absorption of radiation emitted by the earth, increasing the natural greenhouse effect. This may in turn have adverse impacts on ecosystem health, human health and material welfare.
kg CO2 equivalent
Intergovernmental Panel on Climate Change (IPCC). Climate Change 2007: The Physical Science Basis. Contribution of Working Group I to the Fourth Assessment. Report of the Intergovernmental Panel on Climate Change. 2007.
Eutrophication Eutrophication Potential
Eutrophication covers all potential impacts of excessively high levels of macronutrients, the most important of which nitrogen (N) and phosphorus (P). Nutrient enrichment may cause an undesirable shift in species composition and elevated biomass production in both aquatic and terrestrial ecosystems. In aquatic ecosystems increased biomass production may lead to depressed oxygen levels, because of the additional consumption of oxygen in biomass decomposition.
kg N equivalent
Bare et al., TRACI: the Tool for the Reduction and Assessment of Chemical and Other Environmental Impacts JIE, MIT Press, 2002.
Acidification Acidification Potential
A measure of emissions that cause acidifying effects to the environment. The acidification potential is a measure of a molecule’s capacity to increase the hydrogen ion (H+) concentration in the presence of water, thus decreasing the pH value. Potential effects include fish mortality, forest decline and the deterioration of building materials.
mol H+ equivalent
Bare et al., TRACI: the Tool for the Reduction and Assessment of Chemical and Other Environmental Impacts JIE, MIT Press, 2002.
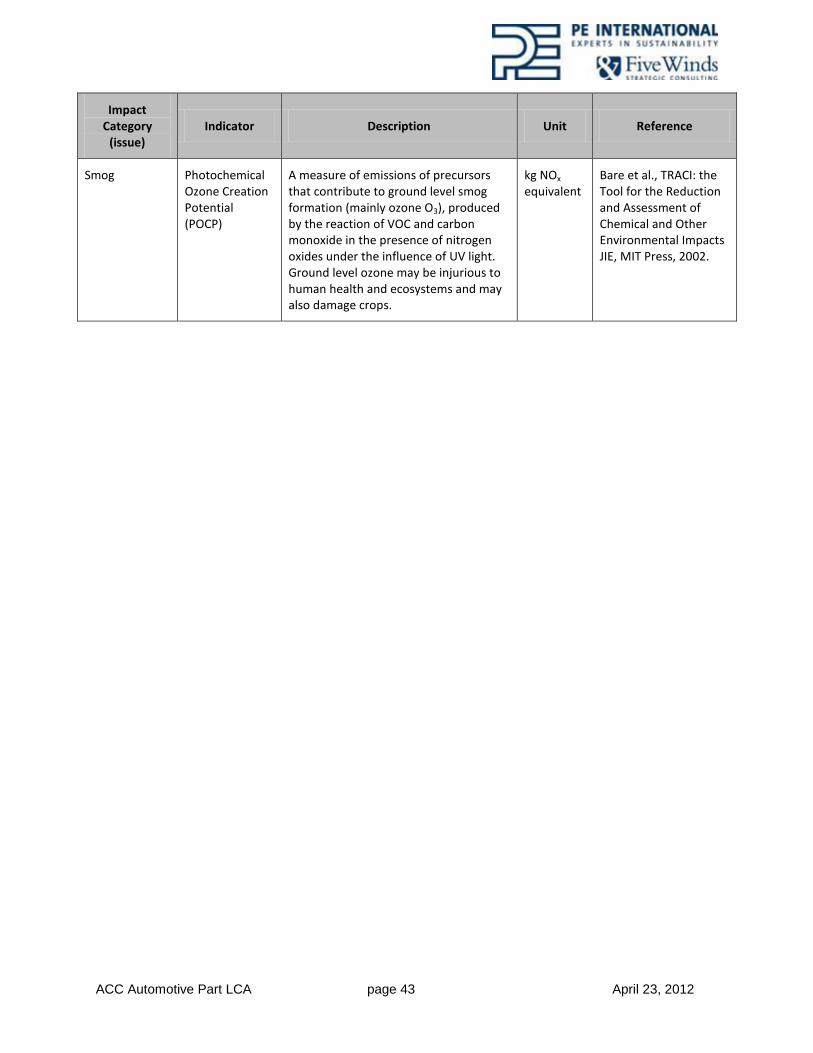
ACC Automotive Part LCA page 43 April 23, 2012
Impact Category
(issue) Indicator Description Unit Reference
Smog Photochemical Ozone Creation Potential (POCP)
A measure of emissions of precursors that contribute to ground level smog formation (mainly ozone O3), produced by the reaction of VOC and carbon monoxide in the presence of nitrogen oxides under the influence of UV light. Ground level ozone may be injurious to human health and ecosystems and may also damage crops.
kg NOx
equivalent Bare et al., TRACI: the Tool for the Reduction and Assessment of Chemical and Other Environmental Impacts JIE, MIT Press, 2002.

ACC Automotive Part LCA page 44 April 23, 2012
APPENDIX B: CRITICAL REVIEW REPORT
See following pages

Critical Review of the study ”Life Cycle Assessment of Polymers in an Automotive Assist Step”
Commissioned by: American Chemistry Council
Performed by: PE International, Inc.
Critical Review Panel: Dr. Roland Geyer, Associate Professor, Bren School, UCSB
Dr. Allan Murray, President, Ecoplexus Inc., and CTO, Allied
Composite Technologies LLC
Dr. John Sullivan, Environmental Scientist, Sustainable
Development Strategies, LLC
Date: 23 April, 2012
Reference ISO 14040 (2006): Environmental Management - Life Cycle
Assessment - Principles and Framework
ISO 14044 (2006): Environmental Management - Life Cycle
Assessment – Requirements and Guidelines
The Scope of the Critical Review
The review panel had the task to assess whether
the methods used to carry out the LCA are consistent with the international standards ISO
14040 and ISO 14044
the methods used to carry out the LCA are scientifically and technically valid,
the technological coverage of the industry is representative of the current practice,
the data used are appropriate and reasonable in relation to the goal of the study,
the interpretations reflect the limitations identified and the goal of the study, and
the study report is transparent and consistent.
The review was performed according to ISO 14040 and ISO 14044 in their strictest sense as the
results of the study are intended to be used for comparative assertions to be disclosed to the
public.
The extent to which the unit process data are appropriate and representative, given the goal and
scope of the study, was determined by a critical review of the available metadata, i.e. process
descriptions, etc. Analysis and validation of the process inputs and outputs themselves was
outside the scope of this review.
General evaluation
The defined scope for this LCA study was found to be appropriate to achieve the defined goals.
The Life Cycle Inventory model is suitable for the purpose of the study and is thus capable to

support the goal of the study. All primary and secondary data are adequate in terms of quality, and
technological, geographical and temporal coverage. The data quality is found to be high. The
selection of impact categories, which were limited to five, is appropriate and reasonable in relation
to the goal of the study. As a result, the report is deemed to be representative and complete. The
study is reported in a transparent manner. Various assumptions were addressed by sensitivity
analyses of critical data and methodological choices. The interpretations of the results reflect the
identified limitations of the study and are considered to be conservative.
The critical review process was open and constructive. The LCA practitioners were very
cooperative and forthcoming and addressed all questions, comments, and requests of the review
panel to its full satisfaction.
Conclusion
The study has been carried out in compliance with ISO 14040 and ISO 14044. The critical review
panel found the overall quality of its methods scientifically and technically valid and the used data
appropriate and reasonable. The study report is transparent and consistent, and the interpretation
of the results fully reflects the goal and the identified limitations of the study.
Roland Geyer Allen Murray John Sullivan

ACC Automotive Part LCA page 47 April 23, 2012
APPENDIX C: DETAILED MANUFACTURING RESULTS
This appendix shows the cradle-to-gate potential impacts from the manufacturing phase of the
life cycle for the two assist steps, not including transportation, by component (scrap credits
included) and by material or process (scrap credits shown separately).
Table 16: Assist Step Manufacturing Primary Energy Demand – by Component Primary Energy Demand (net calorific value) [MJ]
Metal Assist Step
Plastic Assist Step
Brackets 220.28
Frame 170.41
Topcover (TPO) 124.19
Step (40% glass fiber PP) 662.40
Fasteners 10.53 1.91
Figure 21: Assist Step Manufacturing Primary Energy Demand – by Component
Table 17: Assist Step Manufacturing Primary Energy Demand – by Material/Process
Primary Energy Demand (net calorific value) [MJ]
Metal Assist Step
Plastic Assist Step
Steel scrap 33.50
Steel hot rolled coil 413.34
Deep drawing / e-coat 56.70
Steel recycling credit -112.85
Glass fibres 175.27
Polypropylene 90.52 329.53
Compounding / injection molding 33.63 193.72
Granulator 0.03
Plastic recycling credit -36.11
Fasteners 10.53 1.91
0
100
200
300
400
500
600
700
MetalAssist Step
PlasticAssist Step
[MJ]
(n
et
calo
rifi
c va
lue
) Fasteners
Step (40% glassfiber PP)
Topcover (TPO)
Frame
Brackets

ACC Automotive Part LCA page 48 April 23, 2012
Figure 22: Assist Step Manufacturing Primary Energy Demand – by Material/Process
Table 18: Assist Step Manufacturing Global Warming Potential – by Component
Global Warming Potential (GWP 100 years) [kg CO2-Equiv.]
Metal Assist Step
Plastic Assist Step
Brackets 19.11
Frame 15.20
Topcover (TPO) 4.51
Step (40% glass fiber PP) 35.90
Fasteners 0.74 0.13
Figure 23: Assist Step Manufacturing Global Warming Potential – by Component
-200
0
200
400
600
800
MetalAssist Step
PlasticAssist Step
[MJ]
(n
et
calo
rifi
c va
lue
)
Fasteners
Plastic recycling credit
Granulator
Compounding / injection molding
Polypropylene
Glass fibres
Steel recycling credit
Deep drawing / e-coat
Steel hot rolled coil
Steel scrap
0
5
10
15
20
25
30
35
40
45
MetalAssist Step
PlasticAssist Step
[kg
CO
2-E
qu
iv.]
Fasteners
Step (40% glassfiber PP)
Topcover (TPO)
Frame
Brackets

ACC Automotive Part LCA page 49 April 23, 2012
Table 19: Assist Step Manufacturing Global Warming Potential – by Material/Process Global Warming Potential
(GWP 100 years) [kg CO2-Equiv.]
Metal Assist Step
Plastic Assist Step
Steel scrap 3.56
Steel hot rolled coil 38.97
Deep drawing / e-coat 3.77
Steel recycling credit -11.99
Glass fibres 16.09
Polypropylene 2.24 8.16
Compounding / injection molding 2.27 13.05
Granulator 0.00
Plastic recycling credit -1.40
Fasteners 0.74 0.13
Figure 24: Assist Step Manufacturing Global Warming Potential – by Material/Process
Table 20: Assist Step Manufacturing Acidification Potential – by Component
Acidification Air [mol H+ Equiv.]
Metal Assist Step
Plastic Assist Step
Brackets 2.74
Frame 2.08
Topcover (TPO) 1.20
Step (40% glass fiber PP) 9.06
Fasteners 0.10 0.02
-20
0
20
40
60
MetalAssist Step
PlasticAssist Step
[kg
CO
2-E
qu
iv.]
Fasteners
Plastic recycling credit
Granulator
Compounding / injection molding
Polypropylene
Glass fibres
Steel recycling credit
Deep drawing / e-coat
Steel hot rolled coil
Steel scrap

ACC Automotive Part LCA page 50 April 23, 2012
Figure 25: Assist Step Manufacturing Acidification Potential – by Component
Table 21: Assist Step Manufacturing Acidification Potential – by Material/Process
Acidification Air [mol H+ Equiv.]
Metal Assist Step
Plastic Assist Step
Steel scrap 0.35
Steel hot rolled coil 4.63
Deep drawing / e-coat 1.02
Steel recycling credit -1.19
Glass fibres 3.46
Polypropylene 0.46 1.68
Compounding / injection molding 0.74 4.24
Granulator 0.00
Plastic recycling credit -0.32
Fasteners 0.10 0.02
Figure 26: Assist Step Manufacturing Acidification Potential – by Material/Process
The contribution of each metal assist step component to the potential impacts approximately
follows the material composition, with the steel brackets, steel frame, and TPO top cover
0
2
4
6
8
10
MetalAssist Step
PlasticAssist Step
[mo
l H+
Equ
iv.]
Fasteners
Step (40% glassfiber PP)
Topcover (TPO)
Frame
Brackets
-2
0
2
4
6
8
10
MetalAssist Step
PlasticAssist Step
[mo
l H+
Equ
iv.]
Fasteners
Plastic recycling credit
Granulator
Compounding / injection molding
Polypropylene
Glass fibres
Steel recycling credit
Deep drawing / e-coat
Steel hot rolled coil
Steel scrap

ACC Automotive Part LCA page 51 April 23, 2012
contributing the most to each impact category, respectively. The top cover, however, represents
only 9% of the mass but contributes 24% to primary energy demand and 20% to acidification
potential. By material or process, upstream production of hot rolled steel contributes the most
across all impact categories.
The plastic assist step is one component made of 60% polypropylene and 40% glass, plus
fasteners which represent less than 1% of the product by mass and contribute less than 0.5% to
each impact category. By material or process, polypropylene contributes most to primary energy
demand, glass fibers contribute the most to global warming potential, and part production
(compounding and injection molding) contributes the most to acidification potential.

ACC Automotive Part LCA page 52 April 23, 2012
APPENDIX D: RESULTS FOR EUTROPHICATION AND SMOG POTENTIAL
This section shows show the life cycle performance for eutrophication and smog potential, and
the difference from baseline (plastic assist step results minus metal assist step results). The figures
show the difference from the baseline throughout the life cycle of the vehicle and if there is a
“break-even” mileage where the baseline and plastic product are equal in potential impact i.e., the
impact equals zero.
Table 22: Assist Step Eutrophication Potential
Eutrophication [mg N-Equiv.]
Absolute Results
Alternative Minus
Baseline
Metal Assist Step
Plastic Assist Step
Plastic Assist Step
Manufacturing 4419.35 4403.46 -15.89
Materials/Part Production 3317.69 4590.63 1272.94
Scrap Credit 1101.67 -187.17 -1288.84
Use n/a n/a -1631.17
Fuel Production (Pre-combustion) n/a n/a -1631.17
Fuel Combustion Emissions n/a n/a 0
EoL 1604.32 32.90 -1571.42
Landfill 5.44 24.33 18.88
Scrap Credit 1598.88 8.58 -1590.30
Total n/a n/a -3218.48
Figure 27: Assist Step Eutrophication Potential – Alternative Minus Baseline
-4000
-3000
-2000
-1000
0
1000
2000
3000
4000
0 1 2 3 4 5 6 7 8 9 10 11 12 13 14 15
[mg
N-E
qu
iv.]
mileage [10,000 miles]
Plastic Assist StepEo
L
Mfg
.

ACC Automotive Part LCA page 53 April 23, 2012
Table 23: Assist Step Smog Potential
Smog Air [mg NOx-Equiv.]
Absolute Results
Alternative Minus
Baseline
Metal Assist Step
Plastic Assist Step
Plastic Assist Step
Manufacturing 60.95 64.63 3.68
Materials/Part Production 74.23 67.51 -6.72
Scrap Credit -13.28 -2.88 10.40
Use n/a n/a -29.76
Fuel Production (Pre-combustion) n/a n/a -29.76
Fuel Combustion Emissions n/a n/a 0
EoL -19.17 0.36 19.52
Landfill 0.10 0.46 0.36
Scrap Credit -19.27 -0.10 19.17
Total n/a n/a -6.56
Figure 28: Assist Step Smog Potential – Alternative Minus Baseline
-30
-20
-10
0
10
20
30
0 1 2 3 4 5 6 7 8 9 10 11 12 13 14 15
[mg
NO
x-Eq
uiv
.]
mileage [10,000 miles]
Plastic Assist Step EoL
Mfg
.

ACC Automotive Part LCA page 54 April 23, 2012
ABOUT PE INTERNATIONAL
PE INTERNATIONAL is the premier integrated sustainability solutions provider across the globe, providing consulting, software and content that delivers measureable business impacts to the corporate and product sustainability efforts of enterprises of all sizes. Our market-leading expertise is offered through a unique portfolio of products and services that includes: Five Winds Strategic Consulting, Product Sustainability Solutions, and Corporate Sustainability Solutions. Founded in 1991, PE INTERNATIONAL operates from 20 offices globally to assist clients in measuring, understanding and managing their sustainability footprint to create sustainable and quantifiable business value. We work with clients across all industry sectors and in all geographic regions to identify the specific challenges to optimizing their sustainability performance. Our collaborative approach supports clients in elevating their sustainability performance by integrating environmental, social and broader-based cost information into core business processes from strategy development and business planning, to capital expenditure approvals, and product development. Our proven processes, technologies, tools and content have allowed clients to translate sustainability improvements into measureable business value by communicating sustainability improvements to all key stakeholders in easy to understand ways. The unique nature of the PE INTERNATIONAL solution portfolio allows us to deliver value across the enterprise value chain on a continuing basis. Our Five Winds Strategic Consulting services includes thought leaders and practitioners that have defined many of the key sustainability processes in general use today while our GaBi LCA software and GaBi database are the most widely used LCA tools in the world. PE INTERNATIONAL Solutions
Five Winds Strategic Consulting – Strategic consulting that focuses on enterprise-level sustainability strategy, management systems, product innovation, carbon management and reporting.
Product Sustainability – A combination of GaBi LCA Software, the leading software tool for modeling complex product systems from a Life Cycle Perspective, GaBi LCI Datasets, our regularly updated database built upon information from industry sources, scientific research, technical literature, and internal patent information, and consulting and implementation services.
Corporate Sustainability – SoFi Software, a leading software platform for enterprise-wide corporate environmental management focusing on: Sustainability Information Management, Analytics, and Strategic Action Planning, and consulting and implementation services.
For more information or questions please contact:
John Heckman, North American Managing Director Phone: +1 (303) 442-6969 [email protected]