life cycle assessment of co2 emissions from wind power plants: methodology and case studies
TRANSCRIPT
at SciVerse ScienceDirect
Renewable Energy 43 (2012) 30e36
Contents lists available
Renewable Energy
journal homepage: www.elsevier .com/locate/renene
Life cycle assessment of CO2 emissions from wind power plants: Methodologyand case studies
Yuxuan Wang a,*, Tianye Sun b
aMinistry of Education Key Laboratory for Earth System Modeling, Center for Earth System Science, Institute for Global Change Studies, Tsinghua University, Beijing 100084, Chinab School of Environment, Tsinghua University, Beijing, China
a r t i c l e i n f o
Article history:Received 10 December 2010Accepted 31 December 2011Available online 15 January 2012
Keywords:Wind power plantWindCO2
Life cycle assessmentChina
* Corresponding author.E-mail address: [email protected] (Y. Wang).
0960-1481/$ e see front matter � 2012 Elsevier Ltd.doi:10.1016/j.renene.2011.12.017
a b s t r a c t
Wind energy plays an increasingly important role in the world’s electricity market with rapid growthprojected in the future. In order to evaluate the potential for wind energy to mitigate the effects ofclimate change by reducing CO2 intensity of the energy sector, this study developed a new direct andsimple method for estimating CO2 emissions per kWh produced during the life cycle of four represen-tative wind power plants (three in developed countries and one in China). The life cycle analysis focuseson the wind power plant as the basic functional object instead of a single wind turbine. Our results showthat present-day wind power plants have a lifetime emission intensity of 5.0e8.2 g CO2/kWh electricity,a range significantly lower than estimates in previous studies. Our estimate suggests that wind iscurrently the most desirable renewable energy in terms of minimizing CO2 emissions per kWh ofproduced electricity. The production phase contributes the most to overall CO2 emissions, while recyclingafter decommission could reduce emissions by nearly half, representing an advantage of wind whencompared with other energy generation technologies such as nuclear. Compared with offshore windplants, onshore plants have lower CO2 emissions per kWh electricity and require less transmissioninfrastructure. Analysis of a case in China indicates that a large amount of CO2 emissions could be savedin the transport phase in large countries by using shorter alternative routes of transportation. As theworld’s fastest growing market for wind power, China could potentially save 780 Mtons of CO2 emissionsannually by 2030 with its revised wind development target. However, there is still ample room for evenmore rapid development of wind energy in China, accompanied by significant opportunities for reducingoverall CO2 emissions.
� 2012 Elsevier Ltd. All rights reserved.
1. Introduction
In the past several years renewable sources of energy have wonthe support of governments in several countries, which has takenthe form of various legal frameworks with stable and lastingpremiums [1]. Wind energy, together with hydroelectricity, solarenergy and biomass, is one of the most promising renewableenergy sources. During operation, wind power plants are friendly tosurrounding environments, releasing no direct emissions, harmfulpollutants or CO2. Newer technologies have made the utilitizationof wind energy much more efficient and cost-effective. Wind isarguably the most convenient method to generate electricity inremote locations. Wind turbines use less space than an averagecoal-fired power station. With these advantages, wind power isplaying an increasingly important role in the global electricity
All rights reserved.
market. In 2009, global cumulative installed capacity reached158,505 MW (MW ¼ 106 W), eleven times of that in 1996 [2].Recent developments in wind energy have been particularly rapidwith the annual growth rate of global installations reaching 29%and 32% in 2008 and 2009 respectively [2,3].
The total electricity generation from wind turbines installedglobally reached 340 TWh (TWh ¼ 1012 Wh) by the end of 2009,contributing 2% of the global electricity supply [4]. Denmarkgenerates 20% of its electricity using wind. In Portugal, this figure is15%, followed by 14% in Spain [2,4]. China doubled its capacity from12.2 GW (GW ¼ 109 W) in 2008 to 25.8 GW in 2009, becoming theworld’s largest market for wind energy [2]. About 1.4% of the totalelectricity consumption in China is now supplied by wind [5,6].Current forecasts predict that annual growth rates from 2009 to2014 will average 20.9% in terms of total installed capacity. Theserates are modest compared to past developments: in the last tenyears, we have seen an average increase of over 28% for both totaland annual capacity additions [2].
Y. Wang, T. Sun / Renewable Energy 43 (2012) 30e36 31
The process of converting the kinetic energy of the wind intoelectricity directly creates no forms of pollution or CO2 emissions.But if one takes the whole life cycle of wind turbines into consider-ation, themanufacturing, transport and disposal ofwind turbines dohavequantifiable environmental impacts. If the current growth ratesofwind energy aremaintained in the future, as forecasted by variousprojections [2], it becomes crucial to understand and quantify thefull extent of wind energy’s impact on the climate, especially forthose countries which already have relatively low carbon emissionsper kWh or possess great wind resources. Only by quantifying theenvironmental impact of wind energy throughout the entire lifecyclewill we be able to evaluate the true potential of wind energy tomitigate climate change. This study thus aims to analyze the envi-ronmental impact of wind energy with respect to CO2 emissions,considering the whole life cycle of wind power plants.
There are three differences between our study and previousacademic studies published. First is on the scope of analysis. Inprevious life cycle analyses of wind energy, the focus has mainlybeen on individual wind turbines with rated power outputs rangingfrom 100 kW to 4.5 MW rather than on entire wind power plants[2,7e9]. Only two studies surveyed have considered wind powerplants, but these plants consisted only of wind turbines with rela-tively small rated power outputs (�500 kW) [10,17]. As the windpower plant is in fact the smallest and most basic functional objectand turbines of larger rated power outputs become more and morecommon, there is a need to update these studies. In this study, wediscuss the differences in CO2 emissions between wind turbinesand wind power plants. The second difference concerns method-ology. Previous studies of this topic have depended mostly on LifeCycle Assessment (LCA) software [1,7,8,10,12,13,17e20]. In thisstudy, a simple method that adopts the same basics of LCA butavoid using an LCA software for better transparency in calculationprocesses has been developed and evaluated to calculate the directand indirect CO2 emissions related to wind energy. Third, our studyprovides data from a real case study of awind power plant in China,and in particular those CO2 emissions associated with the transportphase. This study assesses the potential for reducing CO2 emissionsfrom turbine transport and suggests greater implications for windenergy development in large developing countries.
Four cases ofwind power plants are studied in this paper. Amongthe three general cases in developed countries, two use 3.0 MWwind turbines and the third uses 1.65MWwind turbines. The fourthcase is awind farm in China installedwith 800 kW turbines. Three ofthe four cases are onshore wind power plants and one is offshore.
2. Methodology
In this study, the amount of CO2 emitted per kWh of electricitygenerated was selected as the indicator of the environment impactof wind energy. First, raw material consumption and electricityproduction during the lifetime of individual wind power plantswithin the system boundary was collected. Then, the emissionfactor provided by in the IPCC Guidelines for National GreenhouseGas Inventories [11] was adopted to calculate CO2 emissions fromdifferent materials. Finally, the CO2 emission per kWh electricityproduced was evaluated. An advantage of this calculation is thetransparency of the whole calculation process and associatedresults. Besides the material consumption statistics from theturbine producer (Vestas in this study) and the emission factorfrom IPCC, other data or particular software is needed for the study.
2.1. CO2 emission calculation
The calculation of CO2 emissions is based on the followingformula:
Emission ¼Xn
Emissioni
i¼1¼Xn
i¼1
Activity Leveli � Emission Factori (1)
Emissioni: Amount of CO2 emitted from the consumption ofmaterial i (e.g. iron).
Activity Leveli: Material consumption for material i.Emission Factori: Consumption of material i’s emission factor.In this study, the Activity Level is the quantity of the material
and energy consumed during the process of production, transport,operation and disposal in the life cycle of the wind turbine andwind power plant. The Emission Factor related to a certain kind ofconsumption was selected from the 2006 IPCC Guidelines forNational Greenhouse Gas Inventories [11].
2.2. System boundary
For this study, the limits of the system include the following fourphases in the life cycle of the wind power plant: the production andtransport of the components of the power plant, the operation ofthe wind plant which includes reconditioning and renewal of thecomponents, and finally, the disposal (including recovery) of thematerial consumed over its lifetime.
As far as the research object is concerned, each wind powerplant includes two parts: wind turbines (foundation, tower, nacelle,and rotor) and transmission (internal cables, transformer stationsand external cables).
2.3. Functional unit
The kWh electricity produced by the wind power plant wasselected as the functional unit for the evaluation of CO2 emissions.A relationship will be developed between the CO2 emissions of theplant and the electricity it generates. In this way it is possible tomake a posterior comparative study with regards to other kinds ofenergy producing technology. The outcome of the calculation willbe presented in the form of g CO2/kWh, also called ‘intensity index’in other studies [7].
3. Case studies
3.1. Basic information
This study focused on four cases, in which the research subjectsare three wind power plants in developed countries (1e3) and onetypical plant (4) in Chifeng, Inner Mongolia, China. As mentioned inthe methodology section, each wind power plant basically includeswind turbines and transmission equipment. Table 1 shows the basicinformation and energy production of these farms.
The 1.65 MW wind turbine is a Vestas V82 model, of whichthere are currently 2733 installed globally, and the 3.0 MWturbine is a V90 model, of which 1560 have been installed [14].These two types of wind turbines account for 11.8% and 12.2% ofthe total global installed capacity of Vestas turbines respectively.Vestas has the largest market share globally of wind turbinemanufacturers and has the largest installed capacity of an inter-national companies working in China. The wind power plant inChina uses Vestas V52 model 850 kW wind turbines, which iscurrently the most common type of turbine in China’s windpower market.
The focus of case 1, 2 and 3 is on the amount of CO2 emissionsduring the lifetime of wind power plants. The study of case 4focuses on emissions during the transport phase.

Table 1Basic information of the four wind power plants [12,13,16].
Windpower plantnumber
Type of windpower plant
Type andnumber ofwind turbine
Capacityfactor %
Life time/year
Electricityproduction/GWh/year
1 Onshore 186*1.65 MW 40.7 20 10732 Offshore 100*3.0 MW 54.16 20 14233 Onshore 100*3.0 MW 30.02 20 7894 Onshore 116*850 kW 23.0 20 198
Y. Wang, T. Sun / Renewable Energy 43 (2012) 30e3632
3.2. Material consumption and emission factors
The material consumption during the different phases in thelifetime of the three target wind farms is represented in the ActivityLevel in equation (1). Table 2 shows the overall materialconsumption of wind power plant 1 in detail.
According to 2006 IPCC Guidelines for National Greenhouse GasInventories [11], the production process of eight types of materialsand their chemical components listed in Table 2 will cause direct orindirect CO2 emission during the lifetime of the wind turbine. Wehereafter refer to them as related materials in the CO2 calculation.Table 3 lists the consumption level of related materials for windpower plants 2 and 3.
Hard coal, crude oil, lignite and natural gas are the energyresources used primarily in the production of the materials andcomponents used in the wind power plant. Iron and limestone arethe main materials used in the production of steel. Furthermore,crude oil is used as transformer oil and as well as in the productionof plastics among epoxy for the blades. Besides iron, aluminum isthe most commonly used metal in the wind power plant,employed, for example, in the plat former of the towers and cables.Zinc is also used in the metalizing of the tower and offshorefoundations of the wind turbine. The material consumption in thetransmission represents the basis for the difference in CO2 emis-sions between the wind power plant and wind turbine. Thestatistics in Table 3 shows that this difference is significant in thecase of offshore power plants, in which the fraction of the trans-mission materials accounts for 15.5% of the total mass. This fractionis less than 1% for onshore wind plants.
Table 4 shows themass of the components for wind power plant4 and the amount of diesel consumed during transportation fromthe manufacturer to the site of the power plant. The course oftransportation in this case is illustrated in Fig. 1. The amount ofdiesel fuel consumed during the transport phase depends on theweight of the transported materials and the distance traveled. Two
Table 2Consumption of materials in wind power plant 1.
Materials of wind power plant/kg Total/kg Production/kg Transport/kg O
Water (fresh) 7.43Eþ08 1.32Eþ09 1.33Eþ06 2Stone 7.03Eþ07 7.03Eþ07 0.00Eþ00 3Inert rock 4.08Eþ07 3.80Eþ07 0.00Eþ00 0Hard coal 2.16Eþ07 4.33Eþ07 2.91Eþ04 3Iron 1.95Eþ07 7.85Eþ07 5.72Eþ02 4Crude oil 1.40Eþ07 1.06Eþ07 5.93Eþ06 1Natural gas 1.03Eþ07 9.55Eþ06 3.55Eþ05 2Limestone 6.39Eþ06 6.44Eþ06 1.25Eþ03 8Lignite 4.40Eþ06 5.10Eþ06 5.22Eþ02 2Sodium chloride (rock salt) 2.72Eþ06 2.76Eþ06 8.20Eþ02 2Quartz sand 2.41Eþ06 2.42Eþ06 8.59Eþ00 2Soil 6.73Eþ05 6.71Eþ05 0.00Eþ00 0Kaolin 3.88Eþ05 3.88Eþ05 0.00Eþ00 0Gypsum 2.82Eþ05 2.82Eþ05 0.00Eþ00 0Dolomite 2.17Eþ05 6.70Eþ05 0.00Eþ00 0Colemanite 2.16Eþ05 2.16Eþ05 0.00Eþ00 0Aluminum 1.62Eþ05 1.74Eþ05 4.57Eþ02 1
Note: The statistics directly adopted from Vestas’ report [12].
courses are involved in this case, illustrated in Fig. 1. The rotor andnacelle are transported through course 1, while the tower andfoundation of the turbines are sent via course 2 [16]. Transportroutes for other components were not available, and so we givea range of associated emissions instead of one specific quantity.
Corresponding emission factors for the materials are chosenfrom the 2006 IPCC Guidelines for National Greenhouse GasInventories, as shown in Table 5. Vestas has manufacture factoryaround Asia, North America, Europe and other places in the world.Therefore, the default emission factor of IPCC is applied in ourpaper. Energy, mineral industry and metallurgy are three mainsources of CO2 emissions, and energy holds the biggest emissionintensity. Although emission factors may vary by industrial process,we chose the same default value for different cases in order tocompare the environmental impact of different wind power plants.
4. Results and discussion
4.1. Calculation results
CO2 emissions could be calculated from the activity level andemission factor, the results of which are shown in Table 6 and Fig. 2.
For wind power plant 1, energy and metallurgy contributes over98% of total lifetime CO2 emissions, which is attributed to the largeamount of material consumption and high emission factors (Fig. 2a).Among the fourphases in the life cycle, theproductionphaseproducesthe most emissions, followed by the transport phase. The operationphase has very little impact (Fig. 2b). These results are generallyacknowledged in previous studies [1,7,10,20]. Due to the expectationthatmuchof theplantwill be recycled, the disposal phasewill recoverabout half of the amount of CO2 emitted from the production phase.Although theremaybesomenegative impact involved in the recyclingprocess (such as the necessary transportation of materials), thedisposal phase ultimately presents net positive effects, which is oneadvantage of wind energy in comparison to nuclear, a point thatshould not be underestimated. Without disposal, the environmentalimpact of wind power plants will increase by approximately 87.6%.
Previous studies indicate that the wind turbines with higherrated power have lower CO2 emissions [7,12,13,17]. This finding isreiterated in this study through the comparison of wind plant 1with plants 2 or 3. This is due primarily to economies of scale: smallwind turbines require more life cycle energy per unit of powergenerated than larger ones. This phenomenon will be morepronounced the larger the difference in the rated power betweenthe two wind turbines.
peration/kg Disposal, incl. recovery of metals/kg Involved in CO2 emission
.60Eþ03 �5.81Eþ08 �
.14E-03 7.68E�06 �
.00Eþ00 2.80Eþ06 �
.55Eþ03 �2.17Eþ07 O
.68Eþ00 �5.91Eþ07 O
.98Eþ05 �2.75Eþ06 O
.79Eþ03 4.10Eþ05 O
.29Eþ01 �4.62Eþ04 O
.23Eþ01 �7.01Eþ05 O
.09Eþ00 �4.71Eþ04 �
.45Eþ01 �1.09Eþ04 �
.00Eþ00 1.28Eþ03 �
.00Eþ00 8.09E�01 �
.00Eþ00 3.03Eþ01 �
.00Eþ00 �4.53Eþ05 O
.00Eþ00 4.51E�01 �
.87Eþ00 �1.28Eþ04 O
Table 3CO2 emission from related material in wind power plant 2 and 3.
Wind power plant 2 (offshore) Wind power plant 3 (onshore)
Material of wind power plantinvolved in CO2 emission
Turbine/kg Transmission/kg Material of wind power plantinvolved in CO2 emission
Turbine/kg Transmission/kg
Hard coal 1.86Eþ07 1.65Eþ06 Hard coal 9.67Eþ06 0.00Eþ00Crude oil 9.94Eþ06 6.65Eþ06 Crude oil 7.94Eþ06 1.07Eþ04Natural gas 8.75Eþ06 1.35Eþ06 Natural gas 6.22Eþ06 3.39Eþ03Lignite 7.63Eþ06 1.16Eþ06 Lignite 5.15Eþ06 4.30Eþ02Limestone 3.40Eþ06 1.14Eþ05 Limestone 1.48Eþ06 3.02Eþ02Iron 1.17Eþ07 4.84Eþ04 Iron 6.23Eþ05 3.17Eþ01Zinc 1.12Eþ06 2.44Eþ04 Zinc 2.08Eþ05 0.00Eþ00Aluminum 1.95Eþ05 1.22Eþ05 Aluminum 7.81Eþ04 1.29Eþ02Lead 4.33Eþ02 8.60Eþ04
Note: The statistics directly adopted from Vestas’ report [13].
Y. Wang, T. Sun / Renewable Energy 43 (2012) 30e36 33
4.2. Onshore and offshore
Since the ocean in general provides better wind conditions,offshore wind power plants typically have higher capacity factorsthan those onshore (Table 1; Fig. 3). This is why offshorewind farmsare currently favored despite higher costs. However, the comparisonbetween plant 2 and 3 shows the ultimate advantage of onshorewind power plants with respect to CO2 emissions. Better windconditions experienced by offshore power plants cannot cover thehigher environmental costs created by the additional efforts inconstruction, such as boat landingplatforms, external sea cables andoffshore transformer stations. Therefore, offshore powerplants havehigher CO2 emission per kWh. This conclusion is consistent withprevious studies [17e19]. However, compared with the CO2 emis-sionper kWhproduced fromtraditional energy sources, the offshorewind farms still create significantly less CO2 emissions.
4.3. Wind turbines and wind power plants
To date, most studies have focused mainly on the wind turbineitself and have failed to discuss the differences between the turbineand power plant. An entire wind power plant is in fact the smallestand most basic functional object in assessing the environmentalimpact of wind power. Each wind power plant includes windturbines and transmission parts (internal cables, transformerstationsandexternal cables). Thus, CO2 emissions fromawindpowerplant will be higher than the sum of the individual wind turbinesinstalled in the plant as there are additional emissions from thetransmission parts. However, the difference between them variesfrom case to case. Fig. 3 shows CO2 emissions per kWh attributed toturbines and transmission in case 2 and case 3. The transmissionparts play a relativemore important role in the offshore power plant,which accounts for up to 19.34%of total emissions. In contrast, for theonshore farm, transmission parts represent less than 1% of totalemissions. To better assess CO2 emissions from offshore wind, it isimportant to focus on the whole plant instead of the individual
Table 4Mass of individual components of wind power plant 4 and diesel consumption [15].
Case 4 Component
Wind Turbine TowerNacelleRotorFoundationTotal (turbine)
Other componentof wind power plant
Internal cablesa
Transformer stationExternal Cablesa
Total (other components)Total
a Masses of internal and external cables are not available from the reference. We estim
turbines. For the onshore plant, however, this difference can beignored. This result also demonstrates how the systemboundaries ofa study have definitive influences on the results.
4.4. Emissions from transport
Since many countries with high potential for wind power havelarge amounts of land, such as China, Russia and Canada, thetransport-related emissions involved in the utilization of windpower can be significant and thus deserve careful analysis. We gavea range of CO2 emissions per kWh electricity from the transportphase for a wind farm in inland China (case 4), which is lower thanthe corresponding value in case 1. This difference could be due tothe difference in components’ mass between the two cases: thetotal mass of case 1 is around ten times of that in the case 4 which islikely due to the large foundations (832 ton) of the turbines in case1, which havewith higher rated power [12]. The highermass resultsin more oil consumption during the transport phase. However,a large amount of CO2 emissions can still be saved by chartingshorter transportation routes. We can see from case 4 using shortertransportation routes can reduce related emissions by 33%, withtotal savings of 346 ton CO2 for this 116*850 kW scale wind powerplant. Therefore, it is important for large countries to builddistributed manufacturers of wind turbines near wind resourcesand potential locations of wind power plants. Whenever possible,transport by boat or train is preferred to trucks to reduce the carbonintensity in long distance transport [7].
4.5. Comparison with other energy sources
Table 7 compares CO2 emissions per kWh of electricity producedby different energy resources [19]. Previous estimates for windpower ranged by more than a factor of 10, from 10 to 124 g CO2/kWh, due to the smaller and less efficient wind turbines included instudies. With more advanced technology, the efficiency of windpower has increased and old types of turbines with lower rated
Mass/ton Percent (%) Diesel consumption/L
5.97Eþ03 31.8 4.73Eþ042.73Eþ03 14.5 5.20Eþ041.28Eþ03 6.8 5.20Eþ045.97Eþ02 3.2 6.30Eþ031.06Eþ04 56.4 1.58Eþ054.69Eþ02 2.5 6.30Eþ04w1.73Eþ054.69Eþ02 2.56.57Eþ03 34.98.18Eþ03 43.5 6.30Eþ04w1.73Eþ051.88Eþ04 100.0 2.21Eþ05w3.31Eþ05
ate them by their ratio to the mass of the transformer in case 1.
Fig. 1. The transport courses of case 4. Inset shows the zoom map of the courses. A: manufacturer of the rotor and nacelle; B: wind power plant; C: manufacturer of tower andfoundation. Course 1: AeB 817 Km, course 2 CeB 297 Km.
Table 6Breakdown CO2 emissions from the life cycle assessment of the four wind powerplants.
Wind power plant Item CO2 emission/g/kWh Percent (%)
Case 1186*1.65 MWOnshore (by material)
Hard coal 2.84 34.6Crude oil 2.21 26.9Natural gas 1.37 16.7Lignite 0.354 4.3Iron 1.28 15.6Aluminum 0.013 0.2Limestone 0.137 1.7Dolemite 0.005 0.1
Y. Wang, T. Sun / Renewable Energy 43 (2012) 30e3634
power have become less common. Our study represents animportant update to previous estimates and gives a more specificrange, from 5 to 9 g CO2/kWh. This places wind as the most envi-ronmentally desirable renewable energy, with the lowest amountof CO2 emissions per kWh of produced electricity.
Compared with fossil fuel, it is obvious that renewable energy,especially wind energy, has significant potential to mitigate climatechange. For every kWh of electricity generation, the amount of CO2emitted from coal-, oil- and gas-fired power plants is 154, 117 and96 times that of wind power respectively, taking average emissionsof 6.3 g CO2/kWh for wind.
4.6. Benefits of wind power in China
The demand for electricity in China is currently increasing at anannual rate of w10% [23] and China reached a total electricity
Table 5Emission factors from the 2006 IPCC Guidelines for national Greenhouse gasInventories [11].
Material of wind power plant involved in CO2 emission Emission factor
Hard coal, kg CO2/TJ 98,300Crude oil, kg CO2/TJ 73,300Diesel oil, kg CO2/TJ 74,100Natural gas, kg CO2/TJ 56,100Lignite, kg CO2/TJ 10,100Limestone, ton CO2/ton 0.44Dolomite, ton CO2/ton 0.48Iron, ton CO2/ton 1.35Zinc, ton CO2/ton 1.72Aluminum, ton CO2/ton 1.65Lead, ton CO2/ton 0.52
generation of 3.66 PWh (P ¼ 1015) in 2009 [6]. It is estimated thatChina’s production of electricity will increase to 9.24 PWh by 2030[6,23]. If this additional electricity is supplied mainly by coal, CO2emissions are expected to increase by as much as 5.6 Gtons of CO2per year by 2030. China is now the world’s fastest growing market
Total 8.21 100.0Case 1186*1.65 MW
Onshore (by phase)Production 14.40 175.4Transport 0.99 12.0Operation 0.03 0.4Disposal �7.20 �87.7Total withoutdisposal
15.40 187.6
Total 8.21 100.0Case 2100*3.0 MW
OffshoreTurbine 4.86 81.27Transmission 1.12 18.73Total 5.98 100.00
Case 3100*3.0 MWOnshore
Turbine 4.96 99.94Transmission 0.003 0.06Total 4.97 100.00
Case 4116*850 kWOnshore
Transport 0.19e0.28
Note: CO2 emissions from the 186*1.65 MW power plant (wind power plant 1) aregiven in two forms by different materials and by different life cycle phases.
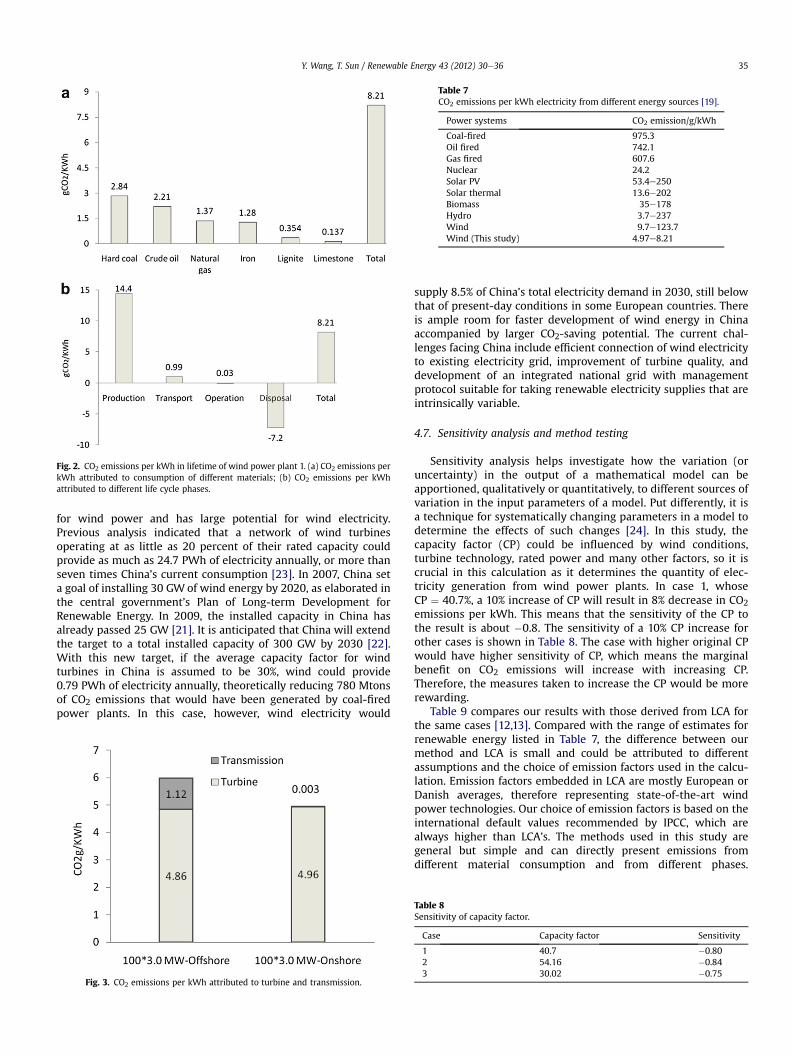
Table 7CO2 emissions per kWh electricity from different energy sources [19].
Power systems CO2 emission/g/kWh
Coal-fired 975.3Oil fired 742.1Gas fired 607.6Nuclear 24.2Solar PV 53.4e250Solar thermal 13.6e202Biomass 35e178Hydro 3.7e237Wind 9.7e123.7Wind (This study) 4.97e8.21
Fig. 2. CO2 emissions per kWh in lifetime of wind power plant 1. (a) CO2 emissions perkWh attributed to consumption of different materials; (b) CO2 emissions per kWhattributed to different life cycle phases.
Y. Wang, T. Sun / Renewable Energy 43 (2012) 30e36 35
for wind power and has large potential for wind electricity.Previous analysis indicated that a network of wind turbinesoperating at as little as 20 percent of their rated capacity couldprovide as much as 24.7 PWh of electricity annually, or more thanseven times China’s current consumption [23]. In 2007, China seta goal of installing 30 GW of wind energy by 2020, as elaborated inthe central government’s Plan of Long-term Development forRenewable Energy. In 2009, the installed capacity in China hasalready passed 25 GW [21]. It is anticipated that China will extendthe target to a total installed capacity of 300 GW by 2030 [22].With this new target, if the average capacity factor for windturbines in China is assumed to be 30%, wind could provide0.79 PWh of electricity annually, theoretically reducing 780 Mtonsof CO2 emissions that would have been generated by coal-firedpower plants. In this case, however, wind electricity would
Fig. 3. CO2 emissions per kWh attributed to turbine and transmission.
supply 8.5% of China’s total electricity demand in 2030, still belowthat of present-day conditions in some European countries. Thereis ample room for faster development of wind energy in Chinaaccompanied by larger CO2-saving potential. The current chal-lenges facing China include efficient connection of wind electricityto existing electricity grid, improvement of turbine quality, anddevelopment of an integrated national grid with managementprotocol suitable for taking renewable electricity supplies that areintrinsically variable.
4.7. Sensitivity analysis and method testing
Sensitivity analysis helps investigate how the variation (oruncertainty) in the output of a mathematical model can beapportioned, qualitatively or quantitatively, to different sources ofvariation in the input parameters of a model. Put differently, it isa technique for systematically changing parameters in a model todetermine the effects of such changes [24]. In this study, thecapacity factor (CP) could be influenced by wind conditions,turbine technology, rated power and many other factors, so it iscrucial in this calculation as it determines the quantity of elec-tricity generation from wind power plants. In case 1, whoseCP ¼ 40.7%, a 10% increase of CP will result in 8% decrease in CO2emissions per kWh. This means that the sensitivity of the CP tothe result is about �0.8. The sensitivity of a 10% CP increase forother cases is shown in Table 8. The case with higher original CPwould have higher sensitivity of CP, which means the marginalbenefit on CO2 emissions will increase with increasing CP.Therefore, the measures taken to increase the CP would be morerewarding.
Table 9 compares our results with those derived from LCA forthe same cases [12,13]. Compared with the range of estimates forrenewable energy listed in Table 7, the difference between ourmethod and LCA is small and could be attributed to differentassumptions and the choice of emission factors used in the calcu-lation. Emission factors embedded in LCA are mostly European orDanish averages, therefore representing state-of-the-art windpower technologies. Our choice of emission factors is based on theinternational default values recommended by IPCC, which arealways higher than LCA’s. The methods used in this study aregeneral but simple and can directly present emissions fromdifferent material consumption and from different phases.
Table 8Sensitivity of capacity factor.
Case Capacity factor Sensitivity
1 40.7 �0.802 54.16 �0.843 30.02 �0.75

Table 9Results of LCA and of this study.
Wind power plant LCA result fromVeatas g [CO2]/kWh
Result in thisstudy g [CO2]/kWh
Case 1186*1.65 MW Onshore 6.59 8.21Case 2100*3.0 MW Offshore 5.23 5.98Case 3100*3.0 MW Onshore 4.64 4.97
Y. Wang, T. Sun / Renewable Energy 43 (2012) 30e3636
Admittedly, the emission factors and results may vary case by case.However, the results could still give us useful information about theenvironmental impact of wind power plants.
5. Conclusions
This study developed a new simple and direct method forcalculating CO2 emissions per kWh electricity produced by windpower plants. The results obtained herein confirm that windenergy produces the lowest CO2 emissions per kWh of electricitycompared to fossil fuel and other renewable sources. Energy andmetallurgy dominate CO2 emissions from material consumption.Among the four phases of the wind power plant’s life cycle, theproduction phase of wind turbines contributes most to the totalemissions. Recycling during decommission is an important step,which theoretically can decrease the impact from the productionphase by nearly half. Optimal management in the transportphase could reduce overall CO2 emissions by as much as 12% ofthe total emissions of a power plant, even with recycling. Forcountries with large wind potential and large territories, a largeamount of CO2 emission could be saved in the transport phase.The result of a real case in China shows that with reasonableshorter transport routes, the related emissions could be reducedby 33%.
Compared with offshore wind plants, onshore ones have lowerCO2 emissions per kWh electricity produced. The difference in CO2emissions between wind turbines and wind power plants issignificant and should not be ignored when considering the CO2emissions related to offshore power plants.
If China can reach a total installed capacity of 300 GW in 2030 aspredicted, annual savings of CO2 emissions could amount to780Mtons. In this case, however, wind electricity would supply just8.5% of China’s total electricity demand in 2030, lower even thanpresent-day condition in Europe where wind electricity accountsfor 4.8% of the total energy consumption. There is ample room formore rapid development of wind energy in China accompanied bylarger CO2-saving potential. Compared with other energy sources,wind power has the greatest potential to reduce CO2 emissions,especially through onshore, large rated power turbines that havelow emission per functional unit. Sensitivity tests show that themeasures taken to increase the CP would result in significantemissions reductions. Obviously, the use of wind to produce
electricity constitutes an environmental improvement, and moreresearch on this technology is needed.
Acknowledgments
This researchwas supported by the National Science Foundationof China (grant No. 41005060) and Tsinghua University InitiativeScientific Research Program. The authors thank Y. Wu for helpfuldiscussion and P. Barnes for edits.
References
[1] Martinez E, Sanz F, Pellegrini S, Jimenez E, Blanco J. Life cycle assessment ofa multi-megawatt wind turbine. Renew Energy 2009;34:667e73.
[2] Global Wind Energy Council. Global wind 2009 report, 2010.3.[3] Global Wind Energy Council. Global wind 2008 report.[4] World Wind Energy Association. World wind energy report 2009; February
2010. Retrieved in Mar 13, 2010.[5] http://www.cnwpem.com/news/6165.html, (in Chinese), 2010. 11.[6] ChinaElectricity Council. TheNational Electric Power Industry statistics of 2009,
http://www.cec.org.cn/html/deptnews/2010/7/16/20107161439168390.html;2010. read Nov 25.
[7] Tremeac Brice, Meunier Francis. Life cycle analysis of 4.5MW and 250W windturbines. Renew Sust Energ Rev 2009;13:2104e10.
[8] Martínez Eduardo, Sanz Félix, Pellegrini Stefano, Jiménez Emilio, Blanco Julio.Life-cycle assessment of a 2-MW rated power wind turbine: CML method. Int JLife Cycle Assess 2009;14:52e63. doi:10.1007/s11367-008-0033-9.
[9] Nomura Noboru, Inaba Atsushi, Tonooka Yutaka, Akai Makoto. Life-cycleemission of oxidic gases from power-generation systems. Appl Energ 2001;68:215e27.
[10] Hondo Hiroki. Life cycle GHG emission analysis of power generation systems:Japanese case. Energy 2005;30:2042e56.
[11] IPCC guidelines for national greenhouse gas inventories; 2006.[12] Vestas Wind Systems A/S. Life cycle assessment of electricity produced from
onshore sited wind power plants based on Vestas V82-1.65 MW turbines;2006. 12.
[13] Vestas Wind Systems A/S. Life cycle assessment of offshore and onshore sitedwind power plants based date: on Vestas V90e3.0 MW turbines; 2006. 6.
[14] http://www.vestas.cn/about-vestas/results/resultse-turbine-by-turbine.aspx,(in Chinese), read Nov 25, 2010.
[15] Zhenwei Liu. The building of V52-850kW wind turbine, China Power con-truction company. [in Chinese].
[16] http://www.86wind.com/html/news/2007-12/info-7780-993.htm (in Chinese),read Nov 25, 2010.
[17] Schleisne L. Life cycle assessment of a wind power plant and related exter-nalities. Renew Energ 2000;20:279e88.
[18] Lenzena Manfred, Munksgaardb Jesper. Energy and CO2 life-cycle analysesof wind turbinesdreview and applications. Renew Energ 2002;26:339e62.
[19] Varun, Bhat IK, Prakash Ravi. LCA of renewable energy for electricity gener-ation systemsda review. Renew Sust Energ Rev 2009;13:1067e73.
[20] Niels Jungbluth, Christian Bauer, Roberto Dones and Rolf Frischknecht. Life cycleassessment for emerging technologies: case studies for photovoltaic and windpower, energ supply. DOI:%20http://dx.doi.org/10.1065/lca2004.11.181.3.
[21] National Development and Reform Commission of China. Plan of long-termdevelopment for renewable energy (NDRC, Beijing, 2007, http://www.ndrc.gov.cn/zcfb/jd/2007/t20070905_157436.htm; 2010 (in Chinese) 11.
[22] http://www.qstheory.cn/kj/kj/201007/t20100713_39266.htm, (in Chinese),read Nov 25, 2010.
[23] McElroy Michael B, Lu Xi, Nielsen Chris P, Wang Yuxuan. Potential for wind-generated electricity in China. Science 2009;325:1378e80.
[24] Wikipedia, http://en.wikipedia.org/wiki/Sensitivity_analysis, read Nov 25,2010.