lies, damned lies & vanity metrics
Post on 19-Oct-2014
2.551 views
DESCRIPTION
The slides on a session which I conducted to the startup teams in the technology startup incubator JFDI.Asia. The session which I conducted are broken into 4 parts: managing user growth, vanity and growth metrics, funnelling and usability testing.TRANSCRIPT

Lies, Damned Lies &Vanity Metrics
Bernard Leong
A Simple Guide to Feedback, Analytics & Iteration in Product Development
1

“There are three kinds of lies: lies, damned lies & statistics.”
- Mark Twain
2
A good theoretical physicist is one who makes all the mistakes as quickly as possible.
entrepreneur
3
4

Feedback Generation• How do we collect and generate user feedback?
• Qualitative: Surveys, Talk to customers, Create channels via social media (twitter/facebook).
• Quantitative: Google Analytics, Mixpanel metrics.
• User interface & experience testing: User education and perception of how product works.
5

• Qualitative - Break it into the following buckets:
• Spam/Troll & Insults - Ignore
• “Blue Sky” or “N=1” comments in the form of “you should build this or that” - Think about it but don’t act
• “N>50” comments on a feature or users demanding for a feature - Ascertain whether people really want it and then act.
Feedback Maintenance
Obviously, you need to find metrics to do that ...
6
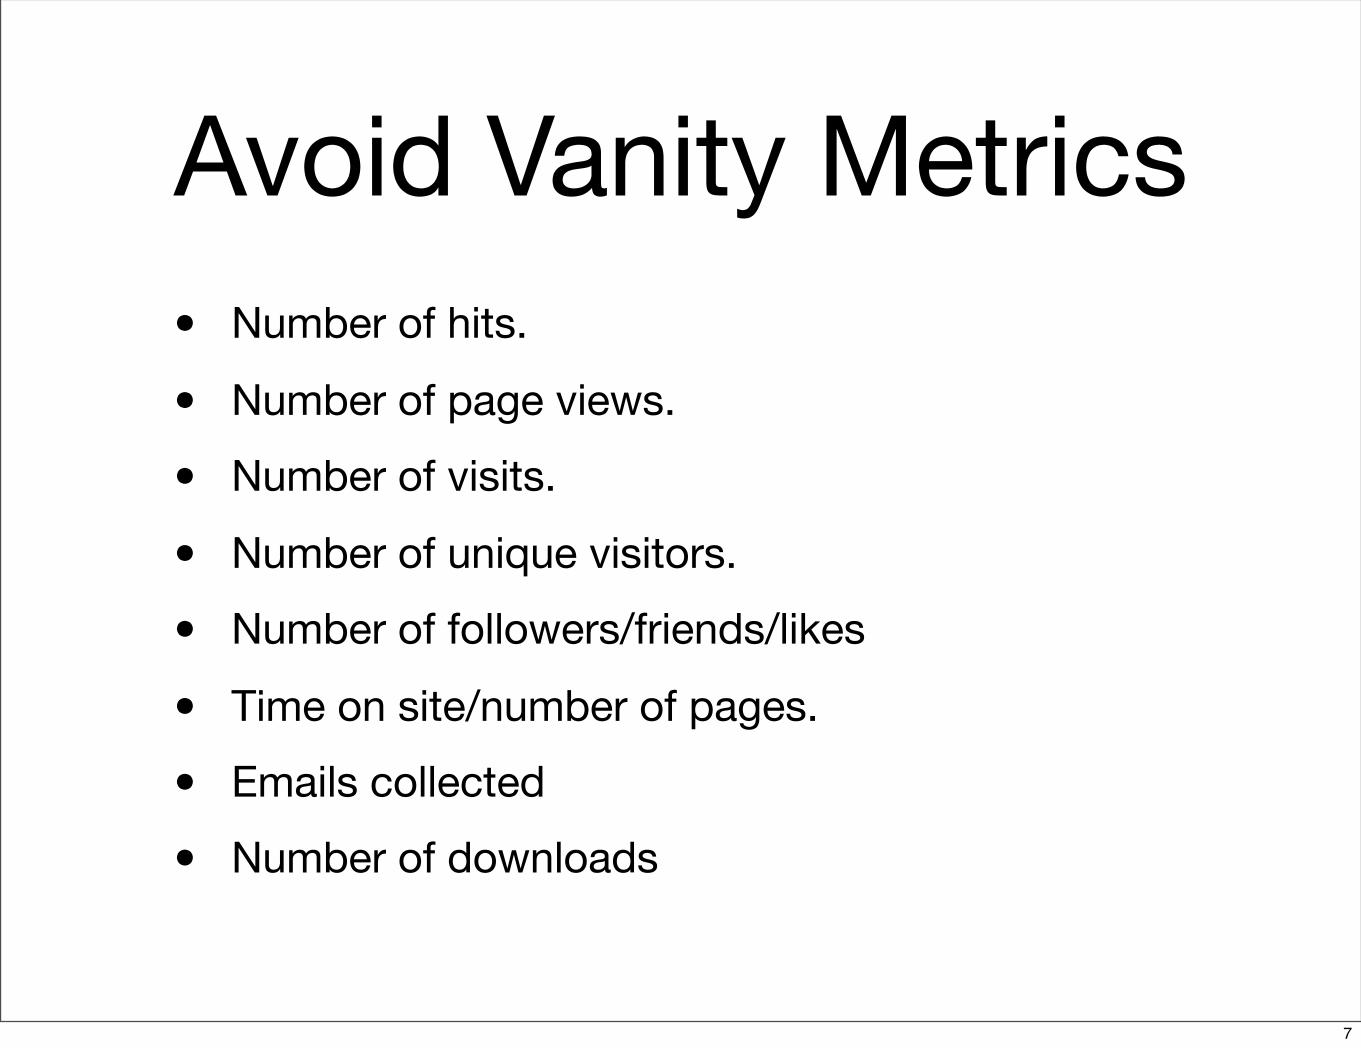
Avoid Vanity Metrics• Number of hits.
• Number of page views.
• Number of visits.
• Number of unique visitors.
• Number of followers/friends/likes
• Time on site/number of pages.
• Emails collected
• Number of downloads
7

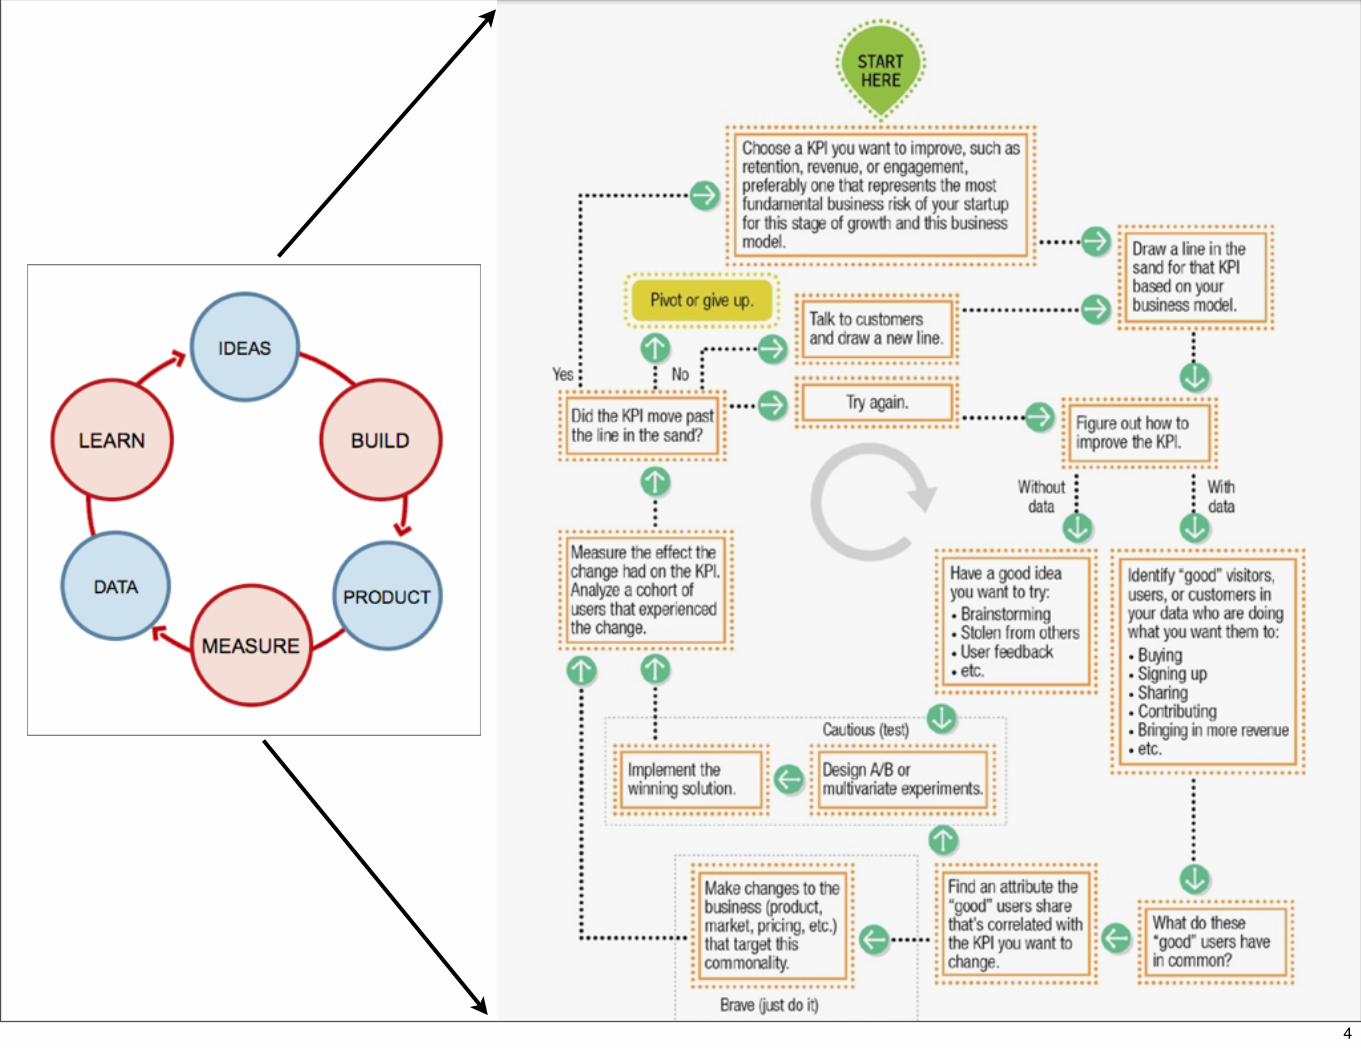
Framework for User Growth
8
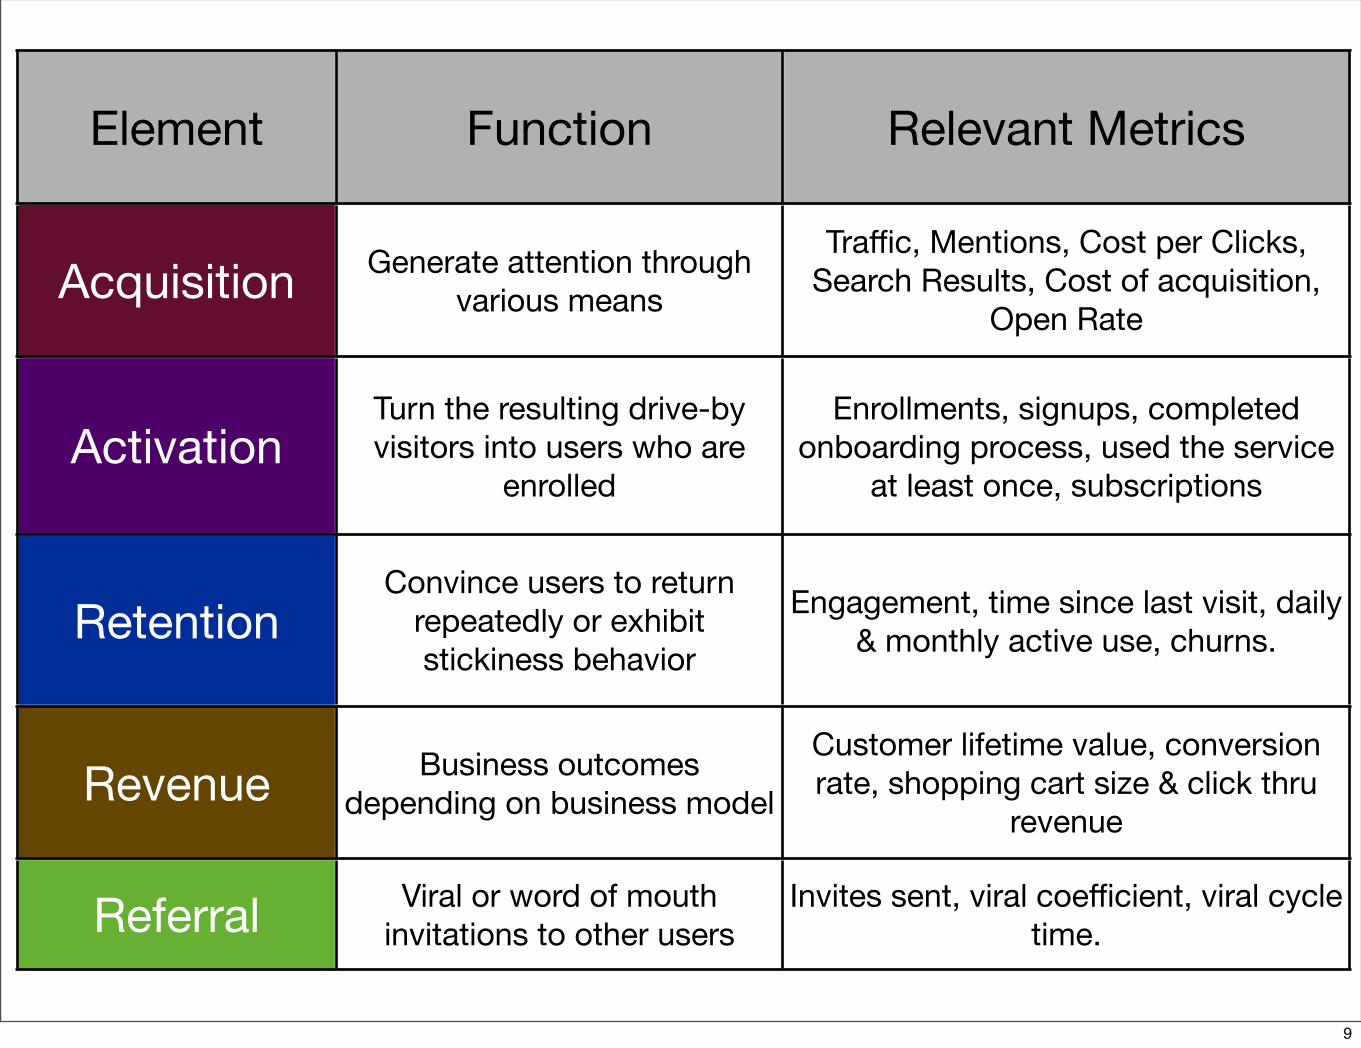
Element Function Relevant Metrics
Acquisition Generate attention through various means
Traffic, Mentions, Cost per Clicks, Search Results, Cost of acquisition,
Open Rate
ActivationTurn the resulting drive-by visitors into users who are
enrolled
Enrollments, signups, completed onboarding process, used the service
at least once, subscriptions
RetentionConvince users to return
repeatedly or exhibit stickiness behavior
Engagement, time since last visit, daily & monthly active use, churns.
Revenue Business outcomes depending on business model
Customer lifetime value, conversion rate, shopping cart size & click thru
revenue
Referral Viral or word of mouth invitations to other users
Invites sent, viral coefficient, viral cycle time.
9
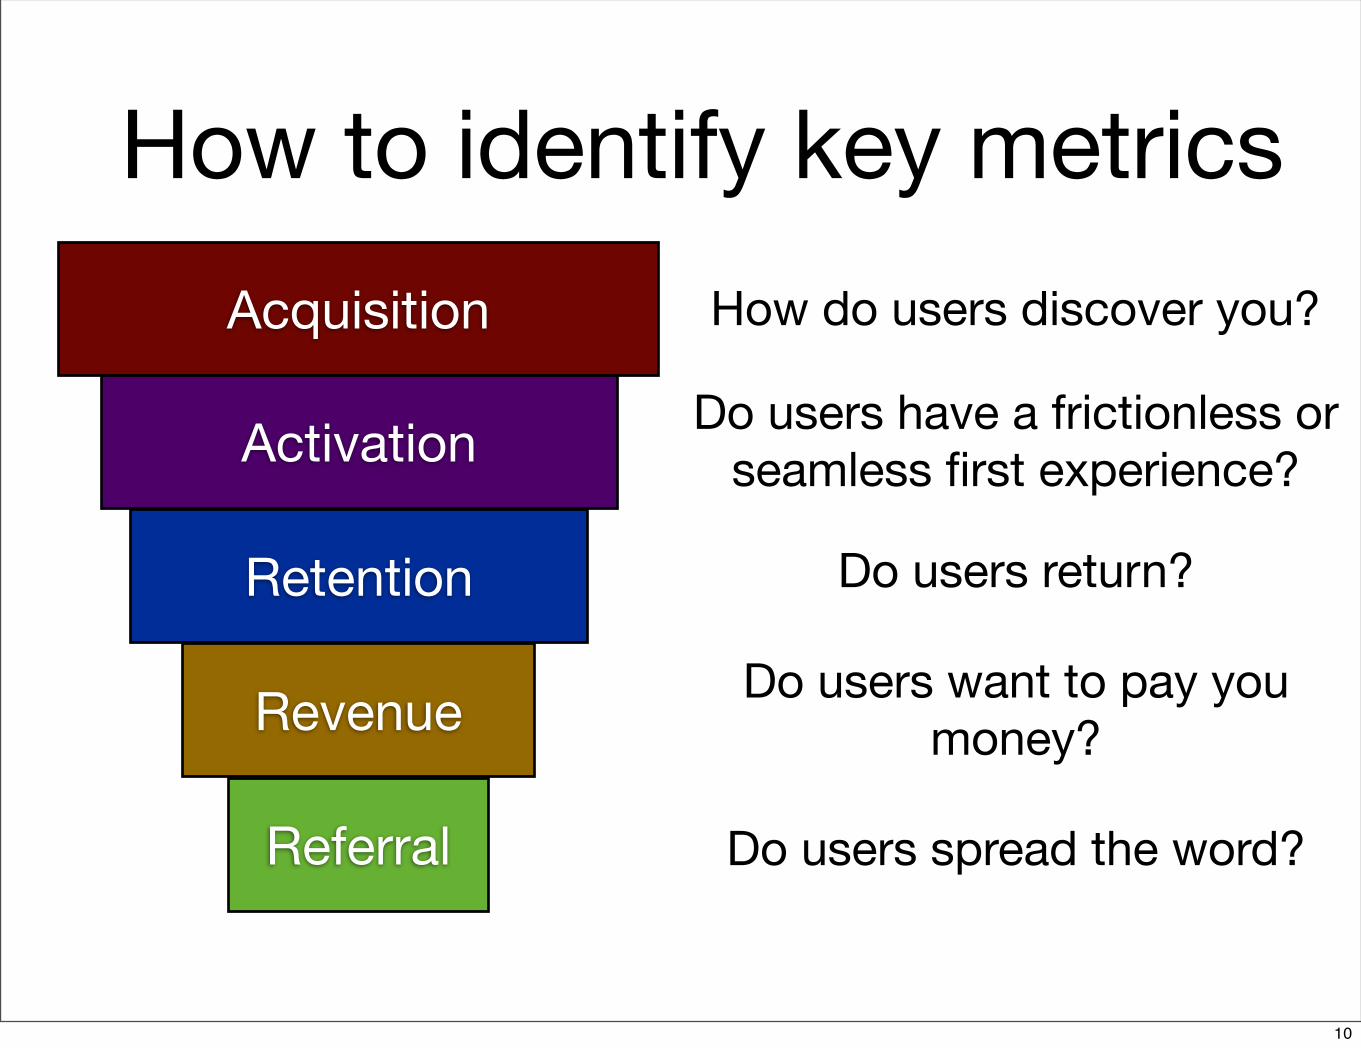
How to identify key metricsAcquisition
Activation
Retention
Revenue
Referral
How do users discover you?
Do users have a frictionless or seamless first experience?
Do users return?
Do users want to pay you money?
Do users spread the word?
10

Constructing a FunnelInternet Marketing - Google Ads
200K impressions = 20K click thrus (10%)
User Signups20K click thrus = 2K signups (10%)
User create activity2K signups = 200 users return
with 5 actions (10%)
User pay for premium service = 20 users
Users send invites to other users = 2 users
How do users discover you?
Do users have a frictionless or seamless first experience?
Do users return?
Do users want to pay you money?
Do users spread the word?
11
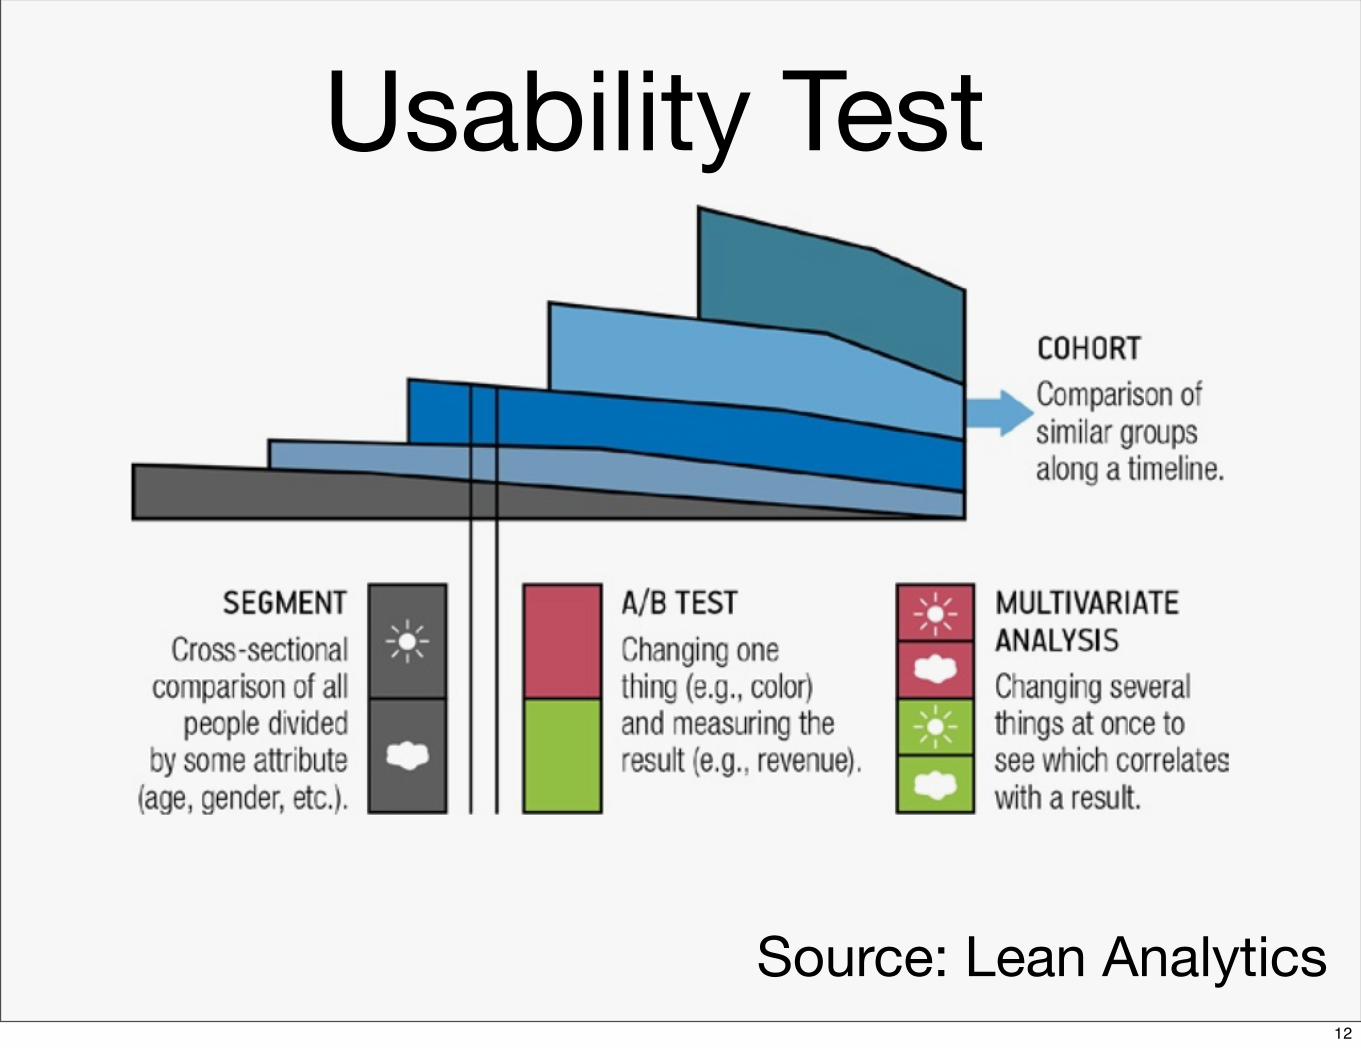
Source: Lean Analytics
Usability Test
12
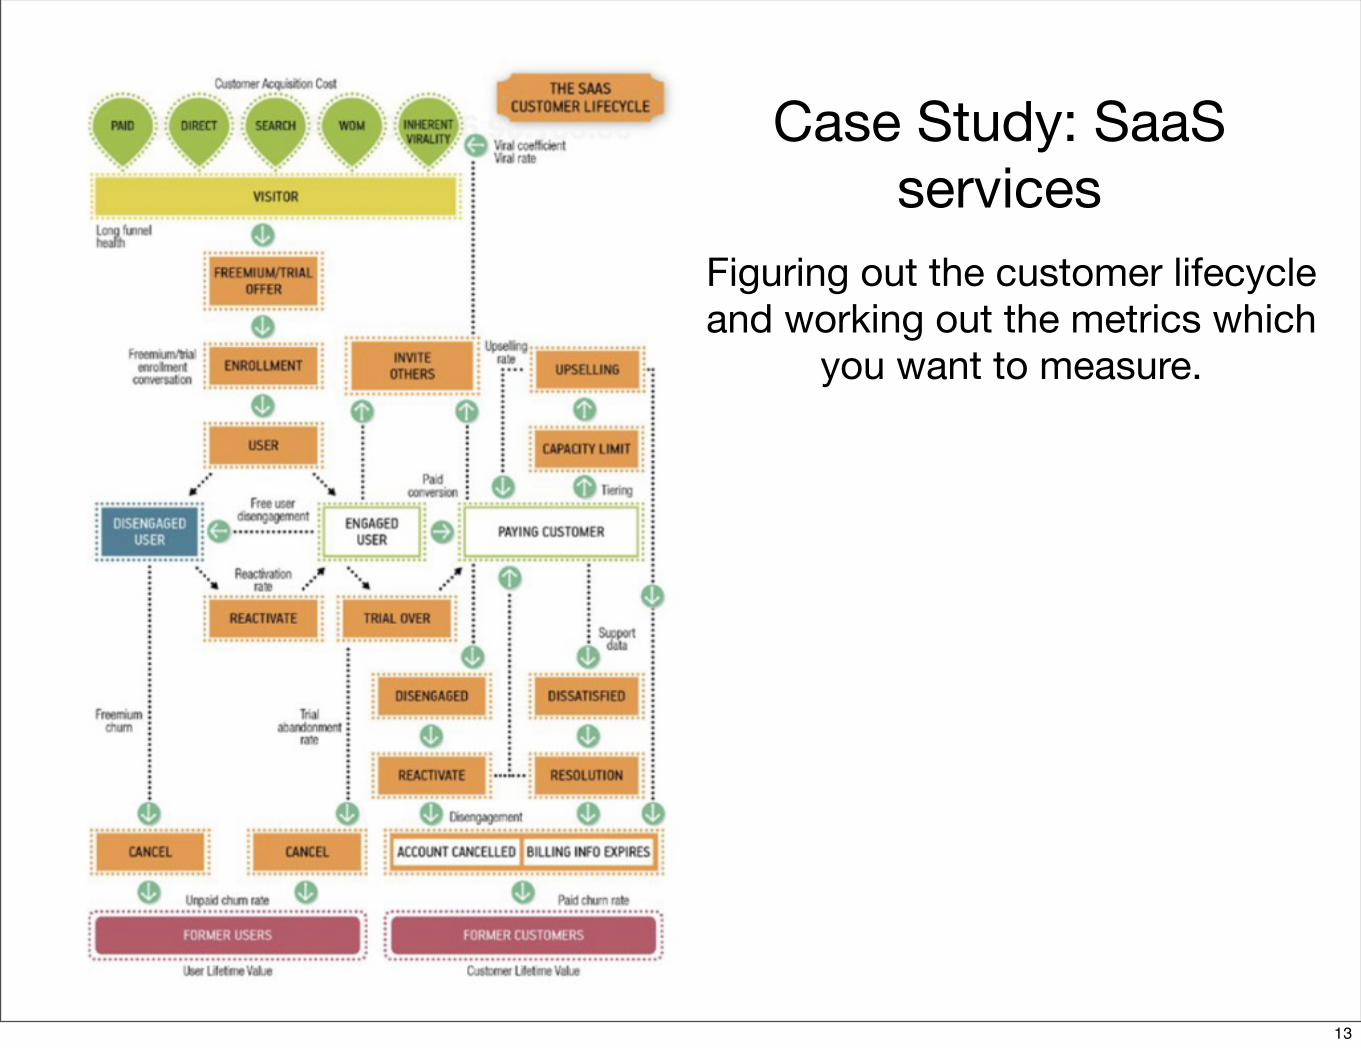
Figuring out the customer lifecycle and working out the metrics which
you want to measure.
Case Study: SaaS services
13

References• Alistair Croll & Benjamin Yoskovitz, “Lean
Analytics”
• Jon Yongfook, “21 Actionable Growth Hacking Tactics”, http://yongfook.com/actionable-growth-hacking-tactics.html
• Ash Maurya: 3 Rules to actionable metrics in a lean startup: http://www.ashmaurya.com/2010/07/3-rules-to-actionable-metrics/
14