lidar atmospheric measurements on mars and earth
TRANSCRIPT
Planetary and Space Science 59 (2011) 942–951
Contents lists available at ScienceDirect
Planetary and Space Science
0032-06
doi:10.1
n Corr
fax: +0
E-m
journal homepage: www.elsevier.com/locate/pss
Lidar atmospheric measurements on Mars and Earth
C. Dickinson a, L. Komguem a, J.A. Whiteway a,n, M. Illnicki a, V. Popovici a, W. Junkermann b,P. Connolly c, J. Hacker d
a Centre for Research in Earth and Space Science, York University, Toronto, ON, Canada M3J 1P3b Institut fur Meteorologie und Klimaforschung, Forschungszentrum Karlsruhe GmbH, Germanyc School of Earth, Atmospheric and Environmental Sciences, University of Manchester, UKd Flinders University and Airborne Research Australia, Adelaide 5001, South Australia, Australia
a r t i c l e i n f o
Article history:
Received 14 November 2009
Received in revised form
18 February 2010
Accepted 6 March 2010Available online 18 March 2010
Keywords:
Mars
Phoenix
Lidar
Dust
Aeolian
Cirrus
33/$ - see front matter & 2010 Elsevier Ltd. A
016/j.pss.2010.03.004
esponding Author. Tel.: +001 416 736 2100x
01 416 736 5817.
ail address: [email protected] (J.A. Whitew
a b s t r a c t
The LIDAR instrument operating from the surface of Mars on the Phoenix Mission measured vertical
profiles of atmospheric dust and water ice clouds at temperatures around �65 1C. An equivalent lidar
system was utilized for measurements in the atmosphere of Earth where dust and cloud conditions are
similar to Mars. Coordinated aircraft in situ sampling provided a verification of lidar measurement and
analysis methods and also insight for interpretation of lidar derived optical parameters in terms of the
dust and cloud microphysical properties. It was found that the vertical distribution of airborne dust
above the Australian desert is quite similar to what is observed in the planetary boundary layer above
Mars. Comparison with the in situ sampling is used to demonstrate how the lidar derived optical
extinction coefficient is related to the dust particle size distribution. The lidar measurement placed a
constraint on the model size distribution that has been used for Mars. Airborne lidar measurements
were also conducted to study cirrus clouds that form in the Earth’s atmosphere at a similar temperature
and humidity as the clouds observed with the lidar on Mars. Comparison with the in situ sampling
provides a method to derive the cloud ice water content (IWC) from the Mars lidar measurements.
& 2010 Elsevier Ltd. All rights reserved.
1. Introduction
While the atmospheres of Earth and Mars are significantlydifferent in terms of their molecular composition, several analogiescan be made for dust and cloud particles. Dust is lifted intothe atmosphere of Mars as in desert regions on Earth, but since themolecular density on Mars is smaller, the radiative impact of dust ismuch greater (Wolff et al., 2009). Also, there is a hydrological cycleon Mars that involves clouds and precipitation that form where thetemperature and saturated water vapour partial pressure are similarto the conditions in which cirrus clouds form in the uppertroposphere on Earth (Whiteway et al., 2009). As the saturatedpartial pressure of water is dependent on temperature only, thewater vapour density under saturated conditions (e.g. within acloud) is the same on Earth and Mars for a given temperature.
The Phoenix Mars mission (Smith et al., 2008, 2009) landed on25 May 2008, 30 Sols (Martian days) before summer solstice at681N, 2341E. The Lander was operated over the following fivemonths, imaging the surroundings (Smith et al., 2009), digginginto the regolith (Shaw et al., 2009), analyzing composition of soilsamples (Hecht et al., 2009; Boynton et al., 2009; Kounaves et al.,
ll rights reserved.
22310;
ay).
2010), and measuring atmospheric properties (Taylor et al., 2009;Davy et al., 2010; Tamppari et al., 2010). The lidar instrument onPhoenix (Whiteway et al., 2008) was operated nearly every dayduring the mission to observe the backscatter of laser radiationfrom dust, water ice clouds and precipitation in the atmosphere(Whiteway et al., 2009).
The testing and characterization of the Phoenix lidar involvedEarth based measurements and direct comparison with anequivalent lidar system that employed the same wavelengths,telescope size, detectors, data acquisition methods, and a similarlaser power (Whiteway et al., 2008). A second component ofcharacterization was to acquire field measurements in conditionswith aerosol optical properties similar to those expected for Mars.This paper presents case studies where the interpretation ofobservations on Mars is informed by measurements in theatmosphere of Earth. Airborne measurement campaigns aboveSouth Australia were conducted to characterize the lidar forstudies of desert dust and ice crystal clouds. The insight gainedfrom simultaneous aircraft in situ sampling on Earth is applied forinterpretation of the lidar measurements on Mars.
2. Mars phoenix lidar
The lidar measurement involved emitting a pulse of light intothe atmosphere and detecting the light scattered directly back.
C. Dickinson et al. / Planetary and Space Science 59 (2011) 942–951 943
For earth, the light will be scattered by both molecularconstituents and aerosols (dust and ice/water cloud); for Mars,scattering from dust and water ice cloud particles dominate thelidar backscatter signal. The Phoenix lidar is based on a Nd:YAGlaser and the frequency doubled output at a wavelength of532 nm is directed in the zenith. The backscatter is collected by a10 cm diameter telescope, detected with a photomultiplier, andthe signal is acquired using both analog recording and photoncounting. The height resolution after averaging was 20 m foranalog recording and 50 m for photon counting. The laser waspulsed at a rate of 100 Hz, while the acquired profiles wereaveraged over 2048 pulses for a temporal resolution of 20.48 s.The Phoenix lidar was operated typically three times per day withduration between 15 min and 1 h.
Owing to the greater dynamic range of the analog signals, andthe greater sensitivity of the photon counting signals, the choiceof whether to use one or both data sets depended on themeasured signal strength, or more generally, the proximity of thescatterers to the lidar system. For Phoenix, analog signals below2.5 km and photon counting data from 2.5–20 km were generallyused for analysis. Lidar dust measurements from Australia werebased entirely on data from the analog channel, while lidar cloudmeasurements employed only photon counting.
3. Lidar analysis method
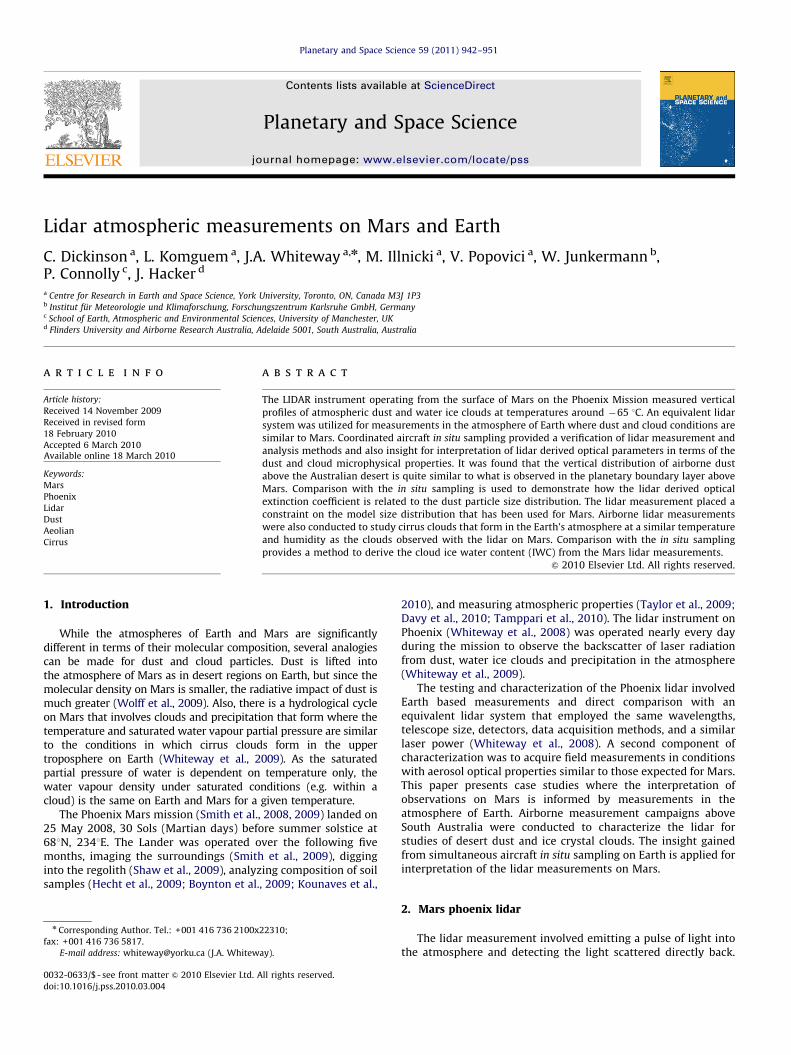
Fig. 1a shows the backscatter signal from Phoenix mission Sol 65(Solar Longitude, Ls¼1061). The signal is from only dust below 8 km,the enhancement above is due to the presence of an ice water cloud.The equation that describes a Lidar backscatter signal as a functionof height can be written as S(z)¼Cß(z)1/z2T(z)2. The calibrationconstant C takes into account factors that include the laser pulseenergy, area of the receiver aperture, transmittance of the receiveroptics, and the detection efficiency. ß(z) is the lidar backscattercoefficient and this represents the fraction of optical energy
Fig. 1. (a) Lidar backscatter signal recorded with Analog (mV) and Photon Counting
coefficient profile for Sol 65 using a lidar ratio of 40. The Analog signal was employe
uncertainty is provided for the extinction coefficient.
scattered back to the lidar receiver per unit length and per unitsolid angle. T(z) is the transmittance through the atmosphere, and isrelated to the optical depth (OD) as T(z)¼e�OD where OD¼
R0zs dz.
The extinction coefficient, s, is the fractional reduction in laser pulseenergy per unit length through the atmosphere, and can also beconsidered the effective cross sectional area of scattering materialper unit volume. A correction was applied at heights below 1 km, toaccount for the incomplete overlap of the telescope field of view andtransmitted laser beam (Whiteway et al., 2010).
The backscatter and extinction coefficients, ß and s, relate tothe properties of material in the atmosphere. These were derivedfor dust and clouds from the lidar backscatter signal using themethod of Fernald (1984), where the inversion requires areference value at some height, and does not require knowledgeof the calibration constant, C. For Mars this reference wasobtained by using a value at 2 km that results in a total opticaldepth from ground to 20 km being matched to the independentmeasurement made by the Surface Stereo Imager (SSI) instrument(Smith et al., 2008) on Phoenix. For profiles where the presence ofice-water clouds was detected, a background dust profile was firstestimated (typically from an adjacent sol), and it was thenassumed that any departure from this baseline was the result ofclouds. For Australian dust data, signals owing to the molecularatmosphere, calculated from nearby radiosonde data, were firstsubtracted from the profiles. This allowed the same method to beemployed as for Phoenix dust, with Aerosol optical depthsmeasured by a CIMEL sun photometer (Qin and Mitchell, 2009)constraining the results. For the cloud data, collected during theEgrett Microphysics Experiment with Radiation, Lidar, andDynamics (EMERALD), the reference value was taken below thecloud in the essentially pure molecular atmosphere (with valuesof ß and s calculated from nearby radiosonde data). The inversionalso required an assumption on the ratio of extinction tobackscatter coefficients (the so called lidar ratio) and values thatare typical from earth based measurements were used: 40 fordust (Papayannis et al., 2008), and 15 for cloud (Chen et al., 2002).
(MHz) on Sol 65, 07:11 Local True Solar Time (Ls¼1061). (b) Derived extinction
d from ground to 2.5 km, and Photon Counting signal from 2.5–20 km. Relative
C. Dickinson et al. / Planetary and Space Science 59 (2011) 942–951944
Fig. 1b shows the vertical profile of extinction coefficient thatwas derived from the signal in Fig. 1a. A layer of enhanced dustloading was distributed from the surface up to heights belowabout 4 km. This is due to the dust that is lifted from the surfaceand mixed throughout the planetary boundary layer (PBL) byconvection and turbulence during daytime. The top of the dustlayer corresponds to the top of the PBL. A water ice cloud iscausing enhanced extinction above 8 km in this case.
4. Boundary layer dust
The Phoenix equivalent lidar (Whiteway et al., 2008) was usedfor studies of the atmosphere of Earth, emitting the same
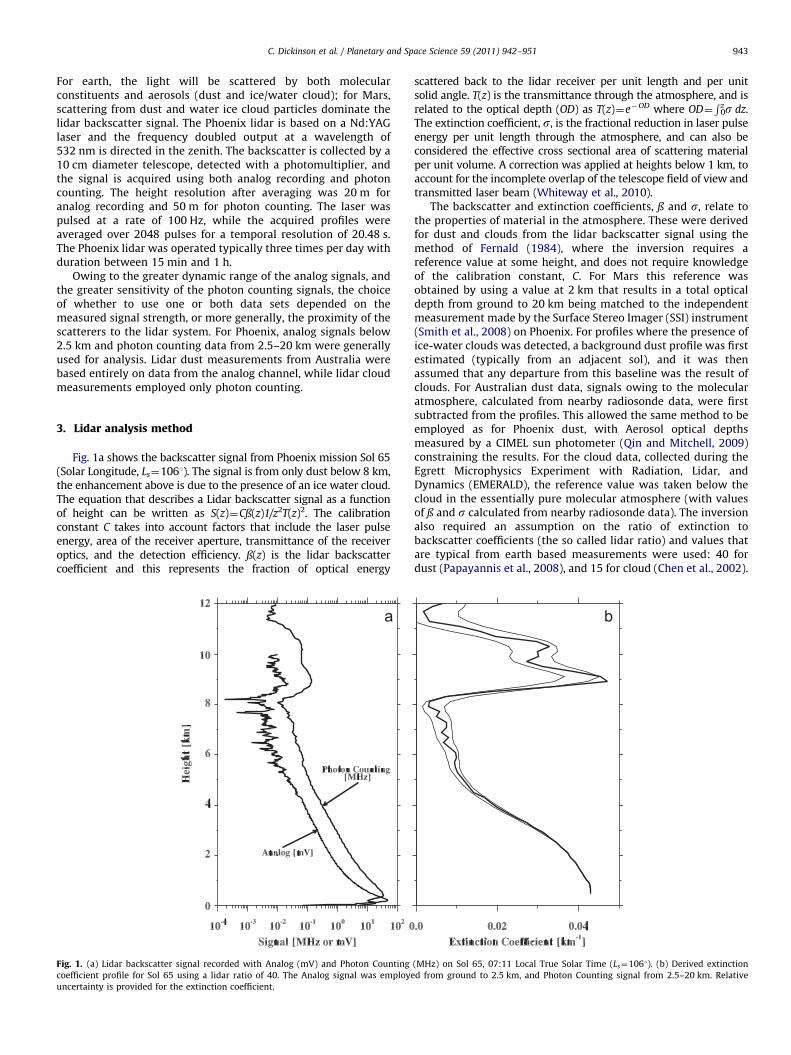
Fig. 2. Lidar extinction coefficient profiles for Mars Sols 14, 48, 97 (solid) and at
Muloorina Australia on Nov 20th 05:00 GMT (dashed). The solar longitudes of
Mars on these dates were Ls¼841, 991, and 1221.
22:00 03:00Time (GM
0
1
2
3
4
5
6
Hei
ght [
km]
12:00
Time (Loc
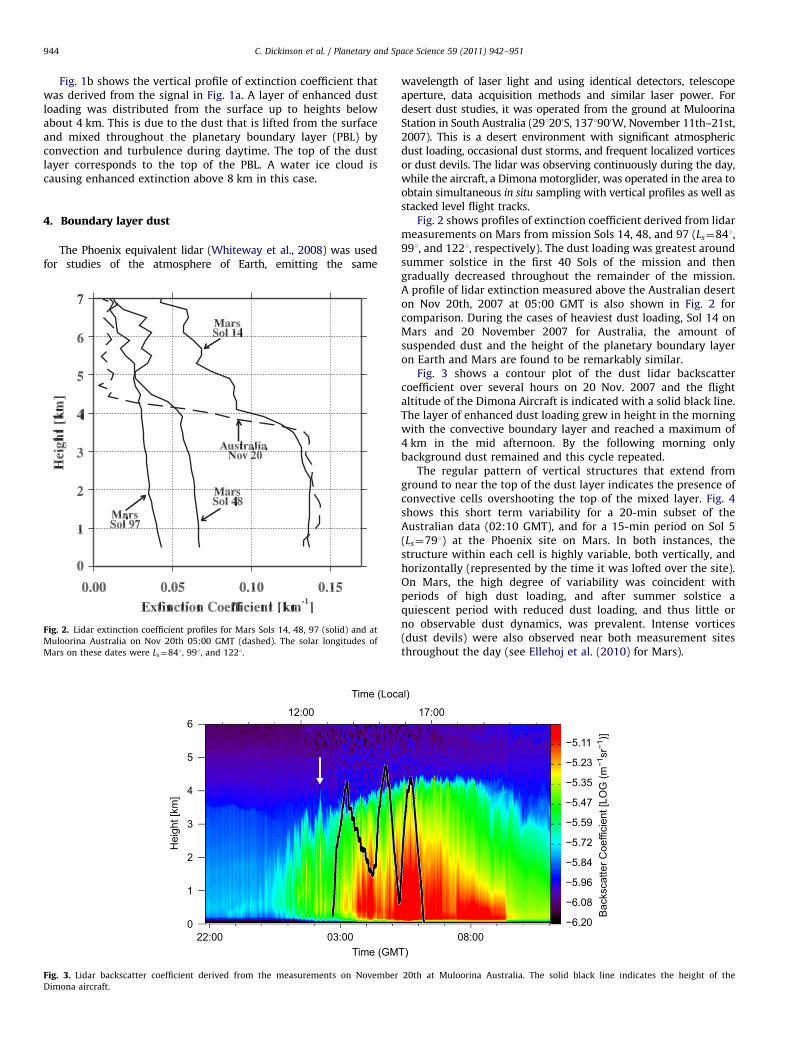
Fig. 3. Lidar backscatter coefficient derived from the measurements on November
Dimona aircraft.
wavelength of laser light and using identical detectors, telescopeaperture, data acquisition methods and similar laser power. Fordesert dust studies, it was operated from the ground at MuloorinaStation in South Australia (291200S, 1371900W, November 11th–21st,2007). This is a desert environment with significant atmosphericdust loading, occasional dust storms, and frequent localized vorticesor dust devils. The lidar was observing continuously during the day,while the aircraft, a Dimona motorglider, was operated in the area toobtain simultaneous in situ sampling with vertical profiles as well asstacked level flight tracks.
Fig. 2 shows profiles of extinction coefficient derived from lidarmeasurements on Mars from mission Sols 14, 48, and 97 (Ls¼841,991, and 1221, respectively). The dust loading was greatest aroundsummer solstice in the first 40 Sols of the mission and thengradually decreased throughout the remainder of the mission.A profile of lidar extinction measured above the Australian deserton Nov 20th, 2007 at 05:00 GMT is also shown in Fig. 2 forcomparison. During the cases of heaviest dust loading, Sol 14 onMars and 20 November 2007 for Australia, the amount ofsuspended dust and the height of the planetary boundary layeron Earth and Mars are found to be remarkably similar.
Fig. 3 shows a contour plot of the dust lidar backscattercoefficient over several hours on 20 Nov. 2007 and the flightaltitude of the Dimona Aircraft is indicated with a solid black line.The layer of enhanced dust loading grew in height in the morningwith the convective boundary layer and reached a maximum of4 km in the mid afternoon. By the following morning onlybackground dust remained and this cycle repeated.
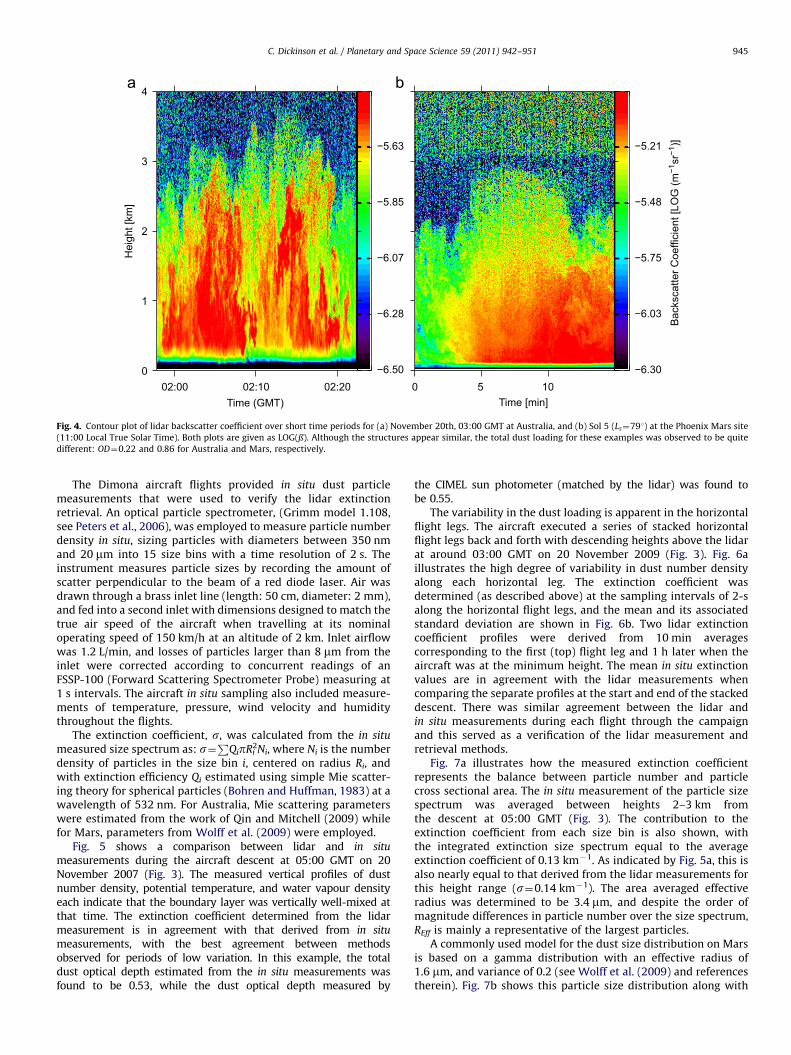
The regular pattern of vertical structures that extend fromground to near the top of the dust layer indicates the presence ofconvective cells overshooting the top of the mixed layer. Fig. 4shows this short term variability for a 20-min subset of theAustralian data (02:10 GMT), and for a 15-min period on Sol 5(Ls¼791) at the Phoenix site on Mars. In both instances, thestructure within each cell is highly variable, both vertically, andhorizontally (represented by the time it was lofted over the site).On Mars, the high degree of variability was coincident withperiods of high dust loading, and after summer solstice aquiescent period with reduced dust loading, and thus little orno observable dust dynamics, was prevalent. Intense vortices(dust devils) were also observed near both measurement sitesthroughout the day (see Ellehoj et al. (2010) for Mars).
08:00T)
17:00
−6.20
−6.08
−5.96
−5.84
−5.72
−5.59
−5.47
−5.35
−5.23
−5.11
Bac
ksca
tter C
oeffi
cien
t [LO
G (m
−1sr
−1)]
al)
20th at Muloorina Australia. The solid black line indicates the height of the
02:00 02:10 02:20Time (GMT)
0
1
2
3
4
Hei
ght [
km]
−6.50
−6.28
−6.07
−5.85
−5.63
0 5 10
Bac
ksca
tter C
oeffi
cien
t [LO
G (m
−1sr
−1)]
−6.30
−6.03
−5.75
−5.48
−5.21
Time [min]
Fig. 4. Contour plot of lidar backscatter coefficient over short time periods for (a) November 20th, 03:00 GMT at Australia, and (b) Sol 5 (Ls¼791) at the Phoenix Mars site
(11:00 Local True Solar Time). Both plots are given as LOG(ß). Although the structures appear similar, the total dust loading for these examples was observed to be quite
different: OD¼0.22 and 0.86 for Australia and Mars, respectively.
C. Dickinson et al. / Planetary and Space Science 59 (2011) 942–951 945
The Dimona aircraft flights provided in situ dust particlemeasurements that were used to verify the lidar extinctionretrieval. An optical particle spectrometer, (Grimm model 1.108,see Peters et al., 2006), was employed to measure particle numberdensity in situ, sizing particles with diameters between 350 nmand 20 mm into 15 size bins with a time resolution of 2 s. Theinstrument measures particle sizes by recording the amount ofscatter perpendicular to the beam of a red diode laser. Air wasdrawn through a brass inlet line (length: 50 cm, diameter: 2 mm),and fed into a second inlet with dimensions designed to match thetrue air speed of the aircraft when travelling at its nominaloperating speed of 150 km/h at an altitude of 2 km. Inlet airflowwas 1.2 L/min, and losses of particles larger than 8 mm from theinlet were corrected according to concurrent readings of anFSSP-100 (Forward Scattering Spectrometer Probe) measuring at1 s intervals. The aircraft in situ sampling also included measure-ments of temperature, pressure, wind velocity and humiditythroughout the flights.
The extinction coefficient, s, was calculated from the in situ
measured size spectrum as: s¼P
QipRi2Ni, where Ni is the number
density of particles in the size bin i, centered on radius Ri, andwith extinction efficiency Qi estimated using simple Mie scatter-ing theory for spherical particles (Bohren and Huffman, 1983) at awavelength of 532 nm. For Australia, Mie scattering parameterswere estimated from the work of Qin and Mitchell (2009) whilefor Mars, parameters from Wolff et al. (2009) were employed.
Fig. 5 shows a comparison between lidar and in situ
measurements during the aircraft descent at 05:00 GMT on 20November 2007 (Fig. 3). The measured vertical profiles of dustnumber density, potential temperature, and water vapour densityeach indicate that the boundary layer was vertically well-mixed atthat time. The extinction coefficient determined from the lidarmeasurement is in agreement with that derived from in situ
measurements, with the best agreement between methodsobserved for periods of low variation. In this example, the totaldust optical depth estimated from the in situ measurements wasfound to be 0.53, while the dust optical depth measured by
the CIMEL sun photometer (matched by the lidar) was found tobe 0.55.
The variability in the dust loading is apparent in the horizontalflight legs. The aircraft executed a series of stacked horizontalflight legs back and forth with descending heights above the lidarat around 03:00 GMT on 20 November 2009 (Fig. 3). Fig. 6aillustrates the high degree of variability in dust number densityalong each horizontal leg. The extinction coefficient wasdetermined (as described above) at the sampling intervals of 2-salong the horizontal flight legs, and the mean and its associatedstandard deviation are shown in Fig. 6b. Two lidar extinctioncoefficient profiles were derived from 10 min averagescorresponding to the first (top) flight leg and 1 h later when theaircraft was at the minimum height. The mean in situ extinctionvalues are in agreement with the lidar measurements whencomparing the separate profiles at the start and end of the stackeddescent. There was similar agreement between the lidar andin situ measurements during each flight through the campaignand this served as a verification of the lidar measurement andretrieval methods.
Fig. 7a illustrates how the measured extinction coefficientrepresents the balance between particle number and particlecross sectional area. The in situ measurement of the particle sizespectrum was averaged between heights 2–3 km fromthe descent at 05:00 GMT (Fig. 3). The contribution to theextinction coefficient from each size bin is also shown, withthe integrated extinction size spectrum equal to the averageextinction coefficient of 0.13 km�1. As indicated by Fig. 5a, this isalso nearly equal to that derived from the lidar measurements forthis height range (s¼0.14 km�1). The area averaged effectiveradius was determined to be 3.4 mm, and despite the order ofmagnitude differences in particle number over the size spectrum,REff is mainly a representative of the largest particles.
A commonly used model for the dust size distribution on Marsis based on a gamma distribution with an effective radius of1.6 mm, and variance of 0.2 (see Wolff et al. (2009) and referencestherein). Fig. 7b shows this particle size distribution along with
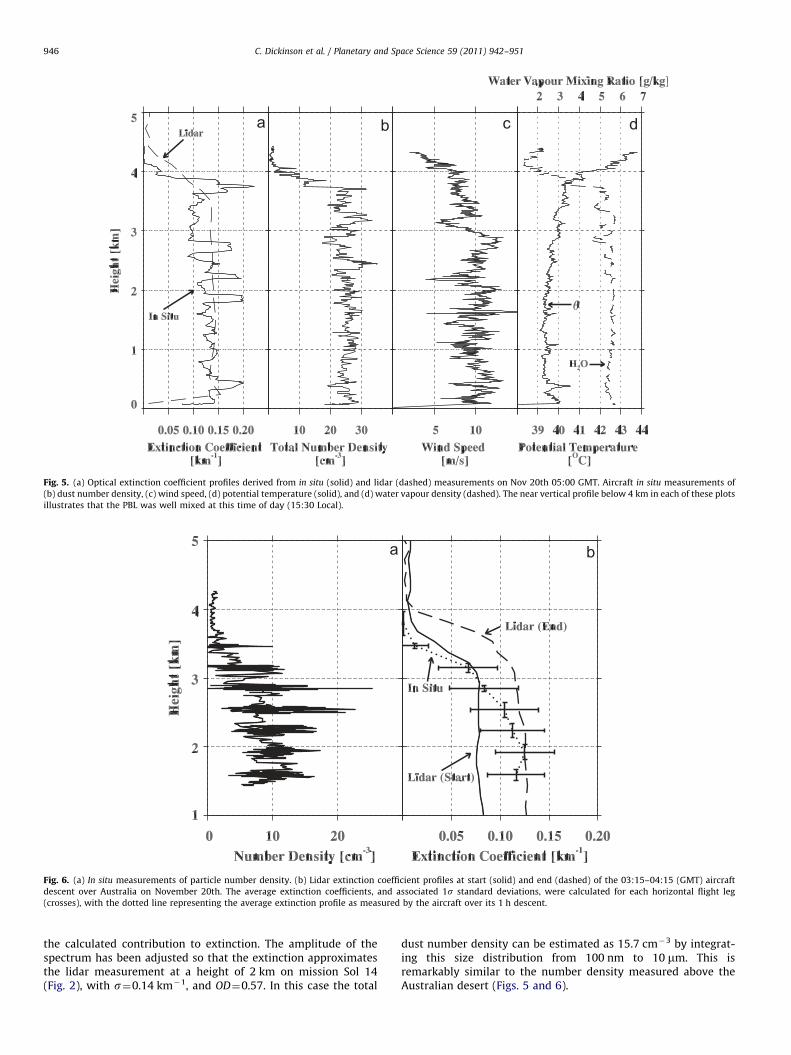
Fig. 6. (a) In situ measurements of particle number density. (b) Lidar extinction coefficient profiles at start (solid) and end (dashed) of the 03:15–04:15 (GMT) aircraft
descent over Australia on November 20th. The average extinction coefficients, and associated 1s standard deviations, were calculated for each horizontal flight leg
(crosses), with the dotted line representing the average extinction profile as measured by the aircraft over its 1 h descent.
Fig. 5. (a) Optical extinction coefficient profiles derived from in situ (solid) and lidar (dashed) measurements on Nov 20th 05:00 GMT. Aircraft in situ measurements of
(b) dust number density, (c) wind speed, (d) potential temperature (solid), and (d) water vapour density (dashed). The near vertical profile below 4 km in each of these plots
illustrates that the PBL was well mixed at this time of day (15:30 Local).
C. Dickinson et al. / Planetary and Space Science 59 (2011) 942–951946
the calculated contribution to extinction. The amplitude of thespectrum has been adjusted so that the extinction approximatesthe lidar measurement at a height of 2 km on mission Sol 14(Fig. 2), with s¼0.14 km�1, and OD¼0.57. In this case the total
dust number density can be estimated as 15.7 cm�3 by integrat-ing this size distribution from 100 nm to 10 mm. This isremarkably similar to the number density measured above theAustralian desert (Figs. 5 and 6).
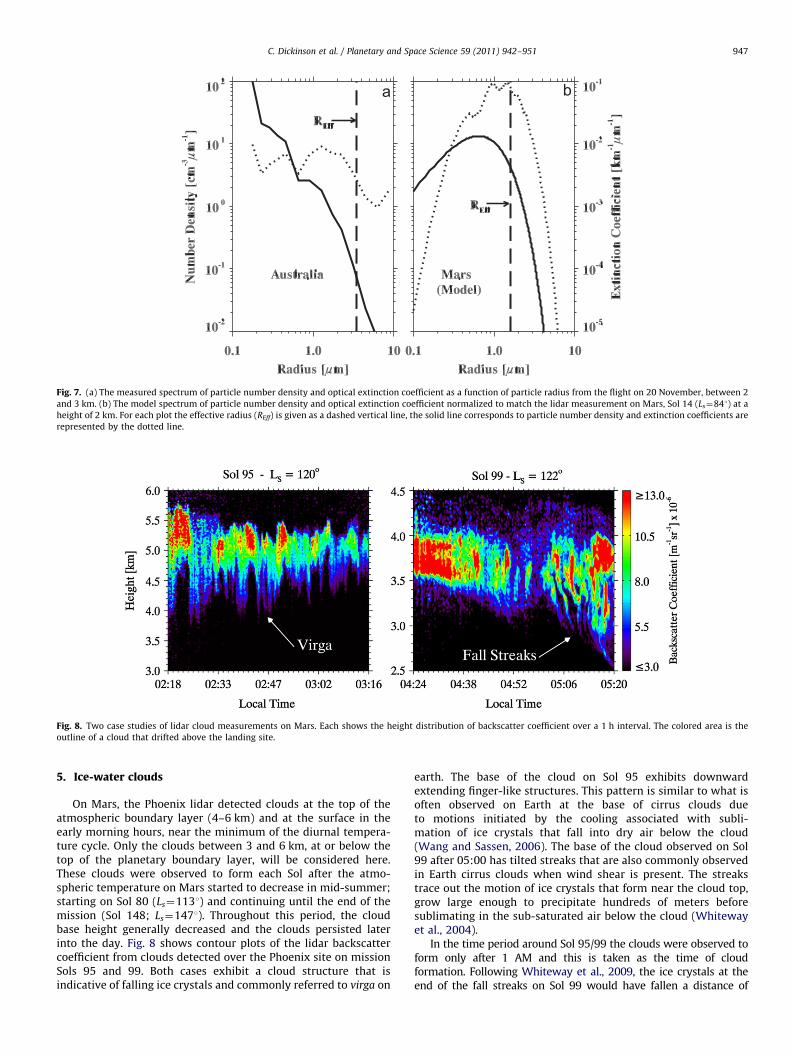
Fig. 7. (a) The measured spectrum of particle number density and optical extinction coefficient as a function of particle radius from the flight on 20 November, between 2
and 3 km. (b) The model spectrum of particle number density and optical extinction coefficient normalized to match the lidar measurement on Mars, Sol 14 (Ls¼841) at a
height of 2 km. For each plot the effective radius (REff) is given as a dashed vertical line, the solid line corresponds to particle number density and extinction coefficients are
represented by the dotted line.
Fig. 8. Two case studies of lidar cloud measurements on Mars. Each shows the height distribution of backscatter coefficient over a 1 h interval. The colored area is the
outline of a cloud that drifted above the landing site.
C. Dickinson et al. / Planetary and Space Science 59 (2011) 942–951 947
5. Ice-water clouds
On Mars, the Phoenix lidar detected clouds at the top of theatmospheric boundary layer (4–6 km) and at the surface in theearly morning hours, near the minimum of the diurnal tempera-ture cycle. Only the clouds between 3 and 6 km, at or below thetop of the planetary boundary layer, will be considered here.These clouds were observed to form each Sol after the atmo-spheric temperature on Mars started to decrease in mid-summer;starting on Sol 80 (Ls¼1131) and continuing until the end of themission (Sol 148; Ls¼1471). Throughout this period, the cloudbase height generally decreased and the clouds persisted laterinto the day. Fig. 8 shows contour plots of the lidar backscattercoefficient from clouds detected over the Phoenix site on missionSols 95 and 99. Both cases exhibit a cloud structure that isindicative of falling ice crystals and commonly referred to virga on
earth. The base of the cloud on Sol 95 exhibits downwardextending finger-like structures. This pattern is similar to what isoften observed on Earth at the base of cirrus clouds dueto motions initiated by the cooling associated with subli-mation of ice crystals that fall into dry air below the cloud(Wang and Sassen, 2006). The base of the cloud observed on Sol99 after 05:00 has tilted streaks that are also commonly observedin Earth cirrus clouds when wind shear is present. The streakstrace out the motion of ice crystals that form near the cloud top,grow large enough to precipitate hundreds of meters beforesublimating in the sub-saturated air below the cloud (Whitewayet al., 2004).
In the time period around Sol 95/99 the clouds were observed toform only after 1 AM and this is taken as the time of cloudformation. Following Whiteway et al., 2009, the ice crystals at theend of the fall streaks on Sol 99 would have fallen a distance of
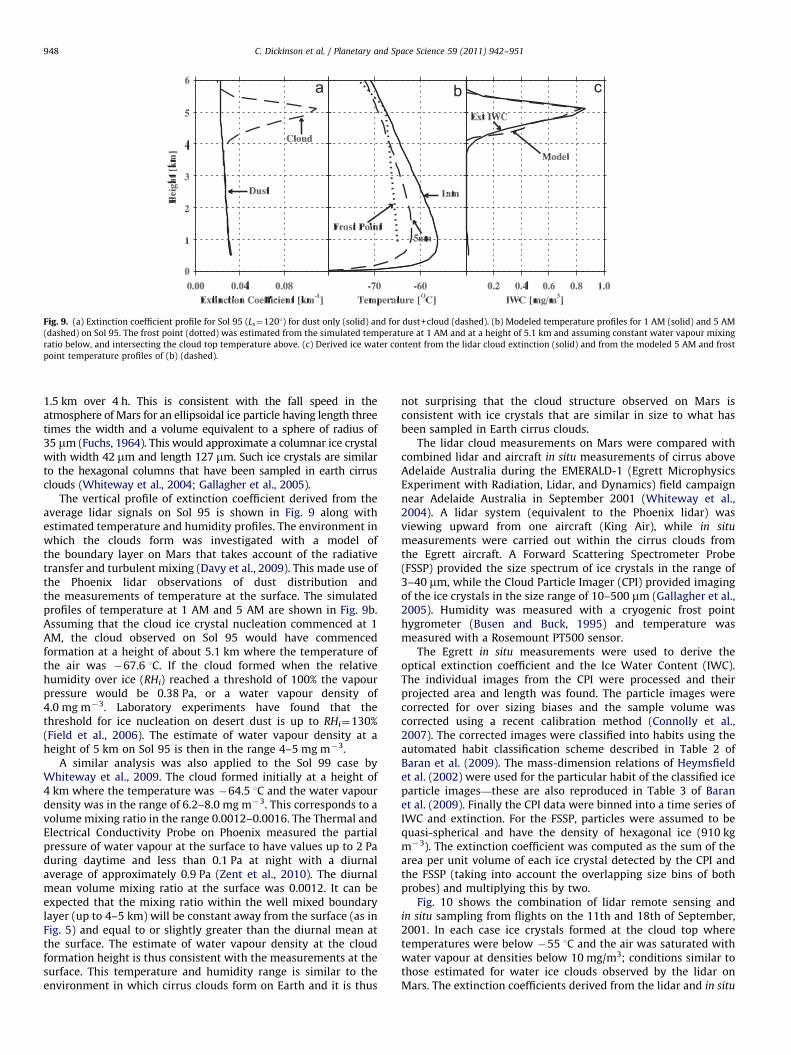
Fig. 9. (a) Extinction coefficient profile for Sol 95 (Ls¼1201) for dust only (solid) and for dust+cloud (dashed). (b) Modeled temperature profiles for 1 AM (solid) and 5 AM
(dashed) on Sol 95. The frost point (dotted) was estimated from the simulated temperature at 1 AM and at a height of 5.1 km and assuming constant water vapour mixing
ratio below, and intersecting the cloud top temperature above. (c) Derived ice water content from the lidar cloud extinction (solid) and from the modeled 5 AM and frost
point temperature profiles of (b) (dashed).
C. Dickinson et al. / Planetary and Space Science 59 (2011) 942–951948
1.5 km over 4 h. This is consistent with the fall speed in theatmosphere of Mars for an ellipsoidal ice particle having length threetimes the width and a volume equivalent to a sphere of radius of35 mm (Fuchs, 1964). This would approximate a columnar ice crystalwith width 42 mm and length 127 mm. Such ice crystals are similarto the hexagonal columns that have been sampled in earth cirrusclouds (Whiteway et al., 2004; Gallagher et al., 2005).
The vertical profile of extinction coefficient derived from theaverage lidar signals on Sol 95 is shown in Fig. 9 along withestimated temperature and humidity profiles. The environment inwhich the clouds form was investigated with a model ofthe boundary layer on Mars that takes account of the radiativetransfer and turbulent mixing (Davy et al., 2009). This made use ofthe Phoenix lidar observations of dust distribution andthe measurements of temperature at the surface. The simulatedprofiles of temperature at 1 AM and 5 AM are shown in Fig. 9b.Assuming that the cloud ice crystal nucleation commenced at 1AM, the cloud observed on Sol 95 would have commencedformation at a height of about 5.1 km where the temperature ofthe air was �67.6 1C. If the cloud formed when the relativehumidity over ice (RHi) reached a threshold of 100% the vapourpressure would be 0.38 Pa, or a water vapour density of4.0 mg m�3. Laboratory experiments have found that thethreshold for ice nucleation on desert dust is up to RHi¼130%(Field et al., 2006). The estimate of water vapour density at aheight of 5 km on Sol 95 is then in the range 4–5 mg m�3.
A similar analysis was also applied to the Sol 99 case byWhiteway et al., 2009. The cloud formed initially at a height of4 km where the temperature was �64.5 1C and the water vapourdensity was in the range of 6.2–8.0 mg m�3. This corresponds to avolume mixing ratio in the range 0.0012–0.0016. The Thermal andElectrical Conductivity Probe on Phoenix measured the partialpressure of water vapour at the surface to have values up to 2 Paduring daytime and less than 0.1 Pa at night with a diurnalaverage of approximately 0.9 Pa (Zent et al., 2010). The diurnalmean volume mixing ratio at the surface was 0.0012. It can beexpected that the mixing ratio within the well mixed boundarylayer (up to 4–5 km) will be constant away from the surface (as inFig. 5) and equal to or slightly greater than the diurnal mean atthe surface. The estimate of water vapour density at the cloudformation height is thus consistent with the measurements at thesurface. This temperature and humidity range is similar to theenvironment in which cirrus clouds form on Earth and it is thus
not surprising that the cloud structure observed on Mars isconsistent with ice crystals that are similar in size to what hasbeen sampled in Earth cirrus clouds.
The lidar cloud measurements on Mars were compared withcombined lidar and aircraft in situ measurements of cirrus aboveAdelaide Australia during the EMERALD-1 (Egrett MicrophysicsExperiment with Radiation, Lidar, and Dynamics) field campaignnear Adelaide Australia in September 2001 (Whiteway et al.,2004). A lidar system (equivalent to the Phoenix lidar) wasviewing upward from one aircraft (King Air), while in situ
measurements were carried out within the cirrus clouds fromthe Egrett aircraft. A Forward Scattering Spectrometer Probe(FSSP) provided the size spectrum of ice crystals in the range of3–40 mm, while the Cloud Particle Imager (CPI) provided imagingof the ice crystals in the size range of 10–500 mm (Gallagher et al.,2005). Humidity was measured with a cryogenic frost pointhygrometer (Busen and Buck, 1995) and temperature wasmeasured with a Rosemount PT500 sensor.
The Egrett in situ measurements were used to derive theoptical extinction coefficient and the Ice Water Content (IWC).The individual images from the CPI were processed and theirprojected area and length was found. The particle images werecorrected for over sizing biases and the sample volume wascorrected using a recent calibration method (Connolly et al.,2007). The corrected images were classified into habits using theautomated habit classification scheme described in Table 2 ofBaran et al. (2009). The mass-dimension relations of Heymsfieldet al. (2002) were used for the particular habit of the classified iceparticle images—these are also reproduced in Table 3 of Baranet al. (2009). Finally the CPI data were binned into a time series ofIWC and extinction. For the FSSP, particles were assumed to bequasi-spherical and have the density of hexagonal ice (910 kgm�3). The extinction coefficient was computed as the sum of thearea per unit volume of each ice crystal detected by the CPI andthe FSSP (taking into account the overlapping size bins of bothprobes) and multiplying this by two.
Fig. 10 shows the combination of lidar remote sensing andin situ sampling from flights on the 11th and 18th of September,2001. In each case ice crystals formed at the cloud top wheretemperatures were below �55 1C and the air was saturated withwater vapour at densities below 10 mg/m3; conditions similar tothose estimated for water ice clouds observed by the lidar onMars. The extinction coefficients derived from the lidar and in situ
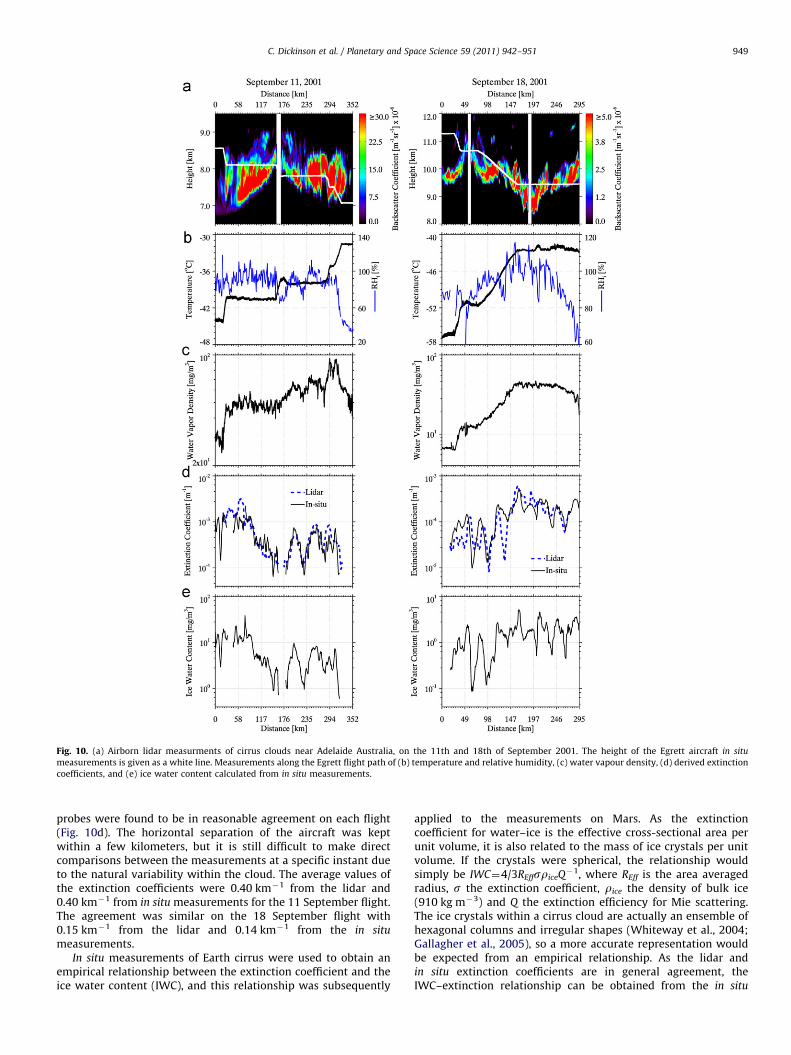
Fig. 10. (a) Airborn lidar measurments of cirrus clouds near Adelaide Australia, on the 11th and 18th of September 2001. The height of the Egrett aircraft in situ
measurements is given as a white line. Measurements along the Egrett flight path of (b) temperature and relative humidity, (c) water vapour density, (d) derived extinction
coefficients, and (e) ice water content calculated from in situ measurements.
C. Dickinson et al. / Planetary and Space Science 59 (2011) 942–951 949
probes were found to be in reasonable agreement on each flight(Fig. 10d). The horizontal separation of the aircraft was keptwithin a few kilometers, but it is still difficult to make directcomparisons between the measurements at a specific instant dueto the natural variability within the cloud. The average values ofthe extinction coefficients were 0.40 km�1 from the lidar and0.40 km�1 from in situ measurements for the 11 September flight.The agreement was similar on the 18 September flight with0.15 km�1 from the lidar and 0.14 km�1 from the in situ
measurements.In situ measurements of Earth cirrus were used to obtain an
empirical relationship between the extinction coefficient and theice water content (IWC), and this relationship was subsequently
applied to the measurements on Mars. As the extinctioncoefficient for water–ice is the effective cross-sectional area perunit volume, it is also related to the mass of ice crystals per unitvolume. If the crystals were spherical, the relationship wouldsimply be IWC¼4/3REffsriceQ
�1, where REff is the area averagedradius, s the extinction coefficient, rice the density of bulk ice(910 kg m�3) and Q the extinction efficiency for Mie scattering.The ice crystals within a cirrus cloud are actually an ensemble ofhexagonal columns and irregular shapes (Whiteway et al., 2004;Gallagher et al., 2005), so a more accurate representation wouldbe expected from an empirical relationship. As the lidar andin situ extinction coefficients are in general agreement, theIWC–extinction relationship can be obtained from the in situ
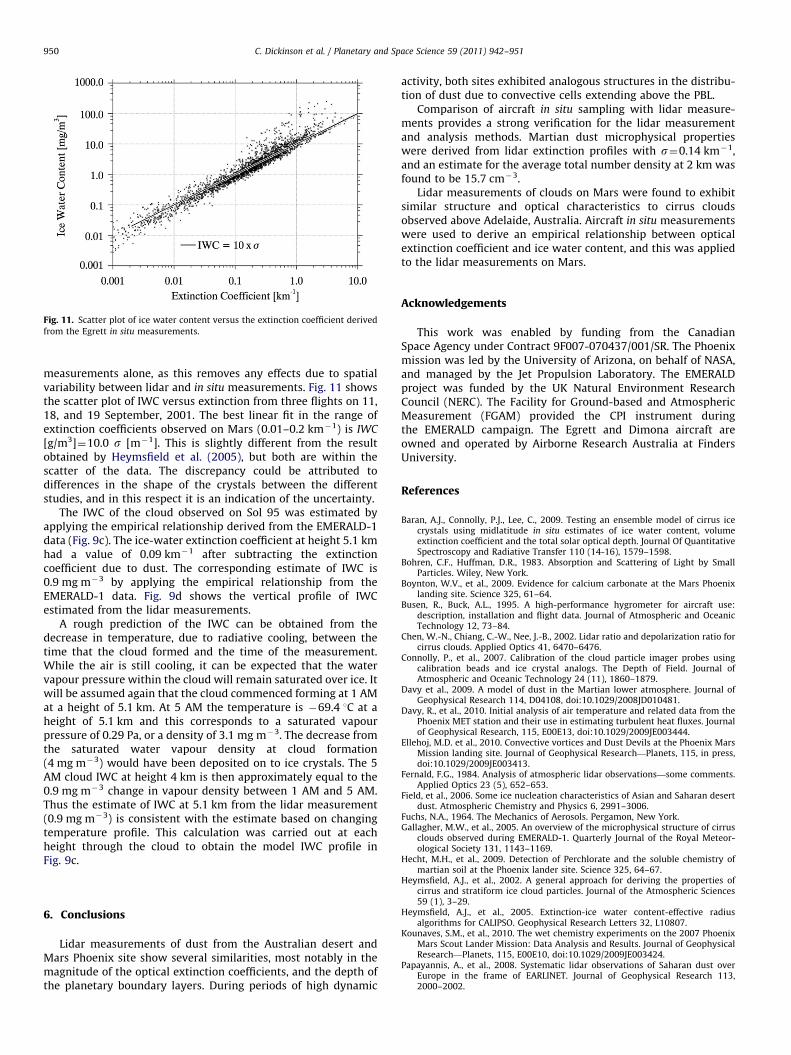
Fig. 11. Scatter plot of ice water content versus the extinction coefficient derived
from the Egrett in situ measurements.
C. Dickinson et al. / Planetary and Space Science 59 (2011) 942–951950
measurements alone, as this removes any effects due to spatialvariability between lidar and in situ measurements. Fig. 11 showsthe scatter plot of IWC versus extinction from three flights on 11,18, and 19 September, 2001. The best linear fit in the range ofextinction coefficients observed on Mars (0.01–0.2 km�1) is IWC
[g/m3]¼10.0 s [m�1]. This is slightly different from the resultobtained by Heymsfield et al. (2005), but both are within thescatter of the data. The discrepancy could be attributed todifferences in the shape of the crystals between the differentstudies, and in this respect it is an indication of the uncertainty.
The IWC of the cloud observed on Sol 95 was estimated byapplying the empirical relationship derived from the EMERALD-1data (Fig. 9c). The ice-water extinction coefficient at height 5.1 kmhad a value of 0.09 km�1 after subtracting the extinctioncoefficient due to dust. The corresponding estimate of IWC is0.9 mg m�3 by applying the empirical relationship from theEMERALD-1 data. Fig. 9d shows the vertical profile of IWCestimated from the lidar measurements.
A rough prediction of the IWC can be obtained from thedecrease in temperature, due to radiative cooling, between thetime that the cloud formed and the time of the measurement.While the air is still cooling, it can be expected that the watervapour pressure within the cloud will remain saturated over ice. Itwill be assumed again that the cloud commenced forming at 1 AMat a height of 5.1 km. At 5 AM the temperature is �69.4 1C at aheight of 5.1 km and this corresponds to a saturated vapourpressure of 0.29 Pa, or a density of 3.1 mg m�3. The decrease fromthe saturated water vapour density at cloud formation(4 mg m�3) would have been deposited on to ice crystals. The 5AM cloud IWC at height 4 km is then approximately equal to the0.9 mg m�3 change in vapour density between 1 AM and 5 AM.Thus the estimate of IWC at 5.1 km from the lidar measurement(0.9 mg m�3) is consistent with the estimate based on changingtemperature profile. This calculation was carried out at eachheight through the cloud to obtain the model IWC profile inFig. 9c.
6. Conclusions
Lidar measurements of dust from the Australian desert andMars Phoenix site show several similarities, most notably in themagnitude of the optical extinction coefficients, and the depth ofthe planetary boundary layers. During periods of high dynamic
activity, both sites exhibited analogous structures in the distribu-tion of dust due to convective cells extending above the PBL.
Comparison of aircraft in situ sampling with lidar measure-ments provides a strong verification for the lidar measurementand analysis methods. Martian dust microphysical propertieswere derived from lidar extinction profiles with s¼0.14 km�1,and an estimate for the average total number density at 2 km wasfound to be 15.7 cm�3.
Lidar measurements of clouds on Mars were found to exhibitsimilar structure and optical characteristics to cirrus cloudsobserved above Adelaide, Australia. Aircraft in situ measurementswere used to derive an empirical relationship between opticalextinction coefficient and ice water content, and this was appliedto the lidar measurements on Mars.
Acknowledgements
This work was enabled by funding from the CanadianSpace Agency under Contract 9F007-070437/001/SR. The Phoenixmission was led by the University of Arizona, on behalf of NASA,and managed by the Jet Propulsion Laboratory. The EMERALDproject was funded by the UK Natural Environment ResearchCouncil (NERC). The Facility for Ground-based and AtmosphericMeasurement (FGAM) provided the CPI instrument duringthe EMERALD campaign. The Egrett and Dimona aircraft areowned and operated by Airborne Research Australia at FindersUniversity.
References
Baran, A.J., Connolly, P.J., Lee, C., 2009. Testing an ensemble model of cirrus icecrystals using midlatitude in situ estimates of ice water content, volumeextinction coefficient and the total solar optical depth. Journal Of QuantitativeSpectroscopy and Radiative Transfer 110 (14-16), 1579–1598.
Bohren, C.F., Huffman, D.R., 1983. Absorption and Scattering of Light by SmallParticles. Wiley, New York.
Boynton, W.V., et al., 2009. Evidence for calcium carbonate at the Mars Phoenixlanding site. Science 325, 61–64.
Busen, R., Buck, A.L., 1995. A high-performance hygrometer for aircraft use:description, installation and flight data. Journal of Atmospheric and OceanicTechnology 12, 73–84.
Chen, W.-N., Chiang, C.-W., Nee, J.-B., 2002. Lidar ratio and depolarization ratio forcirrus clouds. Applied Optics 41, 6470–6476.
Connolly, P., et al., 2007. Calibration of the cloud particle imager probes usingcalibration beads and ice crystal analogs. The Depth of Field. Journal ofAtmospheric and Oceanic Technology 24 (11), 1860–1879.
Davy et al., 2009. A model of dust in the Martian lower atmosphere. Journal ofGeophysical Research 114, D04108, doi:10.1029/2008JD010481.
Davy, R., et al., 2010. Initial analysis of air temperature and related data from thePhoenix MET station and their use in estimating turbulent heat fluxes. Journalof Geophysical Research, 115, E00E13, doi:10.1029/2009JE003444.
Ellehoj, M.D. et al., 2010. Convective vortices and Dust Devils at the Phoenix MarsMission landing site. Journal of Geophysical Research—Planets, 115, in press,doi:10.1029/2009JE003413.
Fernald, F.G., 1984. Analysis of atmospheric lidar observations—some comments.Applied Optics 23 (5), 652–653.
Field, et al., 2006. Some ice nucleation characteristics of Asian and Saharan desertdust. Atmospheric Chemistry and Physics 6, 2991–3006.
Fuchs, N.A., 1964. The Mechanics of Aerosols. Pergamon, New York.Gallagher, M.W., et al., 2005. An overview of the microphysical structure of cirrus
clouds observed during EMERALD-1. Quarterly Journal of the Royal Meteor-ological Society 131, 1143–1169.
Hecht, M.H., et al., 2009. Detection of Perchlorate and the soluble chemistry ofmartian soil at the Phoenix lander site. Science 325, 64–67.
Heymsfield, A.J., et al., 2002. A general approach for deriving the properties ofcirrus and stratiform ice cloud particles. Journal of the Atmospheric Sciences59 (1), 3–29.
Heymsfield, A.J., et al., 2005. Extinction-ice water content-effective radiusalgorithms for CALIPSO. Geophysical Research Letters 32, L10807.
Kounaves, S.M., et al., 2010. The wet chemistry experiments on the 2007 PhoenixMars Scout Lander Mission: Data Analysis and Results. Journal of GeophysicalResearch—Planets, 115, E00E10, doi:10.1029/2009JE003424.
Papayannis, A., et al., 2008. Systematic lidar observations of Saharan dust overEurope in the frame of EARLINET. Journal of Geophysical Research 113,2000–2002.

C. Dickinson et al. / Planetary and Space Science 59 (2011) 942–951 951
Peters, T.M., Ott, D., O’shaughness, P.T., 2006. Comparison of the Grimm 1.108 and1.109 Portable Aerosol Spectrometer to the TSI 3321 Aerodynamic ParticleSizer for dry particles. Annals of Occupational Hygiene 50 (8), 843–850.
Qin, Y., Mitchell, R.M., 2009. Characterisation of episodic aerosol types over theAustralian continent. Atmospheric Chemistry and Physics 9, 1943–1956.
Shaw, A., et al., 2009. Phoenix soil physical properties investigation. Journal ofGeophysical Research—Planets, 114, E00E05, doi:10.1029/2009JE003455.
Smith, P.H., et al., 2008. Introduction to special section on the Phoenix Mission:landing site characterization experiments, mission overviews, and expectedscience. Journal of Geophysical Research—Planets 113, E00A18.
Smith, P.H., et al., 2009. H2O at the Phoenix landing site. Science 325, 58–61.Tamppari, L.K. et al., 2010. Phoenix and MRO coordinated atmospheric measure-
ments. Journal of Geophysical Research—Planets, 115, in press, doi:10.1029/2009JE003415.
Taylor, P., et al., 2009. Temperature, pressure, and wind instrumentation in thePhoenix meteorological package. Journal of Geophysical Research—Planets113, E00A10.
Wang, L., Sassen, K., 2006. Cirrus mammatus properties derived from an extendedremote sensing dataset. Journal of Atmospheric Science 63, 712–725.
Whiteway, J., et al., 2004. Anatomy of cirrus clouds: results from the Emeraldairborne campaigns. Geophysical Research Letters 31, L24102.
Whiteway, J., et al., 2008. Lidar on the Phoenix mission to Mars. Journal ofGeophysical Research—Planets 113, E00A08.
Whiteway, J., et al., 2009. Mars water–ice clouds and precipitation. Science 325,68–70.
Whiteway, J., Dickinson, C., 2010. Phoenix MET lidar calibration, characterizationand catalog report. NASA Planetary Data System—Planetary AtmospheresNode.
Wolff, M.J., et al., 2009. Wavelength dependence of dust aerosol single scatteringalbedo as observed by the Compact Reconnaissance Imaging Spectrometer.Journal of Geophysical Research—Planets 114, E00D04.
Zent, A.P., et al., 2010. Initial results from the Thermal and Electrical ConductivityProbe (TECP) on Phoenix. Journal of Geophysical Research—Planets, 115,E00E14, doi:10.1029/2009JE003420.