libro aminoacidos method
DESCRIPTION
yyyyyTRANSCRIPT
PLASMA AMINO ACID ANALYSIS BY AUTOMATIC
HIGH PERFORMANCE LIQUID CHROMATOGRAPHY
by
CHAN, KIM HUNG
A Thesis Submitted in Partial Fulfilment ofthe Requirement for
the Degree ofMaster of Science in Clinical Biochemistry
Department of Chemical Pathology Faculty ofMedicine
The Chinese University of Hong Kong 1998

U L
/ ^
p ( 15 服 m J j � ^ - ~ ^ i i i � r ' ^ f
•fRYSYST^;;^》 \ S v , . ¥ ^ i ^ 〜、‘知,n.,<U->"'
TABLE OF CONTENTS
1. INTRODUCION 1
1.1 AMmO ACro ANALYSK BY fflGH PERFORMANCE LIQUU) CHROMATOGRAPHY 1 1.1.1 History and Development 1 1.1.2 Separation mechanism 2 1.1.3 Derivatization 4 1.1.4 Deproteinization 8 1.1.5 Ion^xchange or Reversed-phase HPLC 9
1.2 AMBVO ACro PATTERN lS CANCER PATTENT 11 1.2.1 Cancer cachexia 11 1.2.2 Causes of cancer cachexia 11 1.2.3 Cytokines ^ 12 1.2.4 Metabolic Alteration in cancer cachexia 13 1.2.5 Amino Add Studies 14
1.3 METHODOLOGY CHOSEN 19 1.4 PATTENT SAMPLE CHOSEN 21
2. OBJECTIVES 22
3. MATERIALS AND METHOD 23
3.1 APPARATUS 23 3.1.1 HPLCSystem 23 3.1.2 Colunm 23 3.1.3Detector 23 3.1.4 ChemStation 24
3.2 REAGENTS 24 3.2.1 Reagent and Chemical source 24 3.2.2 Mobile phase 24 3.2.3 DerivatizationReagent ^ 25 3.2.4 Standard preparation 26 3.2.5 Internal standard 28
3.3 SAMPLE PREPARATION 28 3.4 CHROMATOGRAPHIC CONDHlONS 29
3.4.1 Colunm Temperature 29 3.4.2 Injector Program ^ 29 3.4.3 Time Table for gradient elution and flow program 32
i
32 3.5.1 OPA and sample Ratio and Volume 3 2 3.5.2 Derivatization Concentration 3 3 3.5.3 Derivatization time 3 3
3.6 ANALYTICAL PERFORMANCE 34 3.6.1 Linearity testing ^4 3.6.2 Recovery studies 34 3.6.3 Precision ^4 3.6.4 Sample storage ^5
3.7 CLINICAL SAMPLE STUDffiS 35 3.8 STATISTICAL ANALYSIS 3^
4 RESULT 37
4.1 CHROMATOGRAPHIC SEPARATION 37 4.2 OPTLVIKATION 幼
4.2.1 OPA and sample Ratio and Volume 40 4.2.2 Derivatization time . -4.2.3 OPA Concentration ^^
4.3 ANALYTICAL PERFORMANCE . 4.3.1 Linearity 4.3.2 Recovery studies 二 4.3.3 Precision Studies ^^ 4.3.4 Sample storage studies ^^
4.4 CLINICAL SAMPLE STUDY ^^
5. DISCUSSION . . 6 4
5.1 ANALYTICAL 64 5.2 CLEVICAL
5.2.1 Normal controls 1^ 5.2.2 Colorectal Cancer 5.2.3 Lung Cancer 5.2.4 Nasophatyngeal Cancer 5.2.5 Summary 74
6. CONCLUSION � 7 5
7. REFERENCES � 7 6
ii
LIST OF TABLES s
Table 3.1 Composite standard preparation 27 Table 3.2 Autosampler program for OPA derivatization 30 Table 3.3 Gradient profile of amino acid separation 31 Table 4.1 Optimization OPA:Sample ratio 41 Table 4.2 Optimization total injection volume 42 Table 4.3 Optimization of derivatization time 44 Table 4.4 Optimization of OPA concentration 45 Table 4.5 Linearity testing 48
•
Table 4.6 Percentage recovery of different amino acids 49 Table 4.7 Within-nm precision 5 j Table 4.8 Between-run precision 52 Table 4.9 Sample storage study 54
Table 4.10 Plasma amino acid concentrations in colorectal cancer patient 61 Table 4.11 Plasma amino acid concentrations in lung cancer patient 62 Table 4.12 Plasma amino acid concentrations in nasopharyngeal cancer ‘ 63
patient
>
.'
iii
^ ^
LIST OF FIGURES
Figure 4.1 Chromatographic separation of high composite standard 3 8 Figure 4.2 A chromatogram of normal plasma sample 39 Figure 4.3 Calibration and regression equation of glutamine 47 Figure 4.4 Histogram of some amino acids in cancer samples 57 Figure 4.5 A chromatogram of colorectal cancer sample 58 Figure 4.6 A chromatogram of lung cancer sample 59 Figure 4.7 A chromatogram of nasopharyngeal cancer sample 60
•
V
*
.'
iv
ABSTRACT
A reversed-phase High Performance Liquid Chromatography (HPLC) protocol for amino acid analysis using o-phthaladehyde (OPA) as the pre-column derivatization agent was set up. The HPLC system was equipped with an autosampler as well as an auto-injector worked under a commercial software. Two mobile phases were used for gradient elution. The method used methanol as the solvent to precipitate the protein and a Cig column ( 250 X 4.6 mm I.D., 5|im particle size) for separation. In 75 minutes, 27 amino acids in plasma were resolved. Automatic derivatization was possible after optimization of the sample volume, derivatization reagent volume and concentration, and the derivatization reaction time. Analytical performance was satisfactory. Averaged within-run and between-run precision were 4.7% and 7.3% respectively. Plasma samples for amino acid analysis should be stored at -20�C without affecting the results.
The free amino acid profiles of 10 colorectal cancer patients, 12 lung cancer patients and 12 nasopharyngeal cancer patients were studied and compared with 17 healthy control subjects. All the cancer patients were newly-diagnosed cases with no other underlined diseases. Aspartic acid. Glutamic acid and 3-methyUiistidine were found to be elevated in all three kinds of malignancy diseases. Although some alteration in concentration was found in some amino acids, no specific change was seen for their total amino acid ’ branched-chain�aromatic, essential, and non-essential amino acid contents as compared With the control group. Lung cancer group showed elevation in essential amino acid and ^ g h t be due to dietary factor.
vii
撮要
這是一個使用反相高效液相色譜法(HPLC )作爲氣基酸 分析的草案|5錄,而作爲柱前衍生劑是使用鄰苯二醒
( O P A )。這個高效液相色譜法系統是裝置在自動取樣器 及自動注射器,而整個系統是在一個電腦軟件下運行。系 統使用了兩種流動相作爲梯度洗脫。蛋白質沉淀是使用甲 mmmm,而分解柱是使用一支€18柱(250亳米x4.6 亳米內徑,5微米粒子大小)°在七十五分鐘內能分辨血 液中二十七種氨基酸。當樣本份量、衍生劑份量及濃度、 及衍生反應時間最佳化後,全自動衍生法便能使用。分析 表現理想。平均批內及批外的精確度分別爲4.7%及7.3%。 爲免分析結果受影響,血液樣本需儲存於-20�C�
十個結腸直騰癌、十二個肺癌及十二個鼻咽癌的血液樣本 內的氨基酸成份和十七個健康人的控制樣本作爲比較。所 有病人都是新診斷的癌症個案,他們並沒有其他疾病。三 種癌症病人血液內,發現天門冬氨酸、谷氨酸及三甲早氨 酸均比控制樣本爲高。當和控制樣本比較時,雖然病人某 些氨基酸份量有所改變,但其總氨基酸份量,及分支的、 芳族的、必需的和非必需的氨基酸份量都沒有改變。肺癌 病人在必需氨基酸份量比控制樣本爲高,這可能是飮食因 素。
Acknowledgments
I am grateful to Dr. Calvin C.P. Pang, my project supervisor, Professor of Chemical Pathology Department, the Chinese University of Hong Kong,to give me invaluable guidance and support throughout the project and comment on this manuscript.
I would like to thank Mr. Eric Law, Scientific Officer of Chemical Pathology Laboratory, Prince of Wales Hospital, for his technical advice and support on HPLC techniques.
V
ABSTRACT
A reversed-phase High Performance Liquid Chromatography O^PLC) protocol for amino acid analysis using o-phthaladehyde (OPA) as the pre-column derivatization agent was set up. The HPLC system was equipped with an autosampler as well as ati auto-injector worked under a commercial software. Two mobile phases were used for gradient elution. The method used methanol as the solvent to precipitate the protein and a Cig column ( 250 X 4.6 mm I.D., 5pm particle size) for separation. In 75 minutes, 27 amino acids in plasma were resolved. Automatic derivatization was possible after optimization of the sample
‘
volume, derivatization reagent volume and concentration, and the derivatization reaction time. Analytical performance was satisfactory. Averaged within-run and between-run precision were 4.7% and 7.3% respectively. Plasma samples for amino acid analysis should be stored at -20°C without affecting the results. The free amino acid profiles of 10 colorectal cancer patients, 12 lung cancer patients and 12 nasopharyngeal cancer patients were studied and compared with 17 healthy control subjects. All the cancer patients were newly-diagnosed cases with no other underlined diseases. Aspartic acid, Glutamic acid and 3-methyUiistidine were found to be elevated in all three kinds of malignancy diseases. Although some alteration in concentration was found in some amino acids,no specific change was seen for their total amino acid,
branched-chain, aromatic, essential, and non-essential amino acid contents as compared with the control group. Lung cancer group showed elevation in essential amino acid and ^ g h t be due to dietary factor.
x
1. INTRODUCTION
1.1 AMINO ACID ANALYSIS BY HIGH PERFORMANCE LIQUID CHROMATOGRAPHY
1.1.1 History and Development In 1950s, Moore and Stein (Moore & Stein, 1951) developed the classic ion-exchange column chromatography for amino acids. The amino acids were separated according to their positive or negative charges at different pH, created by a series of elution buffers with different pH. The eluted amino acids react with ninhydrin so as to be detected as colored products. Spackman et al (1958) automated the procedures. The colour intensity developed by ninhydrin and the amino acids were automatically recorded. This set-up formed the basis of amino acid analyzer. In 1959,Beckman introduced the first commercial amino acid analyzer. A series ofbuffers pumped by the buffer pump passed through sample loader and carried the sample into the resin. Ninhydrin was pumped to the mixing manifold, and there it mixed with the amino acid effluent from the resin. After mixing in the reaction coil, the mixture reached the detector . Signals were generated in the detecor and recorded automatically. After the introduction of High Performance Liquid Chromatography (HPLC) in 1960s, the ion-exchange separation can be incorporated into the HPLC procedures. This led to improved both efficiency and sensitivity. For the next twenty years onward, the ion-
1

exchange liquid chromatography became the most popular method for amino acid analysis in clinical laboratories.
The advent reversed-phase HPLC provide an attractive alternative for amino acid analysis. The reversed-phase HPLC allow the pre-column reaction with derivatization agent. In pre-column derivatization, derivatization agent did not need to be pumped continously to mix with the amino acid effluent. Less reagent was consumed a clearer chromatographic background was produced. No undesirable amino acids in the elution buffer reacted with the derivatization agent. Sensitivity was greatly improved.
1.1.2 Separation mechanism In ion-exchange chromatography, the ion-exchangers are sulphonated fiuictional group on the resin. The resin consists of small beads of polystyrene. The polystyrene is sulphonated by sulphuric acid to attain a negative charge. It then reacts with divinylbenzene to enhance the cross-linkage property. The negatively charged groups are associated with mobile counter ions�usually lithium. They have no true pores in them. The bead matrix can serve as apparent pores and retards the movement of the ions through the column. In order to increase the efficiency of separation, smaller bead size and high pressure are favored (Walker & Mms, 1995).
Amino acids are zwitterions carrying both positive amino groups and negative carboxyl groups. The net charge depends on the pH of the enviroment. At low
2

pH, the positive amino groups interact with the sulfonated ion-exchange resin so that the basic amino acids are retained, but not the acidic amino acid with the suppressed carboxyl groups. The positive amino groups exchanged the position of the positively charged lithium, which was originally associated with the suphonated ions. The acidic amino acid at such low pH has a relatively weaker interaction with the sulfonated ion-exchange resin, they are eluted first. As the pH increases, some other amino acids lose all the charges at their isoelectric point and elute out. Separation is due to primarily to differences in the isoelectric points and follows the general order: acidic, neutral and finally basic.
In reversed-phase liquid chromatography, the stationary phase in the analytical column, is hydrophobic, while the mobile phase is polar. Non-polar compounds can be easily retained by the column while the relative polar compounds are easily eluted out by the polar mobile phase.
The amino acids can carry positive amino groups and negative carboxyl groups. At pH lower than its isoelectric p o i n t� t h e y exist predominantly as positive charge while at high pH, negative charge. Pre-column derivatization in reversed-phase HPLC aims at destroying the zwitterion nature of the amino acid by reacting with one of the charged group so that a suitable pH can be employed to render the amino acids hydrophobic. Besides, after separation, the derivatized amino acids, could be detected by sensitive method ofdetection.
3
1.1.3 Derivatization Derivatization of the amino acids enliences detectability. It is important since only a few amino acids can be detected by general signal detector, such as colorimetry or fluorimetry. Phenylalanine, tyrosine and tryptophan can absorb UV light around wavelength 250-280 nm. Although at wavelength below 210 nm, most amino acids show strong UV absorption, the absorption ofthe solvents and impurities become so significant that it causes serious baseline problem. Without derivatization, only tyrosine and tryptophan exhibit significant emission when excited at 254 nm (Perrett, 1985).
Derivatization can be carried out after or before the amino acids being separated in the analytical column. Post-Column derivatization aims at rendering the amino acids after eluted out from the column readily detectable by some signal detector. Smce the derivatization is added only after elution, the amino acids must use some oftheir own physical properties such as charges so as to be separated in the analytical column. After separation, a metering pump is necessary to continuously pump the derivatization agent into the column eluent. The principal advantage of post-column derivatization is that the underivatized amino acids are applied into the column. Derivatives stability in the separation column or derivatization reaction completeness is not being major problem in post-column derivatization. However, trace amounts of undesirable amino acids in the buffers when eluted'out from the column,can react with the derivatization agents and causes the fluctuation in the baseline ofthe chromatogram.
4
Pre-colunm derivatization should make the sample readily detectable as well as create or retain the property that is employed for separation process. Pre-colunm derivatization is economical on derivatization reagent use since no continuos pumping the reagent is necessary as in post-column reaction. The derivatized samples, however, may be unstable during separation or the derivatization for some amino acids are not complete The loss of the amino group in the amino acids after derivatization makes the traditional ion-exchange chromatography applicable. The carboxyl group becomes significant in determining the mode of separation.
Different derivatization agents have been developed. A good derivatization agent should react with all the different amino acids. It should react with amino acids only and distinct product should be formed for each individual amino acid. It itselfshould be stable and it itself will not generate signal response.
Derivatization agent that is most commonly used for post-column reaction is ninhydrin, while o-phthaladehyde (OPA) is a good alternative. Post-column derivatization is the conventional procedure for ion-exchange HPLC. While the pre-colunm reaction, which is usually preceding the reversed-phase HPLC separation, examples of derivatization agent include o-phthaladehyde (OPA), fluroeny-methyl chloroformate (FMOC) and dansyl chloride (Dns-Cl).
Ninhydrin was first introduced by Moore and Stein in 1950s. It is the classic reagent to detect amino acids over 30 years.. The amino group ofprimary amino
5
acids reacts with two molecules of hydrindantin, the reduced form of ninhydrin, to form Rhuman purple with maximum absorption at 570 nm. A yellow adduct, with maximum absorption at 440 nm, is formed with secondary amino acids, proline and hydroxyproline. At an elevated temperature of 120°C, the reaction only takes 2 to 3 minutes to complete. Such reagent can provide adequate sensitivity while maintaining resolution. It can react with both primary amino acids as well as secondary amino acids, proline and hydroxyproline. Some drugs can react with Ninhydrin and cause interference. Some antibiotics such as ampicillin and kanamycin can generate abnormal peaks.
o-phthalaldehyde (OPA) is another popular post-column derivatization agent, and nowadays becomes the most popular pre-column derivatization agent. OPA can render the amino acids more hydrophobic, by reacting with the amino group on them. It reacts with primary amino acids at an alkaline pH in the presence of a thiol, 2-mercaptoethanol, to form adducts detectable by fluorescence detector. The two hydrogen atoms linked to the nitrogen atom react with the two aldehyde groups on the OPA molecule and formed an isoindole derivatives, while the carboxyl end remain unchanged. The fluorescence signal produced is very strong, and it can give 10-1000 times higher sensitivity than ninhydrin (Ersser & Davy, 1991). The reaction takes 2 to 3 mintes to complete in room temperature. The reagent itself does not give fluorescence and no interference peak will be produced. However, some problems are still associated with OPA derivatization. Firstly, the OPA derivatives are not very stable. Its half-life ranges from 2 to 72 niinutes (Walker, 1995). Secondary, it does not react with secondary amino acids directly, since they do not have two free hydrogen atoms linked to nitrogen atom
6
for isoindole derivative formation. Thirdly, Transformation of cystine and homocystine to cysteine and homecysteine by iodoacetate is a necessary step to render them detectable.
FMOC can react with secondary amino acids�proline and hydroxyproline in addition to primary amino acids. Besides, the derivatives formed are stable for several days. The stability of the derivatives makes manual derivatization possible (Haynes et a l�1 9 9 1 ) . The detection sensitivity can be down to fetomolar. The principal disadvantage of its function as derivatization agent is that it itself generates fluorescence and causes interference peaks. Therefore excessive reagent must be removed before the derivatives are applied to column for separation. The extraction solvent most often used is pentane (Miller et al, 1990). Some amino acids, such as histidine and tyrosine form mono- and di-substituted derivatives.
5-dimethylaminonaphthalene-1 -sulphonyl chloride is commonly known as Dansyl chloride. It can react with both primary and secondary amino acids at dark in the room temperature. An extraction process and evaporation step are required prior to derivatization. Derivatization takes 3-5 hours or sample can be derivatized ovemight. The derivatives once formed are stable for at least 96 hours (Weidmeier, 1982). Detection is usually by fluorescence or UV absorbance. Problems as derivatization agent includes poor yield of derivatives, multiple peaks ofthe derivatives and light sensitivity ofthe derivatives.
7
Blankenship et al (1989) developed an automatic two-step derivatization technique to overcome great disadvantage of OPA that it does not react with secondary amino acids such as proline and hydroxyproline even though it can ensure high sensitivity and produce promised result,. In the first step, all primary amino acids react with the OPA reagent containing 2-mercaptoethanol. During the second step, the reaction mixture of OPA derivatives is treated with FMOC-C1 to derivatize the unreacted secondary amino acids. Both reactions are rapid and the derivatives produced are strongly fluorescence. Bartok et al (1994) speeded-up the separation by using a relatively short column (10 cm X 4 mm H)) filled with Hypersil ODS packing. The total analysis time, including pre-column derivatization, separation, column washing and re-equilibration cycles, was only 18 minutes.
1.1.4 Deproteinuation Protein must be removed from the sample before applied to the analytical column. In ion-exchange chromatography, the protein can clog the resins and cause peak spreading and increase of back pressure in the column. In reversed-phased HPLC, the protein can prevent or interfere with the derivatization process.
8
Sulphosalicyclic acid (SSA) precipitation is a common deproteinizing agent for ion exchange analysis. The acid does not need to be removed from the supernatant before analysis, and the pH is close to the application pH.
Although sulphosalicyclic acid gives promised result for ion exchange analysis. It is not suitable for reversed-phase HPLC analysis. Liu & Worthen (1992) did not have success in using SSA as the deproteinization agent for the analysis of plasma amino acids by reversed-phased HPLC with automatic pre-column OPA derivatization. They attributed their failure to the strong acidic nature of SSA inhibits the formation of OPA-amino acid derivatives. Moreover, SSA has a peak that superimposes on some of the early elution amino acid peaks. Therefore, they recommended an ultrafiltration for protein removal. During ultrafiltration, the plasma is deprotemized by filtration of plasma through a ultrafiltration membrane. Protein is retained by the membrane while ultrafiltrates with free amino acid pass through and are collected in the filtrator cup. They demonstrated that the recoveries of the standard amino acids were excellent, ranging from 95% to 102%.
The addition of several volumes of acetonitrile, acetone or alcohols to the sample, followed by brief centrifugation, is a rapid precipitation method. It gave an economic means of protein removal. All these worked well under neutral pH condition. (Davey& Ersser, 1990).
9
1.1.5 Ion-exchange or Reversed-phase HPLC From 1960s, manufacturers started to manufacture the dedicated amino acid analyzer, using the ion-exchange chromatography. Over 30 years, automatic sampler�improved resins and data handling had been added to the features of the analyzer. Nowadays the ion-exchange post-column HPLC is now the basic configuration of a commercial amino acid analyzer. It can produce chromatogram of well-resolved amino acid peaks. The drugs that cause interference have been identified. (Walker,1995) Parallel the developments of commercial amino acid analyzer, technical advancements favor the development of reversed-phase HPLC for amino acid analysis. The HPLC equipment has developed the sophisticated pulseless gradients pump, automatic sampler, varieties of column packing, controllable column temperature as well as optional pre-or post-column derivatization. By change of mobile phase, column and detector, operator can shift to other applicator with ease. The flexibility and versatility increase the popularity of using reversed-phase HPLC for amino acid analysis. More than ten samples can be processed in an overnight run. The sensitivity is higher as well (Tumell & Cooper�1982).
10

1.2 AMINO ACID PATTERN IN CANCER PATIENT
1.2.1 Cancer cachexia Cancer cachexia is a complex condition developed in most cancer patients characterized primarily by decrease food intake and progressive tissue loss that is manifest clinically as anorexia and weight loss. (Pisters & Brennan, 1996) The term cachexia is derived from the Greek words kakos, meaning bad and hexis, meaning condition. The extent of cancer cachexia depends on the site of malignancy as well as the type of tumour.
Nutritional deterioration and alteration of body biochemical metabolism, caused by cancer cachexia, limited the patient to respond to rigorous antineoplastic therapy. (Dewys, 1980) It has been estimated that the death of two-third ofthe cancer patients could be partly due to cancer cachexia. (Lawson, 1982)
The study ofmechanism of cancer cachexia is worthwhile so as to minimize the bad effects to improve the prognosis of the cancer patients.
h2.2 Causes of cancer cachexia
Anorexia and altered biochemical metabolism are causes of cancer cachexia. Anorexia will results in imbalance of nutrients intake to meet body metabolic demands�and cause tissue depletion. Forced feeding cannot reverse or improve
11 ^ ^

the condition and change in patient body metabolism must contribute significantly to cancer cachexia. Increase consumption ofthe tumour cannot fully explain the situation of weight loss as well as the change in body metabolism. Tumour removal can improve cancer cachexia, with improved anorexia and subsequent weight gain as well as restoration ofmetabolism disturbances.
1.2.3 Cytokines It is postulated that some mediators may be involved in the process of alter biochemical metabolism. Illig etal (1992) took serum from tumour-bearing rats and injected into normal control rats. The control rats developed cachexia. They concluded some mediators in the blood were involved in cachexia wasting and cancer cachexia was transmissible. The circulating mediators are produced by the tumour or by the host in response to the tumour. Cytokines are host-derived protein molecules secreted by macrophages in response to pathological stimuli. (Kristine et al,1994) They transmit signal between cells in response to a variety ofpathological stimuli.
Tumour necrosis factor (TNF) appears likely to play a role both in humans and in animal models. Administration of recombinant TNF to animals can induce weight loss and the metabolic alterations observed in cancer cachexia patients. It has been suggested that TNF produces an effect on lipid metabolism through an inhibition of the enzyme lipoprotein lipase (Beutler et al, 1985). Miibition of lipoprotein lipase results in hypertriglyceridemia.
12

Other cytokines that may play role in cancer cachexia includes interleukin-1 (IL-1), interleukin-6 (H^-6) and interferon gamma (IFN-y). It seems the cancer cachexia is a complex syndrome that involves an array of cytokines interaction and no single cytokine alone can produce the cachexia effects. No single cytokine is dominant over the others.
1.2.4 Metabolic Alteration in cancer cachexia
Cancer-associated metabolic abnormalities include altered energy expenditure, protein metabolism, carbohydrate metabolism and lipid metabolism. Patients show signs of hypoalbuminaemia, hypoproteinaemia, glucose intolerance ,lactic acidosis and hypertriglyceridemia
Hyltander et al (1991) studied 106 cancer patients and 96 non-cancer-bearing controls and demonstrated that the cancer patients had an elevating resting energy expenditure to the control patients. Elevated energy expenditure is probably due to the metabolism of the tumour. Therefore, cancer cachexia will decrease the body energy store and upset its balance state..
Jeevanadam et al (1984) demonstrated that the whole-body protein turnover was higher in the cancer patients than in the non-cancer patients and the starved normal subject respectively. Tumours metabolize the body protein. The peripheral muscle mass decreases due to increase protein catabolism. The
13
peripheral muscle protein was broken down into amino acids that form the substrate for protein synthesis in the liver. The body protein turnover rate increases (Carmichael, 1980). These alterations upset the body defense mechanism against stress as well.
Tumours will use up body glucose with the production of lactate. Lactate recirculate back to liver where lactate is re-used to synthesize glucose. As a result, the liver lose glucose as well as energy to make up glucose.
Animal studies suggest that tumour induced the production of some fat mobolizing mediators which can increase lipid mobilization and fatty acid oxidation, but decrease the fat biosynthesis (Harrison, 1996).
1.2.5 Amino Acid Studies
Cancer cachexia can cause alteration in protein metabolism and gluconeogenesis. Amino acids are the substrates for these processes. Amino acid studies can reveal the nutritional status of the patients and the mechanism in derangement metabolism.
14
Clarke et al (1978) divided the subjects into four groups: 1) normal volunteers, 2) cancer patient without weight loss, 3) cancer patients with 20% weight loss and 4) non-cancer malnourished patient with 20 % weight loss. They demonstrated that mahiourished subjects without cancer have lower body branched-chained amino acids (BCAA) when compared with normal subjects. However the cancer patients have no significant decrease in the BCAA. Glycine levels were lower in weight losing cancer patients but higher in weight losing malnourished non-cancer-patients. Plasma levels of valine, leucine and methionine were significantly elevated in weight-losing cancer group as compared with the non-cancer malnourished patients. Plasma levels of alanine, isoleucine and valine were significantly elevated cancer patients without weight loss when compared with normal subjects.
Although Clarke could show some amino acids pattern in cancer patients as well as those under nutrition, a heterogeneous combination of different types of cancer patients made the interpretation difficult. Therefore, no conclusions as to cancer specific alterations in plasma amino acid concentrations can be made.
Burt et al (1983) carried out a homogenous group of oesophagus cancer patients studies. They found that the Branched-chain amino acids were noticeably increased in the weight-losing cancer patients. Such finding differentiates the malnutrition patients in Clarke studies which showed decrease in those amino acid levels.
15
Levin et al (1983) compared amino acid levels of weight-losing lung cancer patients with weight-losing tuberculosis patients. Multiple decreases in amino acids were noted as compared to weight-losing tuberculosis patients.The decrease in amino acids included several essential branched chain amino acids, as well as some non-essential amino acids.
Beenegard et al (1984) studied the malnourished cancer patients and compared amino acid levels with non-cancer malnourished and well-nourished controls. They noted that both the essential and non-essential amino acid levels were lower in malnourished cancer patients when compared with the malnourished controls. Contrary to the previous findings, they found that the BCAA in both malnourished groups were the same. When the malnourished cancer patient was compared with the normal controls, the BCAA levels were decreased.
Ching & Pang (1984) measured plasma amino acid levels in 13 patients with GI malignancies. There were no differences in plasma amino acids levels between the GI malignant patients and normal control group. Only threonine and glycine were lower in head and neck cancer group, while other amino acid preserved. Hepatic metastases had decreased levels of both essential and non-essential amino acids.
h the study by Norton et al (1985), they classified the patient by tumour types and studied plasma amino acids in control group and compared the results to different group. Only the proline level was significantly lowered in osteosarcoma 3nd sarcoma patients. Lymphoma patients had significantly lower histidine and
16 k.
arginine levels versus controls. Esophagus carcinoma patients with 22% weight loss, had a significant reduction in most essential and non-essential amino acids.
Naini et al (1988) studied the oesophagus and lung cancer patients and compared them to age-matched benign disease patient with no weight loss. As compared to the control group, either of the group had significant difference in essential amino acid levels except a decrease in tryptophan. Alanine and arginine levels were significantly lower in the lung cancer patients.
Pisters et al (1992) studied amino acid levels in 6 GI cancer patients and compared them to 5 age-matched normal volunteers. There were no differences in branched chain, essential or non-essential amino acids in the 2 groups.
Zhang & Pang (1992) classified 63 cancer patients according to the cancer type and studied their amino acid levels. They grouped the patients as lung cancer (31 patients), liver cancer (16 patients), colon cancer (10 patients) and breast cancer (6 patients). The amino acid levels of each group were compared with a control group which consists of 16 aged-match healthy adults. The results showed that aspartic acid and glutamic acid were significantly increased in all four groups of cancer patients. Amino acid patterns of breast cancer patients were most similar to the healthy group. Colon cancer patients showed increase levels in glycine, alanine and taurine. The liver cancer patients could conserve the branch-chained amino acids while most of the non-essential amino acid showed significant elevation. For lung cancer patients, there were no change in branch-
17
chained amino acids leucine and isoleucine. However many of the essential and non-essential amino acids showed significant decrease.
Body amino acid requirements are altered in the tumour-bearing state. Leucine requirement has shown to be increased in the presence of rapidly growing murine tumour (Lazo, 1980). Some malignant cells have specific requirements for methionine (Tisdale, 1980), serine and threonine (Pizer & Reagan�1972). Removal one of the amino acid by the tumour would lead to a depression of host protein synthesis, since normal protein synthesis requires the flill spectrum of amino acids. Disposal of the remaining amino acids has been postulated to explain the abnormal gluconeogenesis seen in cancer patient (Stein, 1978).
18

1.3 METHODOLOGY CHOSEN
A reverse-phase HPLC pre-column derivatizatiom method was going to be established to analyse the plasma amino acids. Compared with ion-exchange HPLC using post-column derivatization , the former had several advantages over the latter. Firstly, the efficiency of separation was higher in reverse-phase HPLC. Post-column derivatization was a tedious procedure while pre-column derivatization took several minutes to complete and usually done by automatic sampler. Pre-column derivatization could give very high sensitivity. No undesirable amino acids in the mobile phases would react with the derivatization agent and eluent baseline could be very stable. Lastly the whole set of instrument was not a dedicated one and could be easily shifted to other analysis.
o-phthaladehyde (OPA) was the derivatization of choice since it could give very high yield in fluorescence signal. The limit of detection could be down to fetomolar. It took about two minutes for he reaction to complete. The reaction required no elevation of temperature.
Deproteinization could be easily carried out using methanol precipitation method. Since the OPA itself was not fluorescence, no subsequent extraction of excess reagent by organic solvent was necessary.
19
In the presence of 2-mercaptoethanol, which was a reducing agent, OPA reacts with the amino group of primary amino acids to a produce fluorescence product alkyl-substituted isoindole. The reagent has no reaction with the secondary amino acids.
An autosampler was used to automate the derivatization steps. The autosampler took accurate amounts of sample and derivatization reagent from appropiate vial position in the instrument, mixed them and hold them for exactly a predefined interval for derivatization reaction to proceed, and finally inject them into the analytical column. Both the volume taken and duration for reaction were critical to produce reproducible result.
20
1.4 PATIENT SAMPLE CHOSEN Colorectal cancer, lung cancer and nasopharyngeal cancer are three very common disease in Hong Kong leading to mortality. In the study, the amino acid patterns of newly-diagnosed patients of the above cancer disease were studied.. In order to minimise other variables that may affect the amino acid concentrations, the patients should be free from other diseases such as liver disease, heart disease, renal disease and endocrine disease. Besides, the patients should not received any vigorous chemotherapy or radiotherapy.
21
2. OBJECTIVES 1. To establish a fully automated reverse-phase pre-column derivatization HPLC procedure for plasma amino acid analysis.
2. To study the amino acid pattems of colorectal, lung and nasopharyngeal cancer patients in Hong Kong.
22
3. MATERIALS AND METHOD
3.1 APPARATUS 3.1.1 HPLC System HPLC Hewlett Packard (Palo Alto, California, USA) HP 1050 with autosampler and pumps. The instrument has the capability that the needle probe can randomly access different vial positions under program assigned thus made derivatization of sample to be done automatically.
3.1.2 Column A Carbon 18 (C18) column, 250 mm X 4.6 mm I.D. with 5 |im particle size, was used,. It was made up of silica with a C18 hydrocarbon chain chemically bonded to the surface to reduce the polarity,sometimes referred as octadecyl silica (ODS). A guard column was installed just before the main analytical column to offer some protection for the latter.
3.1.3 Detector A fluorescence detector HP 1046A was used. The excitation wavelength was 230 nm while the emission wavelength was 418 nm.
23
3.1.4 ChemStation A desktop computer installed with software to monitor the operation of the 1050 pump and injector as well as the 1046A fluorescence detector. Besides, chromatographic signals can be integrated and analyzed and stored.
3.2 REAGENTS 3.2.1 Reagent and Chemical source All the chemicals and reagents, unless otherwise stated, were obtained from Sigma Chemical Company, St. Louis, USA.
3.2.2 Mobile phase
Amino acid separation was carried out by gradient elution. Two mobile phases were used. Different composition of the two mobile phase were mixed at different time during the run before being pumped to the analytical column. The composition of the mobile phases was adapted from Tumell & Cooper (1982). Solvent A consists of water, acetonitrile and a buffer. To prepare the buffer, a solution of 0.25M sodium propionate and 0.35M of Sodium dihydrogen phosphate was adjusted to pH 6.5 using 5 N NaOH. Then 150 ml of such buffer was mixed with 80 ml acetonitrile and 770 ml water. This makes up the total volume to 1000 ml with acetonitrile:buffer:water ratio equals to 8:15:77.
24 k.
Solvent B consists mainly of organic solvent. It has a acetonitrile:methanol:dimethylsuphoxide:water ratio 30:25:3:42. In 1000 ml such solution, it consists of 300 ml acetontrile, 250 ml methanol, 30 ml dimethylsulphoxide and 420 ml water.
The organic components of mobile phase were all filtered through 0.45 ^m nitrocellulose membrane while the inorganic parts were filtered through 0.45 |im flurocarbon membrane. The membrane were obtained from Millipore Corporation, (MA, USA).
The two solvents were degassed by pumping helium gas into them for a few minutes.
3.2.3 Derivatization Reagent 0-phthaladehyde (OPA) stock solution was prepared by dissolving 50 mg powder in 1 ml methanol. The stock solution was put in brown bottle in 4°C for at most three weeks. A 0.4 M sodium borate / boric acid buffer was then prepared To prepare a working OPA solution, 1476 ^1 ofthe borate buffer was used to mix with 60 ^1 stock OPA solution and 24 il 2-mercaptoethanol. The final solution has a OPA concentration 1.92 mg /ml and 2 mercaptoethanol concentration 1.5%. The working OPA solution was stable for only one day.
25
3.2.4 Standard preparation For each amino acid standard solution, suitable amount of amino acid standard was weighed to make 1 ml of stock solution with concentration of 40 |imoL^ml in O.lM HCL, except the 3-methylhistidine due to amount available. From the 40 ^moL'ml or 40,000 ^moLl. stock solution, suitable volume of each amino acid was taken out to make up the two levels of composite standards. The high standard has a concentration five times than that of the low standard. Their concentration ranges from 40 to 1000 ^imol/L depends on their concentration usually found in human body. The composite standards were aliquoted and stored in a -30�C freezer. Table 3.1 illustrate the amount of individual amino acid used as well as the volume of the stock standards used to make up 10 ml of each level ofcomposite standard.
26
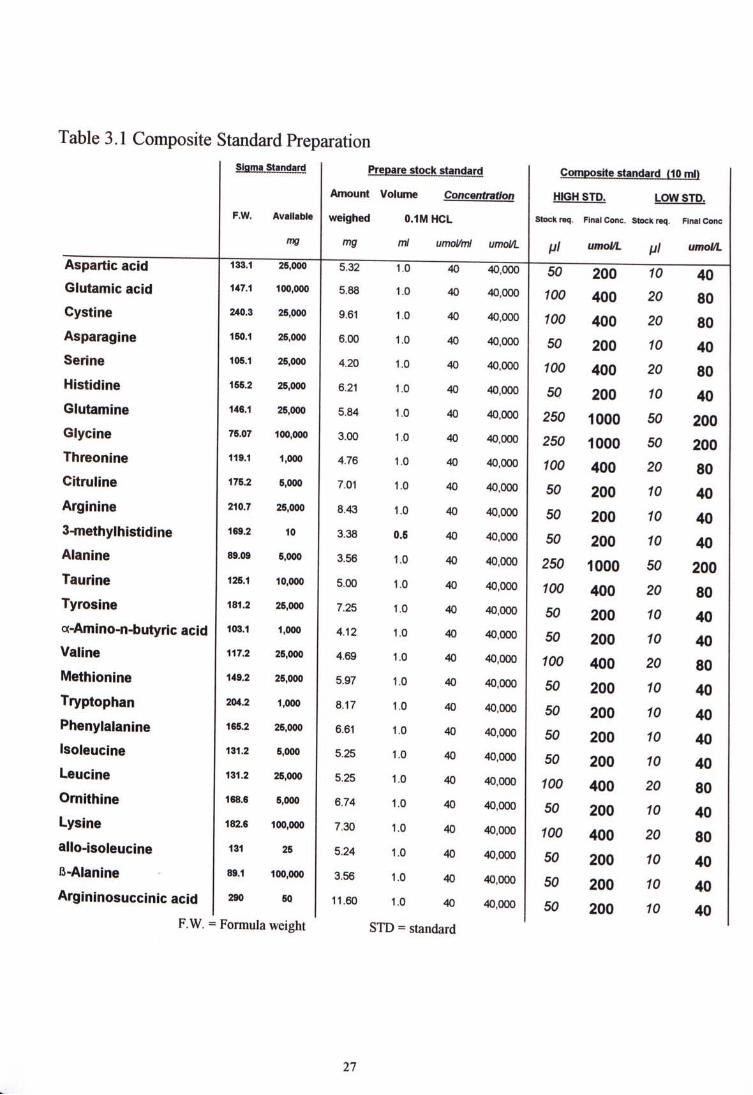
Table 3.1 Composite Standard Preparation Slflma Standard Prepare stock standard Composrte standard f10ml>
Amount Volume Concentration HIGH STD. LOW STD.
F.W. Available weighed 0.1MHCL stock req. FlnalConc. stockreq. FinalConc
哪 mg ml umoM umolA. "/ umoUL "/ umolA.
Aspartic acid ^ ^ ^ V6 ^ 40:^ ^ ^ j g ^ 5 —
Glutamic acid w . i 100.000 5.88 1.0 40 40,000 100 4 0 0 20 8 0
Cystine 240.3 26.000 9.61 1.0 40 40,000 1Q0 4Q0 20 8 0
Asparagine iso.i 25,000 e.oo 1.0 40 40,000 50 2OO 10 4 0
Serine ios.i 25.000 4.20 1.0 40 40,000 ioO 4 0 0 20 80
Histidine 1w.2 25.000 6.21 1.0 40 40,000 50 2OO 10 4 0
Glutamine i4s.i 25.000 5.84 1.0 40 40,000 250 1000 50 200
Glycine 75.07 100.000 3.00 1.0 40 40,000 250 1000 50 2 0 0
Threonine ii9.i 1.000 4.76 1.0 40 40.000 ioo 4 0 0 20 8 0
Citruline 175.2 5.000 7.01 1.0 40 40,ooo 50 2OO 10 4 0
Arginine 210.7 25.000 8.43 1.0 40 40,000 50 2OO 10 4 0
3^ethylh lst id lne 彻.2 io 3.38 o.s 40 40,000 50 2OO 10 4 0
Alanine 89.03 s.ooo 3.56 10 40 40,000 250 1000 50 2 0 0
Taurine 125.1 10.000 5.00 1.0 40 40.000 m 4OO 20 8 0
Tyrosine 飢2 26.ooo 7.25 1.0 40 40.000 50 2OO 10 4 0
o(-Amino-n-butyric acid i<>3.i 1.000 4.12 1.0 40 40,000 50 2OO 10 4 0
Va»ne 117.2 25.000 楊 i.o 40 40.000 m 4 O O 20 8 0
Methionine 149.2 25,000 5.97 1.0 4o 40,000 50 2OO 10 4 0
Tryptophan 204.2 1.000 a17 1.0 40 40,000 50 2OO 10 4 0
Phenylalanine 俯.2 2s,ooo e.6i 1.0 40 40,000 50 2OO 10 4 0
•soleucine 131.2 5.000 5.25 1.0 40 40.000 50 2OO 10 4 0
Leucjne 131.2 2,000 5.25 1.0 40 40.000 ,oo 4OO 20 8 0 Ornithine les.s 5,000 e 74 10 4n An nnn ir« i u 40 40,000 50 200 10 4 0 Lysine 删 ioo.ooo 7.30 1.0 40 40,000 ,oo 4OO 20 80
aIlo-isoIeucine i3i 25 5 .24 1 . 0 40 4o.ooo 5 0 2 O O fO 4 0
ii-Alanine ss.i 100,000 356 10 an Annnn r« i u 如 叫咖 50 2 0 0 10 4 0
Argininosuccinic acid 浏 so n.eo 1.0 40 40.000 50 2OO 10 4 0
F.W. = Formula weight STD = standard
27
3.2.5 Internal standard Two internal standards, homoserine and norvaline were used. A solution consists of 600 ^molA. of each internal standard in O.lM HCL was prepared. The internal standard was aliquoted and stored in -30°C freezer
3.3 SAMPLE PREPARATION
In an eppendorf tube, 50 ^1 heparin plasma or composite standard solution was added to 30 ^1 internal standard solution. To precipitate out the protein, 420 ^1 methanol added. The mixture was vortexed for 30 seconds and centrifuged at 10000 g for 5 minutes. After centrifUgation, 100 jiil supematant was put into a HPLC vial.( vials obtained from Hewlett Packard). Then 30 il iodoacetic acid with concentration 80 mmoLL was added. The vials were vortexed and ready for injection.
28
3.4 CHROMATOGRAPHIC CONDITIONS
3.4.1 Column Temperature Chromatographic separation was carried out at 30�C. The column chamber was maintain at the required temperature by heating blocks.
3.4.2 Injector Program •
The autosampler can hold 21 injection vials. The vial 1 was reserved to place the OPA derivatization reagent. An additional vial with Solvent A was placed in position 2. Such vial serves the purpose of rinsing the exterior side of the injection needle after aspirating the sample.
In the injection program, OPA solution was drawn first, followed by sample. Then the needle was inserted into vial 2 in which solvent A was used to rinse the exterior side of the needle and finally dipped into vial 1 again so that another portion of OPA could be drawn. The OPA and the sample mixture were mixed in the sample loop by the movement of the needle piston.
Just before injection into the analytical column, the mixture was held for certain period to give enough time for derivatization of the amino acid by OPA.
Table 3-2 shows the autosampler program used.
29
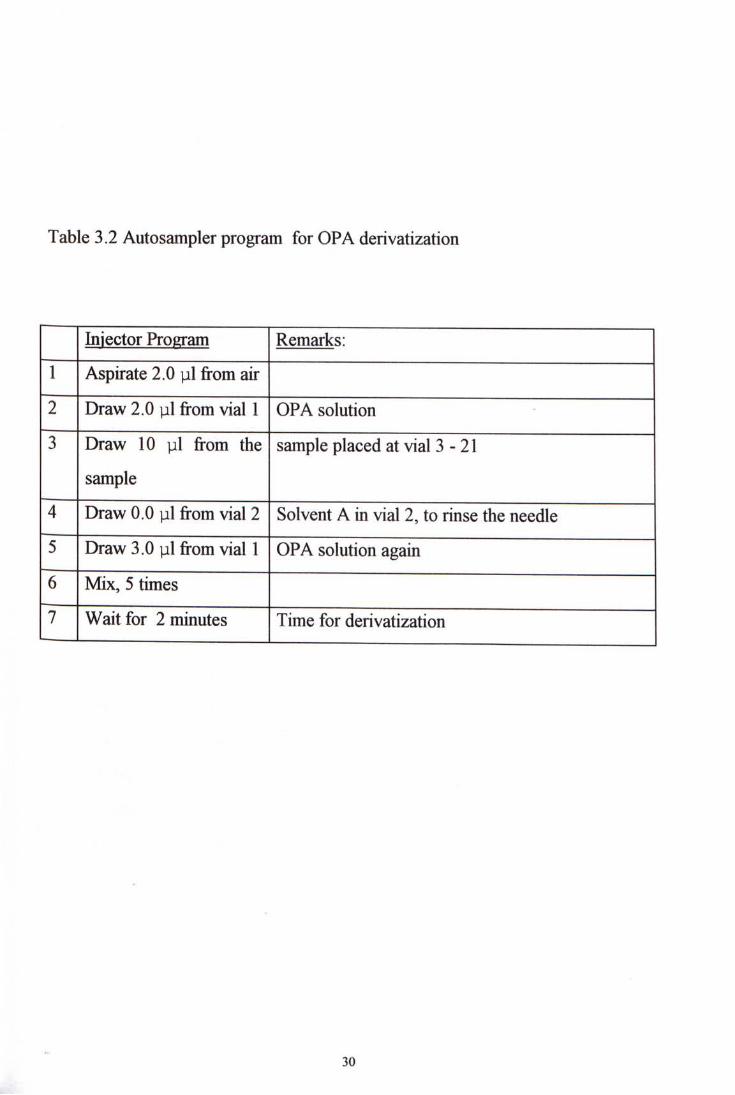
Table 3.2 Autosampler program for OPA derivatization
hiiector Program Remarks: 1 Aspirate 2.0 口1 from air 2 Draw 2.0 yd from vial 1 OPA solution 3 Draw 10 yl from the sample placed at vial 3 - 21
sample 4 Draw 0.0 yil from vial 2 Solvent A in vial 2, to rinse the needle 5 Draw 3.0 ^1 from vial 1 OPA solution again 6 Mix, 5 times 7 Wait for 2 minutes Time for derivatization
‘ 30
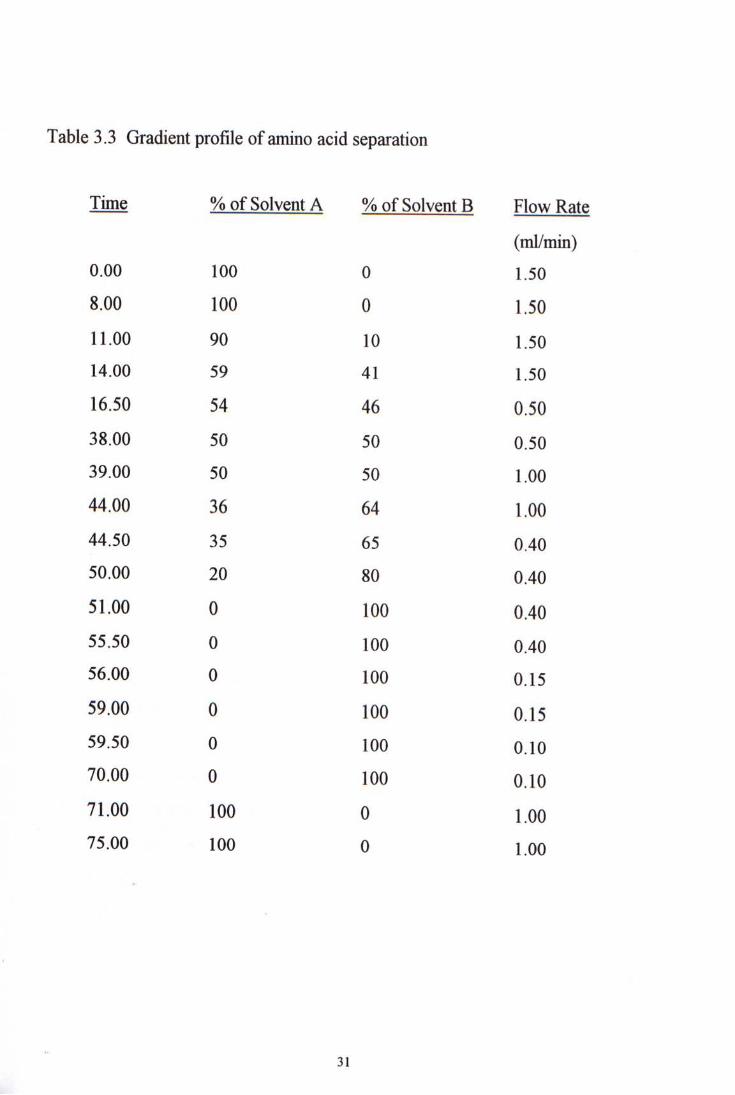
Table 3.3 Gradient profile of amino acid separation
Time %ofSolventA %ofSolventB Flow Rate (rnVmin)
0.00 100 0 1.50 8.00 100 0 1.50
11.00 90 10 1.50 14.00 59 41 1.50 16.50 54 46 0.50 38.00 50 50 0.50 39.00 50 50 1.00 44.00 36 64 1.00 44.50 35 65 0.40 50.00 20 80 0.40 51.00 0 100 0.40 55.50 0 100 0.40 56.00 0 100 0.15 59.00 0 100 0.15 59.50 0 100 0.10 70.00 0 100 0.10 71.00 100 0 1.00 75.00 100 0 1.00
31
3.4.3 Time Table for gradient elution and flow program
After optimization, the time necessary for individual run was 75 minutes. The amount of solvent A decreases gradually during the run from 100% to 0% while the solvent B increases gradually. To enhance good resolution and even distribution of the eluted amino acid peaks in the chromatogram, the flow rate in the run varied from 0.15 to 15 ml/min. Table 3-3 is the time table for gradient elution and flow program
3.5 OPTIMIZATION
3.5.1 OPA and sample Ratio and Volume The ratios 1:1, 1:2,1:3 and 1:4 was tried in order to find out a suitable composition of derivatization agent and methanol-treated sample. The total injection volume was at that stage arbitrary fixed to 12 il. For example, to get a 1:1 ratio, 6 pil OPA was mixed with 6^1 treated sample while for ratio 1:2, 4yil OPA would be mixed with 8 ^1 treated sample, and so on. After obtaining a suitable ratio, different total injection volume was tried based on the ratio just obtained.
‘ 32
3.5.2 Derivatization Concentration A stock OPA solution was prepared by dissolving 50 mg powder in 1 ml methanol. Different concentrations of OPA was tried in order to find out the amount that was enough to derivatize all the amino acids present. Different amount of stock OPA was taken out to dissolve in the borate buffer solution, making concentration 1.92, 3.21 and 4.80 mg / ml. The 2-mercaptoethanol amount was adjusted accordingly giving concentration 1.5%, 2.6% and 3.8% respectively.
3.5.3 Derivatization time After the aspiration and mixing of OPA and treated sample, the mixture was held and kept waiting in the injection loop for certain period of time for the derivatization reaction . Different waiting times, 2 minutes, 3 minutes and 4 minutes, were tried out to find one with highest fluorescence signal.
33
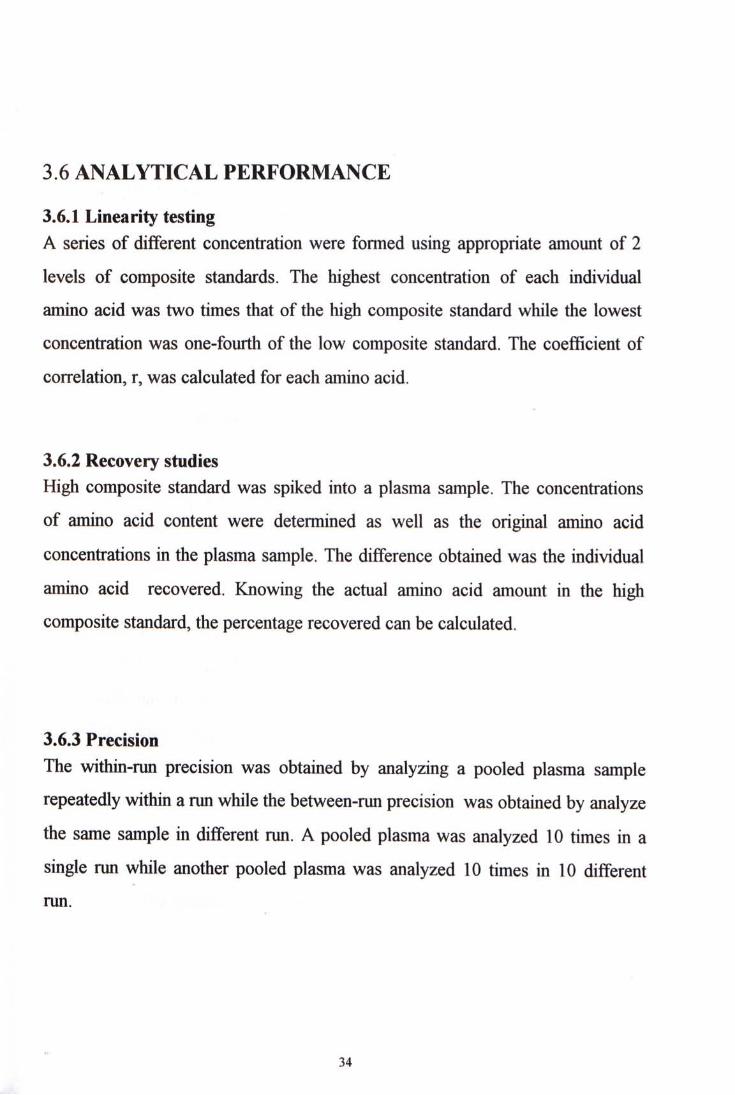
3.6 ANALYTICAL PERFORMANCE 3.6.1 Linearity testing A series of different concentration were formed using appropriate amount of 2 levels of composite standards. The highest concentration of each individual amino acid was two times that of the high composite standard while the lowest concentration was one-fourth of the low composite standard. The coefficient of correlation, r, was calculated for each amino acid.
3.6.2 Recovery studies High composite standard was spiked into a plasma sample. The concentrations of amino acid content were determined as well as the original amino acid concentrations in the plasma sample. The difference obtained was the individual amino acid recovered. Knowing the actual amino acid amount in the high composite standard, the percentage recovered can be calculated.
3.6.3 Precision The within-run precision was obtained by analyzing a pooled plasma sample repeatedly within a run while the between-run precision was obtained by analyze the same sample in different run. A pooled plasma was analyzed 10 times in a single nm while another pooled plasma was analyzed 10 times in 10 different run.
34
3.6.4Sample storage A sample was stored in different conditions for short term to study the amino acid content changes in the period. A fresh sample was analyzed immediately while the remain was divided into six lots. Three of them were treated with methanol to remove protein and stored at 4°C, -20°C and -70°C respectively. The other three portions were stored as untreated plasma in the same temperature conditions as the treated. All the six aliquots were stored for two weeks and after that storage period amino acid content was analyzed.
3.7 CLINICAL SAMPLE STUDIES The control group consists of 17 samples taken from 10 males and 7 females in Prince of Wales Hospital. Their age ranged from 23 to 46 with the median 33. Three groups of cancer patients were studied. They were colorectal cancer, lung cancer and nasopharyngeal cancer (NPC). The numbers of patient in each group were 10 ( 5 female and 5 female, with age ranged from 34 to 80 with median 69),
12 ( 8 male and 4 female, with age ranged 45 to 83 with median 72) and 12 (9 male and 3 female, age ranged from 31 to 64 with median 52) respectively. All the cancer samples were randomly ordered in sequence to be analyzed. After analysis, they were then sorted according to their cancer type.
About 10 ml blood was collected and put into 2 heparin bottles, each had amount about 5 ml. The plasma was separated for each bottle and aliquoted into 4-ml tubes.
35
3.8 STATISTICAL ANALYSIS
Since the Student t test assumes normality in sample distribution, The data will be subjected to normality testing by plotting on the histogram before applying the Student t test. Since the number of cases in each group was small, the data may be failed in the normality testing. In case of failure�the non-parametric test would be used. The Mann-Whitney U Test (or Wilcoxon Test) is a non-parametric counterpart of Student t test. It can test the difference between two independent means of each amino acid between the healthy control group and particular cancer group.
In Mann-Whitney U Test, all the data are ranked no matter they come from control group or cancer group. The rank for each group summed. A U value is then calculated for each group, and s test of significance is applied to U. Besides testing for individual amino acid in healthy group and the cancer group, the amino acids were also grouped into branched-chain amino acid (BCAA), aromatic amino acid (AAA), essential amino acid (EAA) and non-essential amino acid QSfEAA). valine, leucine and isoleucine are branched-amino acid; while phenylalanine, tyrosine and tryptophan under aromatic amino acids. For essential amino acids, there are valine, leucine, isoleucine, phenylalanine, tryptophan, threonine and lysine, and lastly, glutamic acid, glutamine, glycine, alanine, serine, asparagine and tyrosine are all grouped as non-essential amino acids. Finally , the averaged total amino acid content in each group of cancer patients will be compared with that ofhealthy group.
36
4 RESULT
4.1 CHROMATOGRAPHIC SEPARATION
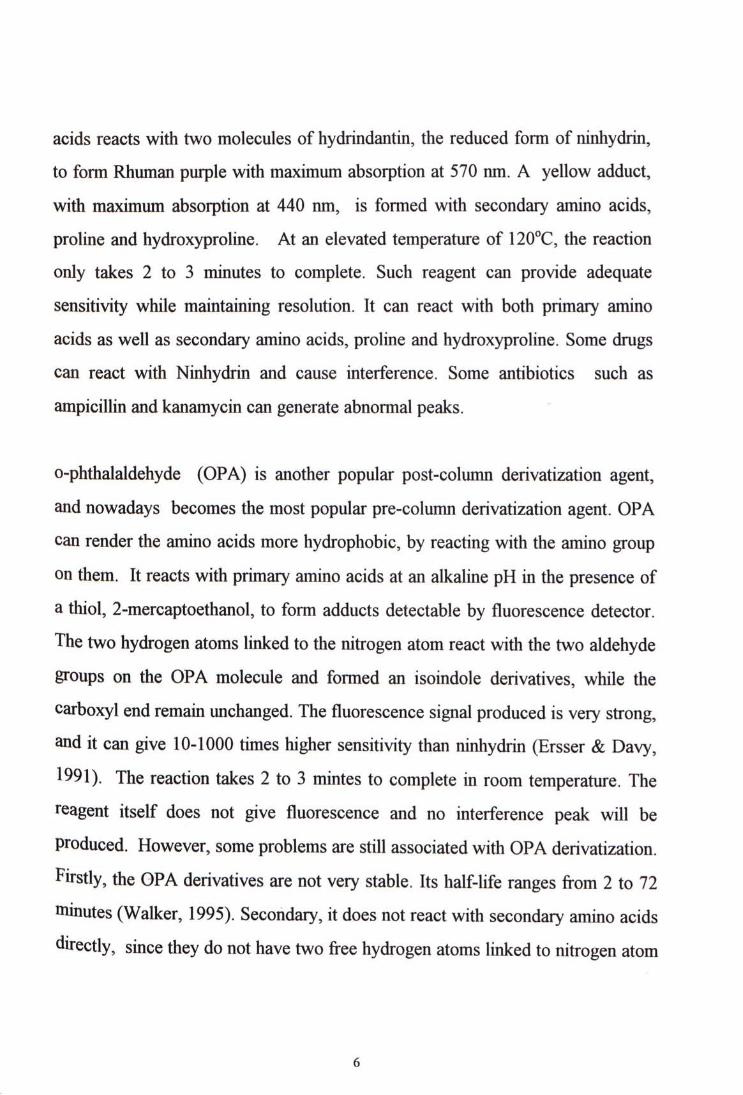
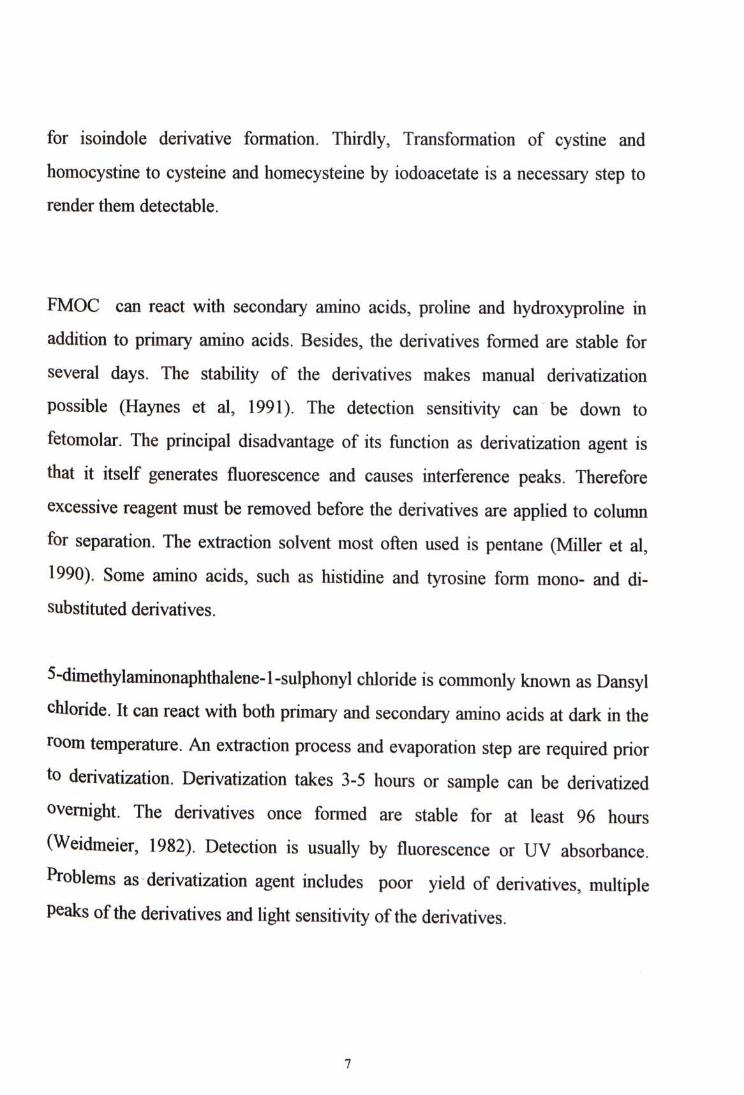
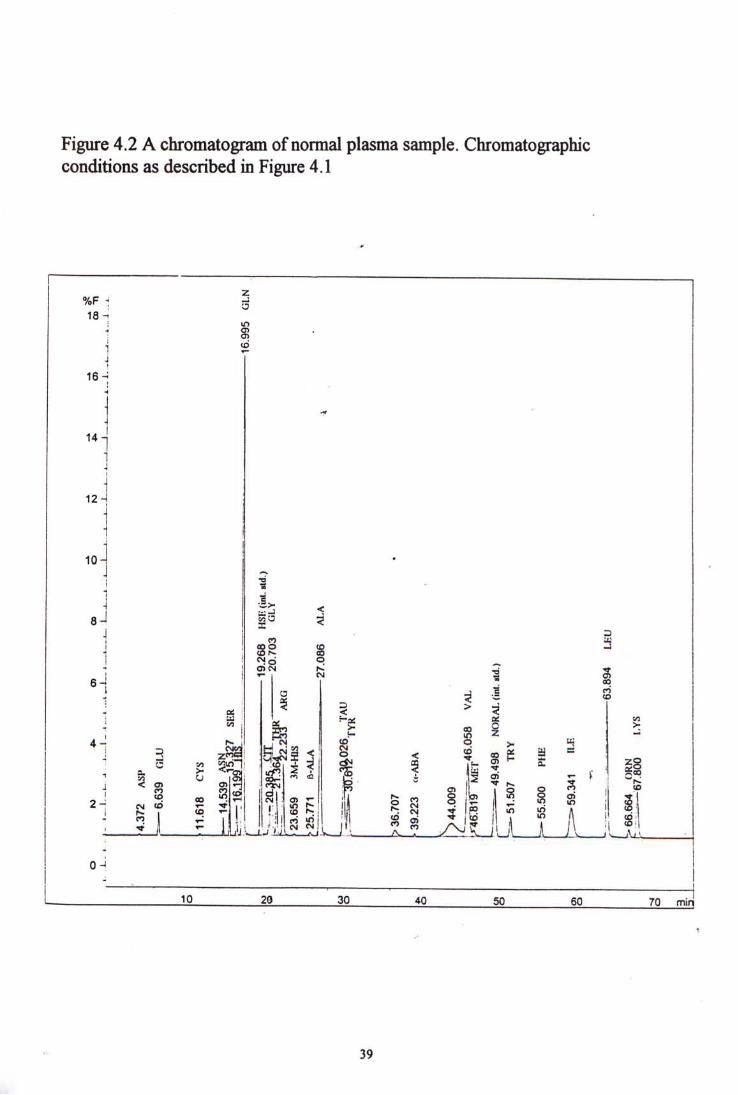
The 27 amino acids and 2 internal standards were resolved in 75 minutes. Distinct peaks were observed for all amino acids except there were partial overlapping peaks in citrulline and glycine. The first internal standard came out at about 20 minutes after injection and the second internal standard came out at about 50 minutes.
Chromatograms of the high level standard and a normal plasma sample are shown in figure 4-1 and 4-2 respectively.
The peaks came out in the first 35 minutes were governed by the first internal standard homoserine. The peak area ratio (PAR) was determined by dividing the peak area of particular amino acid by the peak area of homoserine. Similarly the peak area ratios of the amino acids came out after 35 minutes were worked out by reference to the peak area of the second internal standard, norvaline.
37 k.
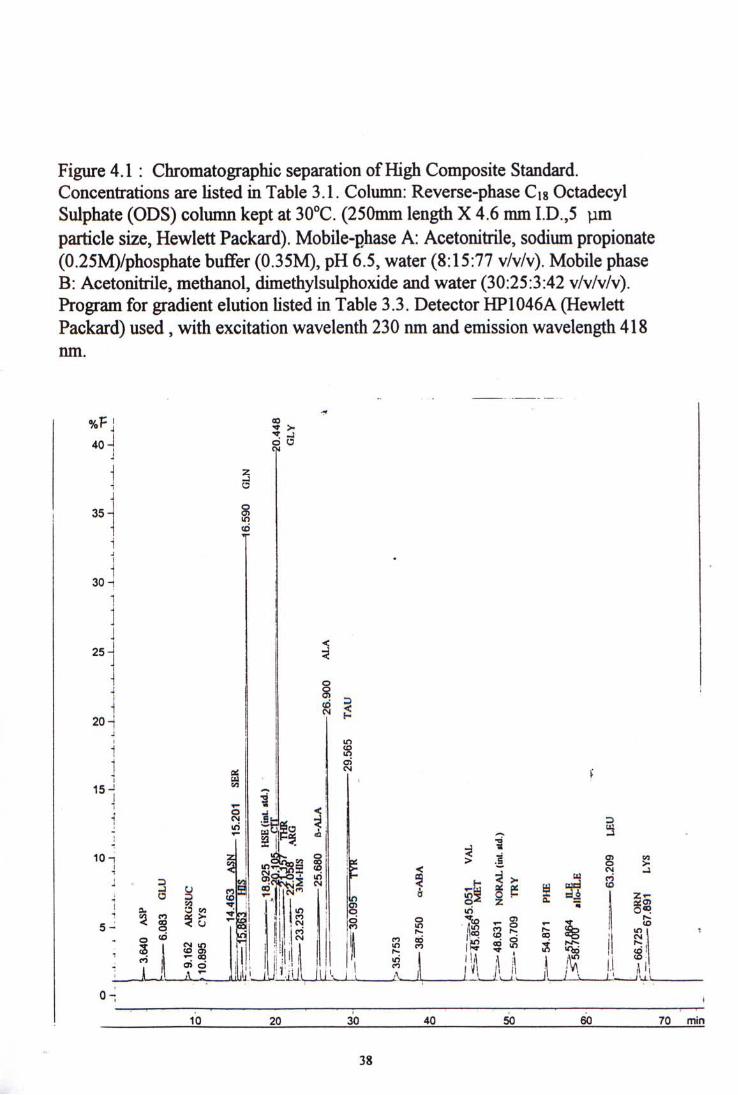
Figure 4.1 : Chromatographic separation ofHigh Composite Standard. Concentrations are Usted in Table 3.1. Column: Reverse-phase Cig Octadecyl Sulphate (ODS) column kept at 30�C. (250mm length X 4.6 mm I.D.,5 pm particle size, Hewlett Packard). Mobile-phase A: Acetonitrile, sodium propionate (0.25M)/phosphate buffer (0.35M), pH 6.5, water (8:15:77 v/v/v). Mobile phase B: Acetonitrile, methanol, dimethylsuIphoxide and water (30:25:3:42 v/v/v/v). Program for gradient elution Usted in Table 3.3. Detector HP1046A ^Hewlett Packard) used,with excitation wavelenth 230 nm and emission wavelength 418 nm.
^
o/t I 2 � O j 譯二 40"! ? � I _ ] z
_} i o 35- § cd ^
j I • 1 •
30^ I 1 I
25- I I _ . J (0 5
CM 2 20i I — I ! ir> 1 S ] at: i ^ i ,.\ S 丨‘ 151 is ] 5 Z ! <: 1 g f , i …丨 , i •
n , . , ^ i l l 1 f I ^J> ”, 1 5 ] . / I , i j ir: ‘ f 囊 ' ^ ^ i i 5」 ! i 乏匕 I |1 f „ I 离 §1 s fe ! .T , : i s g , Hi,! I s 7 jf?专? ^ 祐 S i t i ? jil !l!i '!li iu. !i ^ ) 1¾ 1 ji I R 11 !ii
0- 二 jO 20 30 ^ 0 §0 70 min 38
「咖 ^
MA.1 008
zw—].
M -上
NH()
藥99丄
33
t^®.c9
—IV
MM^
.c f
j
.^
s
?«.SAA^
M
&b HHd
009
½
»A
她 g
AH1
§si^
ro
i:u!)TVHON
96,?一=-=儿
c TVA
i.^^pfe^
e.
600.寸入
M j
。
肪 <ffl<.c
Kse
s g
.
§.9e
<
^
=v,19l_!f:
S
g
M. ,
v、w
990Z2
iM^
o 4
VTV-a
S.S2^
n
S2.2f
699C2
^.^
《^d
!h,k^M^M o
m F
(
2:u5isH 99z.6r
—七、).
uar.^rH
2
ra- .m
N’10
66,9l
1
,.
,^tl^1^v^^
i>d
菌
h^@m^
to e
昏
6€5>|.丄
对r9
m
SAO
85.u
= .
^ s
3JC
§.w
IJ
A a
^ S
I
!
4. o
c 一-c
;
.-H:I.
,J,;—_
_-—_—---T-—lJ,--.—1J _
ri1-I
——I
J-I---lr,
—J-^1,ir
—Ji-r:r JJ;i,
-
..
-
J
.,
^ .^
M
w
8
6
4
2
o
s S

4.2 OPTIMIZATION
4.2.1 OPA and sample Ratio and Volume
In the OPA and sample ratio studies, keeping the total injection volume 12.0 pl, the OPA amount decreases as the treated sample drawn increases. From Table 4-1, we can see that the fluorescence increases as the amount of sample volume increased,up to the ratio 4pl: 8pl. Further increase in sample volume or decrease in ratio shows no further signal increment. So, a OPA to sample volume of 1:2 seems to be suitable.
h the second part ofthe optimization, different total injection volume were tried while keeping the OPA to sample ratio 1:2. From Table 4-2,we can see that as the amount of OPA and sample volume increases, the fluorescence increased up to total injection volume 15 viL. No significant increase in fluorescence could be observed as the total injection volume was further increased to 18 pL. Bearing in mind that increase in total injection would cause decrease in peak resolution, so, the total injection volume was kept to 15 yiL for further studies.
40
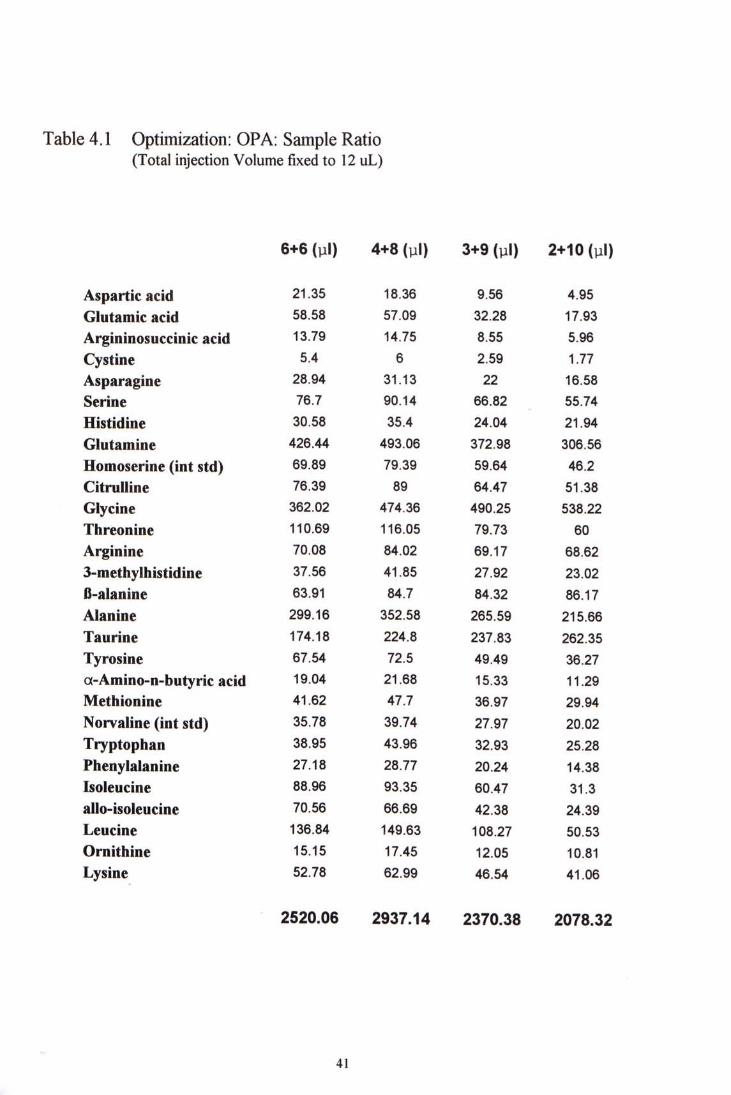
Table 4.1 Optimization: OPA: Sample Ratio (Total injection Volume fixed to 12 uL)
6+6 (vil) 4+8(pl) 3+9 (ul) 2+10(ul)
Aspartic acid 21.35 18.36 9.56 4.95 Glutamic acid 58.58 57.09 32.28 17.93 Argininosuccinic acid 13.79 14.75 8.55 5.96 Cystine 5.4 6 2.59 1.77 Asparagine 28.94 31.13 22 16.58 Serine 76.7 90.14 66.82 55.74 Histidine 30.58 35.4 24.04 21.94 Glutamine 426.44 493.06 372.98 306.56 Homoserine (int std) 69.89 79.39 59.64 46.2 Citrulline 76.39 89 64.47 51.38 Glycine 362.02 474.36 490.25 538.22 Threonine 110.69 116.05 79.73 60 Arginine 70.08 84.02 69.17 68.62 3-methylhistidine 37.56 41.85 27.92 23.02 0-alanine 63.91 84.7 84.32 86.17 Alanine 299.16 352.58 265.59 215.66 Taurine 174.18 224.8 237.83 262.35 Tyrosine 67.54 72.5 49.49 36.27 a-Amino-n-butyric acid 19.04 21.68 15.33 11.29 Methionine 41.62 47.7 36.97 29.94 Norvaline (int std) 3578 39.74 27.97 20.02 Tryptophan 38.95 43.96 32.93 25.28 Phenylalanine 27.18 28.77 20.24 14.38 Isoleucine 88.96 93.35 60.47 31.3 alio-isoIeucine 70.56 66.69 42.38 24.39 Leucine 136.84 149.63 108.27 50.53 Ornithine 15.15 17.45 12.05 10.81 Lysine 52.78 62.99 46.54 41.06
2520.06 2937.14 2370.38 2078.32
41
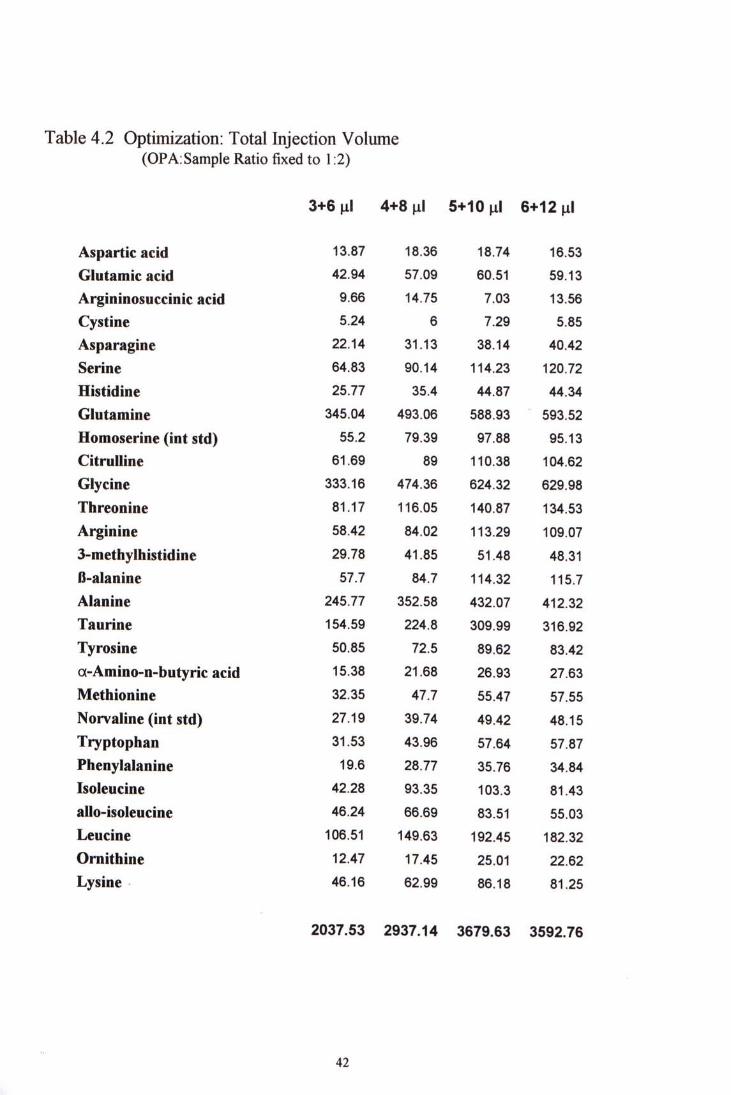
Table 4.2 Optimization: Total Injection Volume (OPA:Sample Ratio fixed to 1:2)
3+6 d 4+8 d 5+10 il 6+12nl Aspartic acid 13.87 18.36 18.74 16.53 Glutamic acid 42.94 57.09 60.51 59.13 Argininosuccinic acid 9.66 14.75 7.03 13.56 Cystine 5.24 6 7.29 5.85 Asparagine 22.14 31.13 38.14 40.42 Serine 64.83 90.14 114.23 120.72 Histidine 25.77 35.4 44.87 44.34 Glutamine 345.04 493.06 588.93 593.52 Homoserine (int std) 55.2 79.39 97.88 95.13 Citrulline 61.69 89 110.38 104.62 Glycine 333.16 474.36 624.32 629.98 Threonine 81.17 116.05 140.87 134.53 Arginine 58.42 84.02 113.29 109.07 3-methyIhistidine 29.78 41.85 51.48 48.31 fi-alanine 57.7 84.7 114.32 115.7 Alanine 245.77 352.58 432.07 412.32 Taurine 154.59 224.8 309.99 316.92 Tyrosine 50.85 72.5 89.62 83.42 a-Amino-n-butyric acid 15.38 21.68 26.93 27.63 Methionine 32.35 47.7 55.47 57.55 Norvaline (int std) 27.19 39.74 49.42 48.15 Tryptophan 31.53 43.96 57.64 57.87 Phenylalanine 19.6 28.77 35.76 34.84 Isoleucine 42.28 93.35 103.3 81.43 allo-isoleucine 46.24 66.69 83.51 55.03 Leucine 106.51 149.63 192.45 182.32 Ornithine 12.47 17.45 25.01 22.62 Lysine 46.16 62.99 86.18 81.25
2 0 3 7 . 5 3 2 9 3 7 . 1 4 3 6 7 9 . 6 3 3 5 9 2 . 7 6
42
4.2.2 Derivatization time
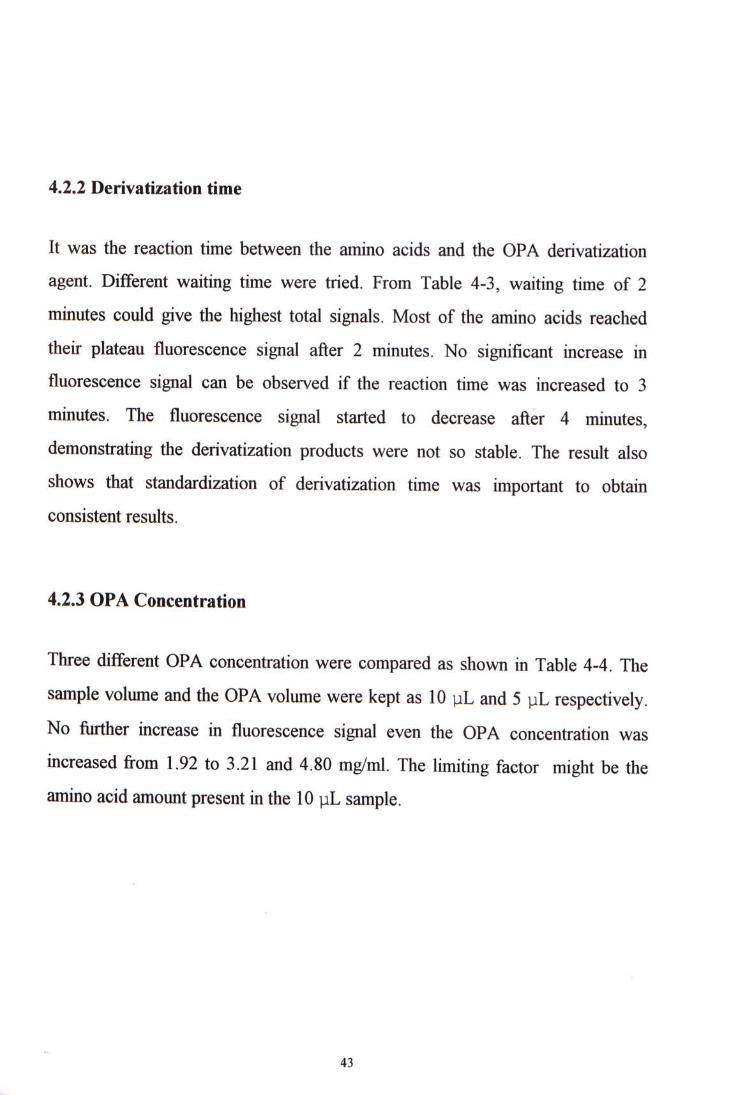
It was the reaction time between the amino acids and the OPA derivatization agent. Different waiting time were tried. From Table 4-3, waiting time of 2 minutes could give the highest total signals. Most of the amino acids reached their plateau fluorescence signal after 2 minutes. No significant increase in fluorescence signal can be observed if the reaction time was increased to 3 minutes. The fluorescence signal started to decrease after 4 minutes, demonstrating the derivatization products were not so stable. The result also shows that standardization of derivatization time was important to obtain consistent results.
4.2.3 OPA Concentration
Three different OPA concentration were compared as shown in Table 4-4. The sample volume and the OPA volume were kept as 10 pL and 5 pL respectively. No further increase in fluorescence signal even the OPA concentration was increased from 1.92 to 3.21 and 4.80 mg/mL The limiting factor might be the amino acid amount present in the 10 pL sample.
43
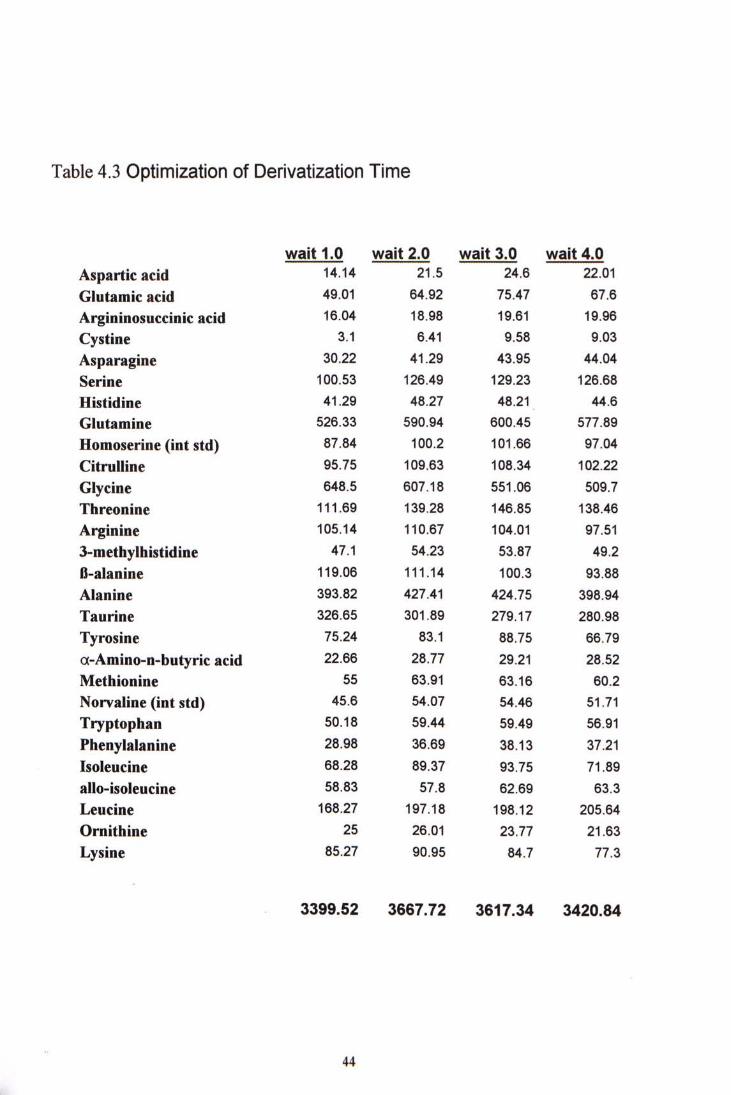
Table 4.3 Optimization of Derivatization Time
wait 1.0 wait 2.0 wait 3.0 wait 4.0 Aspartic acid 14.14 21.5 24.6 i T o i Glutamic acid 49.01 64.92 75.47 67.6 Argininosucdnic acid 16.04 18.98 19.61 19.96 Cystine 3.1 6.41 9.58 9.03 Asparagine 30.22 41.29 43.95 44.04 Serine 100.53 126.49 129.23 126.68 Histidine 41.29 48.27 48.21 44.6 Glutamine 526.33 590.94 600.45 577.89 Homoserine (int std) 87.84 100.2 101.66 97.04 Citrulline 95.75 109.63 108.34 102.22 Glycine 648.5 607.18 551.06 509.7 Threonine 111.69 139.28 146.85 138.46 Arginine 105.14 110.67 104.01 97.51 3-methylhistidine 47.1 54.23 53.87 49.2 fi-alanine 119.06 111.14 100.3 93.88 Alanine 393.82 427.41 424.75 398.94 Taurine 326.65 301.89 279.17 280.98 Tyrosine 75.24 83.1 88.75 66.79 a-Amino-n-butyric acid 22.66 28.77 29.21 28.52 Methionine 55 63.91 63.16 60.2 Norvaline (int std) 45.6 54.07 54.46 51.71 Tryptophan 50.18 59.44 59.49 56.91 Phenylalanine 28.98 36.69 38.13 37.21 IsoIeucine 68.28 89.37 93.75 71.89 allo-isoleucine 58.83 57.8 62.69 63.3 Leucine 168.27 197.18 198.12 205.64 Ornithine 25 26.01 23.77 21.63 Lysine 85.27 90.95 84.7 77.3
3399.52 3667.72 3617.34 3420.84
44
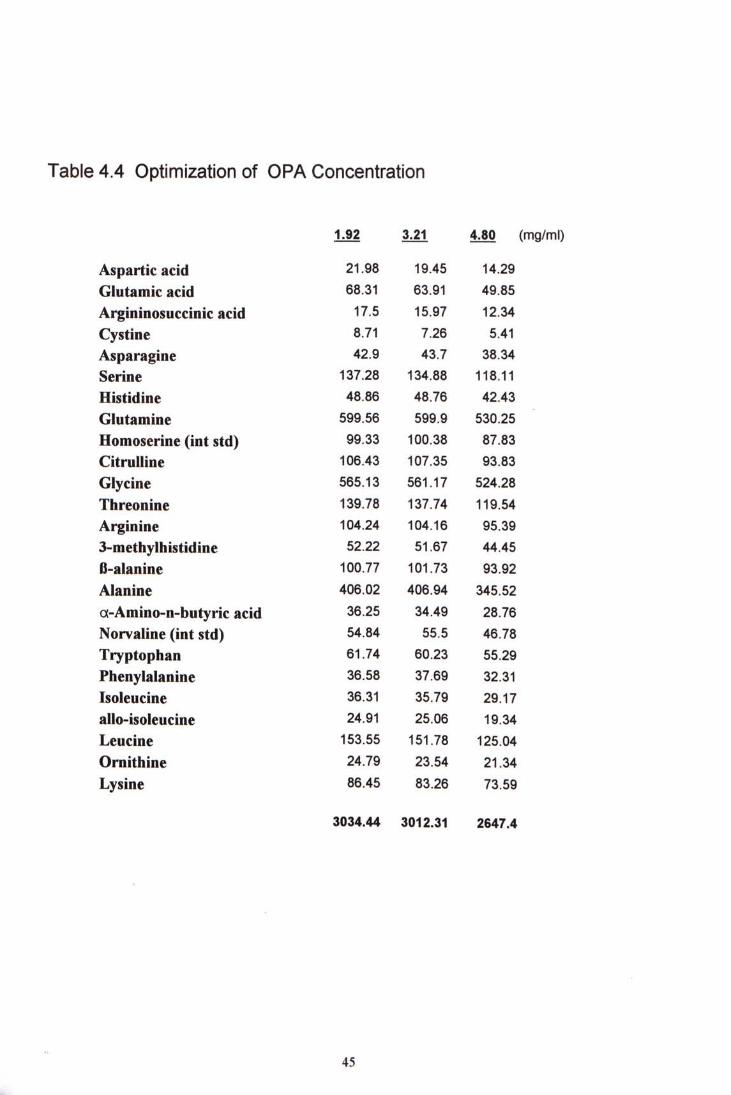
Table 4.4 Optimization of OPA Concentration
1.92 3.21 4.80 (mg/ml)
Aspartic acid 21.98 19.45 14.29 Glutamic acid 68.31 63.91 49.85 Argininosuccinic acid 17.5 15.97 12.34 Cystine 8.71 7.26 5.41 Asparagine 42.9 43.7 38.34 Serine 137.28 134.88 118.11 Histidine 48.86 48.76 42.43 Glutamine 599.56 599.9 530.25 Homoserine (int std) 99.33 100.38 87.83 Citrulline 106.43 107.35 93.83 Glycine 565.13 561.17 524.28 Threonine 139.78 137.74 119.54 Arginine 104.24 104.16 95.39 3-methylhistidine 52.22 51.67 44.45 0-alanine 100.77 101.73 93.92 Alanine 406.02 406.94 345.52 a-Amino-n-butyric acid 36.25 34.49 28.76 Norvaline (int std) 54.84 55.5 46.78 Tryptophan 61.74 60.23 55.29 Phenylalanine 36.58 37.69 32.31 Isoleucine 36.31 35.79 29.17 allo-isoleucine 24.91 25.06 19.34 Leucine 153.55 151.78 125.04 Ornithine 24.79 23.54 21.34 Lysine 86.45 83.26 73.59
3034.44 3012.31 2647.4
45
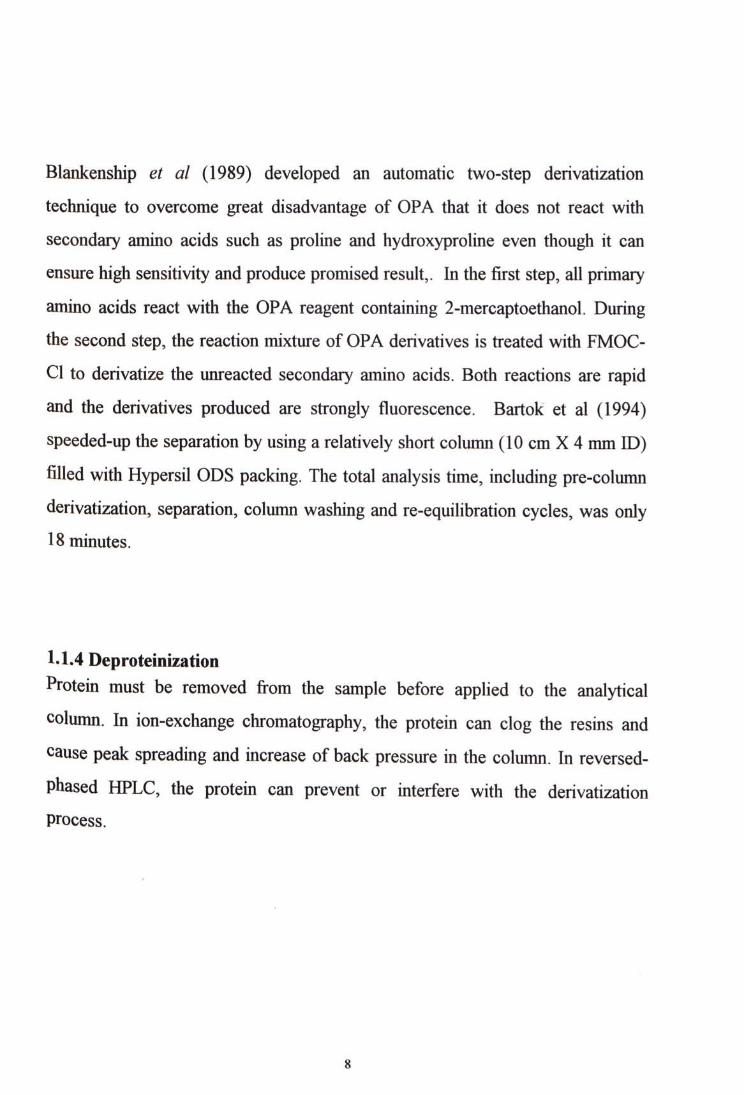
4.3 ANALYTICAL PERFORMANCE 4.3.1 Linearity The coefficients of correlation were calculated by plotting the peak area ratio , that was, the ratio of peak area of individual amino acid to that of the internal standard, against their concentrations. The linearity of the calibration curve could then be inspected. The r values for different amino acids were ranges from 0.992 to 1.000. Such values indicates that the linearity's of the amino acids hold over wide ranges such as 10-400,20-800 and 50-2000 ^ o L L . The ranges can cover the amino acids amount in the most clinical samples. Figure 4-3 shows an example of the linear calibration curve formed. Linearity held over the range 50-2000 ^moLl. for glutamine. Table 4-5 shows the coefficients of correlation of different amino acids.
4.3.2 Recovery studies A plasma sample was spiked with high composite standard. Both the spiked and non-spiked plasma samples were analyzed. The percentage recovery was calculated from the following equation.
Total amino acid measured - Amino acid in plasma sample measured % recovery = X 100%
Amount of amino acid in composite standard
Table 4-6 shows the percentage recovery of different amino acids. Their recovery ranges from 83% to 116 %.
46
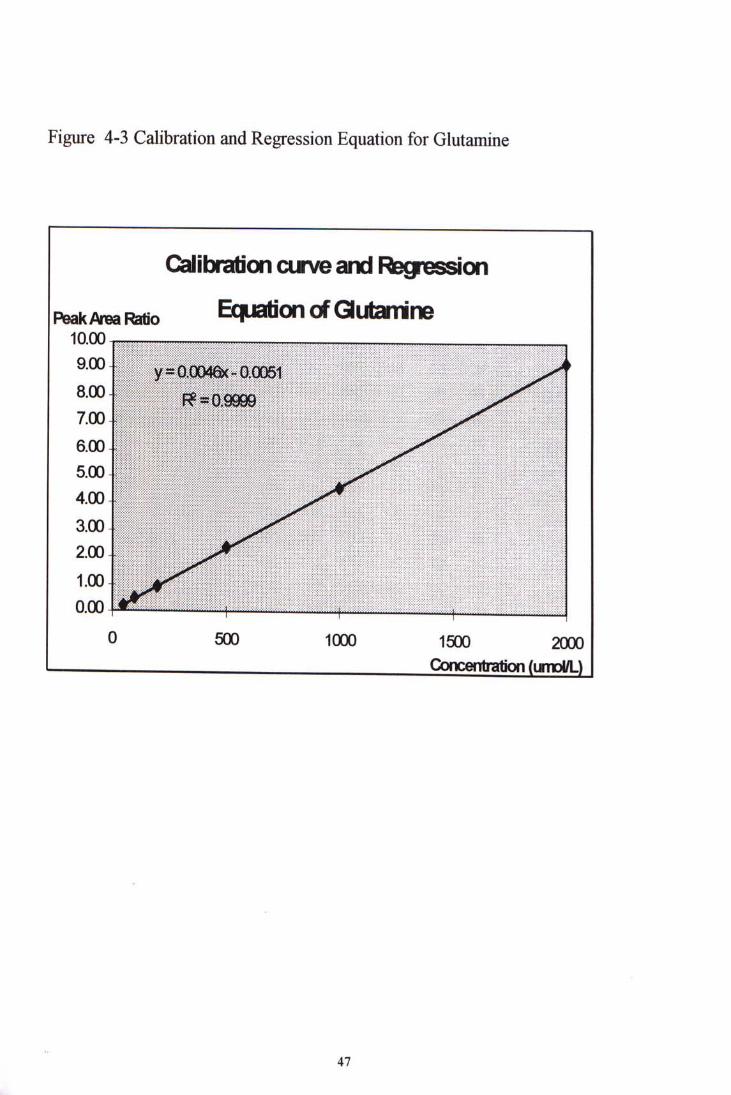
Figure 4-3 Calibration and Regression Equation for Glutamine
Calibration ojve and Regression
PfeakAreaRatio Ec^aBon of Qutamine 10.00
9-° y«0,OD46(-0.005l ^ 8 ^ P?«Q,9900 ^ ^ 7.00-� ^ ^ 6 . 0 0 一 ^ ^
5.00-� ^ ^ 4.00� ^ ^ 3.00 ^ y ^ 2.00-、 ^ ^ ^
1.00、^/r o . o o M _ f 1 ^ _
0 500 1000 1500 2000 COncerrtration{umDi/L)
47
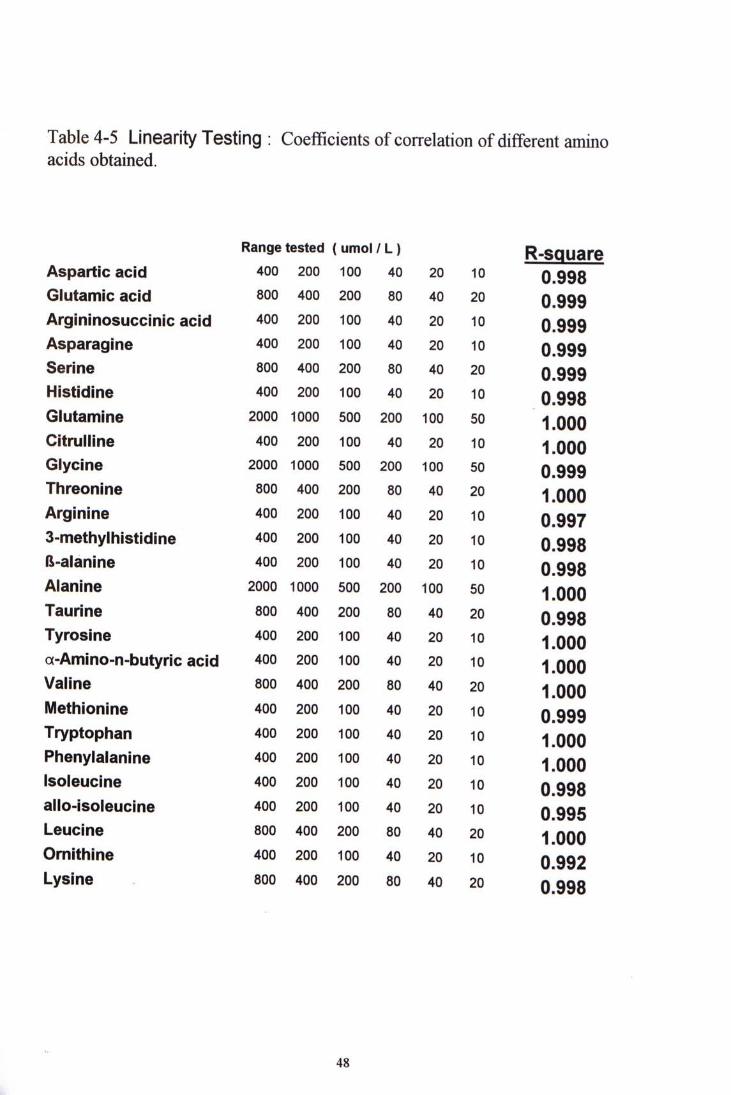
Table 4-5 Linearity Testing : Coefficients ofcorrelation ofdifferent amino acids obtained.
Range tested ( umol IL ) R-Square Aspartic acid 400 200 100 40 20 10 0.998 Glutamic acid 800 400 200 80 40 20 0_999 Argininosuccinic acid 400 200 100 40 20 10 0.999 Asparagine 400 200 100 40 20 10 Q ggg Serine 800 400 200 80 40 20 Q 999 Histidine 400 200 100 40 20 10 Q ggg Glutamine 2000 1000 500 200 100 50 1 QQQ Citrulline 400 200 100 40 20 10 1 QQQ Glycine 2000 1000 500 200 100 50 0 999 Threonine 800 400 200 80 40 20 1 QQQ Arginine 400 200 100 40 20 10 Q ggy 3-methylhistidine 400 200 100 40 20 10 Q ggg fl-alanine 400 200 100 40 20 10 Q 99g Alanine 2000 1000 500 200 100 50 1 QQQ Taurine 800 400 200 80 40 20 Q 993 Tyrosine 400 200 100 40 20 10 1 QQQ
a-Amino-n-butyric acid 400 200 100 40 20 10 1000 Valine 800 400 200 80 40 20 1 QQQ Methionine 400 200 100 40 20 10 � g g g
Tryptophan 400 200 100 40 20 10 1 QQQ Phenylalanine 400 200 100 40 20 10 1 QQQ lsoleucine 400 200 100 40 20 10 Q 993 allo-isoleucine 400 200 100 40 20 10 Q gg^ Leucine 800 400 200 80 40 20 1 QQQ Ornithine 400 200 100 40 20 10 Q 的2
Lysine 800 400 200 80 40 20 Q gg3
48
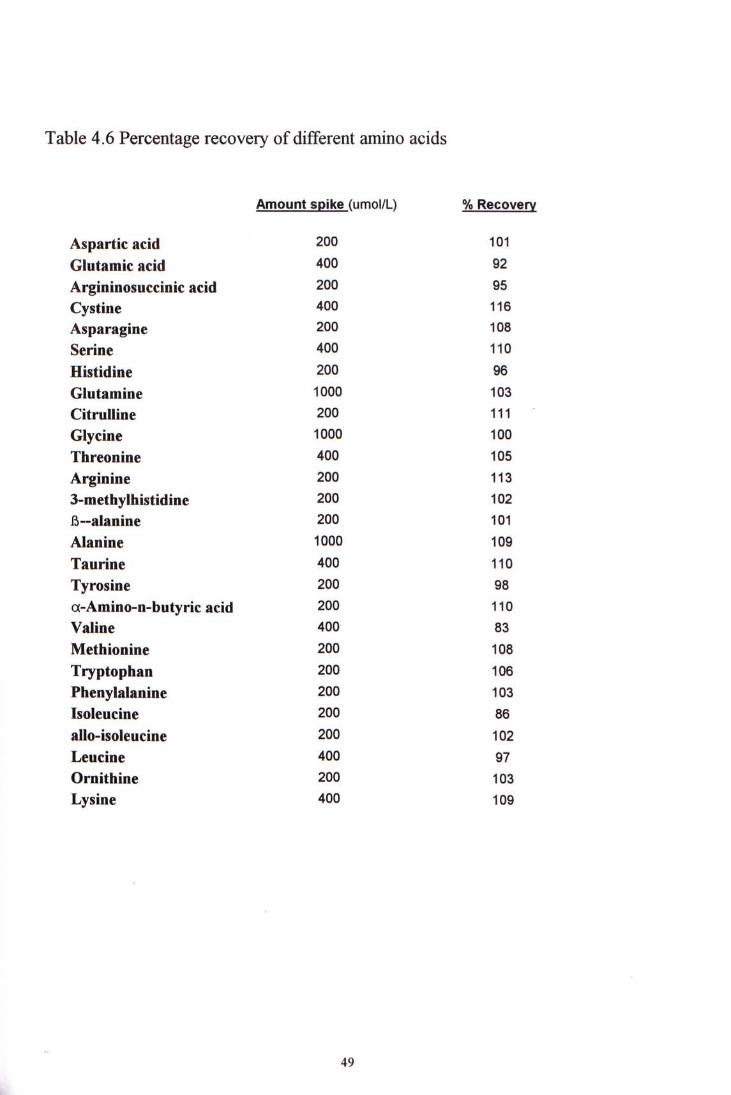
Table 4.6 Percentage recovery of different amino acids
Amount spike (umol/L) % Recovery
Aspartic acid 200 101 Glutamic acid 400 92 Argininosuccinic acid 200 95 Cystine 400 116 Asparagine 200 108 Serine 400 110 Histidine 200 96 Glutamine 1000 103 Citrulline 200 111 Glycine 1000 100 Threonine 400 105 Arginine 200 113 3-methylhistidine 200 102 fi—alanine 200 101 Alanine 1000 109 Taurine 400 110 Tyrosine 200 98 a-Amino-n-butyric acid 200 110 Valine 400 83 Methionine 200 108 Tryptophan 200 106 Phenylalanine 200 103 Isoleucine 200 86 allo-isoleucine 200 102 Leucine 400 97 Ornithine 200 103 Lysine 400 109
49

4.3.3 Precision Studies
4.3.3.1 Within-run precision A pooled plasma sample was analyzed 10 times in a single run. The CV ranged from 2.4% to 8.8 % with an average 4.7%. Table 4.7 shows the within-run precision.
4.3.3.2 Between-run precision y^(5ther plasma sample was analyzed 10 times in ten different run. The CV
X ' •
ranged from 2.3% to 10.9% with the exception of aspartic acid (13.7%) and 3-methylhistidine (14.1%). The amino acid glutamine and alanine, with CV 2.9% and 2.3% respectively demonstrate the highest precision. Table 4.8 shows the between-run precision.
50
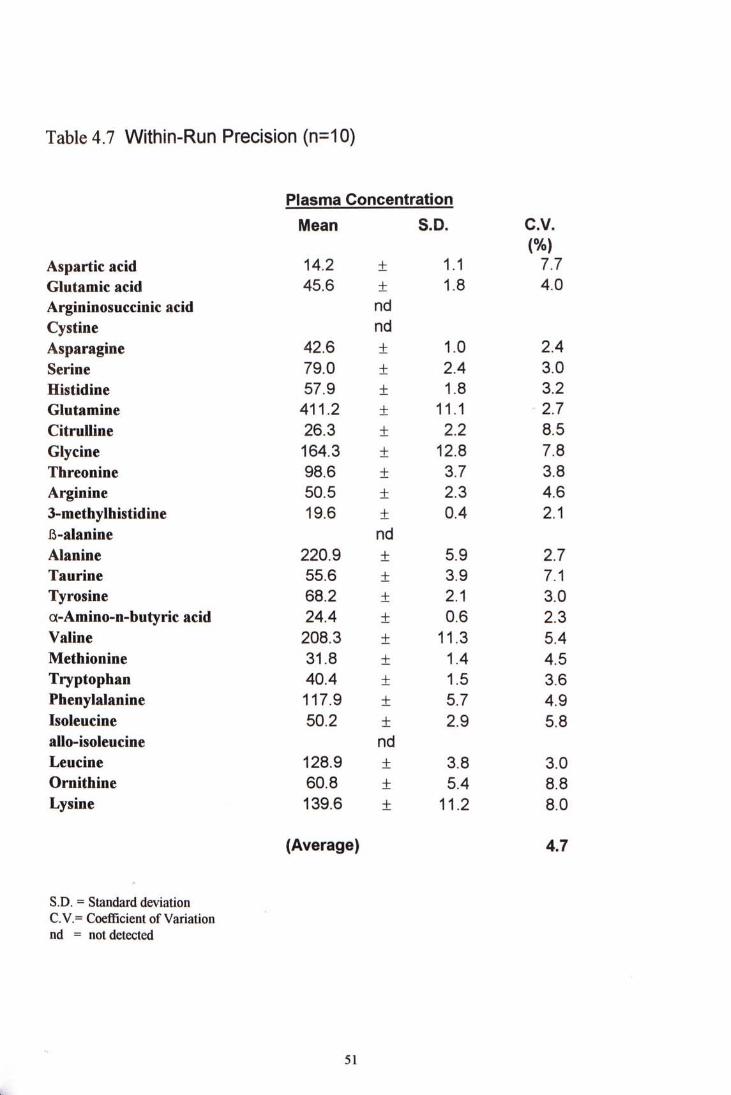
Table 4.7 Within-Run Precision (n=10)
Plasma Concentration Mean S.D. C.V.
(%) Aspartic acid 14.2 ± 1.1 7.7 Glutamic acid 45.6 士 1.8 4.0 Argininosuccinic acid nd Cystine nd Asparagine 42.6 土 1.0 2.4 Serine 79.0 士 2.4 3.0 Histidine 57.9 土 1 8 3.2 Glutamine 411.2 ± 11.1 2.7 Citrulline 26.3 土 2.2 8.5 Glycine 164.3 士 12.8 7.8 Threonine 9 8 . 6 土 3 . 7 3 . 8 Arginine 50.5 士 2.3 4.6 3-methylhistidine 1 9 . 6 ± 0 . 4 2.1 15-alanine nd Alanine 220.9 士 5.9 2.7 Taurine 55.6 土 3.9 7.1 Tyrosine 68.2 土 2.1 3.0 a-Amino-n-butyric acid 24.4 ± 0.6 2.3 Valine 208.3 土 11.3 5.4 Methionine 31.8 ± 1 4 4.5 Tryptophan 40.4 土 1.5 3.6 Phenylalanine 117.9 士 5.7 4.9 Isoleucine 50.2 土 2.9 5.8 allo-isoleucine nd Leucine 128.9 土 3.8 3.0 Ornithine 60.8 土 5.4 8.8 Lysine 139.6 士 11.2 8.0
(Average) 4.7
S.D. = Standard deviation C.V = Coefficient ofVariation nd = not detected
51
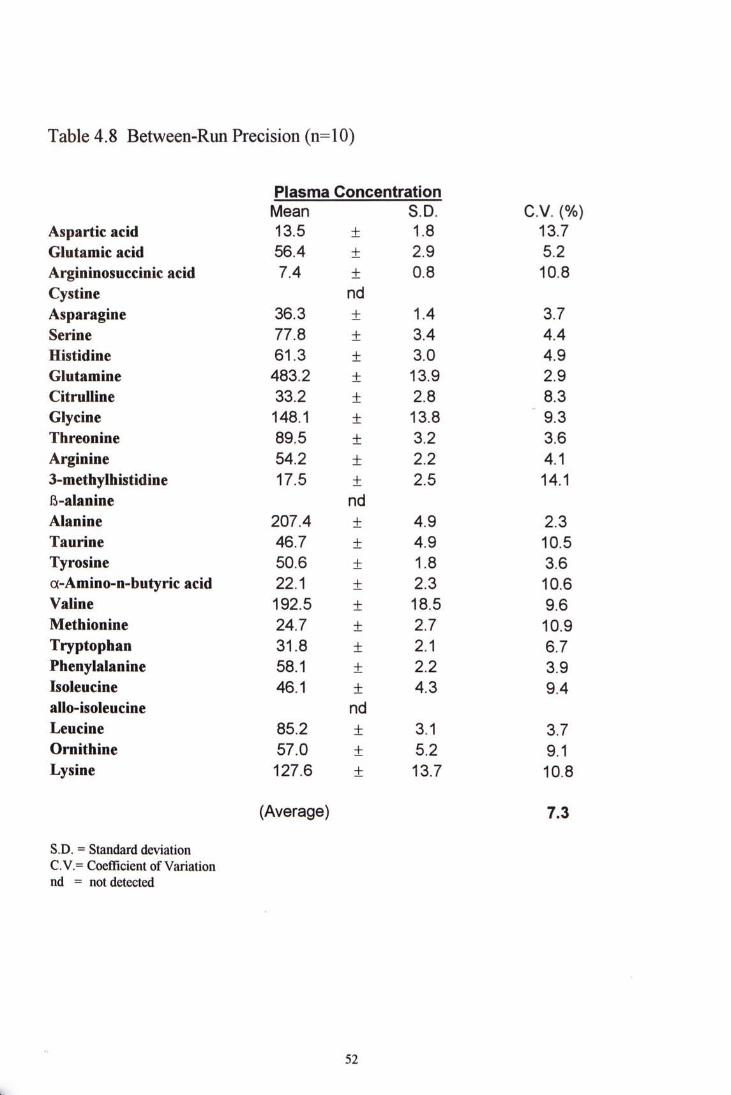
Table 4.8 Between-Run Precision (n=10)
Plasma Concentration 1 ^ ^ s K c.v. (%)
Aspartic acid 13.5 土 1.8 13.7 Glutamic acid 56.4 ± 2 9 5.2 Argininosuccinic acid 7.4 ± 0.8 10.8 Cystine nd Asparagine 36.3 土 1.4 3.7 Serine 77.8 士 3.4 4.4 Histidine 61.3 土 3.0 4.9 Glutamine 483.2 ± 13 9 2.9 Citrulline 33.2 ± 2.8 8.3 Glycine 148.1 土 13.8 9.3 Threonine 89.5 ± 3.2 3.6 Arginine 54.2 土 2.2 4.1 3-methylhistidine 17.5 ± 2 5 14.1 B-alanine nd Alanine 207.4 土 4.9 2.3 Taurine 46.7 土 4.9 10.5 Tyrosine 50.6 土 1.8 3.6 a-Amino-n-butyric acid 22.1 ± 2.3 10.6 Valine 192.5 士 18.5 9.6 Methionine 24.7 土 2.7 10.9 Tryptophan 31.8 土 2 1 6.7 Phenylalanine 58.1 土 2 2 3.9 Isoleucine 46.1 ± 4.3 9.4 allo-isoleucine nd Leucine 85.2 土 3.1 3.7 Ornithine 57.0 ± 5 2 9.1 Lysine 127.6 士 13.7 10.8
(Average) 7.3
S.D. = Standard deviation C.V = Coefficient of Variation nd = not detected
52
4.3.4 Sample storage studies
Half of the amino acids showed significant change in concentrations when the samples were stored as original plasma at 4°C for two weeks. However, when such sample was pre-treated with methanol and stored as the same temperature, the dramatic changes were not observed. Significant increase in concentrations were shown by citrulline, phenylalanine and isoleucine no matter which temperature or condition they were being stored. Their increase were all larger than 20% of the original concentration.. No significant difference observed whether the sample were pre-treated or not when they were stored as -20°C and -70°C. These two temperature of storage gave similar outcome. Table 4-9 shows the ratio of amino acid amounts after storage to its original values obtained from the fresh sample. To sum up the findings, sample can be stored treated or untreated at -20°C or -70°C for short term, but never as original plasma untreated sample at 4°C.
53
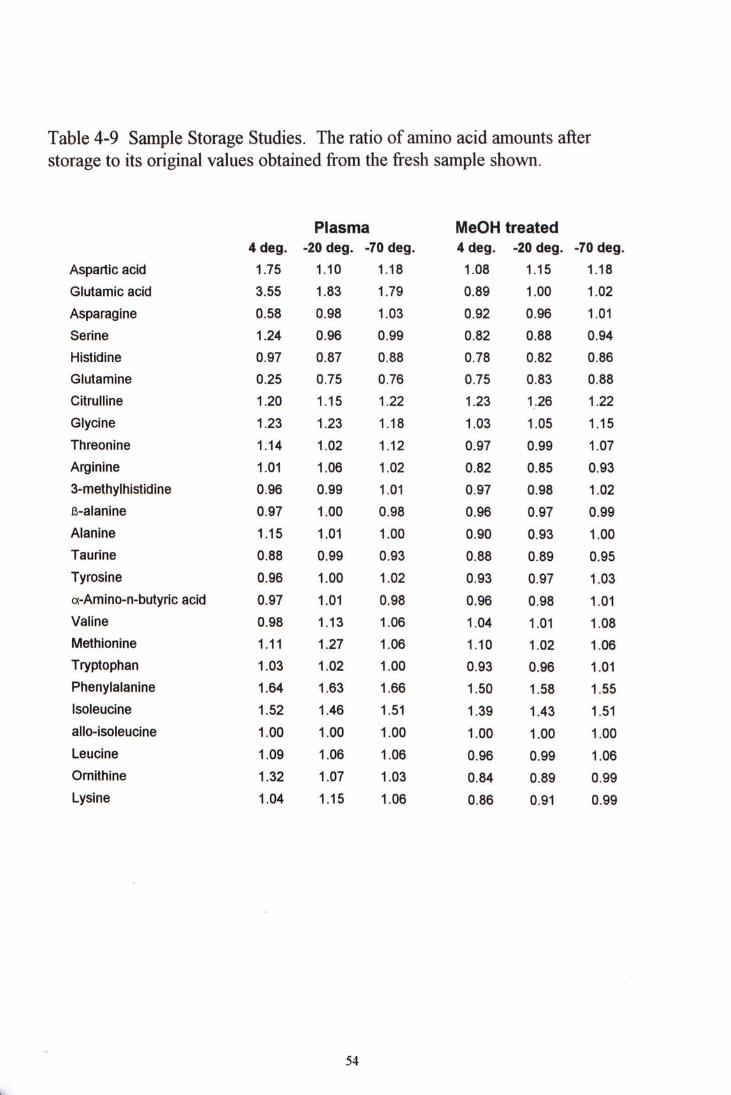
Table 4-9 Sample Storage Studies. The ratio of amino acid amounts after storage to its original values obtained from the fresh sample shown.
Plasma MeOH treated 4 deg. -20 deg. -70 deg. 4 deg. -20 deg. -70 deg.
Aspartic acid 1.75 1.10 1.18 1.08 1.15 1.18
Glutamic acid 3.55 1.83 1.79 0.89 1.00 1.02
Asparagine 0.58 0.98 1.03 0.92 0.96 1.01
Serine 1.24 0.96 0.99 0.82 0.88 0.94
Histidine 0.97 0.87 0.88 0.78 0.82 0.86
Glutamine 0.25 0.75 0.76 0.75 0.83 0.88
Citrulline 1.20 1.15 1.22 1.23 1.26 1.22
Glycine 1.23 1.23 1.18 1.03 1.05 1.15
Threonine 1.14 1.02 1.12 0.97 0.99 1.07
Arginine 1.01 1.06 1.02 0.82 0.85 0.93
3-methylhistidine 0.96 0.99 1.01 0.97 0.98 1 . 0 2
B-alanine 0.97 1.00 0.98 0.96 0.97 0.99 Alanine 1.15 1.01 1.00 0.90 0.93 1.00
Taurine 0.88 0.99 0.93 0.88 0.89 0.95
Tyrosine 0.96 1.00 1.02 0.93 0.97 1.03
a-Amino-n-butyric acid 0.97 1.01 0.98 0.96 0.98 1.01
Valine 0.98 1.13 1.06 1.04 1.01 1.08
Methionine 1.11 1.27 1.06 1.10 1.02 1.06
Tryptophan 1.03 1.02 1.00 0.93 0.96 1.01
Phenylalanine 1.64 1.63 1.66 1.50 1.58 1.55
Isoleucine 1.52 1.46 1.51 1.39 1.43 1.51
allo-isoleucine 1.00 1.00 1.00 1.00 1.00 1.00
Leucine 1.09 1.06 1.06 0.96 0.99 1.06
Ornithine 1.32 1.07 1.03 0.84 0.89 0.99
Lysine 1.04 1.15 1.06 0.86 0.91 0.99
54
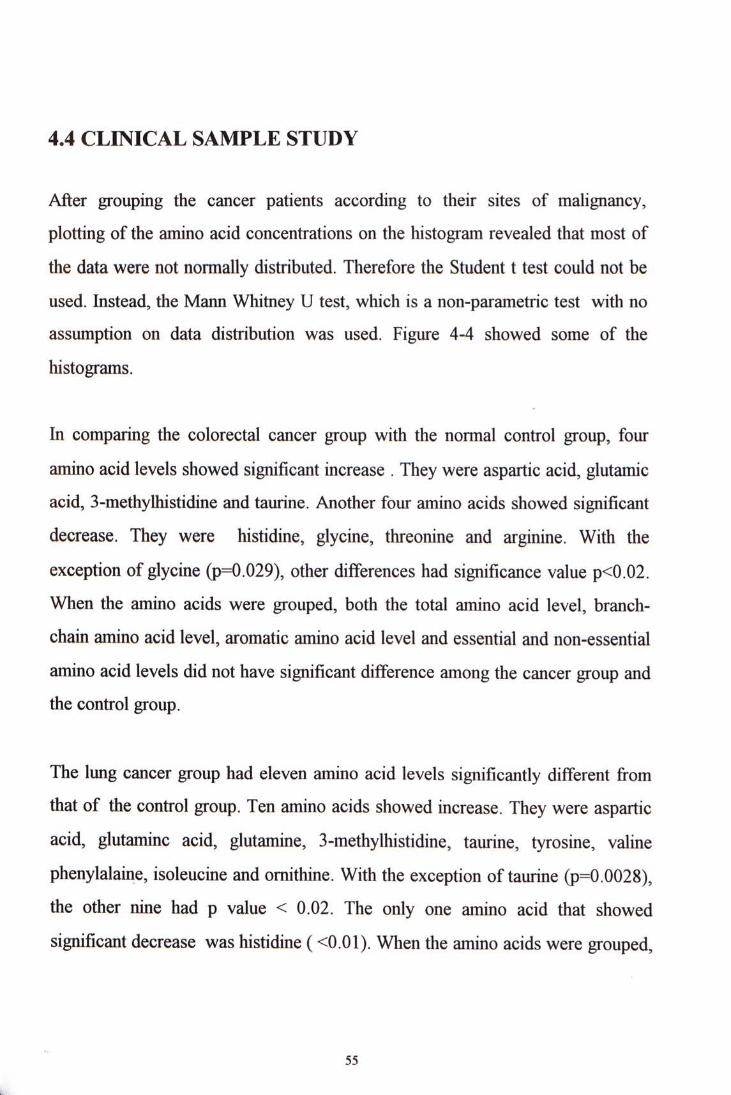
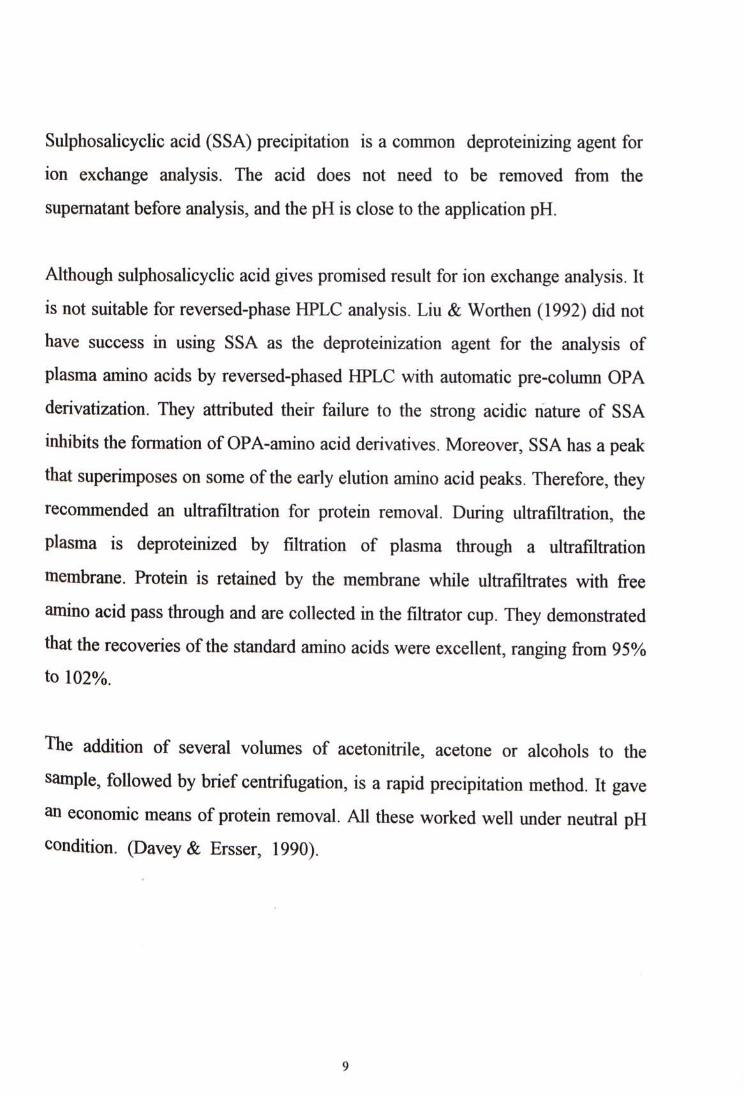
4.4 CLEVICAL SAMPLE STUDY
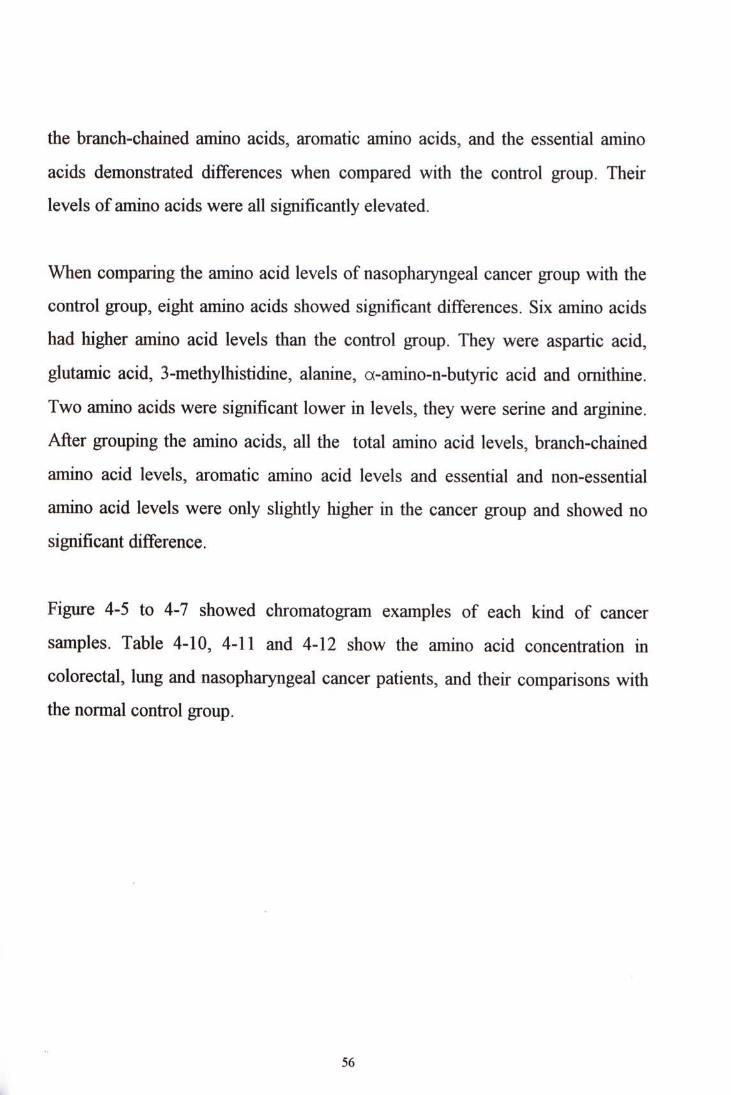
After grouping the cancer patients according to their sites of malignancy, plotting of the amino acid concentrations on the histogram revealed that most of the data were not normally distributed. Therefore the Student t test could not be used. Listead, the Mann Whitney U test, which is a non-parametric test with no assumption on data distribution was used. Figure 4-4 showed some of the histograms.
In comparing the colorectal cancer group with the normal control group, four amino acid levels showed significant increase . They were aspartic acid, glutamic acid, 3-methylhistidine and taurine. Another four amino acids showed significant decrease. They were histidine, glycine, threonine and arginine. With the exception of glycine (p=0.029), other differences had significance value p<0.02. When the amino acids were grouped, both the total amino acid level, branch-chain amino acid level, aromatic amino acid level and essential and non-essential amino acid levels did not have significant difference among the cancer group and the control group.
The lung cancer group had eleven amino acid levels significantly different from that of the control group. Ten amino acids showed increase. They were aspartic acid, glutamine acid, glutamine, 3-methylhistidine, taurine, tyrosine, valine phenylalaine, isoleucine and ornithine. With the exception of taurine (p=0.0028), the other nine had p value < 0.02. The only one amino acid that showed significant decrease was histidine (<0.01). When the amino acids were grouped,
55
the branch-chained amino acids, aromatic amino acids, and the essential amino acids demonstrated differences when compared with the control group. Their levels of amino acids were all significantly elevated.
When comparing the amino acid levels of nasopharyngeal cancer group with the control group, eight amino acids showed significant differences. Six amino acids had higher amino acid levels than the control group. They were aspartic acid,
glutamic acid, 3-methylhistidine, alanine, a-amino-n-butyric acid and ornithine. Two amino acids were significant lower in levels, they were serine and arginine. After grouping the amino acids, all the total amino acid levels, branch-chained amino acid levels, aromatic amino acid levels and essential and non-essential amino acid levels were only slightly higher in the cancer group and showed no significant difference.
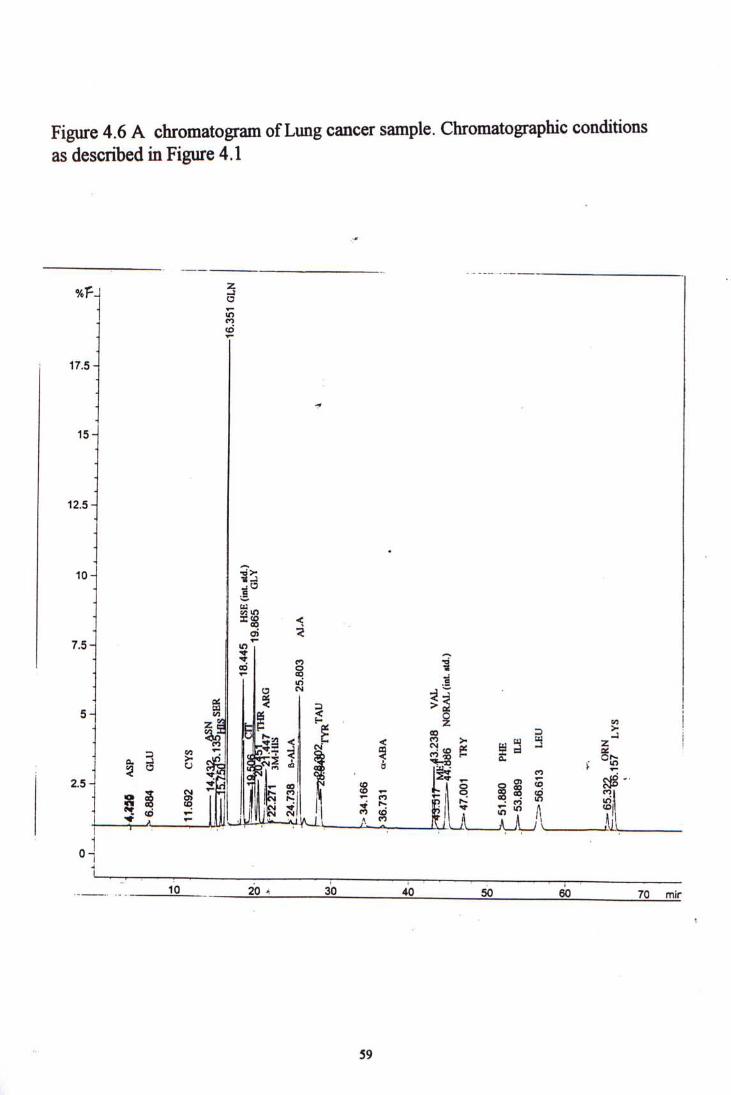
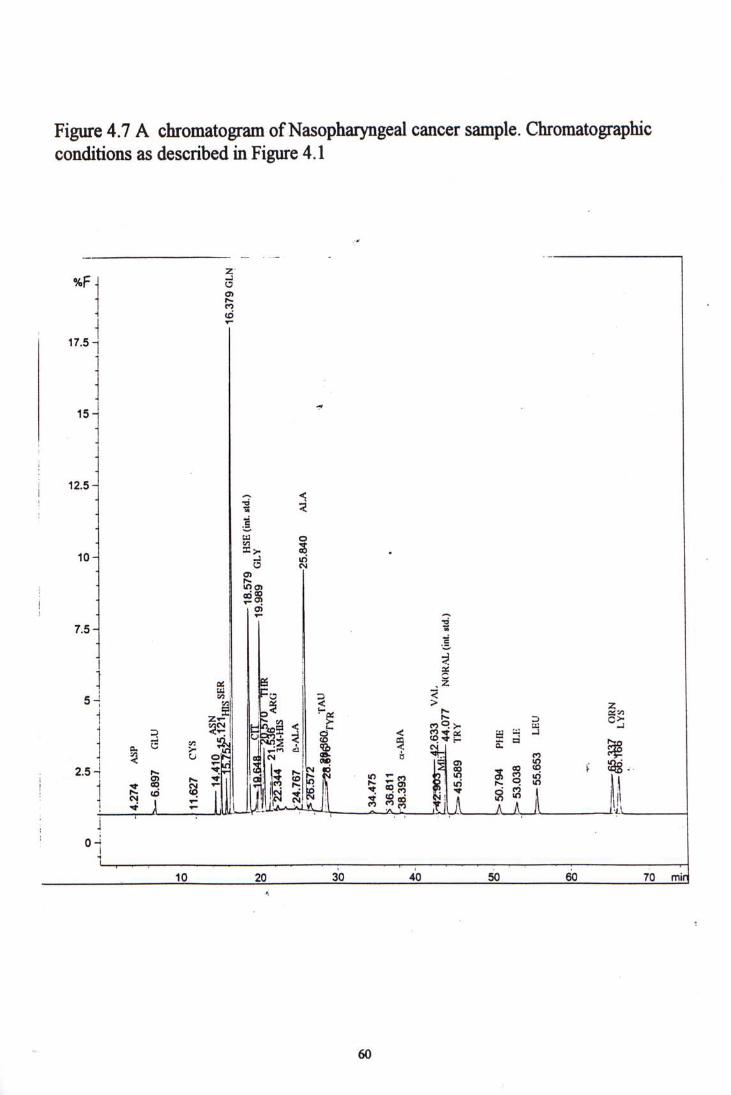
Figure 4-5 to 4-7 showed chromatogram examples of each kind of cancer samples. Table 4-10, 4-11 and 4-12 show the amino acid concentration in colorectal, lung and nasopharyngeal cancer patients, and their comparisons with the normal control group.
56
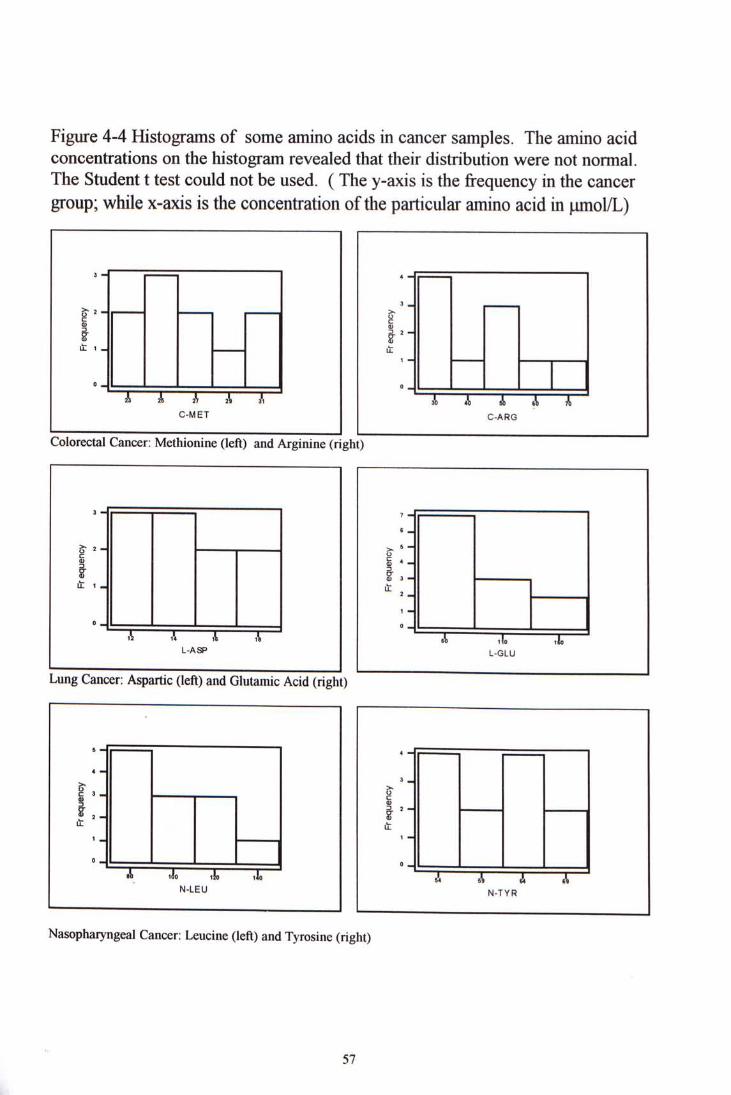
Figure 4-4 Histograms of some amino acids in cancer samples. The amino acid concentrations on the histogram revealed that their distribution were not normal. The Student t test could not be used. ( The y-axis is the frequency in the cancer group; while x-axis is the concentration of the particular amino acid in ^mol/L)
‘~l ^^^^^ *• H| 3 -I ^ - | ~ — — r
当 m
I 广 LL 1 - lt
1 一 _ i ^ _ . . - . . . . . . -° � � _ |
^ J ^ S J~" •""3 A 办 A A C-MET C-ARG Colorectal Cancer: Methionine (left) and Arginine (right)
3 1 | 7
8 2_ s- '_ I § 4 _ ? 8^ 3 -
U_ 1 _ it ^
0 j ' 0 -^ ^ ^ ^^“^ ~ A 1¾. ,1
L-ASP L-GLU
Lung Cancer: Aspartic (left) and Glutamic Acid (right)
« 1| ""j 4 ~|| = = = 4 -S" >. ' •
C 3 _ _ _ _ _ _ _ _ _ _ _ ^ 0 § § , CT 2 . 2 _ I _ I I . . ^ _ _ « _ ® 2- S ^ t
1 _ 1 -° -|l 0-1 A ^ ^ ^ A 1 A
N-LEU N-TYR
Nasophatyngeal Cancer: Leucine (left) and Tyrosine (right)
57

_
g
3
N :
^ N
_- •二
K>
5? & 習
o
ui
ui
ui
o
cn
cn
ui
o
2^
^
. CB
f~
J_I~
~1—
1_
•i_
~I~
_I^
~l-
_i~
-U_
_1_
I__
I_L
_l_
U�
-_1
__
I__
I_L
_J_
_i_
_,_
I_I_
I_,_
_,_
_,_
_,_
_I_
• •
•
.
I •
•
•
•
I
•
•
•
, 0
私
s •认
4.2
57
ASP
S
>
[^6
.84
4 G
LU
g
- S
-
w 3
s- S.
B 1
1.5
08
CY
S a
* ^
:U
W-
lf
V2
i SE
R
‘ 5
¾
pr_15.7
a4fiti
16.438
GLN
曰 g
•
•-.
^
- 1
8.6
34
HSE
(int
.rtd
.) 方
曰
“ ^
0.M2
OUV
^ S.
^:
5§§^3腿
7
AR
G
g 0
-24
.68
1 B
-AL
A 4
^ S
* pe.
40
7
25
.69
9 A
LA
4 二
0
: f~
^=^�
TAU
8 ^
0 .
BL n
34
.30
2 .
g
36
.72
3 a-
AB
A 8 •1
«.
C/3
° «
圏
2S
^4
^4
.0
69
NO
RA
L(in
t.it
d.)
^ >
45
.61
7 T
RY
P n g
- ^
®
.> 5
0.8
05
PHE
0
^ 53.088
U.E
§ U
5
5.6
96
LEU
S
1 ^
95.
,•
^
哲
B:
0 ^m
.h4,
YS
負
3
• i
L
.¾
i
;
.,^
.>.z^rl^
o
f
c
.
--^ ns
5.srt
MMU^
& ud
i.s
A
如
一 3Hd
§.5丄.
d
)
衝
一
AH.L
so,z^i
c (p1*luJ)TV^ON
sslrtnnM^
^
Tv>
fflsH^^^P^,
6
-
.
.
s vav&
§.9C
-
鄉 99l>CA
露
.
c
5-
加
g
t
D<H«^Na3fnnM^
§ V
’IV
S8.s
水
L <J<.fi
802�
血
§
-
9雲
0""*"¾
¾
^
53
1 (P1*-V>!)3SH
g59t
fcu
&b
k 50
Ee
9r^
二
lvtJ
OT §}
SA3
S9.;
J R
c n
.u 30
辜9丄
^ ^
§
§>
‘
“油
111
e :-
•
•
•
-
-
-
-
-
-
-
-
-
-
-
I
j—1
「-r
」
^^ ^
^
5
S
o
.R肪
I I
1^
• c 扣
啊 ,iuM
^
f
m s
j
Q _Tdl
E999^
A^
^ 『n
so.s
A
ri. as
3卜.05丄
<2
i
-
s
r AH1
§^A
嶋
!J0J^^^M
咖 -?
^ <ffl<.8
C6e,8e,,
Sj
•
i.9e^
嚷 .
—
S
叩1
,
s^is.^i
3
肪 4.
<,^
os.s
s.9x
^ e
VTV.g
N95Z�
rf i>
<
i
s-k6^^ .
§ .R
§
696.6r
PL^^U
M
祖 _
S4
3SH
6Ngm
nhMP^
,
屋!
HJy^^J
§ •灿
SAJ
§•;
肪
S 2
^
K 30
&8.9丄
A S
1
^ s
I
s.^
4.
.§
c .
J—I—.“―I—-|—1—I—I—r—1—_—_—_—I—_—_—_—_—_—I—-—.—_—.—_—I—t——llJ-.-_---—J—-i_—_—_~
.~rJiL
证山 F
5
5
5
o
5
5
iq
o
g> n
%
7.
1
CNi
1
T^
2
力o 1
1
F c
-
-•
-
•
•
-
I
I
. .
.
. .
.
•
••
!
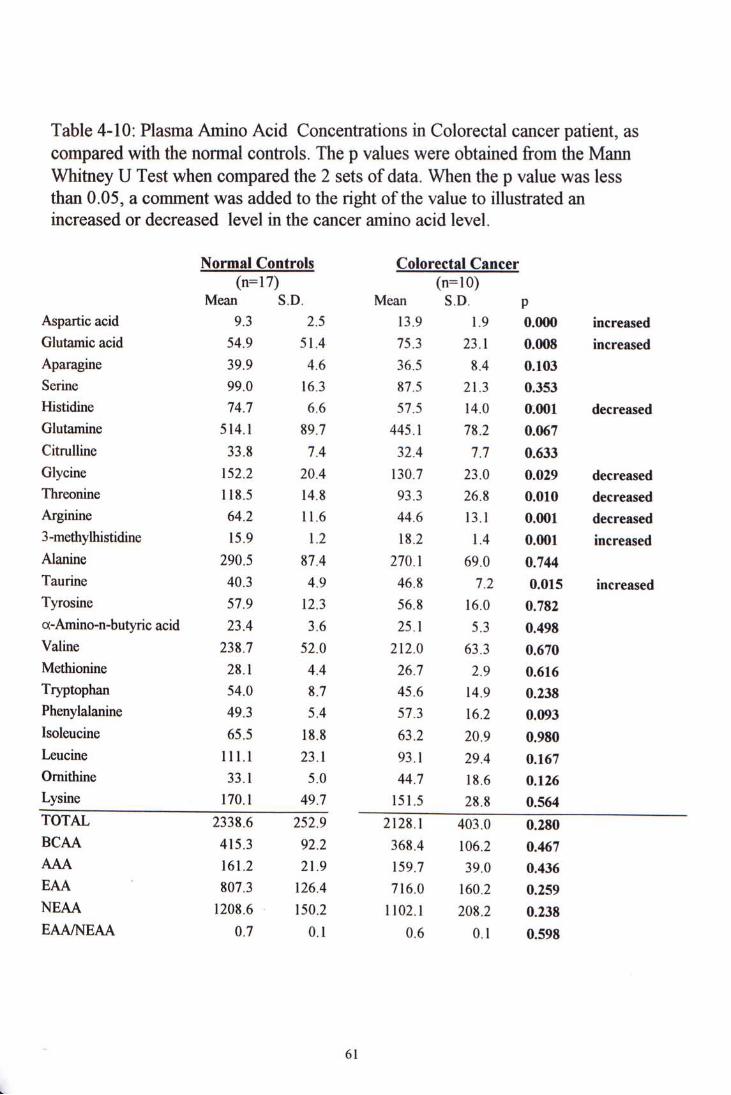
Table 4-10: Plasma Amino Acid Concentrations in Colorectal cancer patient, as compared with the normal controls. The p values were obtained from the Marni Whitney U Test when compared the 2 sets of data. When the p value was less than 0.05, a comment was added to the right of the value to illustrated an increased or decreased level in the cancer amino acid level.
Normal Controls Colorectal Cancer (n=17) (n=10)
Mean S.D. Mean S.D. p Aspartic acid 9.3 2.5 13.9 1.9 0.000 increased Glutamic acid 54.9 51.4 75.3 23.1 0.008 increased Aparagine 39.9 4.6 36.5 8.4 0.103 Serine 99.0 16.3 87.5 21.3 0.353 Histidine 74.7 6.6 57.5 14.0 0.001 decreased Glutamine 514.1 89.7 445.1 78.2 0.067 Citrulline 33.8 7.4 32.4 7.7 0.633 Glycine 152.2 20.4 130.7 23.0 0.029 decreased Threonine 118.5 14.8 93.3 26.8 0.010 decreased Arginine 64.2 11.6 44.6 13.1 0.001 decreased 3-methyUiistidine 15.9 1.2 18.2 1.4 0.001 increased Alanine 290.5 87.4 270.1 69.0 0.744 Taurine 40.3 4.9 46.8 7.2 0.015 increased Tyrosine 57.9 12.3 56.8 16.0 0.782 cx-Amino-n-butyric acid 23.4 3.6 25.1 5.3 0.498 Valine 238.7 52.0 212.0 63.3 0.670 Methionine 28.1 4.4 26.7 2.9 0.616 Tryptophan 54.0 8.7 45.6 14.9 0.238 Phenylalanine 49.3 5.4 57.3 16.2 0.093 Isoleucine 65.5 18.8 63.2 20.9 0.980 Leucine 111.1 23.1 93.1 29.4 0.167 Ornithine 33.1 5.0 44.7 18.6 0.126 Lysine 170.1 49.7 151.5 28.8 0.564 TOTAL 2338.6 2 5 2 ^ ~ ~ 2 1 2 8 . 1 4 ^ 0 ^ BCAA 415.3 92.2 368.4 106.2 0.467 AAA 161.2 21.9 159.7 39.0 0.436 EAA 807.3 126.4 716.0 160.2 0.259 NEAA 1208.6 150.2 1102.1 208.2 0.238 EAA/NEAA 0.7 0.1 0.6 0.1 0.598
61
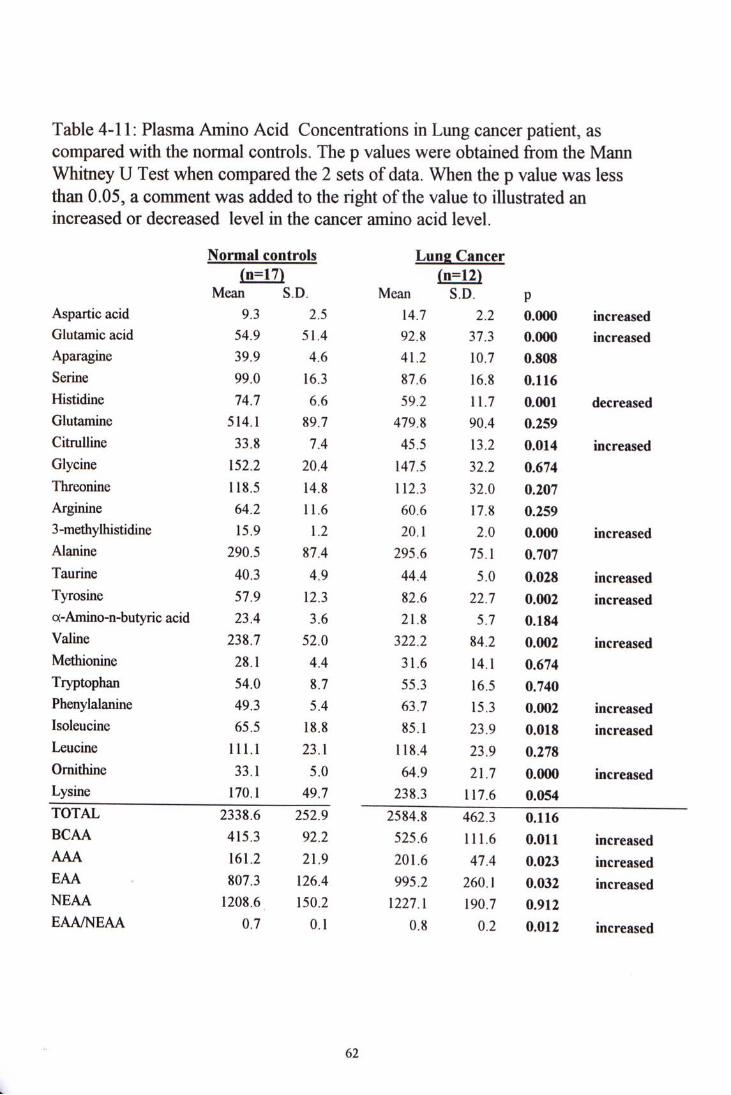
Table 4-11: Plasma Amino Acid Concentrations in Lung cancer patient, as compared with the normal controls. The p values were obtained from the Mann Whitney U Test when compared the 2 sets of data. When the p value was less than 0.05, a comment was added to the right of the value to illustrated an increased or decreased level in the cancer amino acid level.
Normal controls Lung Cancer (n=17) (n=12)
Mean S.D. Mean S.D. p Aspartic acid 9.3 2.5 14.7 2.2 0.000 increased Glutamic acid 54.9 51.4 92.8 37.3 0.000 increased Aparagine 39.9 4.6 41.2 10.7 0.808 Serine 99.0 16.3 87.6 16.8 0.116 Histidine 74.7 6.6 59.2 11.7 0.001 decreased Glutamine 514.1 89.7 479.8 90.4 0.259 Citrulline 33.8 7.4 45.5 13.2 0.014 increased Glycine 152.2 20.4 147.5 32.2 0.674 Threonine 118.5 14.8 112.3 32.0 0.207 Arginine 64.2 11.6 60.6 17.8 0.259 3-methylhistidine 15.9 1.2 20.1 2.0 0.000 increased Alanine 290.5 87.4 295.6 75.1 0.707 Taurine 40.3 4.9 44.4 5.0 0.028 increased Tyrosine 57.9 12.3 82.6 22.7 0.002 increased a-Amino-n-butyric acid 23.4 3.6 21.8 5.7 0.184 Valine 238.7 52.0 322.2 84.2 0.002 increased Methionine 28.1 4.4 31.6 14.1 0.674 Tryptophan 54.0 8.7 55.3 16.5 0.740 Phenylalanine 49.3 5.4 63.7 15.3 0.002 increased Isoleucine 65.5 18.8 85.1 23.9 0.018 increased Leucine 111.1 23.1 118.4 23.9 0.278 Ornithine 33.1 5.0 64.9 21.7 0.000 increased Lysine 170.1 49.7 238.3 117.6 0.054 TOTAL 2338.6 252.9 ~ ~ 2 5 8 4 . 8 4 ^ o J u BCAA 415.3 92.2 525.6 111.6 0.011 increased AAA 161.2 21.9 201.6 47.4 0.023 increased EAA 807.3 126.4 995.2 260.1 0.032 increased NEAA 1208.6 150.2 1227.1 190.7 0.912 EAA/NEAA 0.7 0.1 0.8 0.2 0.012 increased
62
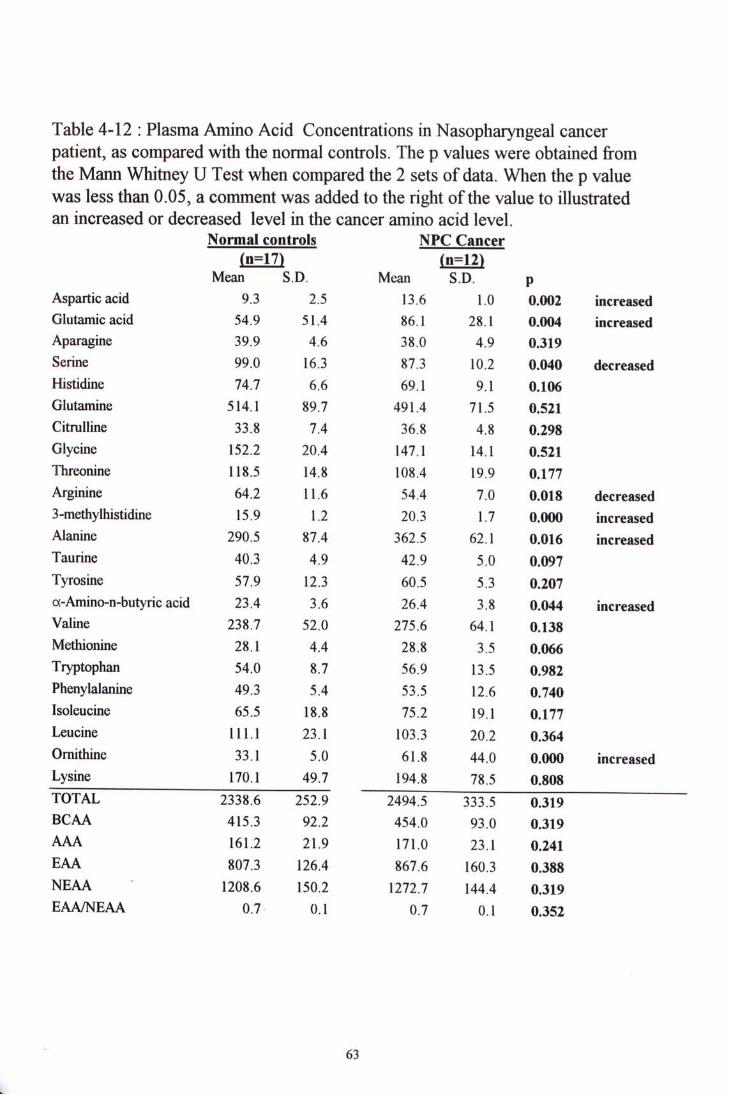
Table 4-12 : Plasma Amino Acid Concentrations in Nasopharyngeal cancer patient, as compared with the normal controls. The p values were obtained from the Mann Whitney U Test when compared the 2 sets of data. When the p value was less than 0.05, a comment was added to the right of the value to illustrated an increased or decreased level in the cancer amino acid level.
Normal controls NPC Cancer (n=17) “ ( n = 1 2 ) “
Mean S.D. Mean S.D. p Aspartic acid 9.3 2.5 13.6 1.0 0.002 increased Glutamic acid 54.9 51.4 86.1 28.1 0.004 increased Aparagine 39.9 4.6 38.0 4.9 0.319 Serine 99.0 16.3 87.3 10.2 0.040 decreased Histidine 74.7 6.6 69.1 9.1 0.106 Glutamine 514.1 89.7 491.4 71.5 0.521 Citrulline 33.8 7.4 36.8 4.8 0.298 Glycine 152.2 20.4 147.1 14.1 0.521
Threonine 118.5 14.8 108.4 19.9 0.177 Arginine 64.2 11.6 54.4 7.0 0.018 decreased 3-methylhistidine 15.9 1.2 20.3 1.7 0.000 increased Alanine 290.5 87.4 362.5 62.1 0.016 increased Taurine 40.3 4.9 42.9 5.0 0.097 Tyrosine 57.9 12.3 60.5 5.3 0.207 a-Amino-n-butyric acid 23.4 3.6 26.4 3.8 0.044 increased Valine 238.7 52.0 275.6 64.1 0.138 Methionine 28.1 4.4 28.8 3.5 0.066 Tryptophan 54.0 8.7 56.9 13.5 0.982 Phenylalanine 49.3 5.4 53.5 12.6 0.740 lsoleucine 65.5 18.8 75.2 19.1 0.177 Leucine 111.1 23.1 103.3 20.2 0.364 Ornithine 33.1 5.0 61.8 44.0 0.000 increased Lysine 170.1 49.7 194.8 78.5 0.808 TOTAL 2338.6 252.9 ~ ~ 2 4 9 4 . 5 3 ^ 5 0 H 9 BCAA 415.3 92.2 454.0 93.0 0.319 AAA 161.2 21.9 171.0 23.1 0.241 EAA 807.3 126.4 867.6 160.3 0.388 NEAA 1208.6 150.2 1272.7 144.4 0.319 EAAmEAA 0.7 0.1 0.7 0.1 0.352
63
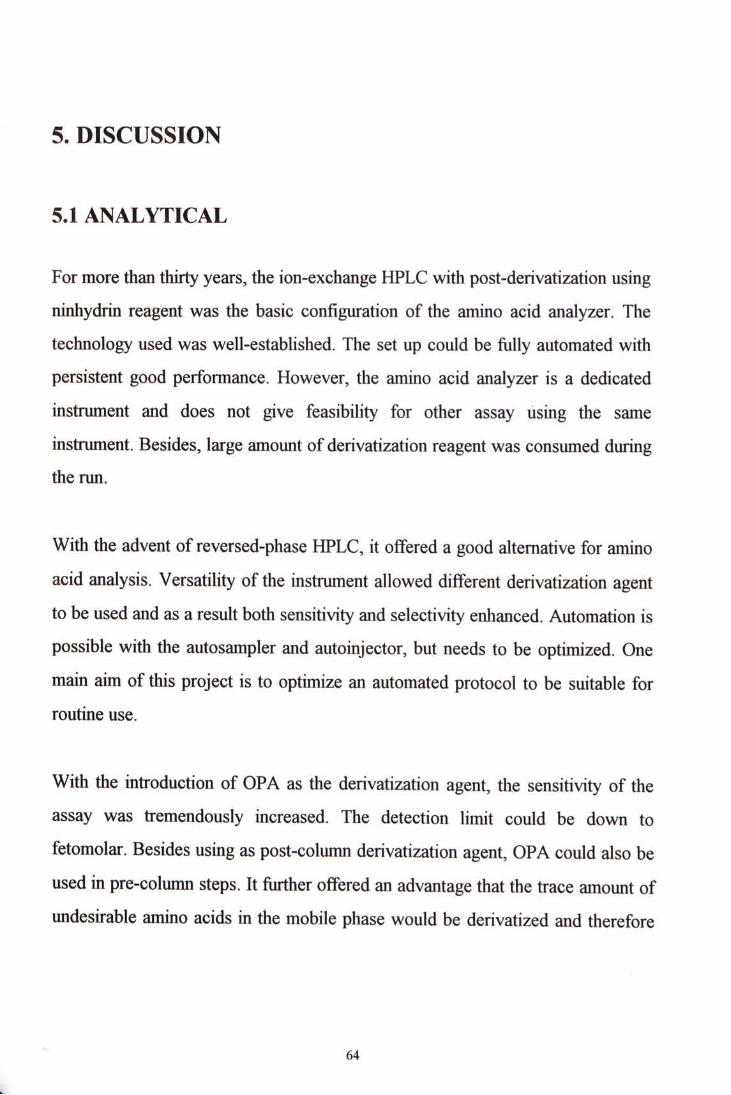
5. DISCUSSION
5.1 ANALYTICAL
For more than thirty years, the ion-exchange HPLC with post-derivatization using ninhydrin reagent was the basic configuration of the amino acid analyzer. The technology used was well-established. The set up could be ftilly automated with persistent good performance. However, the amino acid analyzer is a dedicated instrument and does not give feasibility for other assay using the same instrument. Besides, large amount of derivatization reagent was consumed during the run.
With the advent of reversed-phase HPLC, it offered a good alternative for amino acid analysis. Versatility of the instrument allowed different derivatization agent to be used and as a result both sensitivity and selectivity enhanced. Automation is possible with the autosampler and autoinjector, but needs to be optimized. One main aim of this project is to optimize an automated protocol to be suitable for routine use.
With the introduction of OPA as the derivatization agent, the sensitivity of the assay was tremendously increased. The detection limit could be down to fetomolar. Besides using as post-column derivatization agent, OPA could also be used in pre-colunm steps. It further offered an advantage that the trace amount of undesirable amino acids in the mobile phase would be derivatized and therefore
64
would not cause fluctuation in the baseline of the chromatogram. Noise elimination allowed detector operation at higher amplification. And therefore, very high sensitivity was ensured. No interference peak was produced since OPA itself did not have fluorescence. Besides strong fluorescence signal produced, OPA also gave fast reaction with the amino acids. The reaction carried out at room temperature as well.
Compared with FMOC and Dansyl chloride method of derivatization, OPA offered higher sensitivity and clearer background; no tedious steps were involved in sample preparation. However, one of the drawback of using OPA as derivatization agent is that it cannot react directly with secondary amino acids proline and hydroxyproline. Secondary amino acids must be oxidized by hypochlorite or chloramine-T to render them detectable (Perrett, 1985). Besides the OPA products formed are not very stable and the quantity formed depends critically on the length of derivatization. Shortened derivatization time results in incomplete reaction while prolonged reaction time cannot guarantee the stability of the formed products. Therefore optimization of reaction time as well as sample volume, reagent volume, and reagent concentration was crucial to the success of the establishment of the reversed-phase HPLC method.
To ensure reproducibility, the reaction time must be carefiilly controlled. Automatic sampler and injectors are critically important to the success of OPA pre-derivatization. The instrument must have the capability to aspirate sample and reagent for derivatization in different amount and at different order. The Hewlett Packard HP1050 system interfaced with the personal computer using the
65
k.
Chem-Station software (Hewlett Packard) provide such feasibility. Under the program set, the sample and reagent, after mixing in the sample loop, were hold for designated period of time before injection into the column. The reproducibility of the outcome was therefore ensured.
Without such automatic devices, the OPA derivatization steps would be difficult to carry out. The operator must do a mixing first, and hold the mixture for exactly certain interval, and inject into the column manually. Such manual steps has to be repeated after each sample run. Without the automatic derivatization device, as in some old HPLC model, FMOC is a good alternative to OPA for derivatization. It can detect secondary amino acids as well. The products formed are stable so batch derivatization becomes possible as time of reaction is not critical. However, solvent removal of excess FMOC reagent is necessary and its detection sensitivity is not as high as OPA. A preliminary attempt to establish a protocol utilizing FMOC as the derivatization agent has been made. But it was found to be labor intensive, mainly due to the need to remove excess FMOC and to condition the column. The attempt was not continued due to the constraint in time for completion of the whole project. However the OPA method established is proved to be satisfactory. All the 27 amino acids and 2 the internal standards were resolved, with no interference peak produced. The fluorescence signal produced was strong enough for quantitation. The derivatization procedure was fully automated. The setup could run on ovemight and more than 15 samples could be handled. Performance evaluation on precision, recovery, and linearity gave promised results.
66
k.
In optimization procedures, an OPA:sample volume ratio was first worked out followed by finding a suitable injection volume for the mixture. Under a arbitrary total injection volume 12 pl, the OPA:sample ratio was varied in order to find the best combination in volume ratio that gave the strongest fluorescence signal. The ratio 1:2 was optimal. Theoretically, increase in injection amount of the determined 1:2 mixture would increase the fluorescence signal. However, increase injection volume would increase the burden of the column as well as ruin the resolution of the chromatographic peaks. The data obtained in injection volume optimization revealed that a total injection volume of 15 ^1 gave the strongest fluorescence signal. There was a about 20% decrease in signal if one employed the total volume of 12 pl. If the volume was increased to 18 yd, no further increase in signal obtained. Although the amount of derivatives formed increased, the deterioration of the derivatives was significant. Teerlink et al (1994) noticed that excess OPA accelerated degradation of its derivatives. So, optimization so as to adopt the minimal amount of OPA used is important.
Different derivatization periods were tried. A reaction time of 2 minutes was the best and gave the highest fluorescence signals. It was the time that most the amino acids completed their derivatization with minimal fluorescence signal deterioration. Turaell and Cooper (1982) had carried out a study on amino acid OPA derivatives and noted that such amino acids such as glycine, taurine and ornithine had half-life less than 3 minutes. Worthen & Liu (1992) pointed out that when the waiting time was increased beyond 2.5 minutes, the stability of various amino acid was different.
67
k.
Three different OPA concentrations were tried in the study. The concentrations being studied were those commonly employed by the previous workers. The alkaline OPA reagent ifheavily being injected into the column would damage the stationary phase inside. The lowest concentration of 1.92 mg/ml, which was originally being used in the earlier part of optimization studies, gave the strongest fluorescence signal. No significant increase in signal intensity was observed if the concentration was fiuther increased. Increase OPA concentration used by keeping the same total injection volume was an analogy of increasing the OPA:sample ratio, bicrease OPA amount alone would upset the previous optimal volume ratio. The results demonstrated that it was impossible to fiuther increase the OPA amount to gain higher fluorescence signal if the injection volume was kept constantly low so as to enhance resolution.
The system takes 75 minutes to complete a single run. It can detect 27 amino acids. Most of the peaks in the chromatogram were satisfactorily resolved, with the exception ofpartial co-elution of citrulline and glycine. There was slight peak overlapping in taurine and tyrosine as well. Since the overall peak overlapping is not so serious, peak area was used to do the quantitative work. However, after several hundreds of injection, if the resolution of the peaks decrease, it is more wise to use the peak height for quantitation. McCoy et al (1984) noticed that for well-resolved chromatographic peaks, the precision of area measurement was equal or better than that ofheights measurement. However, in cases where peaks were poorly resolved, baseline showed perturbation, or where a peak eluted on
68

the tail of an earlier eluting peak, peak height measurements appeared to provide more precise quantitation.
Deproteinization is necessary for amino acid analysis. As much as possible protein should be removed without affecting the amino acid concentration. Injection of protein into the column would shorten the column life. Methanol treatment was used in the work to remove protein in the plasma sample. It is an economical method with only simple precipitation and centrifugation steps. Most of the protein could be removed.
For precision study, a pooled plasma was analyzed 10 times in a single nm to obtain the within-run precision. Another plasma sample was analyzed in 10 separate run to obtain the between-run precision. The averaged coefficient of variation were 4.7% and 7.4% respectively. These figures are comparable with other methods such as ion-exchange HPLC (Moller,1993). So automatic sampler with programmed injector could ensure high precision since the reaction time as well as reaction volumes were properly controlled.
In linearity study, all the amino acids demonstrated linearity from one-forth of the low composite standard concentration up to twice the amount of high composite standard. This ranges well cover all the physiological feasible ranges in human body. The coefficient of correlation r among different concentrations for each amino acid ranges from 0.992 to 1.000. Most of the amino acids got r values 0.998 or above.
69

Recovery study is a measure of accuracy of the assay. Exact amount of analyses were spiked into one plasma sample. Recovery is a ratio index that reflects the amount that was measured out in the assay to its actual amount being spiked. The recovery values for different amino acids ranged from 92% to 110% with exception of cystine, citrulline, arginine, valine and isoleucine.
In sample storage study, significant change in concentrations was observed if the untreated sample was stored at 4°C. Significant increases in aspartic acid (175% of original level) and glutamic acid (355%) were observed while asparagine (58%) and glutamine (25%) decreased drastically. Blundell and Brydon (1987) stated that it was essential to store samples at -70°C in order to prevent the formation of glutamic acid from glutamine and aspartic acid from asparagine. h\ the study glutamic acid still increased if the sample was stored untreated at -20oC or -70oC. However, no change observed if the sample was treated before storage. No significant change in most amino acid concentration was observed if the samples were stored at -20°C or -70°C, if it had been treated with methanol . So, for short term storage, such as a period of about 2 weeks, the sample should be best stored at -20°C or -70�C with methanol treated. In case treatment cannot be done immediately, the plasma sample should be stored at -20 °C but never at 4 °C.
70
5.2 CLINICAL
5.2.1 Normal controls The free amino acid concentrations in the normal control agree with the reference ranges set by other local institute. Armstrong & Stave (1973) stated that there were significant differences between male and female in plasma amino acid concentrations. Men had amino acid levels higher than that of women in most of the amino acids, probably due to heavier muscular mass. However, in this study, the number of subject, both the control group and individual cancer group, was small and did not sub-divide into sex groups for comparison.
Nutritional status ofboth the control group and the cancer groups were important factor. All the subjects should not have any weight loss or mal-nourishment.
5.2.2 Colorectal Cancer In the colorectal cancer patient group, concentrations of eight amino acid were significantly different from the control group. Aspartic acid. Glutamic acid, 3-methyl-histidine and taurine showed elevation in concentration while other histidine, glycine, threonine and arginine levels decreased. One non-essential amino acid, glutamic acid, elevated while another non-essential amino acid, glycine decreased in level. Threonine was the only one essential amino acid showed decrease in level. After grouping the amino acids, no significant different
71

in concentration observed in total, branch-chain, aromatic, essential and non-essential amino acid levels. The only relationship among the altered amino acid levels were histidine and 3-methyl-histidine. 3-methyl-histidine is formed from histidine methylation on actin and myosin. Its level reflects the skeletal muscle breakdown since it is not re-utilize for protein synthesis nor metabolize to other product.
Similar results had been obtained by other workers. Ching et al (1984) and Psister et al (1992) both studied gastro-intestinal malignancy found that there were no difference in plasma amino acid levels between the cancer group and the normal control group. Increase in amount of aspartic acid, glutamic acid and taurine in colorectal cancer patients agreed with the findings of Zhang and Pang (1992).
Since the increased and the decreased of amino acids belonged to different groupings, there was no specific change to the amino acid grouping. Generally, colorectal cancer patient may have some problem in absorption of essential amino acids from the daily food. Since the patient were newly-diagnosed, such change in amino acid levels at that stage might not pronounced.
5.2.3 Lung Cancer About half of the amino acids had levels significantly different from those ofthe control group. The only one amino acid that showed decrease in level was histidine. Ten amino acids showed elevation in amino acid levels. They were
72

aspartic acid, glutamic acid, citrulline, 3-methyl-histidine, taurine, tyrosine, valine, phenylalanine, isoleucine and ornithine. Out of 10 amino acids there were 4 essential and 2 non-essential. And in this 6 essential and non-essential amino acids, there were 2 aromatic and 2 branch-chain amino acids. As a consequence, after grouping of the altered level amino acids, The essential, branch-chain and the aromatic amino acids were significant different from the control group.
The increases in aspartic acid,glutamic acid, taurine and ornithine agreed with that of Zhang & Pang (1992), as well as decrease in histidine. However, the increase in essential amino acid levels, both the branch-chain and aromatic, contradicted with Nanini et al (1988) and Zhang & Pang (1992) . The unexpected elevation of essential amino acid levels might be due to the diet of the patients. The essential to non-essential ratio was increased in this group of cancer patient. Such increase had no clinical significant. Only a low essential to non-essential ratio has clinical significance indicating under nourishment.
5.2.4 Nasopharyngeal Cancer In nasopharyngeal cancer group of patients, there were eight amino acids that the levels were significantly different from the control group. Six amino acids showed increase in level. They were aspartic acid, glutamic acid, 3-methyl-histidine, alanine, a-amino-n-butyric acid, and ornithine. The two amino acids that showed decrease in level were serine and arginine. Serine and alanine were
73
L
non-essential amino acids , that the former showed decreased in level while the latter showed increase in level. The other six amino acids did not belong to any particular group. After grouping, the total, branch-chain, aromatic, essential, and non-essential amino acids were not significantly different from the control group.
Since the nasopharyngeal cancer are not very common in westem population, similar data cannot be found for comparison.
5.2.5 Summary Consistent with Zhang & Pang findings, all the cancer group demonstrated elevation in aspartic acid and glutamic acid. Moreover,the 3-methyl-histidine level was increased in all the three group of cancer patients. Such amino acid was come from histidine. Histidine level was decreased in colorectal and lung cancer patients. For nasopharyngeal cancer patients, histidine level, although decreased, but not significant as the other two groups. After grouping ofthe amino acids, the colorectal and nasopharyngeal cancer patients did not demonstrated any difference in any particular group of amino acid. For lung cancer, the essential amino acid increased significantly, which included some aromatic and branch-chain amino acid. Dietary factor might contribute to such difference. So, in summary, the newly-diagnosed cancer patient with minimal weight loss had amino acid pattem similar to the well-nourished control group.
74
6. CONCLUSION
The reverse-phase HPLC using OPA in pre-column derivatization was set up and had been optimized. The analytical performance was found to be satisfactory. Cancer sample studies revealed that the concentrations of some amino acid were altered in newly-diagnosed cancer patients. However,the change at that stage had doubtful clinical significance since no specific pattem of change had been observed.
75
7. REFERENCES 1. Armstrong MD, Stave U. (1973) A study of plasma free amino acid levels. II.
Normal values for children and adults Metabolism 22(4):561-9.
2. Bank RA, Jansen EJ, Beekman B, Koppele JM. (1996) Amino acid analysis by reserved-phase high-perfomance liquid chromatography: Improved derivation and detection conditions with 9-fluorenylmethyl chloroformate. Anal Biochem 240:167-76.
3. Barrett CG. (1994) Amino acids. Specialist Periodical Reports-Amino acids, peptides and Proteins Vol 27, pp 1-101.
4. Bartok T, Szalai G, Lorincz ZS,Borcsok G, Sagi F. (1994) High-speed RP-HPLC/FL analysis of amino acids after automated two-step derivatization with o-phthaldialdehyde/3-mercaptopropionic acid and 9-fluorenylmethyl chloroformate. JLiq Chromatogr 17(20):4391-403.
5. Bauza T, Blaise A, Daumas F, Cabanis JC. (1995) Determination ofbiogenic amines and their precursor amino acids in wines of the Vallee du Rhone by high-perfomance liquid chromatography with precolumn derivatization and fluorimetric detection. J Chromatogr 707:373-79.
6. Betner I, Foldi P. (1989) The FMOC-ADAM approach to amino acid analysis LC-GC International 2:44-53.
76
7. Bettica P, Moro L, Robins SP, et al. (1992) Bone-resorption markers galactosyl hydroxylysine, pyridinium crosslinks, and hydroxyproline compared. Clin Chem 38:2313-18.
8. Beutler B and Cerami A. (1987) Cachetin: more than a tumor necrosis factor NEngJMed3l6:319.
9. Billingsley KG and Alexander HR. (1996) The pathophysiology of cachexia in advanced cancer and AIDS. In Cachexia-Anorexia in cancer patients, (Bruera E & Higginson I , ed), pp 1-22. Oxford University Press.
10.Black D, Duncan A, Robins SP. (1988) Quantitative analysis of the pyridinium crosslinks of collagen in urine using ion-paired reversed-phase high-performance liquid chromatography. Anal Biochem 169:197-203.
11.Blankenship DT, Krivanek MA, Ackermarm BL, Cardin AD. (1989) High-sensitivity amino acid analysis by derivatization with o-phthaldialdehyde and 9-fluorenylmethyl chloroformate using fluorescence detection: applications in protein structure determination Anal Biochem 178:227-32.
12.Blundell G and Brydon WG. (1987) High performance liquid chromatography of plasma aminoacids using orthophthalaldehyde derivatisation. Clinica ChimicaActa 170:79-84.
13.Carmichael MJ, Clague MB, Keir MJ, Johnston IDA. (1980) Whole body protein turnover, synthesis and breakdown in patients with colorectal carcinoma. BrJSurg 67:736-9.
77
14.Clarke EF, Lewis AM, Waterhouse C. (1978) Periheral amino acid levels in patients with cancer Cancer 42:2909-13.
15.Cloete C (1984). Automated optimized high performance liquid chromatographic analysis of pre column o-phthalaldehyde amino acid derivatives. JLiq Chromatogr 7:1979-90.
16.Davey JF and Ersser RS. (1990) Amino acid analysis of phsiological fluids by high-performance liquid chromatography with phenylisothiocyanate derivatization and comparison with ion-exchange chromatography. J Chromatogr 528:9-23.
17.Davey JF and Ersser RS. (1990) Amino acid analysis of physiological fluids by high-performance liquid chromatography with phenylisothiocyanate derivatization and comparison with ion-exchange chromatography. J Chromatogr 528:9-23.
7^.Demers LM. (1992) New biochemical marker for bone disease. Clin Chem 38:2169-70.
19.DeWys WD, Begg C, Lavin PT el al. (1980) Prognostic effect ofweight loss prior to chemotherapy in cancer patients. Am JMed 69:491-7.
20.Deyl Z, Hyaneck J, Horakova M. (1986) Profiling of amino acids in body fluids and tissues by means of liquid chromatography. J Chromatogr 379:177-250.
V
78
1
21.Douglas RG and Shaw JHF. (1990) Metabolic effects of cancer. Br J Surg 77:246-54.
22.Dmevich D and Vary TC. (1993) Analysis of physiological amino acids using dansyl derivatization and reversed-phase liquid chromatography. J Chromatogr6l3:Ul-AA
23.Eijk HMHV, Heijden MAHVD, Berlo CLHV, Soeters PB. (1988) Fully automated liquid-chromatographic determination of amino acids. Clin Chem 34(12):2510-13.
24.Eijk HMHV, Rooyakkers DR, Deutz NEP. (1993) Rapid routine determination of amino acids in plasma by high-performance liquid chromatography with a 2-3 ^m Spherisorb ODS II column. J Chromatogr 620:143-48.
25.Einarsson S. (1985) Selective determination of secondary amino acids using precolumn derivatization with 9-fluorenylmethylchloroformate and reversed-phase high-performance liquid chromatography. J Chromatogr 348:213-20.
26.Einarsson S, Joseffson B, Lagerkvist S. (1983) Determination of amino acids with 9-fluorenylmethy chloroformate and reversed-phase high-perfomance liquid chromatography. J Chromatogr 282:609-18.
27.Ersser RS and Davey JF. (1991) Liquid chromatographic analysis of amino acids in physiological fluids: recent advances. MedLab Sciences 48:59-71.
Y
79
28.Fekkes D, Dalen AV, Edelman M, Voskuilen A. (1995) Validation of the determination of amino acids in plasma by high-performance liquid chromatography using automated pre-column derivatization witho-phthaldialdehyde. J Chromatogr 669:177-86.
29.Felig P, Owen OE, Warren J, Cahill GF. Amino acid metabolism during prolonged starvation. J Clin Invest 48:584-94.
30.Fleury MO, Ashley DV. (1983) High-performance liquid chromatographic analysis of amino acids in physiological fluids: on line precolumn derivatization with o-phthaldialdehyde. Anal Biochem 133:330-5.
31.Furst P,Pollack L, Graser TA, Godel H, Stehle P. (1990) Appraisal offour pre-column derivatization methods for the high-performance liquid chromatographic determination of free amino acids in biological materials. J ChromatogrA99.551-69.
32.Garcia Alvarez-Coque MC, Medina Hemandez MJ, Villanueva Camanas RM, Mongay Femandez C. (1989) Formation and instability of o-phthalaldehyde derivatives of amino acids. Anal Biochem 178:1-7.
55.Gehrke CW,Zumwalt RW, Kuo KC, eds. (1987) Amino acid analysis by gas liquid chromatograhpy. Florida: CRC Press.
V
80 I

34.Georgi G, Pietsch C, Sawatzki G. (1993) High-performance liquid chromatographic determination of amino acids in protein hydrolysates and in plasma using automated pre-column derivatization with o-phthaldialdehyde/2-mercaptoethanol. J Chromatogr 613:35-42
35.Goldsmith RF. (1986) HPLC of amino acids. In HPLC in the Clinical Laboratory, pp 113-7.
36.Grzywacz CM. (1994) Identification of proteinaceous binding media in paintings by amino acid analysis using 9-fluorenylmethyl chlorofonnate derivatization and reserved-phase high-performance liquid chromatography. J Chromatogr616:lll'^3.
37.Hare PE,St. John PA and Engel MH. (1985) Ion-exchange separation of amino acids, hi Chemistry and Biochemistry of the Amino Acids, (Barret GC, ed), pp 415-425. Chapman and Hall, London.
38.Hare E. (1996) Automatic multiple column amino acid analysis-the use of pressure elution in small bore ion-exchange columns. FedProc 25:709.
39.Hariharan M, Naga S, VanNoord T. (1993) Systematic approach to the development of plasma amino acid analysis by high-performance liquid chromatography with ultraviolet detection with precolumn derivatization using phenyl isothiocyanate. J Chromatogr 621:15-22.
Y
! 1
81 I 1

40.Harrison LE. (1996) Animal models of cancer cachexia. In Protein and amino acid metabolism in cancer cachexia, (Pisters PWT & Bretman MF, ed),pp 1-19. Springer, USA.
41.Haynes PA, Sheumack D, Kibby J,Redmond JW. (1991) Amino acid analysis using derivatization with 9-fluorenylmethyl chloroformate and reserved-phase high-performance liquid chromatography. J Chromatogr 540:177-85.
42.Hodgin JC, Howard PY, Ball DM, Cloete C, Jager LD. (1983) An automated device for In Situ pre-column derivatization and injection of amino acids for HPLC analysis. J ChromatogrScience 21:503-7.
43.Hodgin JC. (1979) The separation of pre-column o-phthalaldhyde derivatized amino acids by high performance liquid chromatography. J Liq Chromatogr 2(7):1047-59.
44.Hubbard RW, Chambers GC, Sanchez A. (1988) Amino acid analysis of plasma: studies in sample preparation. J Chromatogr 431:163-169.
45.Hogan DL, Kraemer KL, Isenberg 几(1982) The use of high performance liquid chromatography for quantitation of plasma amino acids in man. Anal Biochem 127:17-24.
46.Hughes GJ and Winterhalter KH. (1982) Amino acid analysis using standard high-performance liquid chromatography equipment. J Chromatogr 235:417-26.
V
82
47.Hyltander A, Drott C, Komer U, Sandstrom R,Lundholm K. (1991) Elevated energy expenditure in cancer patients with solid tumors. Eur J Cancer 27:9-15.
48.Illig KA, Maronian N, Peacock JL. (1992) Cancer cachexia is transmissible in plasma. JSurgRes 52:353-8.
49.Jeevanandam M, Horowitz GD, Lowry SF, Brennan MF. (1984) Cancer cachexia and protein metabolism. The Lancet June 30,1984:1423-6.
50.Komhuber ME, Balabanova S, Heiligensetzer, et al. (1991) Stability ofhuman blood serum aminoacids after storage at different pH and temperature conditions. Clin Chim Acta 197:189-200.
51.Kubota A, Meguid MM, Hitch DC. (1992) Amino acid profiles correlate diagnostically with organ site in three kinds of malignant tumours. Cancer 69(9):2343-8.
52.Lawson DH, Richmond A,Nixon DW, Rudman D. (1982) Metabolic approaches to cancer cachexia. Annu Rev Nutr 2:277-301.
53.Lazo PA. (1981) Tumour induction of host leucine starvation. FEBS Lett 135:229.
V
83

54.Lindroth P and Mopper K. (1979) High performance liquid chromatographic determination of subpicomole amounts of amino acids by precolumn fluorescence derivatization with o-phthaldialdhyde. Anal Chem 51(11):1667-74.
55.Liu Hua and Worthen HG. (1992) Measurement of free amino acid levels in ultrafiltrates of blood plasma by High performance liquid chromatography with automatic pre-column derivatization. J Chromatogr 579:215-24.
56.Malmer MF and Schroeder LA. (1990) Amino acid analysis by high-performance liquid chromatography with methanesulfonic acid hydrolysis and with 9-fluorenylmethychloroformate derivatization. J Chromatogr 514:227-39.
57.McCoy RW, AlkenRL, Pauls RE, et al. (1984) Results ofacooperative study comparing the precision of peak height and area measurements in liquid chromatography. J ChromatogrScience 22:425-31.
58.Miller EJ, Narkates AJ, Niemann MA. (1990) Amino acid analysis of collagen hydrolysates by reverse-phase high-performance liquid chromatography of 9-fluorenylmethyl chloroformate derivatives. Ana! Biochem 190:92-97.
59.Moller SE. (1993) Quantification of physiological amino acids by gradient ion-exchange high-performance liquid chromatography. J Chromatogr 613:223-30.
84
60.Moore S, Stein WH. (1951) Chromatography of amino acids on sulfonated polystyrene resins.JBio! Chem 192:663-81.
61.Naini AB, Dickerson JWT, Brown MM. (1988) Preoperative and postoperative levels of plasma protein and amino acid in esophageal and lung cancer patients. Cancer 62:355-60.
62.Nelson KA, Walsh D, Sheehan FA. (1994) The cancer Anorexia-Cachexia Syndrome.JC//>2 Oncology 12(1):213-25.
63.Norton JA, Gorschboth CM, Wesley RA, Burt ME , BrennanMF. (1985) Fasting plasma amino acid levels in cancer patients. Cancer 56:1181-6
64.Parvy P, Bardet J, Rabier D, Gasquet M,Kamoun P. (1993) Intra- and interlaboratory quality control for assay of amino acids in biological fluids: 14 years of the French experience. Clin Chem 39(9):1831-36.
65.Patchett ML, Monk CR, Daniel RM, Morgan HW. (1988) Determination of agmatine, arginine, citrulline and ornithine by reversed-phase liquid chromatography using automated pre-column derivatization with o-phthalaldehyde. J Chromatogr 425:269-76.
66.Perrett D. (1985) Liquid chromatography of amino acids and their derivatives. In Chemistry and Biochemistry of the Amino Acids’ (Barret GC, ed), pp 415-425. Chapman and Hall, London.
V
85
67.Pfeifer RF, Hill DW. (1983) High-performance liquid chromatography of amino acids: Ion-exchange and reversed-phase strategies. In Advances in Chromatography vol 22, (Giddings JC et al., eds), pp 37-69. Marcel Dekker, New York.
68.Pisters PWT and Brennan MF. (1990) Amino acid metabolism in human cancer cachexia. Annu Rev Nur 10:107-32.
69.Pisters PWT and Pearlstone DB. (1993) Protein and amino acid metabolism in cancer cachexia: Investigative techniques and therapeutic interventions. Critical Reviews in Clin Lab Sciences 30(3):223-272.
70.Pizer LI and Regan JD. (1972) Basis for the serine requirement in leukaemic and normal human leukocytes. Reduced levels of the enzymes in the phoshorylated pathway. JNatl Cancer Inst. 48:1897.
71.Schmidt CK and McClain. (1987) Separation strategies for with o-phthalaldehyde-mercaptoethanol derivatives of amino acids for reversed-phase high-performance liquid chromatography. J Chromatogr 419:1-16.
72.Sherwood RA, Titheradge AC, Richards DA. (1990) Measurement ofplasma and urine amino acids by high-performance liquid chromatography with electrochemical detection using phenylisothiocyanate derivatization. J Chromatogr 528:293-303.
V
86
73.Slocum RH and Cummings JG. (1991) Amino acid analysis of physiological samples. In Techniques in Diagnostic Human Biochemical Genetics:A Laboratory Manual 87-126.
74.Smith RJ, Panico KA. (1985) Automated analysis of o-phthalaldehyde derivatives of amino acids in physiological fluids by reverse phase high performance liquid chromatography. JLiq Chromatogr 8:1783-95.
75.Speckman DH, Stein WH, Moore S. (1958) Automatic recording apparatus for use in the chromatography of amino acids. Anal Chem 30:1190-206.
76.Smith SR, Pozefsky F, Chhetri MK. (1974) Nitrogen and amino acid metabolism in adults with protein-calorie malnutrition. Metabolism 23:603-18.
77.Stein TP. (1978) Cachexia, gluconeogenesis and progressive weight loss in cancer patients. J Theoret Biol 73:51.
78.Teerlink T, Leeuwen PAMV, Houdijk A. (1994) Plasma amino acids determined by liquid chromatography within 17 minutes. Clin Chem 40(2):245-49.
79.Tisdale MJ. (1980) Effect of methionine replacement by homo-cysteine on the growth of cells. Cell Biol Ent Rep 4:563.
80.Tisdale NJ. (1991) Cancer cachexia. Cancer 63:337-42. V
87
81.Turaell DC and Cooper JDH. (1982) Rapid assay for amino acids in serum or urine by pre-column derivatization and reversed-liquid chromatography. Clin Chem 28(3):527-31.
82.Udenfriend S, Stein S,Bohlen P, et al. (1972) Fluorescamine: A reagent for assay of amino acids, peptides, proteins, and primary amines in the picomole range. Science 178:871-872.
83.Ukida M, Schafer K, Bode JC. (1981) Effect of storage at -20°C on the concentration of amino acids in plasma. J Clin Chem Clin Biochem 19:1193-5.
84.Uribarri J, Carroll H. (1991) Common metabolic disturbances in patients with cancer. In Neoplastic Diseases: Fundamentals of Clinical Oncology, (Rosenthal CJ, ed), pp 99-107. Precept Press, Chicago.
85.Umagat H, Kucera P and Wen LF. (1982) Total amino acid analysis using pre-column fluorescence derivatization. Chrom 14,631.
86.Walker V and Mills GA. (1995) Quantitative methods for amino acid analysis in biological fluids. Ann Clin Biochem 32:28-57.
87.Wiedmeiser VT, Portefield SP and Hendrich CE. (1982) Quantitation ofDns-amino acids from body tissues and fluids using high performance liquid chromatography. J Chrom 231:410-17.
V
88
88.Worthen HG and Liu H. (1992) Automatic pre-colunm derivatization and reserved-phase high-performance liquid chromatography of primary and secondary amino acids in plasma with photo-diode array and fluorescence detection. JLiquid Chromatogr 15(18):3323-41.
89.Wu JT (1991) Screening for inbom errors of amino acid metabolism. Annals Clin Lab Science 21(2):123-42.
90.Zhang PC, Pang CP. (1992) Plasma amino acid patterns in cancer. Clin Chem 38:1198-9.
V
89

^ j g j | ^ W W ^ ^ ^ ^ ^ ^ . : 7 , ^ ^ ^ ^ ^ ^ ^ ^ ^ T r ^ 7 ^ � ’ • : 勢 ! ^ ^ “ •'"' � 。 : , -
•:〜 •广-.-.
•
. � .. .•• . . • 叙-.’. .
r � _ . . • 葡 飄
• . . 、 _ 藝 , : . . <次。‘二令„:取 ‘ � - ‘ i .¾' ‘‘ ^
• . 、;,梦?一‘义/
‘;<:•; ^ • . r�; \ ‘々 、 一 • •• '>-^ -* %,- •• ‘ i- •• .M*:-* '•- - • " - . ’ .
. , T ' “ . <jvi":..4 . •- .. ..,\.-
: / ” . t、% ...
‘ . : , A ^ *V>' ., • i "‘ rti • ^ . ..、- .,-.、- ••'•-. • . . ,, . •
.. • -••['.- '' ' ) - , :%. • •‘ 、.•.
• •'. . . :• • I . . . .
;.-. 、� ‘ ‘ . . . . . •' k
_ - ‘ . . ,
. . . . . . ‘ :•.:.麵:.::..,1
.

C U H K L i b r a r i e s
mmwmii D D 3 7 D S m i